Buckling of geometrically confined shells
Abstract
We study the periodic buckling patterns that emerge when elastic shells are subjected to geometric confinement. Residual swelling provides access to range of shapes (saddles, rolled sheets, cylinders, and spherical sections) which vary in their extrinsic and intrinsic curvatures. Our experimental and numerical data show that when these structures are radially confined, a single geometric parameter – the ratio of the total shell radius to the amount of unconstrained material – predicts the number of lobes formed. We then generalize our model to account for a relaxation of the in-plane constraint by interpreting this parameter as an effective foundation stiffness. Experimentally, we show that reducing the transverse confinement of saddles causes the lobe number to decrease according to our effective stiffness model. Hence, one geometric parameter captures the wave number through a wide range of radial and transverse confinement, connecting the shell shape to the shape of the boundary that confines it. We expect these results to be relevant for an expanse of shell shapes, and thus apply to the design of shape–shifting materials and the swelling and growth of soft structures.
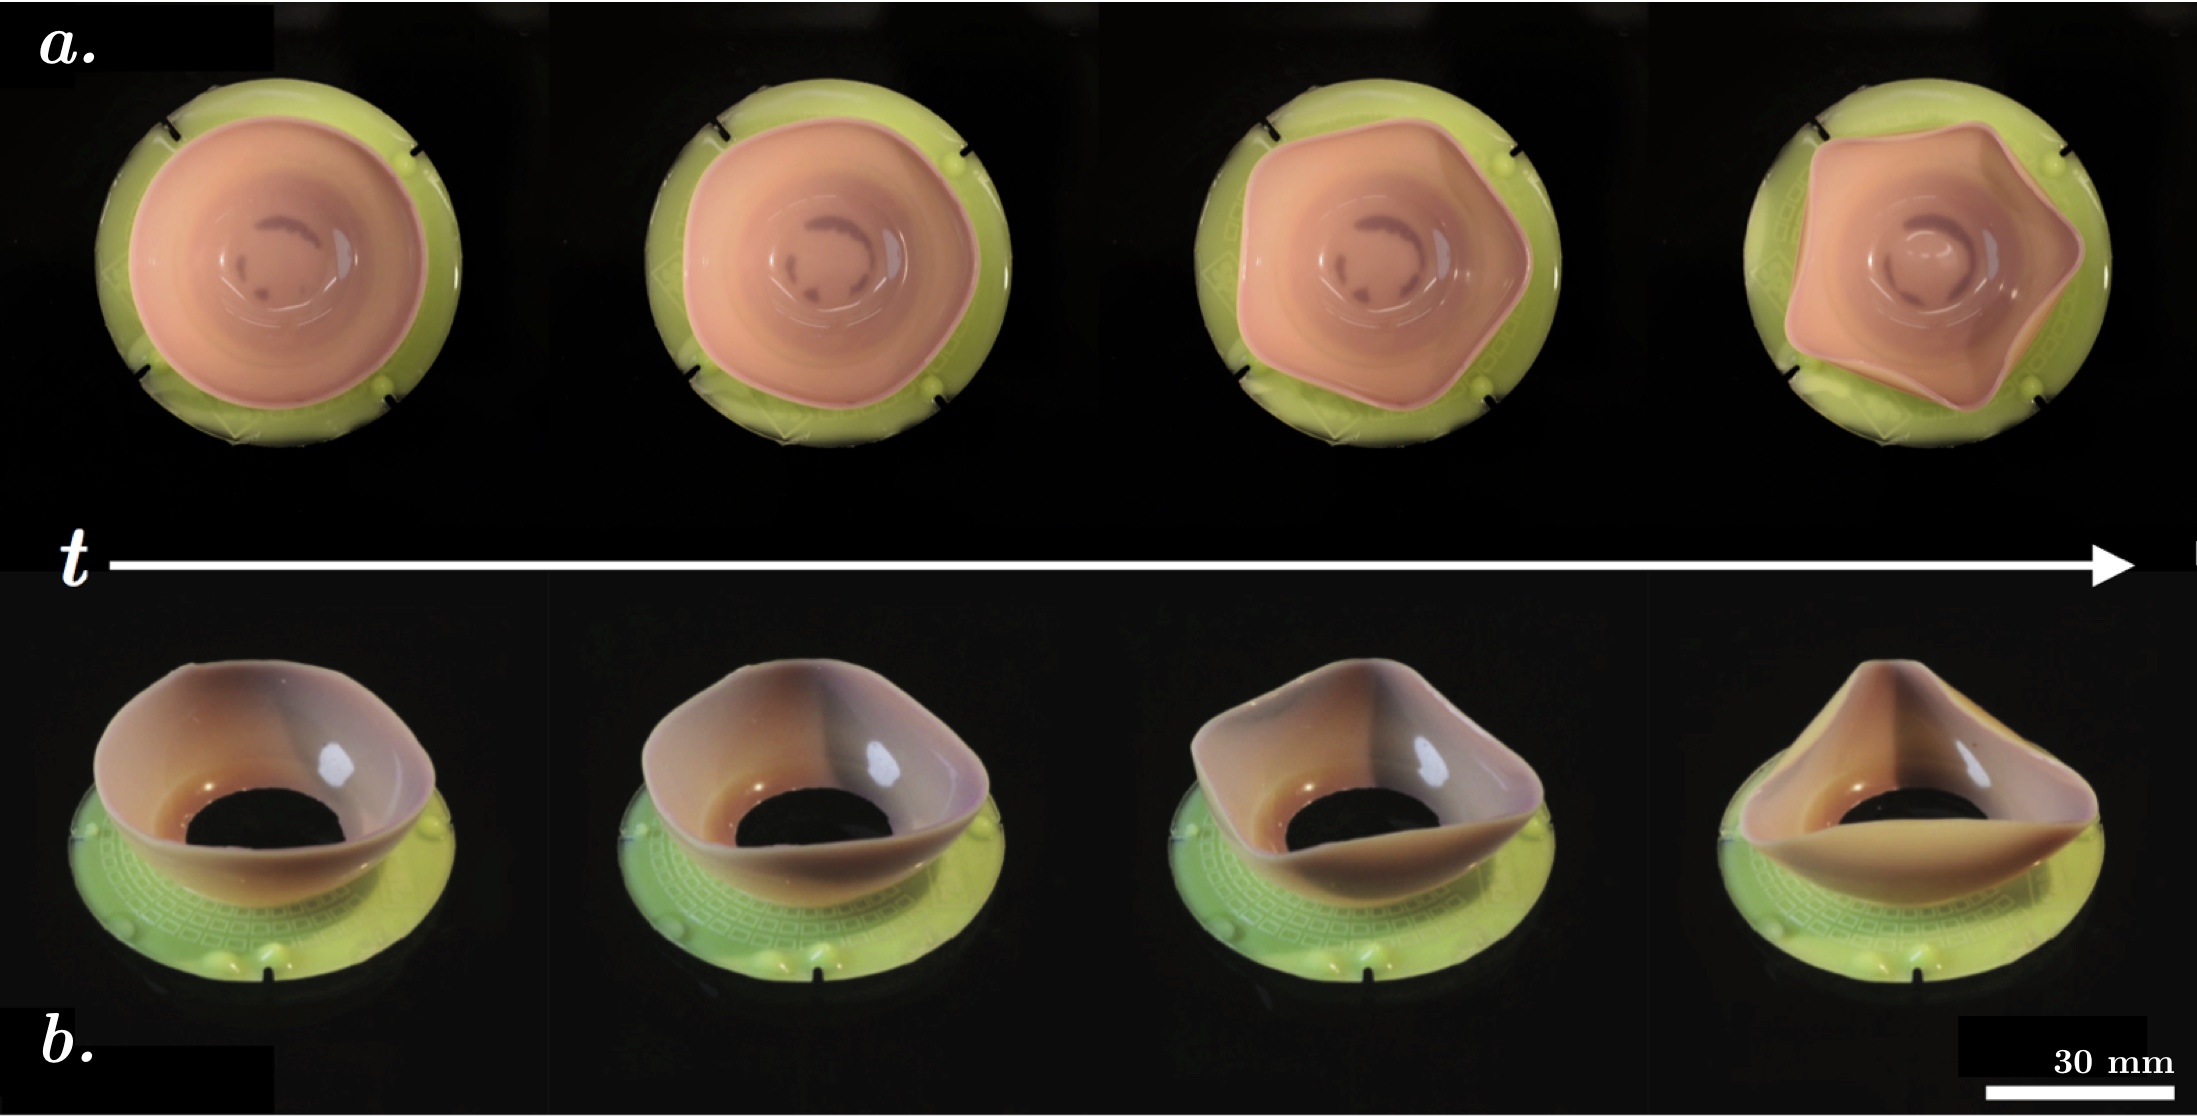
Shells are notorious for their nonlinear response to mechanical loading, and subtle changes to how they are held, or constrained, can have profound affects on how they deform. Confinement of soft shells can induce dramatic deformations as illustrated in Fig. 1, where radial confinement is increased from left to right. These mechanics are relevant to soft biological tissues, as their morphology often depends on a combination of mechanical forces imparted along their boundaries, and non–mechanical forces that drive growth or swelling. Confinement of soft tissues can result in the wrinkling and scar formation of surgical wounds Cerda (2005), and these changes in shape or morphology are not purely cosmetic. For example, during the embryogenesis of the ciliary body of an avian eye, differential growth induces wrinkles that radiate outward from the retina Bard and Bard (1992), a stiff region that resists deformation. Capillary blood vessels form in the valleys of these wrinkles, while molecules that promote neural cell adhesion fail to express in the regions where these epithelial tissues wrinkle Bard and Ross (1982, 1982). These effects are entirely mechanical, as evidenced by experiments that induced wrinkles in the chick eyes by swelling them in ethanol Bard and Bard (1992); Bard and Ross (1982). Similar studies on the differential swelling and growth of artificial tumors Dervaux and Ben Amar (2011); Dervaux et al. (2011) and biofilmsBen Amar and Wu (2014); Dervaux et al. (2014) described the role of confinement and the mechanics of these circumferential wrinkles in much greater detail. Radial confinement occurring within airways and arteries Goriely (2017), as seen in buckling and folding of mucous membranes, can cause the collapse or closure of the oesophagus Yang et al. (2007), blood vessels Lee and Chien (1979), and gastrointestinal tract Lu et al. (2005).
Beyond these biological systems, the ability to prescribe and control the shape of objects has ushered in an age of designer materials Reis et al. (2015). By dictating the volumetric strain in specific regions of soft elastomers, researchers have been able to morph 2D sheets into 3D shells Klein et al. (2007); Holmes et al. (2011); Kim et al. (2012), with features spanning multiple length scales Dervaux and Amar (2012); Pandey and Holmes (2013). Differential swelling, sometimes accomplished by using the residual polymer chains left in portions of cured elastomers, has been used to fabricate helical ribbons Wu et al. (2013), rolled sheets Pezzulla et al. (2016), saddles Pezzulla et al. (2015), pinched spheres Pezzulla et al. (2018), and wavy strips and discs Mora and Boudaoud (2006); DuPont et al. (2010); Barros et al. (2012). Even for free, unconstrained plates and shells the shape selection process is non–trivial. The shapes that result from differential swelling can be determined by examining how swelling alters the metric tensor of the middle surface of the plate, an approach described by the so–called theory of unconstrained non–Euclidean plates Efrati et al. (2009). When swelling only imparts a local curvature change along the middle surface, as is the case for the residual swelling of bilayer plates and shells, the non–mechanical swelling process can be cast as a mechanical stimulus which alters the natural curvature of the shell Pezzulla et al. (2018), and the stability of these structures can be evaluated using techniques common to applied mechanics. The inverse problem – knowing a desired shape and searching for the correct initial conditions necessary to achieve it – is a problem that has received far less attention, but will likely be more desirable. Work by Dias et al. demonstrated how to find the metric for a variety of axisymmetric shapes Dias et al. (2011), while more recent work has shown how to find the metric for a wide range of shapes, including a human face, when a negative curvature can be prescribed at any point van Rees et al. (2017).
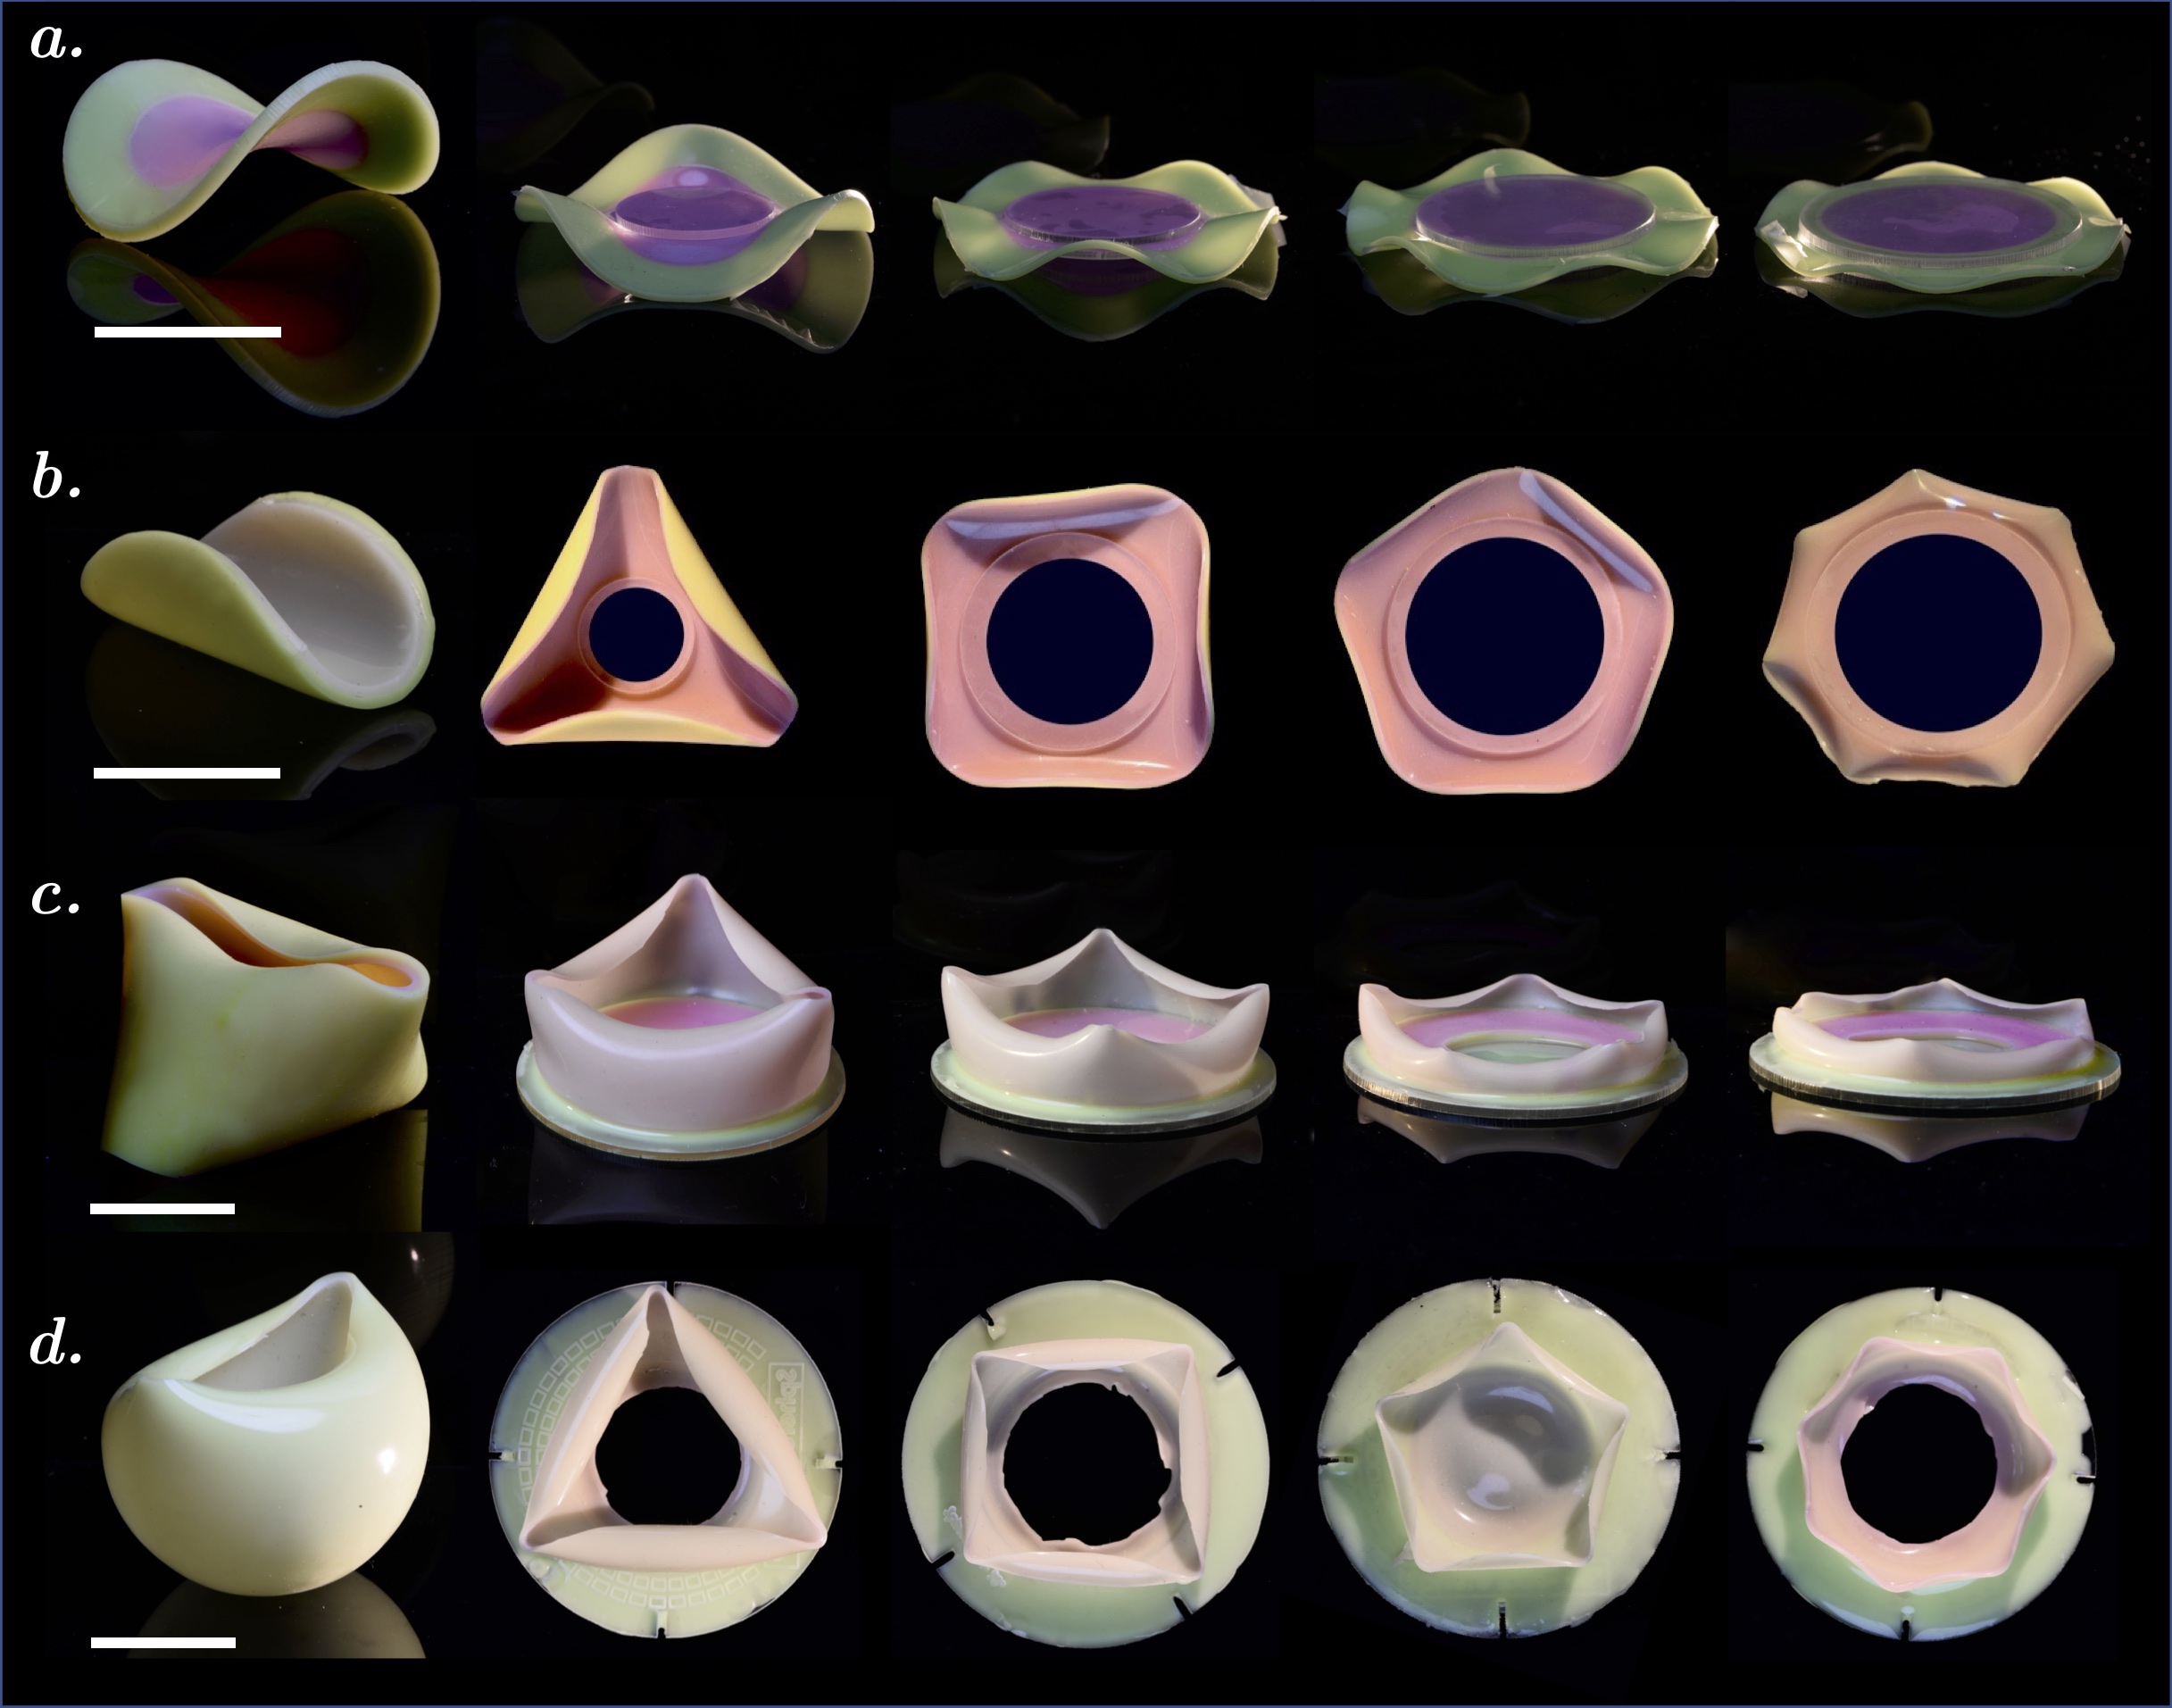
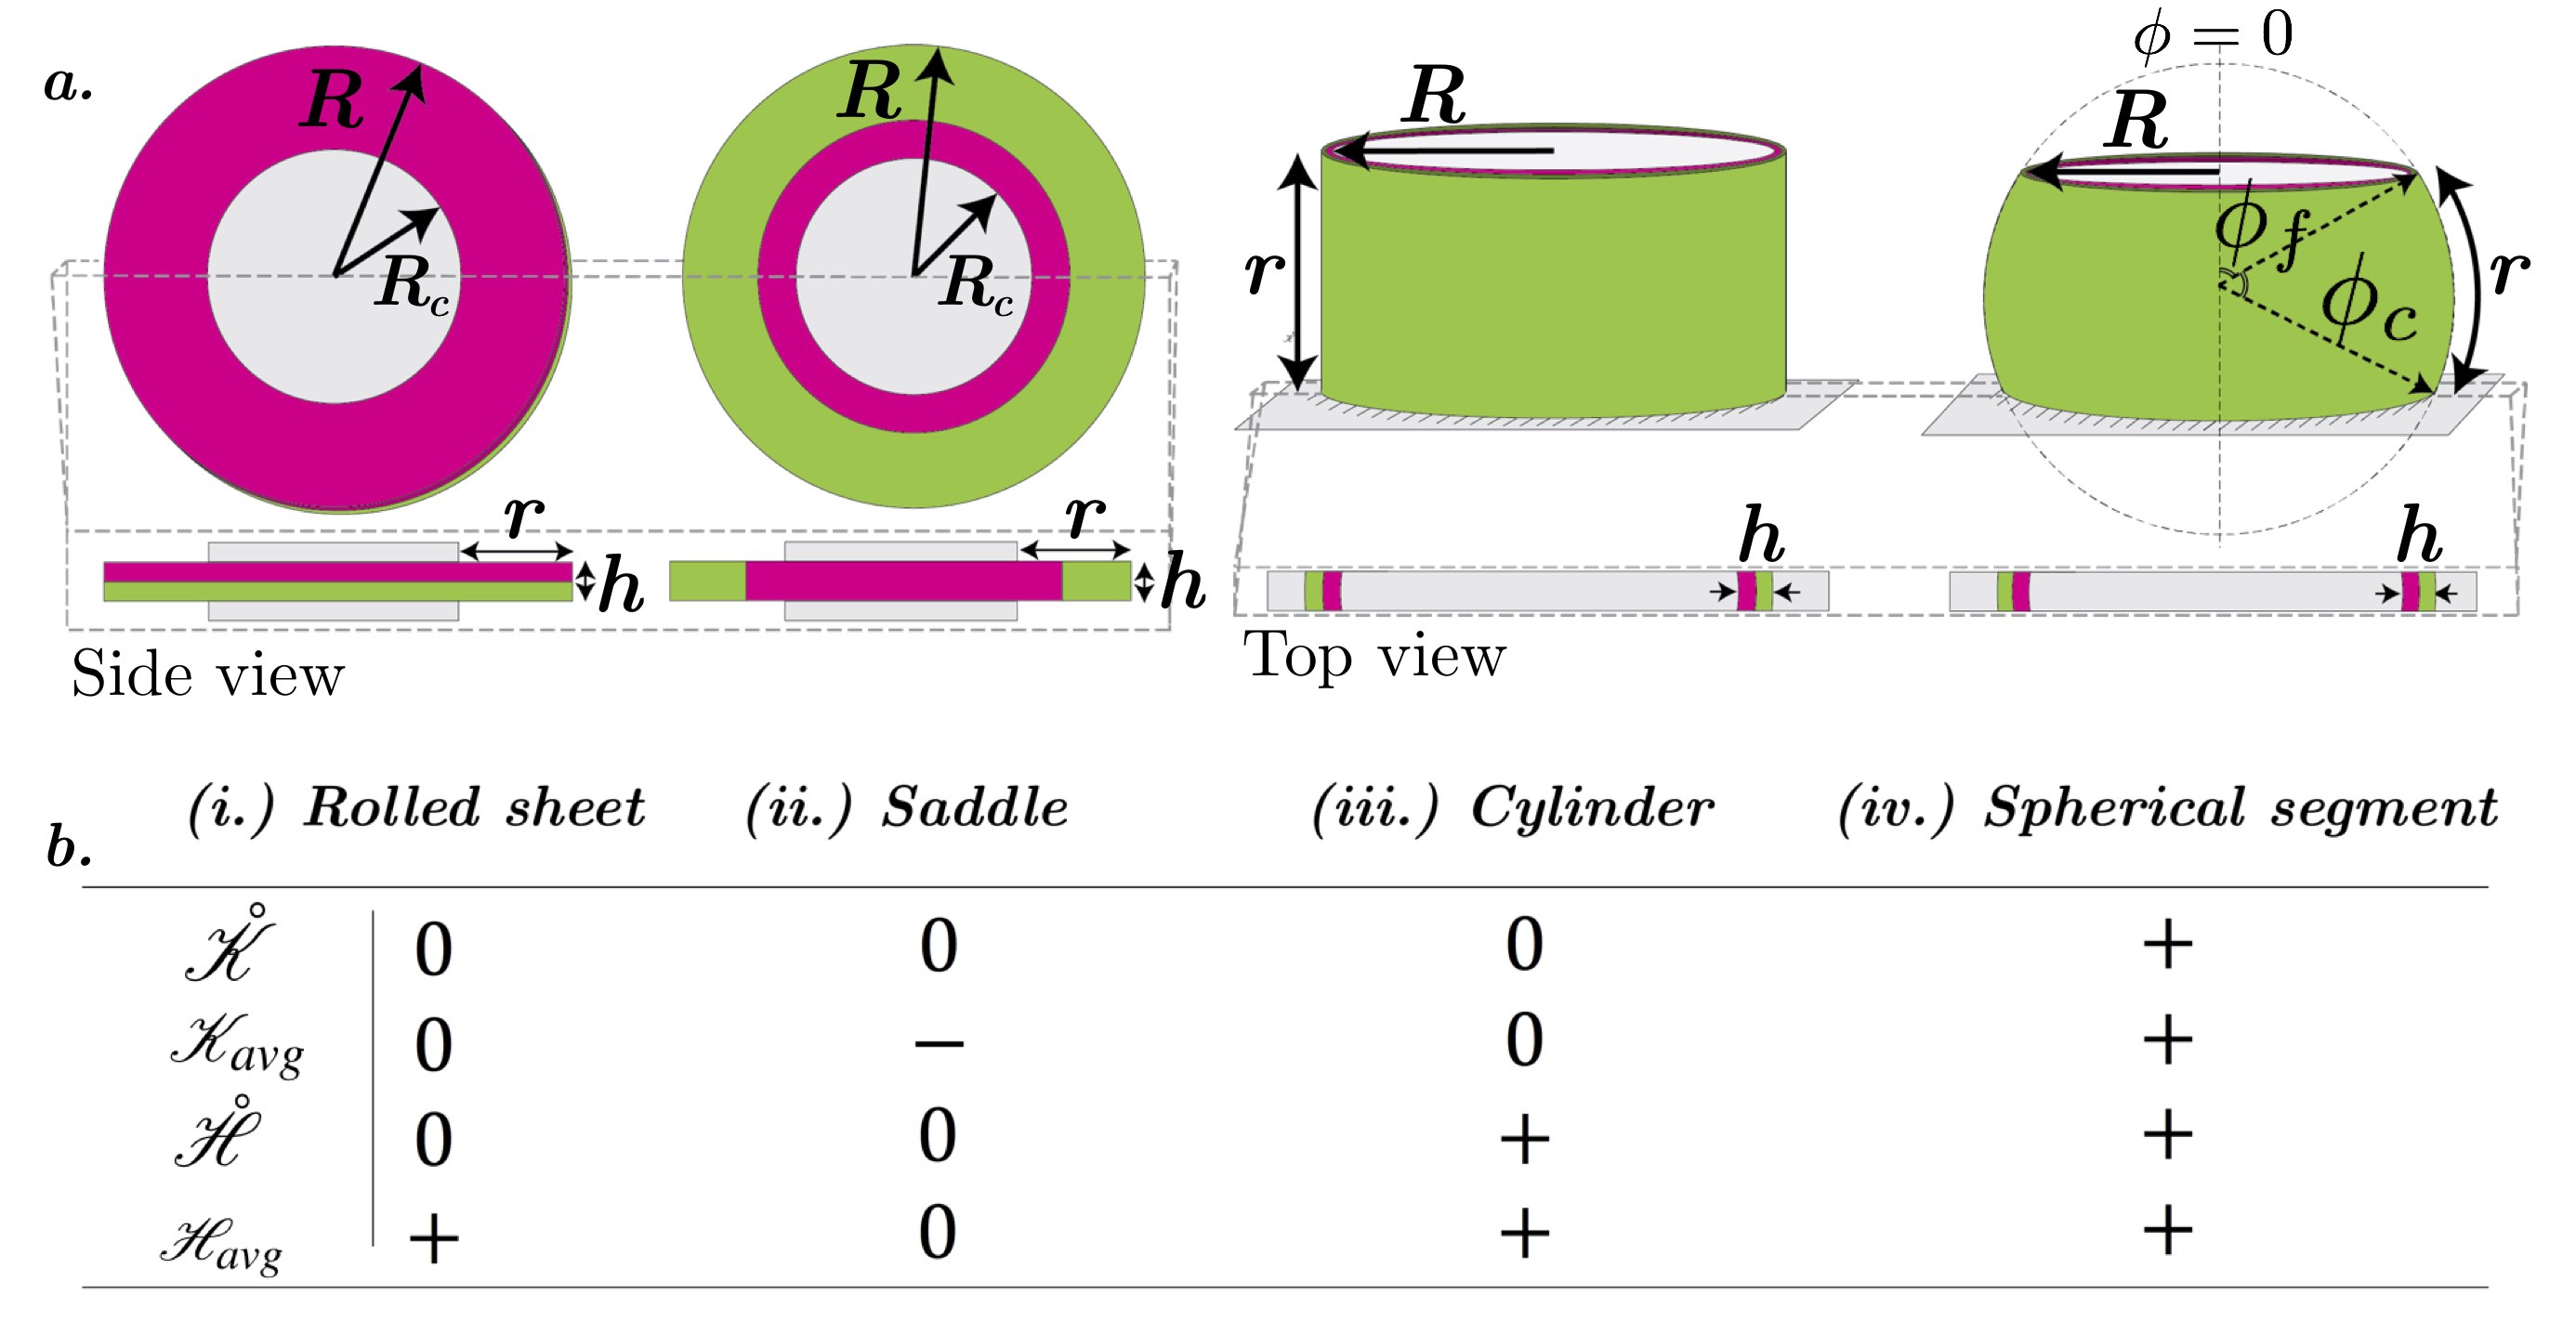
In the effort to understand and control shape change in soft and thin structures, the interplay between intrinsic geometry and geometric constraints is still not well understood. Confining a simple 1D object, i.e. an elastica, within a rectangular box is a nontrivial problem, in part due to the unknown and evolving location of the point of contact between the elastica and the walls Domokos and Royce (1997); Holmes et al. (1999); Roman and Pocheau (1999, 2002); Pocheau and Roman (2004). Similar problems emerge in the packing of thin sheets, for instance pushing a plate through a ring causes it to form a developable cone, or d–cone Ben Amar and Pomeau (1997); Cerda and Mahadevan (1998); Chaïeb et al. (1998); Cerda et al. (1999); Chaieb (2000); Cerda and Mahadevan (2005), and in the confinement of a thin plate between two hemispheres Hure et al. (2012) or onto a droplet of water Paulsen et al. (2015). Confinement of intrinsically curved shells has received less attention, with an exception being the behavior of shells under indentation Vaziri and Mahadevan (2008), including a hybrid experimental-numerical study of the response of positively curved shells to indenters of varied geometries Nasto et al. (2013). In this work, we present a primarily experimental study on how geometric confinement facilitates pattern formation in structures with intrinsic curvature. We consider shells with various mean and Gaussian curvatures under a range of radial confinement, and we examine the combined role of radial and transverse confinement on negatively curved shells, or saddles. We focus our study on four categories of shapes, shown in Fig. 1 and schematically in Fig. 2a: saddles, rolled sheets, cylinders, and spherical segments. Each is initially axisymmetric and exhibits periodic postbuckling patterns when subjected to geometric constraints. These geometries were chosen to access a range of average Gaussian and mean curvatures in their reference (, ) and deformed (, ) configurations.
The range of structures studied is outlined in Fig. 2b. Of the four shapes we study, two start out as flat plates – one of these changes its average mean curvature, and the other changes its average Gaussian curvature after fabrication. Our study omits spherical caps, which have been well-characterized, e.g. in Ref.Nasto et al. (2013).
These shells are relatively thick as compared to recent work on thin film confinement Paulsen et al. (2015); Vella and Davidovitch (2018); Paulsen (2018), and we will show that the characteristic pattern of deformation can be described by a single geometric parameter that appears to be independent of shell thickness in this regime.
I Radial Confinement
Each of the unconstrained, residually stressed shapes are shown in the leftmost column of Fig. 1. We begin by constraining the rolled sheets and saddles in the radial direction by clamping the shells between two rigid acrylic sheets of radius . In Fig. 1a&b, we increase from left to right while keeping the shell radius and thickness constant, and we see that the number of lobes , or wavenumber, increases. This wavenumber appears to be insensitive to changes in thickness in the range of we considered (Fig. 3a), – thicker shells behave more like 3D bodies, while thinner shells made from these materials (see: Supplemental Information) deform significantly under gravity. Instead, it appears that the wavenumber is inversely proportional to the length of material that is unconstrained, i.e. .

It is typical in wrinkling problems to expect the wrinkle wavelength to be proportional to a balance of the bending rigidity to the substrate, or foundation rigidity Cerda and Mahadevan (2005), with . The bending rigidity appears in the bending energy of the shell, which we assume to be decoupled from the stretching energy, and is known to scale as , where is curvature, and is the area element. The bending energy penalizes high curvatures, so from the perspective of the elastic energy, long wavelengths are preferable. The question in regard to these constrained shells is: what contributes to the foundation rigidity? We know that the strain energy of the foundation resisting deformation consists of a foundation stiffness that penalizes large amplitudes of deformation , meaning that short wavelengths are preferable. Since in this thickness regime the shell thickness does not appear to play a dominant role in setting the wavelength, or wavenumber, of these constrained shells, we expect that any balance between bending rigidity and foundation rigidity should be independent of thickness to leading order. We hypothesize that the free length of the shell can be considered a series of cantilevers of length , clamped at the the constraint, and bending with an unknown deflection at the free end. In this configuration, the cantilevers that are “cut” from the constrained shell have a bending stiffness of . In this configuration, the strain energy of the foundation is given by:
| (1) |
We assume that the wrinkle curvature will scale with the amplitude and wavelength as , and that for simplicity the unconstrained area of the shell will scale as , such that
| (2) |
Balancing the two energies in (2) and (1) gives . With , and defining , we arrive at a scaling of the wavenumber as a function of the unconstrained, or free length of the shell
| (3) |
In Fig. 3b, we plot experimentally and numerically obtained wavenumbers as a function , which is for the shells that initially started as flat plates (see Supplemental Information for details on fabrication and simulations). When the constraint the dimensionless length , and experiments on unconstrained shells confirm that (Fig. 1), suggesting that for rolled sheets and saddles equation 3 should be modified to . This scaling is plotted as a solid line on Fig. 3b, with a slope of 1.72 found via linear regression. We would expect the slope to be of if the scaling is valid, and these results suggest that our approximation of the foundation energy was reasonable.
We now turn our attention to shells with initially nonzero mean and Gaussian curvatures. Physically, the scaling from equation 3 suggests that the wavenumber will increase linearly as the free, unconstrained length of the shell decreases. For the cylinders and spherical segments constrained at their base, the free length that decreases from left to right on Fig. 1c&d is the arclength of material from the clamped base to the shell opening, and similar to the rolled sheets and saddles, as this free length is decreased the wavenumber increases. Therefore, we anticipate that equation 3 will also capture the wavenumber of these constrained shells, provided the appropriate limits on and are met, where is for shells that have are initially curved. Here, the unconstrained shell corresponds to , or , which is analogous to the two lobe deformation (i.e. ) observed with a “pinch in a pipe” Mahadevan et al. (2007). This suggests that for cylinders and spherical segments, we expect that equation 3 should be modified to . In Fig. 3c, we plot experimentally and numerically obtained wavenumbers as a function for cylinders and spherical segments. The scaling is plotted on Fig. 3c, with a slope of 1.50 found via linear regression. These results seem to be in good agreement with this reduced order model, suggesting that the wavenumber of a wide range of constrained shells can be characterized with a dimensionless parameter corresponding to the free length of the shell.
II Transverse confinement
We will now relax the radial confinement to investigate shell behavior under varying amounts of transverse confinement. We focus primarily on an experimental analysis of saddles, because to our knowledge there are only limited examples of the transverse confinement of saddles in the literature, and the experiments on saddles are the most practically feasible out of the structures discussed in section I. We constrain the shells in the transverse direction with quasi-static, displacement-controlled tests in which a saddle is compressed between pairs of acrylic plates of radius . Initially, the distance between the top and bottom plates equals the saddle’s thickness, i.e. (Fig.4a&b,i.), which represents the limit discussed in Section I.
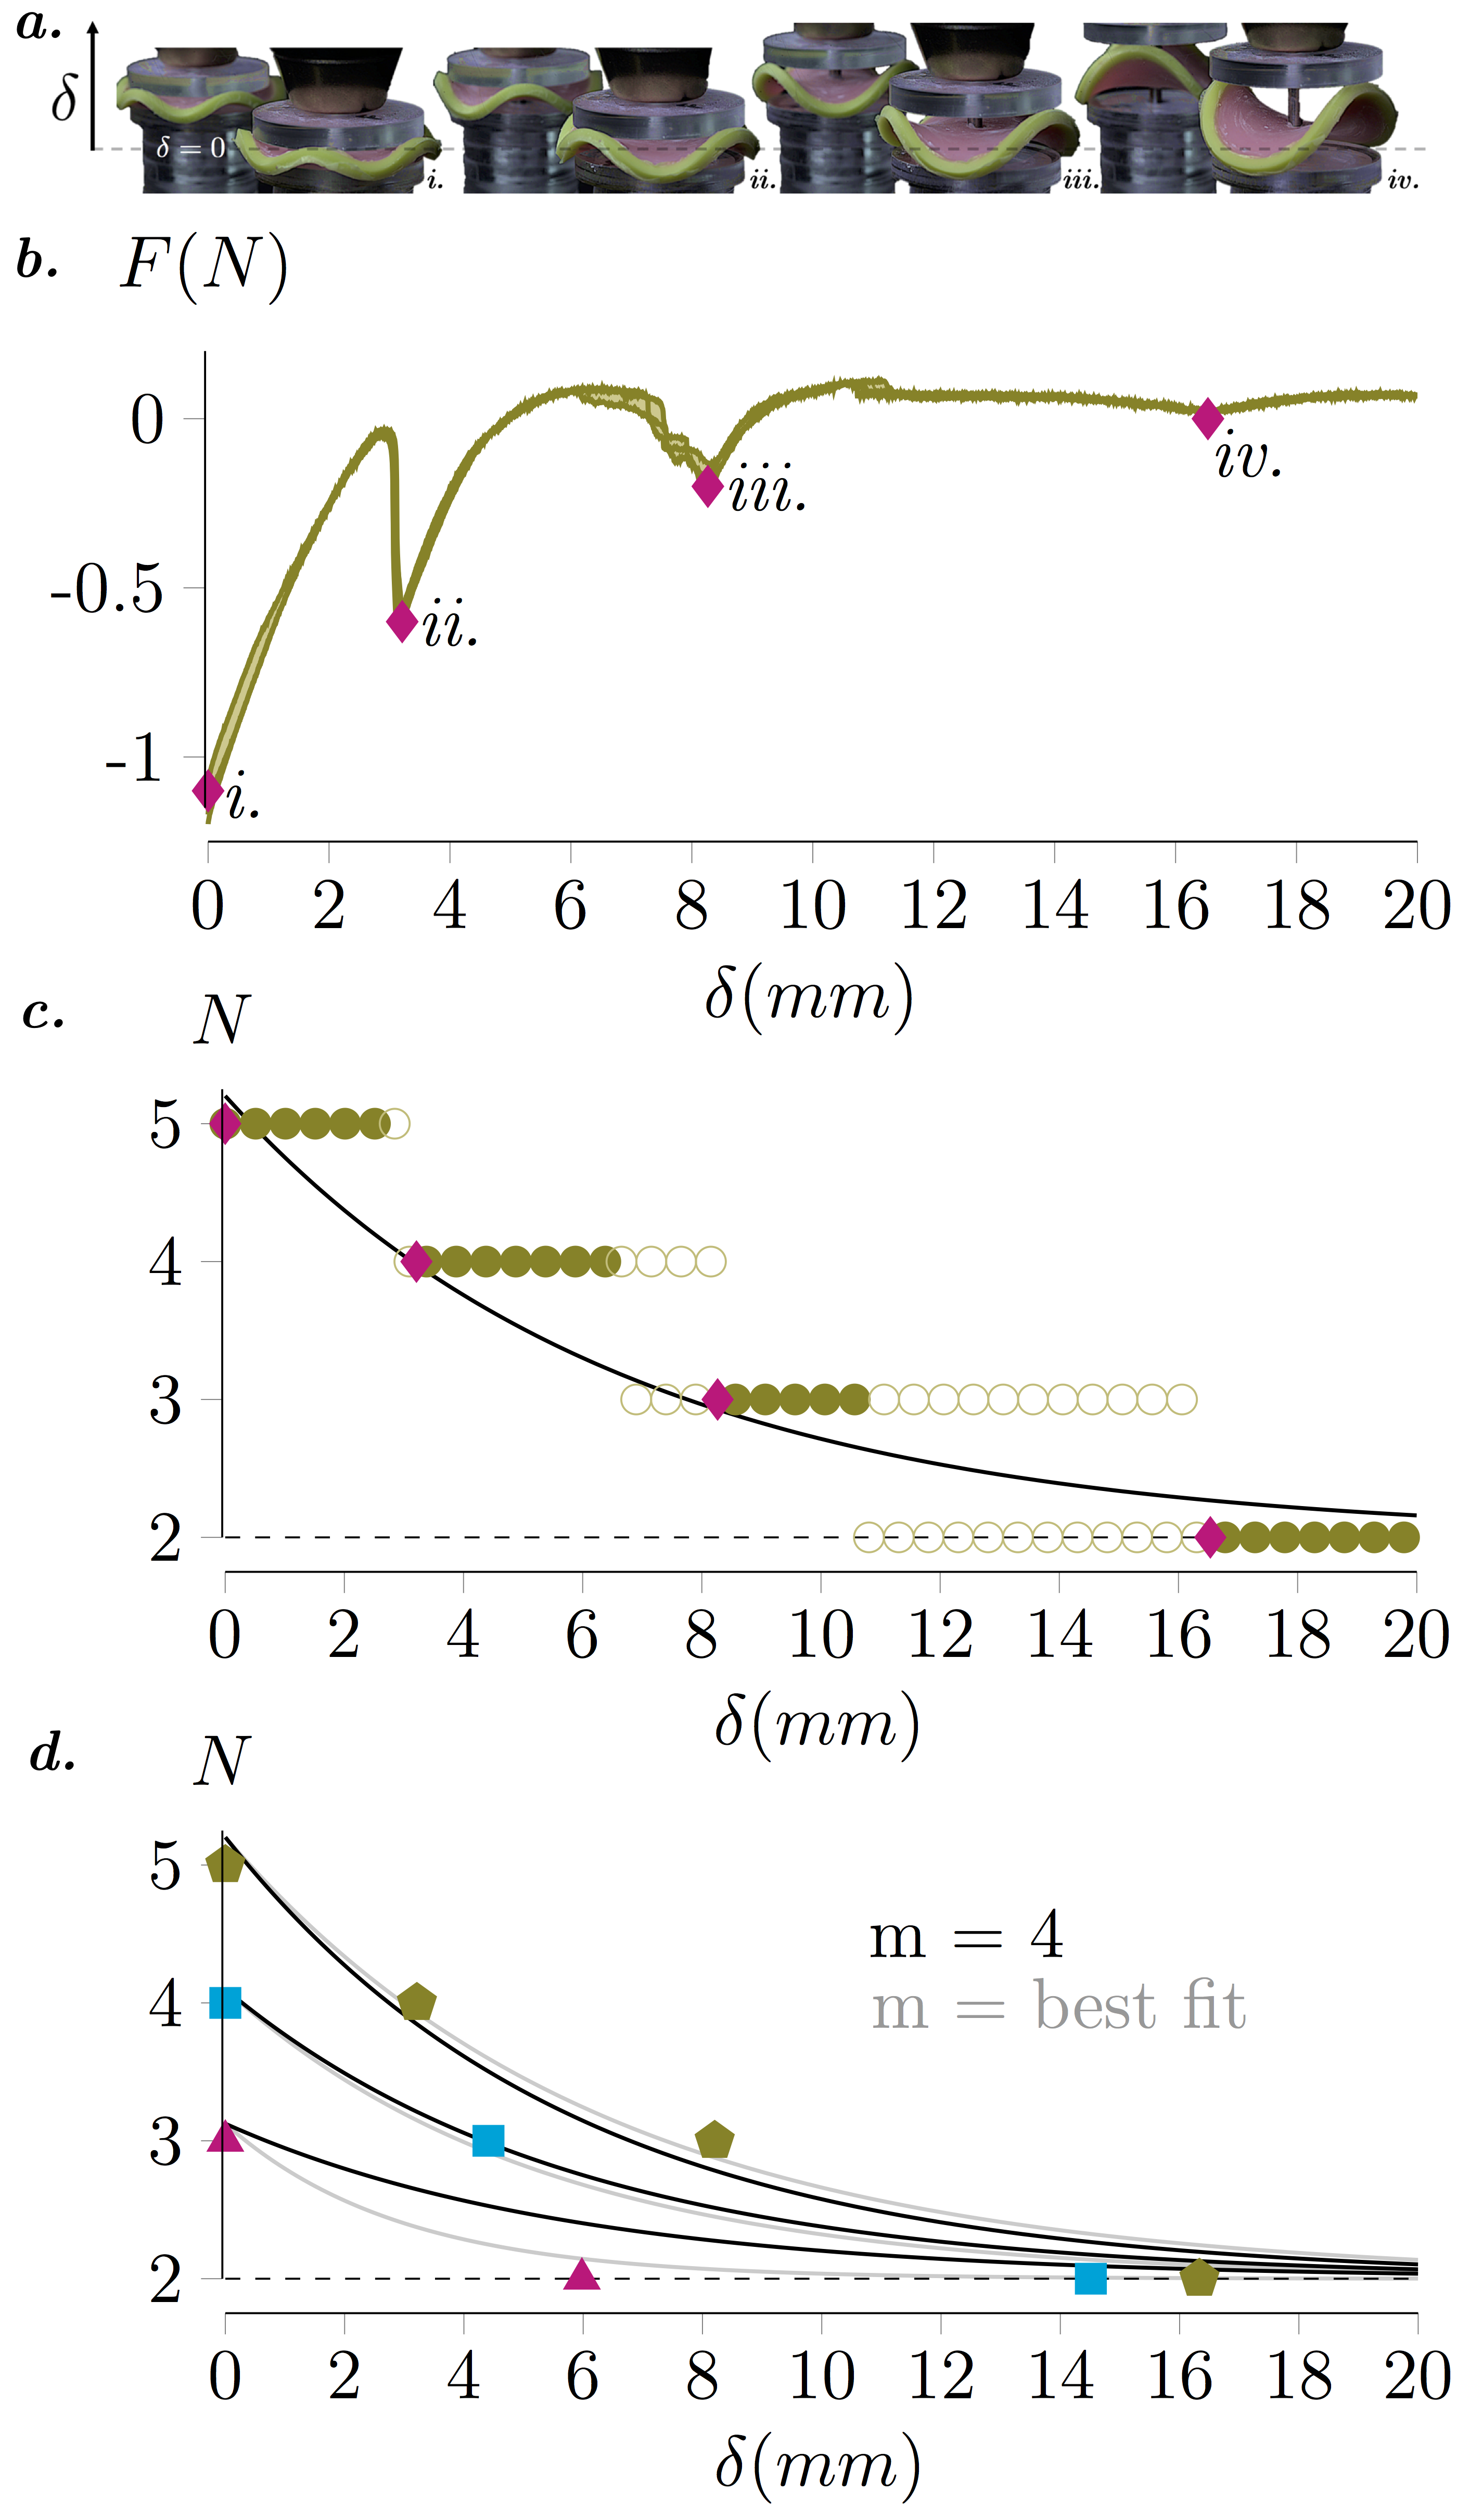
As we separate the distance between the two plates by an amount , there is a non-monotonic decrease in the applied compressive load, and the number of lobes decreases, as shown in Fig. 4a, (a more detailed experimental protocol is discussed in the Supplemental Information). The decrease in the compressive load is nearly linear for , and then reaches a minimum when one point of contact between the acrylic plate and the saddle is lost, thus beginning the mode shape transition from to lobes. The load immediately increases, and once the saddle has reaches (asymmetric) lobes (Fig.4a&b,ii.) the load once again decreases. When a new symmetric shape is reached at lobes, the slope of the force-displacement curve decreases but remains positive, and the process repeats until , , and there are lobes (Fig.4a&b,iv.). The slope of the force-displacement curves through these transitions appears to gradually decrease as decreases. Fig. 4b shows these trends in a force-displacement curve for a representative sample that achieves a maximum of lobes at .
We now aim to provide some mechanistic insight as to the lobe transitions from to for saddles as the transverse constraint is reduced. Here, we know the two limits: (1.) as we expect that , and (2.) as we expect that as given by equation 3. The first limit can be simplified, because the sheet will be unconstrained once is larger than the amplitude of the shell’s lobes, i.e. when . In these experiments, while in principle is fixed, in effect the free length of the shell may be approximated as being a function of , i.e. , with from section I. As an ansatz for that meets these two limits, we chose a logistic function in the form
| (4) |
where is an unknown constant that describes how quickly the unconstrained length will transition between and . Substituting this ansatz into equations and for , we can solve for . Following some algebra, we find
| (5) |
which reduces to equation 3 for plates when . In Fig. 4c, we plot the experimentally observed wavenumber as a function of . The transition process is highly nonlinear, and so we note the transition between two wavenumbers with open symbols, while highlighting the transition points from the local minima in the force-displacement curve as filled diamonds. Equation 5 is plotted as a solid black curve, with chosen as a best fit parameter to the transition points. Although is effectively a fitting parameter, we anticipate that it will depend on the bending rigidity of the saddle. We have not taken into account how the magnitude of the saddle’s Gaussian curvature, which will be related to the amplitude of the lobes, nor the shell thickness affect the transition points, however we expect that will be a function of these parameters. Further testing, in particular numerics, will help explain the contribution of and to the transition between mode numbers. Still, we note that for the samples we tests, using captures the transition points for shells with , , and (Fig. 4d). Choosing the best fit values of for each sample (, , and ) changes the critical for observing lobe transitions, but qualitatively provides similar values. In general, the form of (5) clarifies the relative contributions of transverse () and radial () confinement. At low values, radial effects dominate. As the wave number depends on exponentially, however, the effects of reduced transverse confinement quickly take over with increasing .
III Conclusions
In this work, we explored geometry’s fundamental role in the periodic buckling patterns that emerge in confined shells. We studied shells covering a range of Gaussian and mean curvatures, accessible via residual swelling. We first saw that one simple geometric parameter, , which relates the overall shell radius to the amount of unconfined material, predicts the number of wrinkles () a radially confined shell will adopt. Then for negatively curved saddles, we reduced the radial constraint by varying transverse confinement and measured the transition points between wavenumbers. We observed that decreasing the amount of confinement, whether in-the-plane or vertically, can be interpreted as a reduction in stiffness to the free region of the shell. In a low-stiffness regime, lower buckling modes are energetically preferable. This interpretation allowed us to generalize to include our range of transverse confinement. Thus, the model given by relation (5) captures a wide range of bidirectional confinement.
There is much to be done in terms of more rigorously understanding why thickness appears to be unimportant, and to put the cantilever analogy on firmer ground. A nice analog to our transverse confinement of saddles is the transverse confinement of an elastica Roman and Pocheau (1999, 2002). In these works, solutions for the confined elastica Holmes et al. (1999); Domokos and Royce (1997) are extended to thin plates constrained progressively in the vertical direction. Our problem has subtle differences, notably that our shells are naturally curved, and our confining plates are smaller than the shell size. However, the transitions between buckling modes in our experiments are reminiscent of these studies, including qualitative features like planar contact, free-standing folds, and rolling Pocheau and Roman (2004). These parallels suggest a way to pursue a more formal connection between the two problems. The shells studied in this work are residually stressed, and the magnitude of residual stress did not enter our mechanical model. It was recently shown that the magnitude of residual stress in shells will alter the critical point at which an instability occurs, i.e. the load required to buckle the structures, but that the instability remains qualitatively similar Jiang et al. (2018). Also, as others Nasto et al. (2013) have observed, contact plays an important role in transverse confinement. Further numerical analysis of these constrained shells would be beneficial, in particular, such an analyses could also offer a more geometric freedom, with regards to both shells and their confining boundaries, beyond what is readily accessible experimentally. In general, we anticipate these results will aid in the design of shape–shifting structures, and we believe there is much work to be done on understanding the role of confinement when designing structures that change shape on command.
Conflicts of interest
There are no conflicts to declare.
Acknowledgements
LSM and DPH gratefully acknowledge the financial support from NSF through CMMI-1824882.
IV Supplementary Information
IV.1 Structure Fabrication
To fabricate the shapes shown in Fig. 1, we use a technique known as residual swelling Pezzulla et al. (2015, 2016). We use two polyvinylsiloxane (PVS) elastomers, which we will refer to as green (Zhermack Elite Double 32, E=0.96 MPa) and pink (Zhermack Elite Double 8, E=0.23 MPa). The materials are cast in as fluids and allowed to thermally crosslink, or cure, at room temperature for 20 minutes. After curing, the pink elastomer has residual polymer chains within the material, and these residual free chains flow into the green elastomer when the two materials are in contact with each other. The local loss of mass causes the pink material to decrease in volume, or shrink, while the green material correspondingly swells, thus inducing a differential swelling in the structure which preserves its total mass. Differential swelling in shells can lead to residually stressed structures that emerge because the shell must deform to accommodate a geometric incompatibility Klein et al. (2007). When the differential swelling occurs through the shell’s thickness, it deforms in a nearly isometric manner in the bulk of the shell, away from shell’s edges Pezzulla et al. (2018), and when the differential swelling occurs in-the-plane of the shell the deformation is dominated by stretching Pezzulla et al. (2015). These opposing deformations explain why the initially flat shapes can be morphed into either rolled sheets or saddles. As residual swelling is a diffusive process, the time to deform scales with the square of the dimension across which swelling occurs. This characteristic dimension for swelling is either the thickness , or in the case of saddles, where residual swelling occurs in-the-plane, the radius, Pezzulla et al. (2015).
To make homogeneous rolled sheets, we use a spin coater (Laurel Technologies, WS-650-23) to deposit a pink layer of PVS atop a laser-cut (Epilog Laser Helix, 75W) circular acrylic plate, . After it cures, we add a green layer in the same manner. The residual swelling first bends the sheet into a shallow spherical cap, and then ultimately buckles it into a rolled sheet – a cylinder–like shape that is open along its directrix. The rolled sheet is nearly isometric away from its edges (i.e. ) and its non–zero mean curvature is linearly proportional to the natural curvature imposed by residual swelling Pezzulla et al. (2016, 2017, 2018).
Saddles are made by laser-cutting a negative circular mold () from clear cast acrylic sheets of thickness : mmmm (Inventables), mm (tolerance mm to mm), mm (mm to mm), or mm (mm to mm) (McMaster-Carr). This circular mold is glued atop a base acrylic plate, and a smaller circle, radius , is centered and fixed to the base plate. We then pour green PVS to form a ring, filling the mold up to the acrylic sheet thickness. After the ring cures, the smaller circle is removed and the remainder is filled with pink PVS. After residual swelling, a saddle shape forms: and – the value of the latter depends on the ratio of pink to green polymerPezzulla et al. (2016). In-plane swelling is quite a bit slower than through-thickness swelling, since the characteristic length scale changes from the thickness to the radius Pezzulla et al. (2015). The dynamics can be increased by extracting the free polymer chains in a solvent bath, e.g. ethyl acetate.
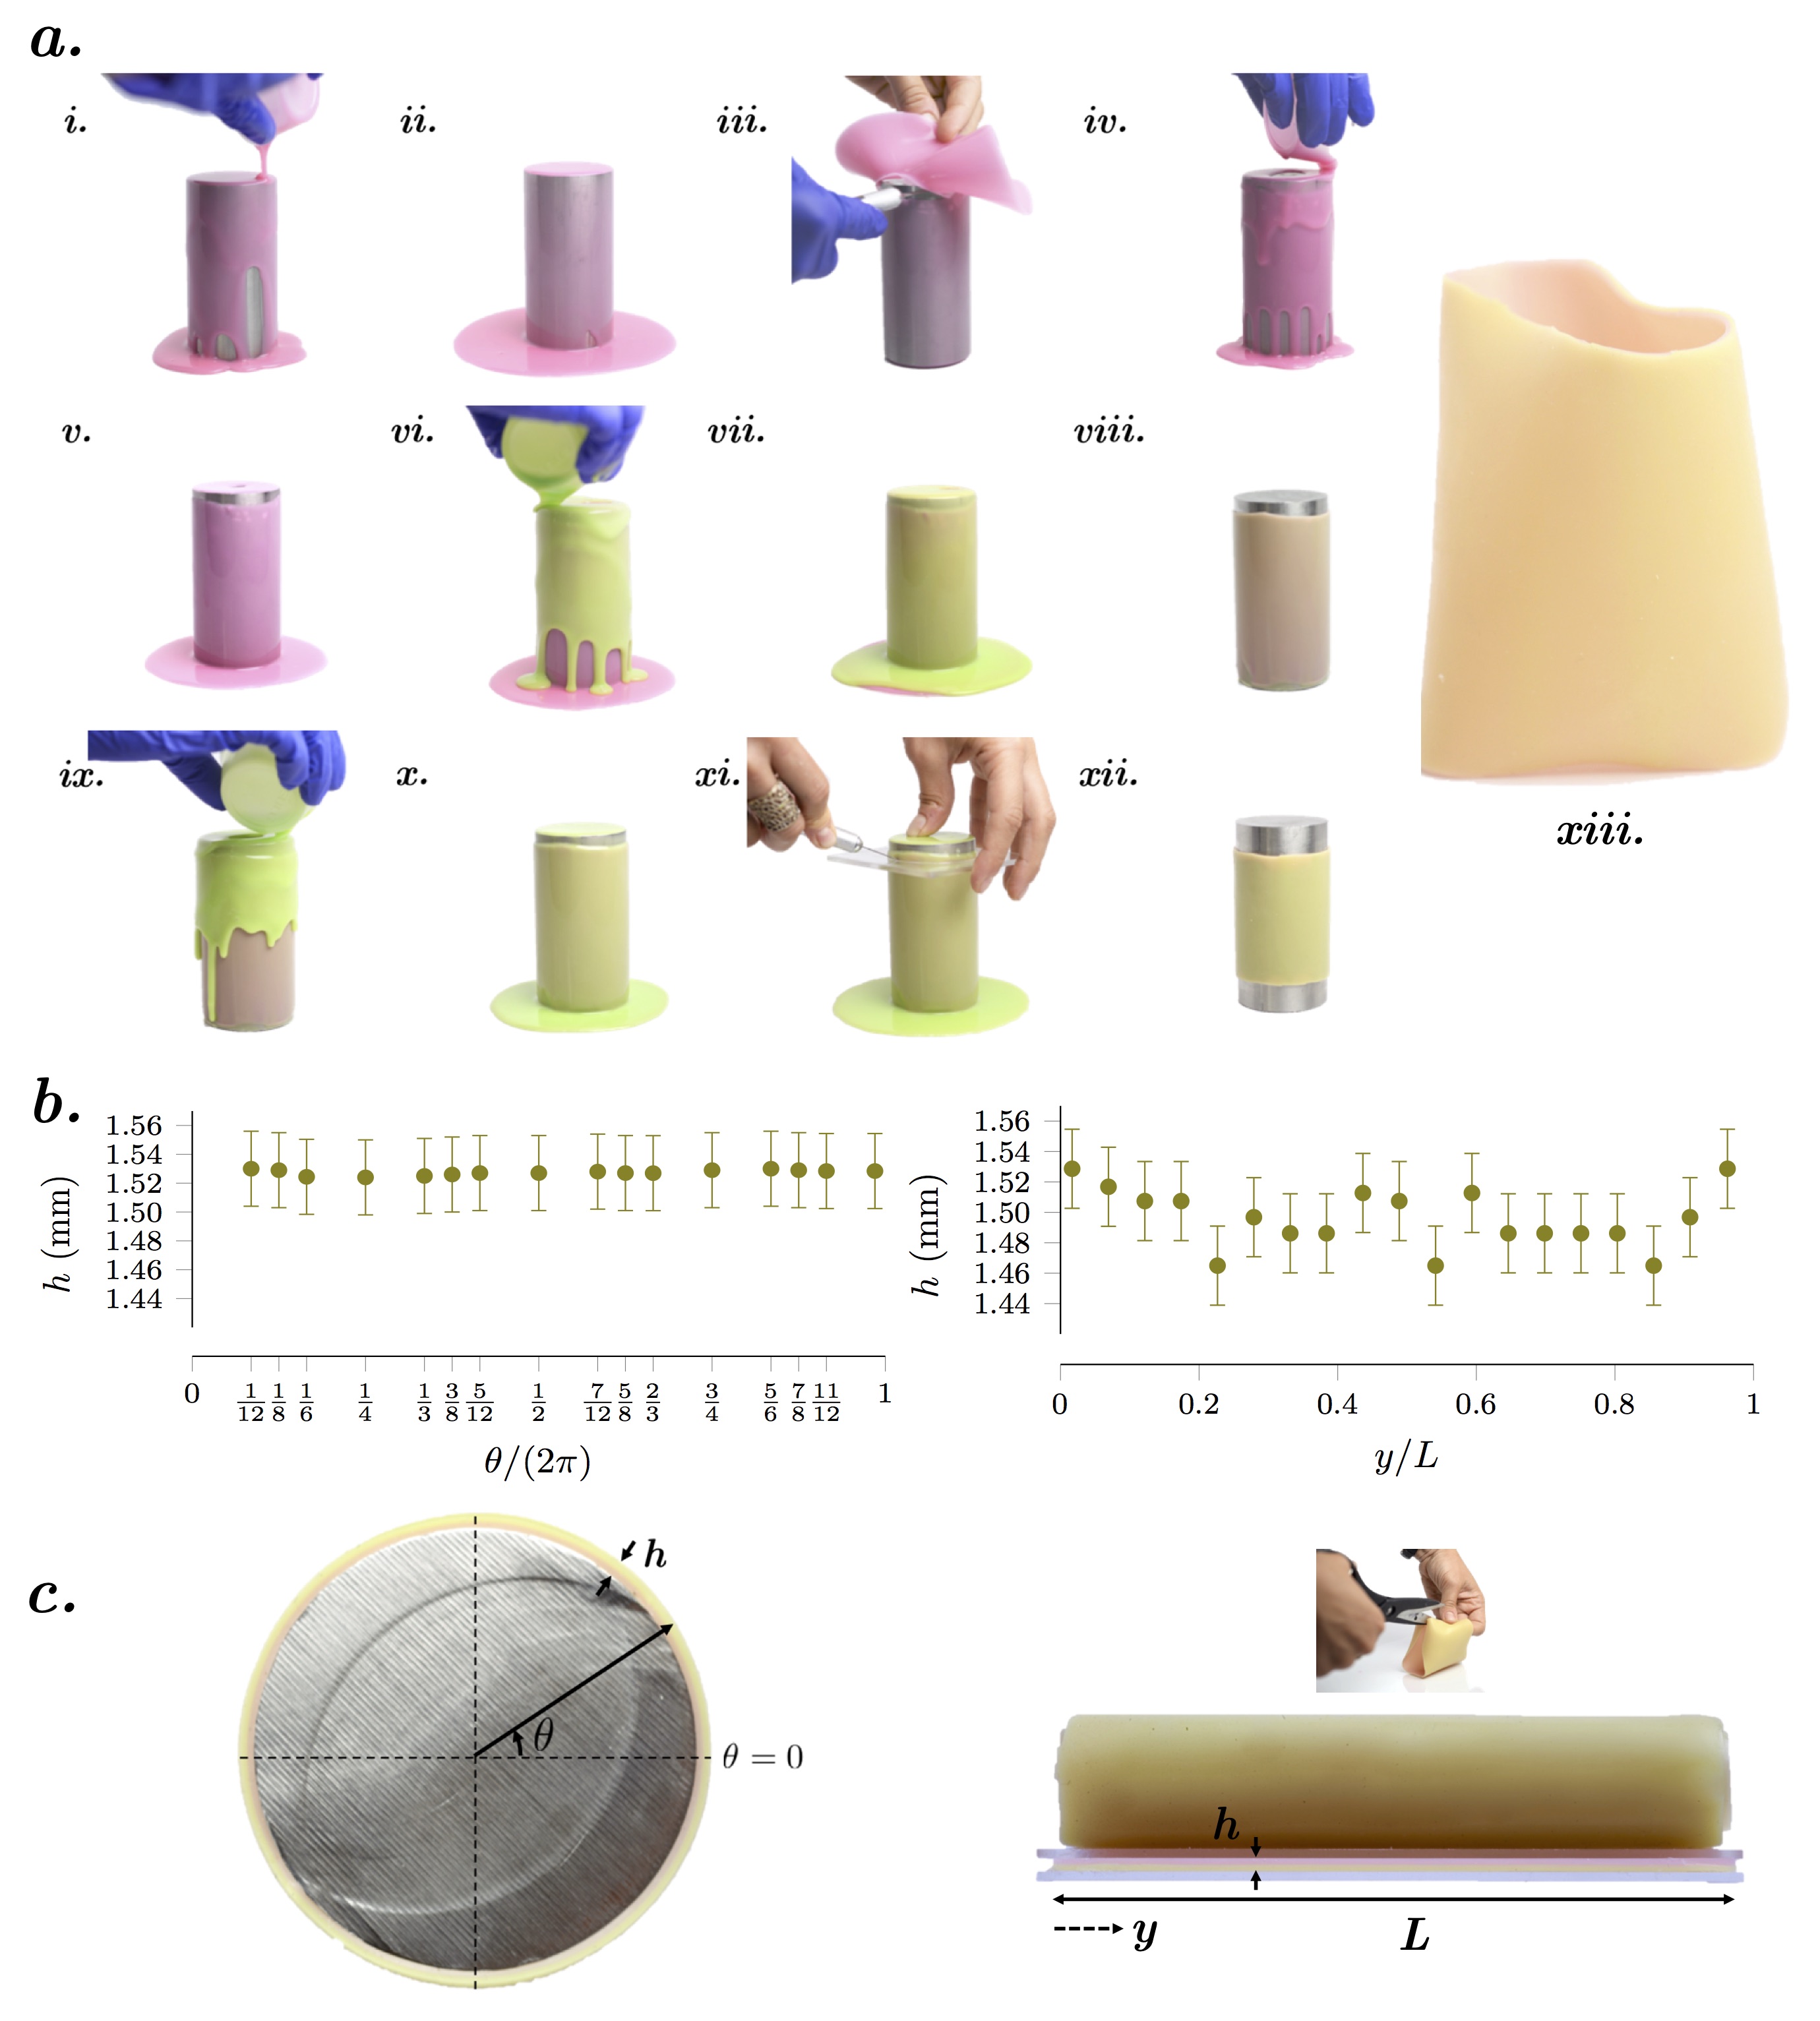
Cylinders and spherical segments are poured as bilayers over corresponding 3D molds. Spherical segments are formed by coating a metal ball-bearing with viscous PVS so that each layer has approximately uniform thickness Lee et al. ; Pezzulla et al. (2018). These spherical shells have positive average mean and Gaussian curvatures both before and after the swelling process. Cylinders are fabricated similarly Marthelot et al. (2017) (see Fig.5), and like spheres, the initial mean curvature , though . After deformation, a ”pinched pipe” forms Mahadevan et al. (2007), with and .
For the experiments described in Section I, rolled sheets and saddles are clamped in the center between two laser-cut acrylic plates of equal size, . Cylinders and spherical segments, on the other hand, are constrained by acrylic plates glued to the base with a very thin layer of green VPS. Cylinders are then cut to varied heights, and spheres are cut at different latitudes: the angle is subtended by the arclength from the origin (the north pole) to the top cut (the free surface). The base, where the shell is constrained, is defined by the angle . Schematics of the pre-swelling configurations, including constraints, are given in Fig. 2. Thickness is measured at mm mm for Section I, and mm mm, mm mm] for the saddles discussed in Section II.
IV.2 Mechanical force testing
The saddles used in Section II were fabricated with a centered mm radius hole through which we guide a mm radius rod as transverse confinement is varied. We determined this hole to be necessary for maintaining the saddle’s position but negligible for our purposes – it has no effect on lobe number.
We investigate transverse confinement with a setup designed for the INSTRON 5943. We attach a drill-type grip (Instron 0.375in Keyless Drill-Type Chuck Assembly) to the load cell to secure an aluminum rod (mm radius), which is screwed to an internally threaded acrylic plate of radius . A second partially threaded rod is attached to the underside of this top plate, pointing downward. The rod is guided through the saddle’s center hole and then through a hole also of radius mm in the center of the acrylic base plate, which itself has radius . The base plate is affixed to a thick tube of outer radius , inner radius mm and height mm. This tube is comprised of stacked acrylic rings each of thickness mm, glued together and closed at the base. The base of the tube is screwed to a tapped optical table.
Displacement-controlled tension tests are performed at a rate of 4 mm/min and force is measured with a 500N load cell (resolution 0.0025N). Videos were taken with a Nikon D610 DSLR Camera and were used for post-processing in conjunction with Instron data.
IV.3 Numerics
For the three bilayer geometries where residual swelling occurs through-the-thickness, we sought to validate the experiments from Section I with simulations developed in COMSOL Multiphysics. We created a 3D model within the context of three-dimensional neo-Hookean elasticity with large distortions using a Neo-Hookean material model Lucantonio et al. (2014). The stimulus is represented by a spherical distortion field , with in one layer, and in the other layer, where is the general coordinate normal to the midsurface (i.e. across the thickness) and is an inelastic stretching factor. The constraints were modeled with Dirichlet boundary conditions imposed around a ring in each case, reflecting the experimental setup.
IV.4 Buckling dynamics
We know from Ref. Pezzulla et al. (2017) that for the unconstrained rolled sheet (), the critical buckling curvature (normalized by the thickness) is
| (6) |
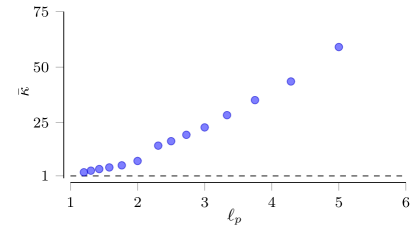
We examine the effect of constraint on this value – our numerics allow us to extract the critical curvature required for buckling for various values of . This is shown in Fig. 6 by , which represents the ratio of the buckling curvature of the constrained structure over an unconstrained but otherwise geometrically identical sheet (according to (6)). We observe that the buckling curvature increases with or, in other words, that more constrained structures require more curvature to buckle.
Curvature continues to develop past the critical buckling point, and we generally observe that lobes become increasingly pronounced, as in Fig. 7a. However, when corresponds to an intermediate value, the lobe-selection process can be unstable (Fig. 7b.) A similar bistability between two mode numbers is seen in some shells after residual swelling is complete.
References
- Cerda (2005) E. Cerda, Journal of Biomechanics, 2005, 38, 1598–1603.
- Bard and Bard (1992) J. B. Bard and J. Bard, Morphogenesis: the cellular and molecular processes of developmental anatomy, Cambridge University Press, 1992, vol. 23.
- Bard and Ross (1982) J. B. Bard and A. S. Ross, Developmental Biology, 1982, 92, 73–86.
- Bard and Ross (1982) J. B. Bard and A. S. Ross, Developmental Biology, 1982, 92, 87–96.
- Dervaux and Ben Amar (2011) J. Dervaux and M. Ben Amar, Journal of the Mechanics and Physics of Solids, 2011, 59, 538–560.
- Dervaux et al. (2011) J. Dervaux, Y. Couder, M.-A. Guedeau-Boudeville and M. B. Amar, Physical Review Letters, 2011, 107, 018103.
- Ben Amar and Wu (2014) M. Ben Amar and M. Wu, EPL (Europhysics Letters), 2014, 108, 38003–7.
- Dervaux et al. (2014) J. Dervaux, J. C. Magniez and A. Libchaber, Interface Focus, 2014, 4, 20130051–20130051.
- Goriely (2017) A. Goriely, The Mathematics and Mechanics of Biological Growth, Springer, 2017.
- Yang et al. (2007) W. Yang, T. Fung, K. Chian and C. Chong, Journal of Biomechanics, 2007, 40, 481–490.
- Lee and Chien (1979) M. M. Lee and S. Chien, The Anatomical Record, 1979, 194, 1–14.
- Lu et al. (2005) X. Lu, J. Zhao and H. Gregersen, Journal of Biomechanics, 2005, 38, 417–426.
- Reis et al. (2015) P. M. Reis, H. M. Jaeger and M. Van Hecke, Extreme Mechanics Letters, 2015, 5, 25–29.
- Klein et al. (2007) Y. Klein, E. Efrati and E. Sharon, Science, 2007, 315, 1116–1120.
- Holmes et al. (2011) D. P. Holmes, M. Roché, T. Sinha and H. Stone, Soft Matter, 2011, 7, 5188.
- Kim et al. (2012) J. Kim, J. A. Hanna, M. Byun, C. D. Santangelo and R. C. Hayward, Science, 2012, 335, 1201–1205.
- Dervaux and Amar (2012) J. Dervaux and M. B. Amar, Annual Review of Condensed Matter Physics, 2012, 3, 311–332.
- Pandey and Holmes (2013) A. Pandey and D. P. Holmes, Soft Matter, 2013, 9, 5524.
- Wu et al. (2013) Z. L. Wu, M. Moshe, J. Greener, H. Therien-Aubin, Z. Nie, E. Sharon and E. Kumacheva, Nature Communications, 2013, 4, 1586–7.
- Pezzulla et al. (2016) M. Pezzulla, G. P. Smith, P. Nardinocchi and D. P. Holmes, Soft Matter, 2016, 12, 4435–4442.
- Pezzulla et al. (2015) M. Pezzulla, S. A. Shillig, P. Nardinocchi and D. P. Holmes, Soft Matter, 2015, 11, 5812–5820.
- Pezzulla et al. (2018) M. Pezzulla, N. Stoop, M. P. Steranka, A. J. Bade and D. P. Holmes, Physical Review Letters, 2018, 120, 048002.
- Mora and Boudaoud (2006) T. Mora and A. Boudaoud, The European Physical Journal E, 2006, 20, 119–124.
- DuPont et al. (2010) S. J. DuPont, Jr, R. S. Cates, P. G. Stroot and R. Toomey, Soft Matter, 2010, 6, 3876.
- Barros et al. (2012) W. Barros, E. N. de Azevedo and M. Engelsberg, Soft Matter, 2012, 8, 8511.
- Efrati et al. (2009) E. Efrati, E. Sharon and R. Kupferman, Journal of the Mechanics and Physics of Solids, 2009, 57, 762–775.
- Dias et al. (2011) M. A. Dias, J. A. Hanna and C. D. Santangelo, Physical Review E, 2011, 84, 036603.
- van Rees et al. (2017) W. M. van Rees, E. Vouga and L. Mahadevan, Proceedings of the National Academy of Sciences, 2017, 201709025.
- Domokos and Royce (1997) P. Domokos, G; Holmes and B. Royce, Journal of Nonlinear Science, 1997, 7, 281–314.
- Holmes et al. (1999) P. Holmes, G. Domokos, J. Schmitt and I. Szeberényi, Computer Methods in Applied Mechanics and Engineering, 1999, 170, 175–207.
- Roman and Pocheau (1999) B. Roman and A. Pocheau, EPL (Europhysics Letters), 1999, 46, 602–608.
- Roman and Pocheau (2002) B. Roman and A. Pocheau, Journal of the Mechanics and Physics of Solids, 2002, 50, 2379–2401.
- Pocheau and Roman (2004) A. Pocheau and B. Roman, Physica D: Nonlinear Phenomena, 2004, 192, 161–186.
- Ben Amar and Pomeau (1997) M. Ben Amar and Y. Pomeau, Proceedings of the Royal Society of London A: Mathematical, Physical and Engineering Sciences, 1997, 453, 729–755.
- Cerda and Mahadevan (1998) E. Cerda and L. Mahadevan, Physical Review Letters, 1998, 80, 2358.
- Chaïeb et al. (1998) S. Chaïeb, F. Melo and J.-C. Géminard, Physical Review Letters, 1998, 80, 2354.
- Cerda et al. (1999) E. Cerda, S. Chaieb, F. Melo and L. Mahadevan, Nature, 1999, 401, 46–49.
- Chaieb (2000) S. Chaieb, Journal of the Mechanics and Physics of Solids, 2000, 48, 565–579.
- Cerda and Mahadevan (2005) E. Cerda and L. Mahadevan, Proceedings of the Royal Society of London A: Mathematical, Physical and Engineering Sciences, 2005, 461, 671–700.
- Hure et al. (2012) J. Hure, B. Roman and J. Bico, Physical Review Letters, 2012, 109, 054302.
- Paulsen et al. (2015) J. D. Paulsen, V. Démery, C. D. Santangelo, T. P. Russell, B. Davidovitch and N. Menon, Nature Materials, 2015, 14, 1206.
- Vaziri and Mahadevan (2008) A. Vaziri and L. Mahadevan, Proceedings of the National Academy of Sciences, 2008, 105, 7913–7918.
- Nasto et al. (2013) A. Nasto, A. Ajdari, A. Lazarus, A. Vaziri and P. M. Reis, Soft Matter, 2013, 9, 6796–9.
- Vella and Davidovitch (2018) D. Vella and B. Davidovitch, arXiv preprint arXiv:1804.03341, 2018.
- Paulsen (2018) J. D. Paulsen, arXiv preprint arXiv:1804.07425, 2018.
- Mahadevan et al. (2007) L. Mahadevan, A. Vaziri and M. Das, EPL (Europhysics Letters), 2007, 77, 40003.
- Jiang et al. (2018) X. Jiang, M. Pezzulla, H. Shao, T. K. Ghosh and D. P. Holmes, EPL (Europhysics Letters), 2018, 122, 64003.
- Klein et al. (2007) Y. Klein, E. Efrati and E. Sharon, Science, 2007, 315, 1116–1120.
- Pezzulla et al. (2017) M. Pezzulla, N. Stoop, X. Jiang and D. P. Holmes, Proceedings of the Royal Society of London A: Mathematical, Physical and Engineering Sciences, 2017, 473, 20170087.
- (50) A. Lee, P. T. Brun, J. Marthelot, G. B. Nature and 2016, Nature Communications.
- Marthelot et al. (2017) J. Marthelot, P.-T. Brun, F. Lopez Jimenez and P. M. Reis, APS Meeting Abstracts, 2017, p. C15.010.
- Lucantonio et al. (2014) A. Lucantonio, P. Nardinocchi and M. Pezzulla, Proceedings of the Royal Society of London A: Mathematical, Physical and Engineering Sciences, 2014, 470, 20140467–20140467.