Gemini, SOFIA, and ATCA reveal very young, massive protostars
in the collapsing molecular cloud BYF 73
Abstract
We present multi-wavelength data on the globally infalling molecular cloud/protostellar cluster BYF 73. These include new far-infrared (FIR) spectral line and continuum data from the Stratospheric Observatory for Infrared Astronomy’s (SOFIA’s) Far-Infrared Field-Imaging Line Spectrometer (FIFI-LS), mid-infrared (MIR) observations with the Thermal-Region Camera Spectrograph (T-ReCS) camera on Gemini-South, and 3mm continuum data from the Australia Telescope Compact Array (ATCA), plus archival data from Spitzer/Infrared Array Camera (IRAC), and Herschel/Photodetecting Array Camera and Spectrometer (PACS) and Spectral and Photometric Imaging Receiver (SPIRE). The FIFI-LS spectroscopy in [O i]m, [O iii]m, [O i]m, and [C ii]m highlights different gas environments in and between the dense molecular cloud and Hii region. The photo-dissociation region (PDR) between the cloud and Hii region is best traced by [O i]m and may have density 1010 m-3, but the observed m/m and m/m line ratios in the densest gas are well outside model values. The Hii region is well-traced by [C ii], with the m/m line ratio, indicating a density of 108.5 m-3 and a relatively weak ionizing radiation field, 1.5 log 2. The T-ReCS data reveal eight protostellar objects in the cloud, of which six appear deeply embedded ( 30m or more) near the cloud’s center. MIR 2 has the most massive core at 240 ⊙, more massive than all the others combined by up to tenfold, with no obvious gas outflow, negligible cooling line emission, and 3–8% of its 4.7103 ⊙ luminosity originating from the release of gravitational potential energy. MIR 2’s dynamical age may be as little as 7000 years. This fact, and the cloud’s total embedded stellar mass being far less than its gas mass, confirm BYF 73’s relatively early stage of evolution.
Subject headings:
infrared: ISM — submillimeter: ISM — stars: formation — stars: protostars — ISM: lines and bands1. Introduction
The formation of massive star clusters is a topic of active debate and study (Longmore et al., 2014, and references therein). Current questions include the timescale and mechanisms of gas mass assembly and star formation (Peretto et al., 2013; Barnes et al., 2018), the degree to which gravity, turbulence, or magnetic fields control the dynamics (Crutcher, 2012; Zamora-Avilés & Vázquez-Semadeni, 2014; Padoan et al., 2016; Kobayashi et al., 2018) and the fidelity with which we can measure these effects with only trace constituents (Pitts et al., 2018).
BYF 73 (= G286.21+0.17, part of the Galactic Census of High and Medium-mass Protostars (CHaMP) survey of molecular clouds; Barnes et al., 2010, 2011) is one of only a dozen or so known parsec-scale molecular clumps that are undergoing large-scale collapse/contraction, but where only a few protostars have formed so far, and the cloud is still gas-dominated (Peretto et al., 2013; Rygl et al., 2013; Wyrowski et al., 2016). With an estimated mass of 2104 ⊙ and luminosity of 104 ⊙, BYF 73 has the highest measured mass inflow rate, 0.034 ⊙ yr-1, even among this extreme cohort (Barnes et al., 2010, 2016). Therefore, it may be in the early stages of forming a super star cluster like NGC 3603 in 0.5 Myr.
Such gas-dominated clouds are highly significant because the physical conditions, dynamics, and evolution must still be close to the cloud’s initial state, as opposed to even slightly more evolved objects like hot cores (Gerner et al., 2014), where the internal conditions are already dramatically altered by the energy input from luminous protostars. Therefore, a careful study of each such cloud will provide important boundary conditions for star formation theory. In this Letter, we present a range of new and archival data on BYF 73 from m to mm wavelengths, in order to examine the embedded protostellar content, gas mass distribution, and excitation conditions.
2. Observations and Data Reduction
2.1. Spitzer/IRAC
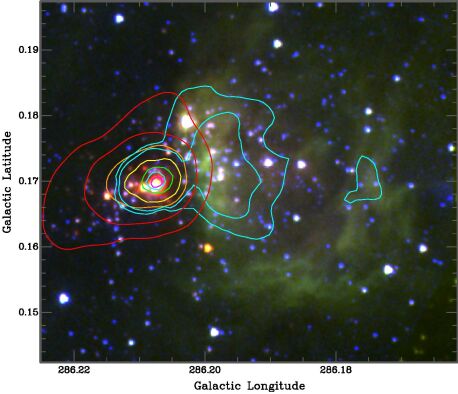
BYF 73 was observed by the Spitzer Space Telescope in all four IRAC bands (3.6–8 m) as part of the Galactic Legacy Infrared Midplane Extraordinaire (GLIMPSE) survey (Benjamin et al., 2003). We downloaded calibrated public data from NASA’s IRSA website, and transformed to Galactic coordinates for ease of comparison with data at other wavelengths. We cropped these data to cover all emission associated with the molecular cloud and its adjacent compact Hii region, as in the 4′ field shown in Fig. 1. We measured the background-subtracted flux densities for the eight IRAC stellar sources that were also detected with the Thermal-Region Camera Spectrograph (T-ReCS; §2.2); these are plotted in Fig. 3.
2.2. Gemini-South/T-ReCS
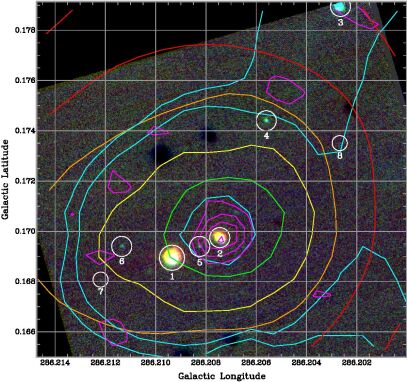
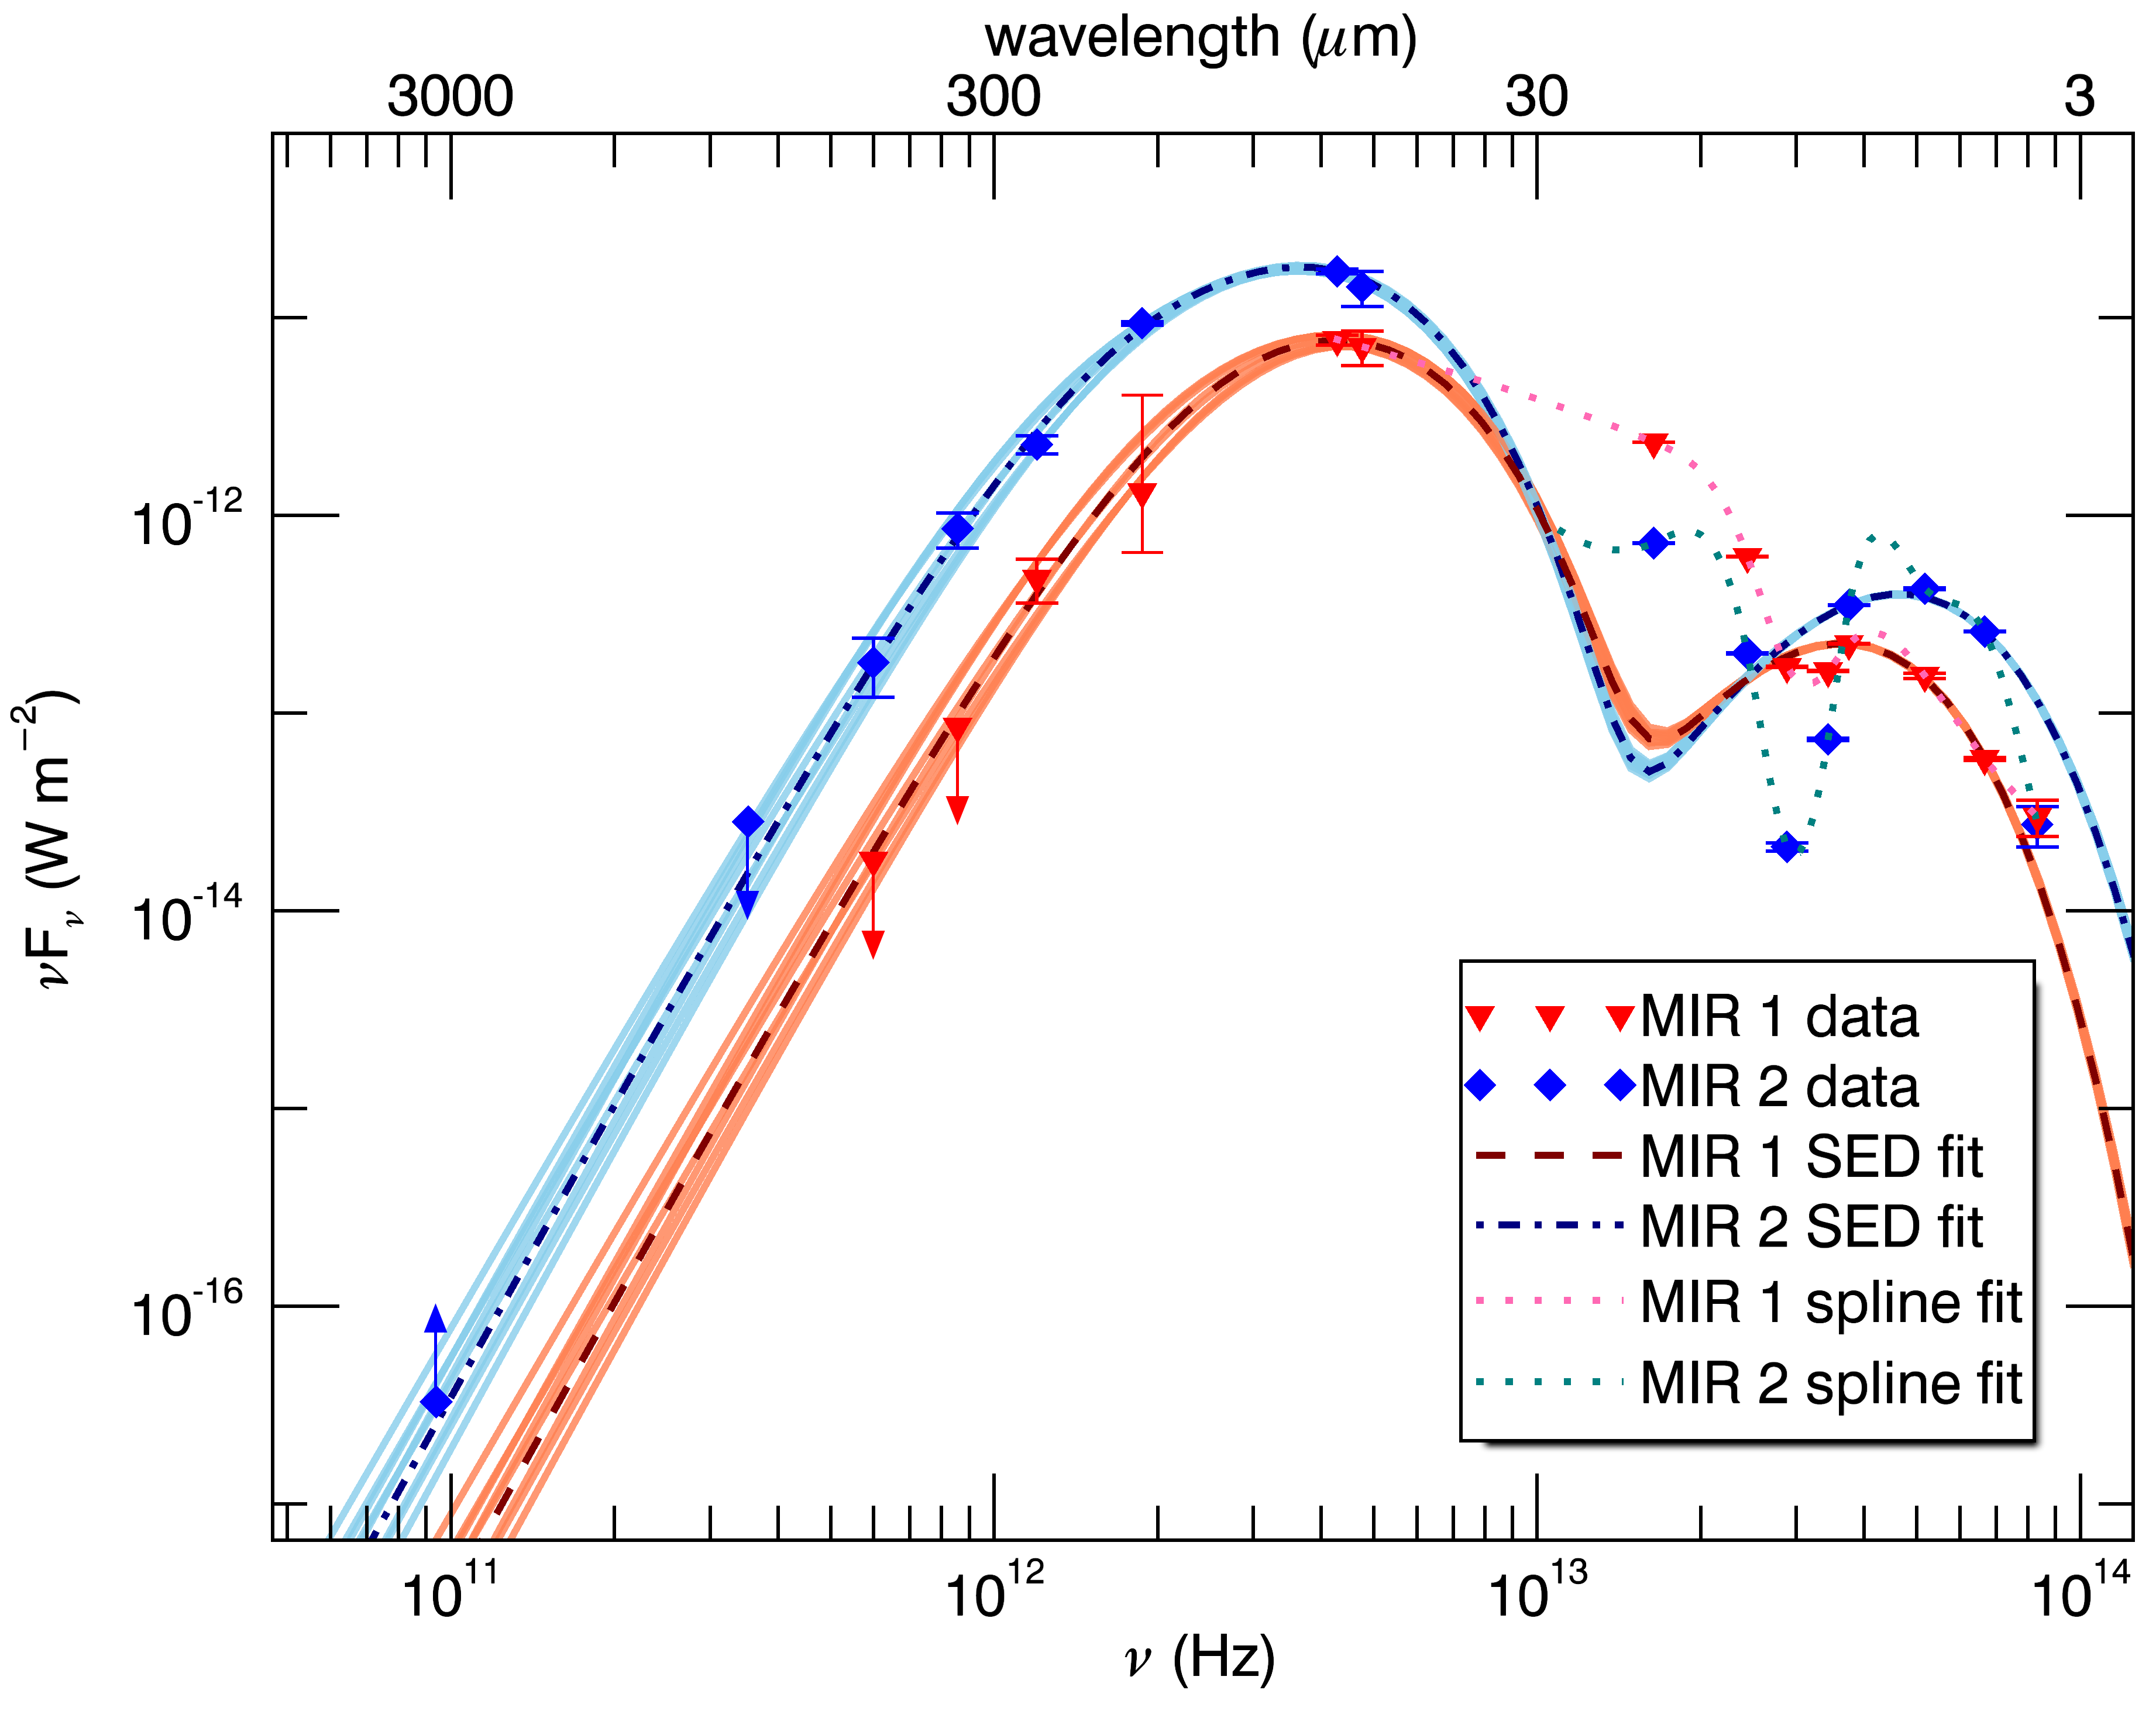
We obtained deep mid-infrared (MIR) data on BYF 73 with the high-resolution (point-spread function (PSF) 03) T-ReCS camera (Telesco et al., 1998) at Gemini-South on UT 2010 June , as part of program GS-2010A-Q-42 (PI: P. J. Barnes). The observations were set up to image a 1′ field of view with a six-field mosaic of the 20′′30′′ T-ReCS detector area, oriented to capture as many of the sources visible in the Spitzer images as possible. We cycled through the four filters Si2 (effective wavelength 8.74 m), Si4 (10.4 m), Si6 (12.3 m), and Qa (18.3 m) during the observing to form a commensurate set of images and enable multi-band photometry of all sources. Cohen et al. (1999) MIR standard stars SAO 250905 and SAO 222647 were observed before and after BYF 73, respectively, for flux calibration. The data were reduced with an in-house MIR data reduction package, which performed the chop-and-nod correction and co-added frames to form one image of BYF 73 at each MIR wavelength. Reduced and flux-calibrated images are presented in Fig. 2 as a composite image of three of the four T-ReCS bands. The flux densities of the eight detected sources (based on aperture photometry with radii equal to three times the FWHM of the PSF) are included in the spectral energy distribution (SED) plot of Fig. 3. For MIR 1, these are totals for both components of an equal-brightness binary, separated by 038 (PA = –14∘) in the Si2 image, or 950 au assuming a distance of 2.5 kpc (Barnes et al., 2010). The other MIR sources show no evidence of binarity at this resolution.

2.3. Stratospheric Observatory for Infrared Astronomy/Far-Infrared Field-Imaging Line Spectrometer (SOFIA/FIFI-LS)
We obtained integral-field spectra of BYF 73 centered on the [O i]m, [O iii]m, [O i]m, and [C ii]m lines on 2016 July 1 & 3 UT with FIFI-LS (Colditz et al., 2012; Klein et al., 2014) on board SOFIA, as part of project 04-0061 (PI: P. J. Barnes). Chopping and nodding were done asymmetrically due to the many nearby MIR sources to the (Galactic) west and south. Each integral field spectrum combines over 200 exposures dithered in sub-pixel increments to boost the sampling of the final spatially resampled image cube.111See the FIFI-LS GI handbook at https://www.sofia.usra.edu/ sites/default/files/FIFI-LS_GI_Handbook_RevB1.pdf, and the Cycle 5 SOFIA observer’s handbook at https://www.sofia.usra.edu/ science/proposing-and-observing/sofia-observers-handbook-cycle-5/5-instruments-ii-fifi-ls for details of the spectral & spatial resolutions and observing modes. The total integration times were 1659 s centered on the [C ii]m line, 3287 s on the [O i]m line, 1628 s on the [O iii]m line, and 3318 s on the [O i]m line. Pipeline processing with FLUXER222http://www.ciserlohe.de/fluxer/fluxer.html includes fitting and separation of line and continuum emission components in each band, and telluric correction.
2.4. Herschel Photodetector Array Camera and Spectrometer (PACS) and Spectral and Photometric Imaging REceiver (SPIRE)
We obtained archival Level 3.5 data from the Herschel (Pilbratt et al., 2010) satellite’s PACS (Poglitsch et al., 2010) and SPIRE (Griffin et al., 2010) photometers, in order to combine with the other data described herein and fit SEDs across BYF 73 (see §3.2). The Herschel data were originally acquired as part of the Carina Nebula Complex (CNC) open time project (see Preibisch et al., 2012, for details).
2.5. Atacama Submillimeter Telescope Experiment (ASTE) and ATCA
The flux density at 850 m, 81 Jy, is from a single-pointing measurement at the line emission peak, made with the 10 m ASTE (Ezawa et al., 2004) as part of another project (Y. Yonekura 2016, private communication).
We observed BYF 73 at ATCA on 2010 October 1 and 4 UT in the H75 array (baselines 31–89 m) in both the 942 GHz continuum and the HCO+ and H13CO+ =10 emission lines (89.19 GHz and 86.75 GHz, respectively) as part of program C2288 (PI: Barnes). We used the quasars 0537–441 and 1045–62, respectively, as passband and complex gain calibrators, and Mars as the flux calibrator. We mapped an 80-pointing mosaic of size 32 centered on the peak molecular line emission as measured in the Mopra maps (Barnes et al., 2010). Mediocre weather and poor phase stability, however, challenged the normal Miriad data reduction pipeline (Sault et al., 1995), resulting in line maps with low signal-to-noise ratios (S/N). The low spectral-line sensitivity was exacerbated by an apparently smooth intrinsic emission structure, as the ATCA HCO+ line flux was 30% of the Mopra single-dish value (Barnes et al., 2010), despite the short baselines. We fared better in the continuum, clearly detecting the point source MIR 2 at flux density 347 mJy in the 5647 synthesized beam (Fig. 2). MIR 3 may also have been detected, but at 2 this detection is not reliable; MIR 1 was not detected at all. Deconvolving MIR 2’s measured size, we obtain 423 au at 2.5 kpc for its physical dimensions at 3 mm, consistent with MIR 2 being a massive protostellar core.
3. Analysis and Discussion
3.1. FIR Spectral Lines and Gas Conditions
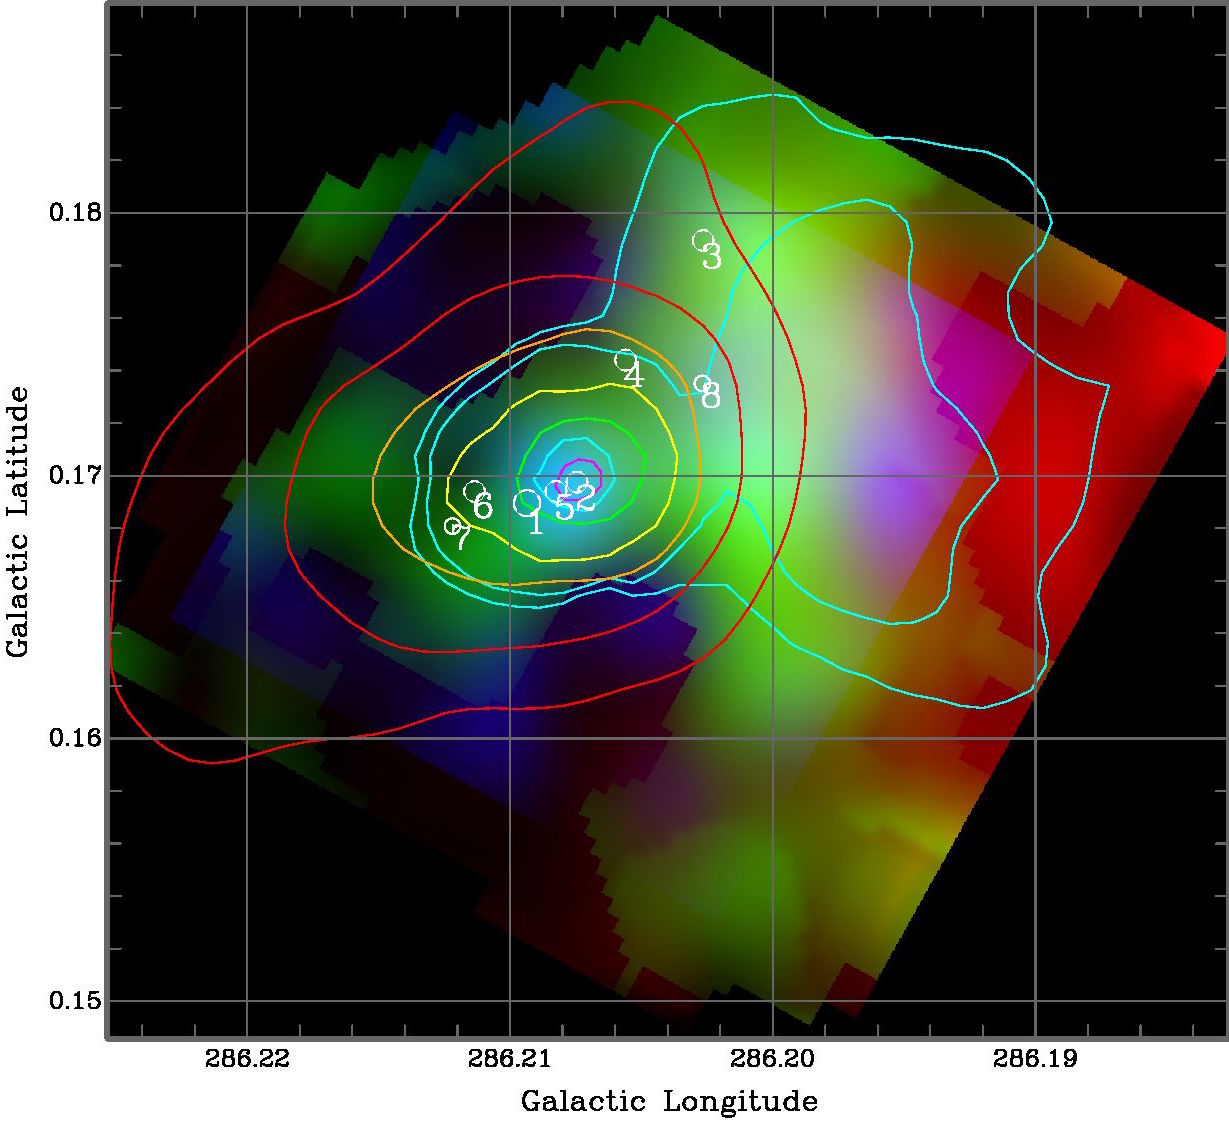
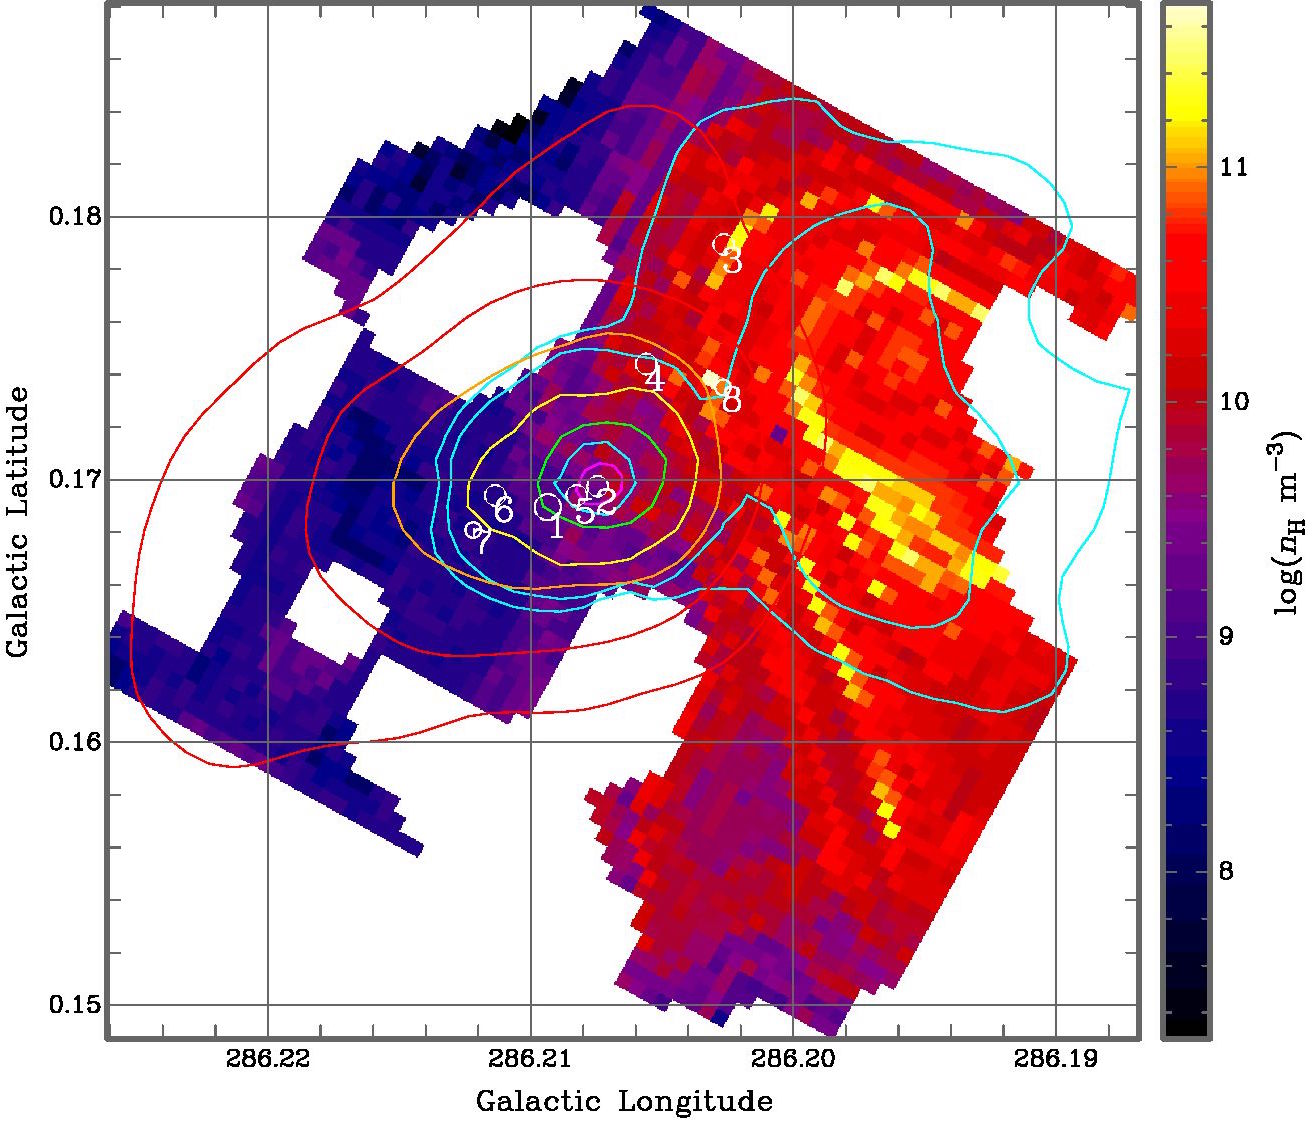
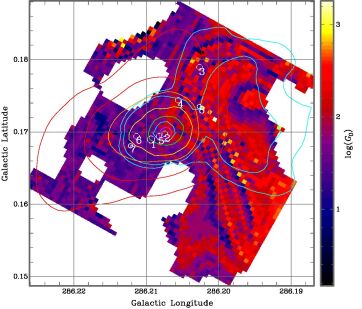
To analyze the FIFI-LS data, we localized the overlap of contours of two or more line ratios/intensities on log()–log() parameter maps from the Photo Dissociation Region Toolbox333http://dustem.astro.umd.edu/pdrt/models1.html (PDRT; Kaufman et al., 2006; Pound & Wolfire, 2008). Fig. 4 shows the observed line intensity and derived log() and log() maps, based on the PDRT and observed [C ii]m and [O i]m line ratios. No line components were detected in [O iii]m. The [O i]m fluxes were difficult to reconcile with the fluxes in the [O i]m and [C ii]m lines, likely exacerbated by the [O i]m line’s poor separation from the continuum in both the pipeline-processed spectra and our own alternative attempts. The [O i]m/[C ii]m ratio and integrated [C ii]m line flux were enough to determine and along the PDR to about half a dex precision, as shown in Fig. 4. There, we derive log() 1.5–2 and ranging over 1010-11 m-3.
Outside of the PDR, especially near MIR 1–2, PDRT’s built-in assumption of breaks down, and there are no prescriptions for higher extinctions. did not noticeably change near MIR 1-3, but fell where it was expected to rise. We found that the combination of weak [C ii]m line emission (at levels PDRT that flags as unreliable) and moderately high [O i]m/[C ii]m ratios around MIR 1-3 create contours in the PDRT maps of and that are nearly parallel over about three orders of magnitude in (Fig. 4).
While the [O i]m/[O i]m ratios do not provide further useful constraints on or at most locations, near MIR 2 there is a suggestion of a distinct high-density peak in the gas (1010.7 m-3, not shown here), albeit with large uncertainty (3 orders of magnitude in log ). This is reflected in the slightly better-constrained three-line localisation shown in Fig. 4, where log at MIR 2. To check this, we determined the mass (and thus the density) and luminosity of MIR 2 from SED fitting (§3.3). Assuming MIR 2 is an ellipsoid with a line of sight depth similar to its observable dimensions (9000 au), its volumetric mean density is = 1013 m-3 (§3.3), close to PDRT’s mean+1 value of given the temperature and , and lending credence to the PDRT result despite its large uncertainty.
At these densities, in a relatively weak far-ultraviolet (FUV) field, and given that BYF 73 is on average cool and dense enough to have a CO-depleted center (Pitts et al., 2018, subm.), carbon should be locked up in CO. The measured line luminosities around MIR 2 are 710-3 ⊙in the [C ii]m line and 410-3 ⊙in the [O i]m line. We conclude that in BYF 73, FIR “cooling” lines of O and C do not contribute significantly to the energy balance of the cloud, compared to the total FIR luminosity (§3.3).
3.2. MIR Point Sources
The MIR photometry reveals three features. First, we detect only six (proto)stars near the center of the molecular cloud, despite deep, high-resolution Very Large Telescope (VLT) data showing 30 heavily reddened objects (– 3) in the same 30′′-wide area (Andersen et al., 2017). The other two MIR stars, MIR 3 and 8, are either located within or projected onto the PDR front, and so may be slightly more evolved young stellar objects. The six central MIR stars may be the only true protostars in the imaged area, while the remaining near-infrared (NIR) objects may just be foreground pre-main sequence stars.
Second, only MIR 1–3 contribute significantly to the bolometric luminosity of the cloud. MIR 3–8 have slowly rising SEDs in the MIR, resembling classic Class II or III protostars (Adams et al. 1987; Barsony 1994; Andre & Montmerle 1994; MIR 5 seems to be brighter than expected in the IRAC band 4 image, but is the most affected by blending with MIR 2, so this data point should be treated with caution.) Only the SEDs of MIR 1 and 2 show the steep rise at longer wavelengths expected of Class 0 or I protostars, although MIR 1 will need higher-resolution FIR data to separate it cleanly from its much brighter neighbor MIR 2. MIR 2 seems to fall between Class 0 and I definitions: it has a relatively high and low , suggesting Class I, but very high gas fraction and infall rate, plus small age yr, suggesting Class 0.
Third, all of the MIR stars except MIR 3 and 8 (the two stars possibly within the PDR) show absorption near 10 m, attributable to the 9.7 m silicate feature and indicating the presence of intervening or circumstellar cold dust. For MIR 1 and 4–7, the absorption has a depth to 30–50% of the adjacent 12 m or 8 m continuum, indicating dust with optical depths at 10 m near 1. For MIR 2, however, the absorption is 90% of the MIR continuum, suggesting correspondingly larger amounts of dust, . Using a conversion of / = 18.51.0 magnitudes (Mathis, 1990), we find approximate values of visual extinction toward each star of 5418m (MIR 2) or 185m (others), though these conversions are for diffuse dust. In molecular clouds, this conversion shows substantial variation—often flattening at large (Chiar et al., 2007)—so these extinction estimates are likely lower limits. Assuming further standard conversions of = 1.871025 m-2 2 in these clouds (Gerin & Liszt, 2017), where the Hi contribution to the total column density is assumed to be small, ⊙ pc(Barnes et al., 2018), and multiplying by 2 to account for the rear half of each core, we obtain corresponding (very approximate) total mass columns from the silicate absorption of ⊙ pc-2 (MIR 2) and ⊙ pc-2 (others). If we assume a fiducial envelope size of 104 au (Adams et al., 1987), the total masses (better estimated in §3.3) are ⊙ for MIR 2 and ⊙ for the others. As we show below, this approach is a case in point for the caution urged by Gerin & Liszt (2017).
3.3. FIR/Sub-mm Continuum SED Fitting
To compute the core masses for the MIR point sources, we cropped and regridded the Herschel and SOFIA [O i]m continuum images to the area and pixel grid of the FIFI-LS [C ii] image, and experimented with fitting up to three 2D Gaussian PSFs at each wavelength, fixed at their respective MIR positions. MIR 1 and 2 are 74 apart, fortuitously aligned with the minor axes of the PACS beams, so they are separable at 63 m and 70 m, but not at longer wavelengths. MIR 5 is too close to both MIR 1 and 2 to be separable by Herschel or SOFIA, but shorter-wavelength data (Fig. 3) already suggest that MIR 3–8 contribute negligibly in the FIR, compared to MIR 1–2; even MIR 3 is undetected as a resolved object for 30 µm.444There is extended FIR/sub-mm structure in the direction of MIR 6–7, but we doubt either of these sources contributes meaningfully to this emission. At 63 m and 70 m, we fit Gaussians and background levels to minimize the residuals at MIR 1 and 2. At longer wavelengths, we estimated the contribution of MIR 1 by comparing the shape of the PSF at MIR 2 on the side facing MIR 1, to that on the opposite side. We then integrated the Gaussian models for each core separately at each wavelength, without the background.
We fit the resulting fluxes with a modified Planck function of the form with . Here, is the Planck function at dust temperature ; is the solid angle of the source; is the dust emissivity index; is the dust opacity coefficient at fiducial frequency (we use 1200 GHz); is the fitted H2 column density; is the gas-to-dust mass ratio; =2.8 is the mean molecular weight per hydrogen molecule; and is the mass of the hydrogen atom. and were allowed to vary, while was fixed at 100 (Beckwith et al., 1990), at 2.0 (Bianchi et al., 1999, and references therein), and 0.2 m2 kg-1 (e.g., Liseau et al., 2015). For MIR 2, we used from the ATCA interferometry, 14.3 arcsec2 (see §2.5 for dimensions), as a representative core size ( pc2 where kpc). MIR 1 is only resolved in the IRAC 3.6 m band, so we estimated MIR 1’s deconvolved core dimensions to be 16 ( pc2), noting that the IRAC 3.6 m filter passband encloses the 3.29 m polycyclic aromatic hydrocarbon (PAH) line, which is correlated with dust emission (Jones et al., 2015).
Two-component SED fitting of ATCA, ASTE, Herschel, SOFIA-63m, and Spitzer/IRAC data yields = 6.21028 m-2 in = 44.80.4 K gas for MIR 2, and = 2.11028 m-2 in = 511 K gas for MIR 1 (see Fig. 5). We only included additional warm temperature components to verify that they contributed negligibly to the total mass column and to estimate the total luminosity; their parameters are unreliable. The formal errors are based on the standard errors of the model fluxes used in fitting and the reported calibration errors of T-ReCS and the Herschel instruments. The total uncertainty of may be a factor of two or more due to the uncertainty in (Reach et al. 2015). The 9.7 µm silicate absorption feature is not part of the model, and neither is stochastic heating.
For MIR 2, the above column density corresponds to , , and = 1.2 ⊙ pc-2, where core the warm component’s contribution is negligible. These values look extreme, but over the representative size of MIR 2 at 3 mm, the core mass works out to a reasonable 240 ⊙. The total luminosity of MIR 2 is 4700 ⊙, of which about 4500 ⊙ is from the K component alone. Despite being only a few percent of BYF 73’s total mass and not much warmer than the clump on average (Pitts et al., 2018), MIR 2 contributes nearly half the total luminosity. Deepening the mystery, if ⊙ yr-1 (Barnes et al., 2010) and au, the gravitational contraction luminosity is ⊙, much more than the line luminosity but still only 6% of MIR 2’s total.
For MIR 1, by the same analysis, and 4 ⊙ pc-2, corresponding to a core mass of about 20 ⊙. The cool dust component of MIR 1 contributes ⊙ to the total luminosity. The T-ReCS 12 m and 18 m data could only be included in the fit with a spline (which was only used to estimate the total luminosity), but this raised MIR 1’s total luminosity to ⊙. These T-ReCS data points cannot trace the same temperature component as the FIR data, because that would indicate a 1 ⊙ protostar with a 4000 ⊙ luminosity.
For MIR 3, given the background flux levels in the Herschel data and its non-detection at µm, MIR 3 can be no more than 10% of the mass of MIR 1. If the same holds for MIR 4–8 as indicated by the FIR non-detections, MIR 2 has nearly 10 times the mass of the other seven objects put together.
4. Concluding Remarks
The mass and volume density of MIR 2 is comparable to the larger of two massive cores in SDC 335 (Peretto et al., 2013), a similar molecular clump to BYF 73 undergoing a massive inflow of gas toward its central objects, but in the case of SDC 335 through a prominent network of accreting filaments. BYF 73 is different because the inflow observed in the single-dish data (resolution 40′′) is across a cloud structure smooth enough to start resolving out on scales 30′′ pc. Furthermore, while the two cores in SDC 335 account for about 10% of the total mass of that cloud, MIR 2 is potentially as massive as MIR 1 and MIR 3–8 combined, yet accounts for only about 1% of BYF 73’s total mass: it is 98% gas. This result means BYF 73 may represent an even earlier stage of massive star formation than SDC 335, such that much of the cloud still shows signs of CO freeze-out and has detectable sublimation fronts facing both NGC 3324 and the adjacent compact H ii region (Pitts et al., 2018). In the hunt for the elusive transition from starless core to massive Class 0 protostar, the cores in BYF 73 may be the closest yet seen.
References
- Adams et al. (1987) Adams, F. C., Lada, C. J., & Shu, F. H. 1987, ApJ, 312, 788
- Andersen et al. (2017) Andersen, M., Barnes, P. J., Tan, J. C., Kainulainen, J., & de Marchi, G. 2017, ApJ, 850, 12
- Andre & Montmerle (1994) Andre, P., & Montmerle, T. 1994, ApJ, 420, 837
- Barnes et al. (2018) Barnes, P. J., Hernandez, A. K., Muller, E., & Pitts, R. L. 2018, ApJ, to appear
- Barnes et al. (2016) Barnes, P. J., Hernandez, A. K., O’Dougherty, S. N., Schap, III, W. J., & Muller, E. 2016, ApJ, 831, 67
- Barnes et al. (2013) Barnes, P. J., Ryder, S. D., O’Dougherty, S. N., et al. 2013, MNRAS, 432, 2231
- Barnes et al. (2010) Barnes, P. J., Yonekura, Y., Ryder, S. D., et al. 2010, MNRAS, 402, 73
- Barnes et al. (2011) Barnes, P. J., Yonekura, Y., Fukui, Y., et al. 2011, ApJS, 196, 12
- Barsony (1994) Barsony, M. 1994, in Astronomical Society of the Pacific Conference Series, Vol. 65, Clouds, Cores, and Low Mass Stars, ed. D. P. Clemens & R. Barvainis, 197
- Beckwith et al. (1990) Beckwith, S. V. W., Sargent, A. I., Chini, R. S., & Guesten, R. 1990, AJ, 99, 924
- Benjamin et al. (2003) Benjamin, R. A., Churchwell, E., Babler, B. L., et al. 2003, PASP, 115, 953
- Bianchi et al. (1999) Bianchi, S., Davies, J. I., & Alton, P. B. 1999, A&A, 344, L1
- Chiar et al. (2007) Chiar, J. E., Ennico, K., Pendleton, Y. J., et al. 2007, ApJ, 666, L73
- Cohen et al. (1999) Cohen, M., Walker, R. G., Carter, B., et al. 1999, AJ, 117, 1864
- Colditz et al. (2012) Colditz, S., Fumi, F., Geis, N., et al. 2012, in Proc. SPIE, Vol. 8446, Ground-based and Airborne Instrumentation for Astronomy IV, 844617
- Crutcher (2012) Crutcher, R. M. 2012, ARA&A, 50, 29
- Ezawa et al. (2004) Ezawa, H., Kawabe, R., Kohno, K., & Yamamoto, S. 2004, in Proc. SPIE, Vol. 5489, Ground-based Telescopes, ed. J. M. Oschmann, Jr., 763
- Gerin & Liszt (2017) Gerin, M., & Liszt, H. 2017, A&A, 600, A48
- Gerner et al. (2014) Gerner, T., Beuther, H., Semenov, D., et al. 2014, A&A, 563, A97
- Griffin et al. (2010) Griffin, M. J., Abergel, A., Abreu, A., et al. 2010, A&A, 518, L3
- Habing (1968) Habing, H. J. 1968, Bull. Astron. Inst. Netherlands, 19, 421
- Jones et al. (2015) Jones, A. G., Bendo, G. J., Baes, M., et al. 2015, MNRAS, 448, 168
- Kaufman et al. (2006) Kaufman, M. J., Wolfire, M. G., & Hollenbach, D. J. 2006, ApJ, 644, 283
- Klein et al. (2014) Klein, R., Beckmann, S., Bryant, A., et al. 2014, in Proc. SPIE, Vol. 9147, Ground-based and Airborne Instrumentation for Astronomy V, 91472X
- Kobayashi et al. (2018) Kobayashi, M. I. N., Kobayashi, H., Inutsuka, S.-i., & Fukui, Y. 2018, PASJ, 70, S59
- Liseau et al. (2015) Liseau, R., Larsson, B., Lunttila, T., et al. 2015, A&A, 578, A131
- Longmore et al. (2014) Longmore, S. N., Kruijssen, J. M. D., Bastian, N., et al. 2014, Protostars and Planets VI, 291
- Mathis (1990) Mathis, J. S. 1990, ARA&A, 28, 37
- Padoan et al. (2016) Padoan, P., Pan, L., Haugbølle, T., & Nordlund, Å. 2016, ApJ, 822, 11
- Peretto et al. (2013) Peretto, N., Fuller, G. A., Duarte-Cabral, A., et al. 2013, A&A, 555, A112
- Pilbratt et al. (2010) Pilbratt, G. L., Riedinger, J. R., Passvogel, T., et al. 2010, A&A, 518, L1
- Pitts et al. (2018) Pitts, R. L., Barnes, P. J., & Varosi, F. 2018, MNRAS, subm.
- Poglitsch et al. (2010) Poglitsch, A., Waelkens, C., Geis, N., et al. 2010, A&A, 518, L2
- Pound & Wolfire (2008) Pound, M. W., & Wolfire, M. G. 2008, in Astronomical Society of the Pacific Conference Series, Vol. 394, Astronomical Data Analysis Software and Systems XVII, ed. R. W. Argyle, P. S. Bunclark, & J. R. Lewis, 654
- Preibisch et al. (2012) Preibisch, T., Roccatagliata, V., Gaczkowski, B., & Ratzka, T. 2012, A&A, 541, A132
- Reach et al. (2015) Reach, W. T., Heiles, C., & Bernard, J.-P. 2015, ApJ, 811, 118
- Rygl et al. (2013) Rygl, K. L. J., Wyrowski, F., Schuller, F., & Menten, K. M. 2013, A&A, 549, A5
- Sault et al. (1995) Sault, R. J., Teuben, P. J., & Wright, M. C. H. 1995, in Astronomical Society of the Pacific Conference Series, Vol. 77, Astronomical Data Analysis Software and Systems IV, ed. R. A. Shaw, H. E. Payne, & J. J. E. Hayes, 433
- Telesco et al. (1998) Telesco, C. M., Pina, R. K., Hanna, K. T., et al. 1998, in Proc. SPIE, Vol. 3354, Infrared Astronomical Instrumentation, ed. A. M. Fowler, 534
- Wyrowski et al. (2016) Wyrowski, F., Güsten, R., Menten, K. M., et al. 2016, A&A, 585, A149
- Zamora-Avilés & Vázquez-Semadeni (2014) Zamora-Avilés, M., & Vázquez-Semadeni, E. 2014, ApJ, 793, 84