A long-lived neutron star merger remnant in GW170817: constraints and clues from X-ray observations
Abstract
Multi-messenger observations of GW170817 have not conclusively established whether the merger remnant is a black hole (BH) or a neutron star (NS). We show that a long-lived magnetized NS with a poloidal field G is fully consistent with the electromagnetic dataset, when spin down losses are dominated by gravitational wave (GW) emission. The required ellipticity can result from a toroidal magnetic field component much stronger than the poloidal component, a configuration expected from a NS newly formed from a merger. Abrupt magnetic dissipation of the toroidal component can lead to the appearance of X-ray flares, analogous to the one observed in gamma-ray burst (GRB) afterglows. In the X-ray afterglow of GW170817 we identify a low-significance () temporal feature at 155 d, consistent with a sudden reactivation of the central NS. Energy injection from the NS spin down into the relativistic shock is negligible, and the underlying continuum is fully accounted for by a structured jet seen off-axis. Whereas radio and optical observations probe the interaction of this jet with the surrounding medium, observations at X-ray wavelengths, performed with adequate sampling, open a privileged window on to the merger remnant.
keywords:
gravitational waves – gamma-ray burst: general – neutron stars| Exposure | Count rate | Unabsorbed Flux | Flux density | Facility | |
| (d) | (ks) | (10-3 cts s-1) | (10-14 erg cm-2 s-1) | (10-3 Jy) | |
| 0.5–8.0 keV | 0.3 – 10 keV | 1 keV | |||
| 153 | 32.1 | 2.0 0.3 | 3.2 0.4 | 2.7 0.3 | Chandra |
| 157 | 16.0 | 2.0 0.4 | 3.2 0.6 | 2.7 0.5 | " |
| 160 | 21.0 | 1.5 0.3 | 2.6 0.5 | 2.2 0.4 | " |
| 161 | 22.5 | 1.1 0.3 | 1.8 0.4 | 1.5 0.3 | " |
| 163 | 110 | 1.36 0.11 | 1.9 0.2 | 1.63 0.17 | XMM-Newton |
| 165 | 14.4 | 1.0 0.4 | 1.9 0.5 | 1.6 0.4 | Chandra |
| 260 | 96.7 | 0.86 0.17 | 1.2 0.2 | 1.03 0.17 | " |
1 Introduction
Pairs of neutron stars (NSs) are bound to spiral into each other due to their persistent emission of gravitational waves (GWs). Depending on the total mass of the system and the neutron star equation of state (EoS), the final product of the NS-NS merger can be either a black hole (BH) or a NS. Multi-messenger observations of GW170817, the first NS-NS merger system detected by advanced LIGO and advanced Virgo (Abbott et al., 2017a), have shown general consistency with a BH merger product, even though the possibility of a long-lived NS is not ruled out (Abbott et al., 2017b; Ai et al., 2018). Indeed, the NS scenario has interesting implications on the kilonova (KN) models (Kasen et al., 2015; Gao et al., 2015; Radice et al., 2018), alleviating demanding requirements on the mass of ejecta (Yu et al., 2018; Li et al., 2018; Metzger et al., 2018). On the other hand, the radiation emitted from such long-lived NS should not violate the limits posed by the multi-wavelength observations of the GW counterpart (e.g. Evans et al., 2017; Margalit & Metzger, 2017; Ai et al., 2018; Pooley et al., 2018).
A common - although not unique - interpretation is that the luminous blue component of the KN AT2017gfo was produced by lanthanide-poor accretion disc outflows along the binary polar axis (e.g. Evans et al., 2017; Troja et al., 2017; Kasen et al., 2017; Tanvir et al., 2017; Smartt et al., 2017; Pian et al., 2017) which is generally thought to produce less massive outflows, and support the immediate formation of a NS. Margalit & Metzger (2017) further constrained the nature of the relic NS by correlating the observed GW and GRB emission. Growing observational evidence shows that the merger remnant launched a relativistic jet (Mooley et al., 2018b; Troja et al., 2018a; Ghirlanda et al., 2018), which powered the observed GRB and broadband afterglow emission. In the standard GRB model the jet is formed and launched by an accreting solar-mass BH, and the 1.7 s delay between the GW and GRB emission (Goldstein et al., 2017; Savchenko et al., 2017) could be interpreted as the maximum lifetime of the remnant NS (Metzger et al., 2018), after which it collapsed into a BH. Such short lifetime would favor the formation of a hypermassive NS (HMNS) (e.g. Margalit & Metzger, 2017). However, if the central NS was longer lived (van Putten & Della Valle, 2018) and launched the GRB outflow, different outcomes, such as a supra-massive or a stable NS, remain possible.
X-ray observations have a prime role in constraining the merger final product, as newly born NS can be bright sources of X-ray radiation (Verbunt et al., 1996; Kargaltsev et al., 2013; Metzger & Piro, 2014). Such radiation is initially blocked by the merger ejecta surrounding the remnant (Metzger & Piro, 2014) but, as the ejecta expand and cool down, observations can peer down at the central compact object. Past works (Troja et al., 2018b; Lazzati et al., 2018; Margutti et al., 2018) already showed that X-ray emission from GW170817 is well described by standard afterglow synchrotron radiation, produced by the interaction of a relativistic outflow with a low-density ( cm-2) ambient medium at large radii (1018 cm) from the central power source. Any contribution from the central compact source must therefore be comparable to the GRB afterglow luminosity or higher in order to be detected.
In this paper we report the multi-wavelength afterglow data taken with ATCA, HST, XMM-Newton and Chandra around the broad local maximum in X-ray brightness reached at day 150. We discuss the model of a structured relativistic jet (Aloy et al., 2005; Lazzati et al., 2017; Kathirgamaraju et al., 2018; Xie et al., 2018) launched by the merger remnant and seen at a large viewing angle from its axis. The underlying engine is a long-lived magnetized NS, which injects energy into the relativistic outflow and the sub-relativistic ejecta (Metzger et al., 2018; Yu et al., 2018; Ai et al., 2018) We discuss the consistency of such scenario with the broadband data, including the kilonova properties, the afterglow long-term evolution, and the possible presence of short-term variability in the X-ray data.
While previous comparisons assumed a magnetic dipole spindown loss (Pooley et al., 2018), we consider the GW-dominated spindown regime, that is expected from a NS newly born from a merger. Constraints on the NS configuration, with particular regard to its magnetic field and ellipticity are derived. Implications on the NS mass, EoS and future observing strategy, with particular regard to X-ray observations, are briefly discussed.
2 Observations
2.1 X-rays
A log of X-ray observations around the broad local maximum in X-ray brightness reached at day 150 is reported in Table 1. Earlier observations were reported in Troja et al. (2017, 2018b); D’Avanzo et al. (2018); Haggard et al. (2017), while the most recent in Troja et al. (2018a). Chandra data were reduced in a standard fashion using the CIAO v4.9 and the latest calibration files. Source counts were extracted from a circular region containing 92% of the encircled energy fraction, whereas the background contribution was estimated from nearby source-free regions. We verified that none of the observations was affected by high levels of particle background.
XMM-Newton data were processed using SAS v16.1.0 and the most recent calibration files. Periods of high background were excluded from the analysis. The native astrometry was refined by matching the positions of 5 bright X-ray sources with their optical counterparts in the GSC v2.3.2 catalogue(Lasker et al., 2008). In order to minimize the contribution from contaminating X-ray sources, a small aperture of 5” was used to extract the source counts.
X-ray spectra were binned in order to have at least one count per energy channel and fit within the XSPEC v12.8.2 package by minimizing the C-statistics (Cash, 1979). To convert the observed count-rates to flux values we adopted a spectral index as derived from the broadband spectral energy distribution (Troja et al., 2018b, a).
2.1.1 Temporal analysis
As shown in Table 1, the X-ray observations performed around 160 d post-merger were split into several exposures spread over a period of a week. This allowed us to search for variability on short time-scales. During the first two Chandra observations, performed at 153 and 157 d, we measure a total of 89 source counts in 48 ks of exposure. In the last two observations, performed at 161 and 165 d, the count rate is lower, and we measure a total of 37 source counts in 37 ks of exposure. For a constant source, the Poissonian probability for such fluctuation is 3.3 .
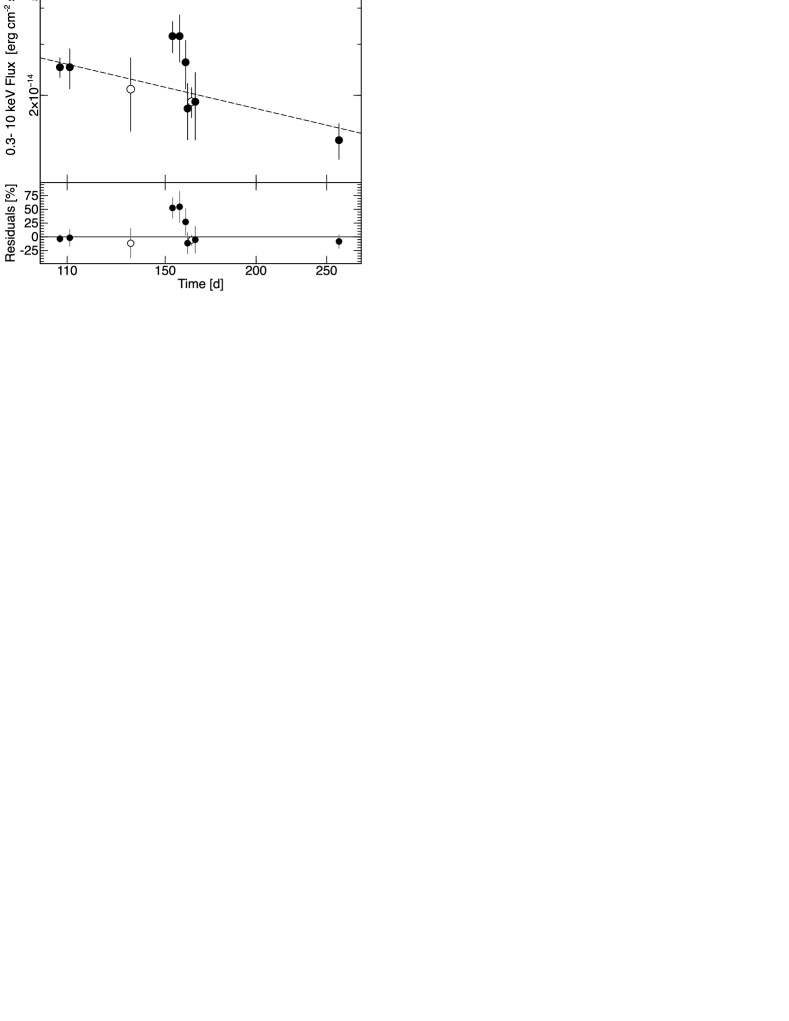
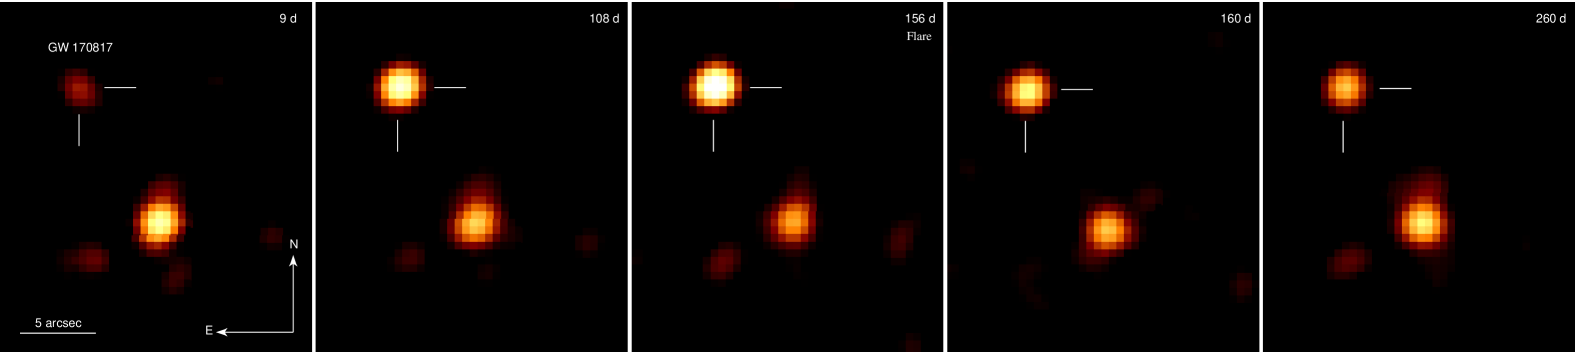
By including the adjacent X-ray data (Table 1) we obtain a similar significance of the temporal feature, an X-ray flare of a few days duration, peaking at 155 d. In order to estimate this value, we fit the X-ray data with a simple power-law model (Figure 1) and used this best fit continuum as input for a set of 10,000 Monte Carlo simulations. For each simulated dataset, we searched for statistical fluctuations mimicking a flare, derived the likelihood value of the two models (continuum vs continuum+gaussian flare) and calculated their ratio. Only in 11 cases we found a ratio lower than the observed value. We therefore conclude that the probability of a statistical fluctuation resembling a flare-like feature as significant as the one observed at 160 d is 10-3. Images showing the evolution of the afterglow are presented in Figure 2.
2.2 Optical observations
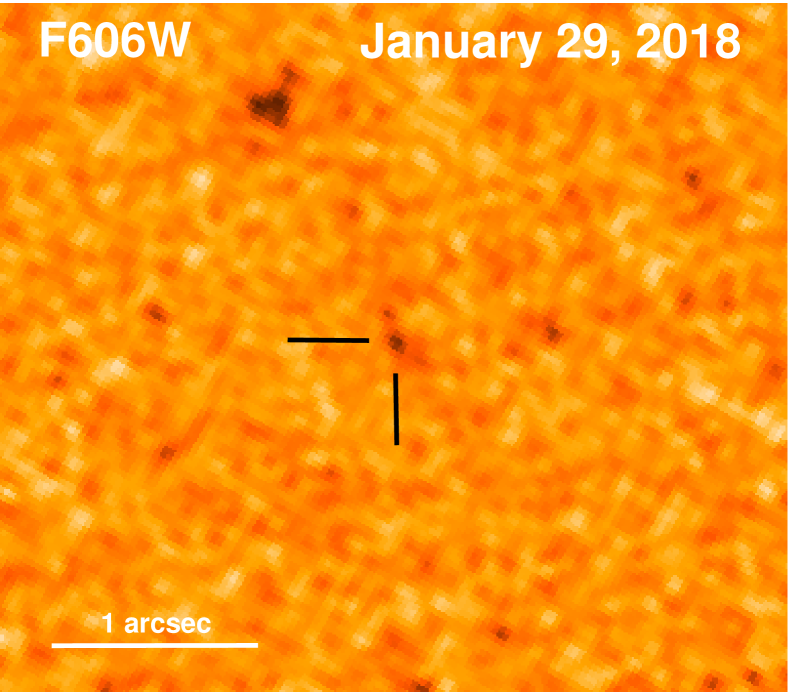
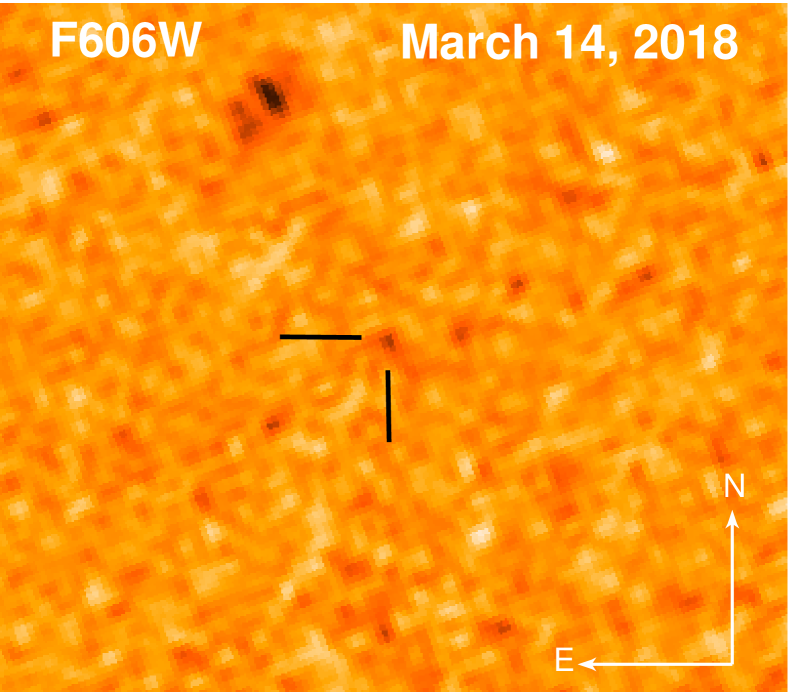
We obtained two late-time epochs of imaging (PI: Troja) with the Hubble Space Telescope. Images were taken with the UVIS detectors of the Wide-Field Camera 3 (WFC3). Data were reduced in a standard fashion using the Hubble Space Telescope CalWF3 standard pipeline (Deustua, 2016), and the astrodrizzle processing (Gonzaga et al., 2012). The final pixel scale was 0.3′′.
To subtract the galaxy light we used a median filter with window size of 15 times the FWHM of PSF of stars (3.3 pixels), large enough to remove the structure of the galaxy but not point sources like the afterglow. The residual images are shown in Figure 3. The GRB afterglow is weakly detected during our first epoch (top panel), whereas in our later epoch the source, although marginally visible in the residual image (bottom panel), is of low (< 2 ) significance. Images were analyzed using PSF-photometry based on DAOPHOT tasks under IRAF. We estimated an observed magnitude =26.7 0.4 AB mag in our first epoch, and > 26.6 AB mag in our last epoch. Our final photometry is listed in Table 2. Earlier observations were reported in Lyman et al. (2018) and Margutti et al. (2018).
The phenomenological model of Dobie et al. (2018) predicts a continued rise of the radio afterglow up to 150 d. If this model were extended to the optical wavelengths, it would be inconsistent with our optical data, that instead favor a smoother, flatter turn-over of the optical light curve.
2.3 Radio observations
The target source was observed with the Australia Telescope Compact Array (ATCA) at five different epochs under programs CX394 (PI: Troja) and CX391 (PI: Murphy). In order to bootstrap the flux density scale the standard source 1934-638 was observed in all epochs. The phase calibrators 1245-197 (first two epochs) and 1244-255 (last three epochs) were used to compute the complex gains. All the data sets were flagged, calibrated and imaged using standard procedures in the data reduction package MIRIAD. In order to maximize the results the 5.5 and 9 GHz data were imaged using a robustness parameter value of r=0.5 (1st and 2nd epochs) and r=-0.5 (4th and 5th epochs). Flux measurements for all epochs are reported in Table 3. Whereas our measurements at 9 GHz are generally consistent with Dobie et al. (2018), the derived fluxes at 5.5 GHz are systematically lower, and in better agreement with the VLA measurements at similar epochs (Margutti et al., 2018). Additional observations were reported in Mooley et al. (2018a); Troja et al. (2018b); Margutti et al. (2018) and Troja et al. (2018a).
| Instrument | Filter | Exposure | AB mag | |
|---|---|---|---|---|
| (d) | (s) | |||
| 166 | WFC3/UVIS | F606W | 2372 | 26.4 0.4 |
| 209 | WFC3/UVIS | F606W | 2432 | 26.3 |
| Frequency | Bandwidth | Configuration | Exposure | Flux | |
|---|---|---|---|---|---|
| (d) | (GHz) | (GHz) | (hrs) | (Jy) | |
| 125 | 5.5 | 2.0 | 6C | 10.5 | 72 9 |
| 9.0 | 2.0 | 6C | " | 72 9 | |
| 149 | 5.5 | 2.0 | 6C | 10.5 | 79 8 |
| 9.0 | 2.0 | 6C | " | 50 7 | |
| 160 | 19 | 4.0 | 750A | 10.5 | |
| 168 | 5.5 | 2.0 | 750A | 6.5 | |
| 9.0 | 2.0 | 750A | " | ||
| 182 | 5.5 | 2.0 | 750B | 9.5 | 81 16 |
| 9.0 | 2.0 | 750B | " | 54 11 | |
| 221 | 5.5 | 2.0 | EW352 | 12.0 | 60 12 |
| 9.0 | 2.0 | EW352 | 12.0 |
3 A long-lived magnetized NS as the merger remnant
GW observations constrain the mass of the remnant to , but do not break the degeneracy between a NS and a BH (Abbott et al., 2017b). Depending on the unknown NS equation of state and the spindown history, a supra-massive (up to 20% more massive than the maximum mass of a non-spinning neutron star (Breu & Rezzolla, 2016)) or even a permanently stable NS can survive after the merger. Here we discuss the implications of the observations for such a model.
3.1 Consistency with broad band observations
In order to accommodate the available electromagnetic observations, the merger product should have a weak poloidal magnetic field (Evans et al., 2017; Ai et al., 2018). During the spin-down process (either due to magnetic dipolar radiation or secular GW radiation), a continuous Poynting-flux-dominated outflow is launched and adds energy into the ejecta. The dipolar poloidal magnetic field at the NS surface should be below G in order to satisfy the upper limits set by the broadband observations, including the prompt -rays, the kilonova emission and the long-term X-ray, optical, and radio afterglow (Ai et al., 2018; Pooley et al., 2018). Indeed, the latest claim of a BH merger product (Pooley et al., 2018) suggests that the electromagnetic luminosity from the spin-down energy of a rapidly spinning NS ( erg) is ruled out by the data. On the other hand, a newly-formed NS likely possesses a large ellipticity so that secular gravitational wave loss is expected to remove a significant amount of its initial spin energy (e.g. Dall’Osso & Stella, 2007; Dall’Osso et al., 2009; Fan et al., 2013; Gao et al., 2016). The argument of Pooley et al. (2018) is removed when gravitational wave spindown is properly taken into account.
The X-ray luminosity of a spinning magnetized NS is given by the energy input into the surrounding medium from electromagnetic losses (Lasky & Glampedakis, 2016).
| (1) |
where is the solution of the spin down equation (eq.1. of (Lasky & Glampedakis, 2016), the dipole component of the magnetic field, the neutron star radius, respectively. The efficiency accounts for converting spin-down energy into electromagnetic radiation, through the X-ray channel. reflects the dominant spin down losses, either emission of GW or dipole radiation, that are characterized by the time scales:
| (2) |
| (3) |
where is the ellipticity and the period. When , gravitational wave emission dominates spin down until a time
| (4) |
For the X-ray luminosity follows
| (5) |
where
| (6) |
Comparison with present observations by Pooley et al. (2018) assumed that electromagnetic radiation dominates spin-down. In such a case the luminosity follows
| (7) |
However, in the GW-loss dominated regime, the luminosity becomes a factor lower, thus relaxing the constraints derived from observations. This condition applies when that is satisfied when
| (8) |
and the corresponding X-ray flux from equation 5 (assuming D=40 Mpc) is given by
| (11) |
with the flux in .
We require this flux to be consistent with X-ray observations at t>100 days, when the ejecta are optically thin. This sets a first condition on , i.e. . A second condition follows by requiring that the flux at d be lower than the observed one:
| (12) |
This equation provides the tighter constraint on for the assumed parameter of the NS (, and ), and allow us to conclude that a NS with ellipticity and a poloidal field is fully consistent with the X-ray dataset collected so far.
The required ellipticity can be produced by a strong toroidal component of the magnetic field that develops from the differential rotation expected from a NS born from the merger (Rezzolla et al., 2018; Giacomazzo et al., 2015). The strong magnetic field gradient is expected to deform the star with an ellipticity that can be approximated by (Cutler, 2002), where is the toroidal component of the field. Another viable mode for developing ellipticity involve the so called bar mode instability (Corsi & Mészáros, 2009), that can produce as large as (Lasky & Glampedakis, 2016).
3.2 Alleviating the requirements on kilonova ejecta
A long-lived NS is not only allowed, but is also helpful to interpret some of the data. Energy injection to the kilonova from such a remnant indeed helps to interpret the kilonova properties without invoking extreme parameters (Yu et al., 2018; Li et al., 2018). The remnant NS deposits extra energy to power the kilonova emission (Yu et al., 2013; Kasen et al., 2015; Murase et al., 2018). This helps to account for the early peak and high luminosity of the “blue kilonova” (Evans et al., 2017), otherwise difficult to explain with standard model parameters (Troja et al., 2017; Li et al., 2018). Indeed, a NS with initial spin-down luminosity of at s and a luminosity evolution (gravitational wave spindown dominated regime) can account for the multi-wavelength evolution of AT2017gfo without the need of introducing a large amount of ejecta mass and an unreasonably small opacity (Li et al., 2018). With these parameters, the spin-down luminosity at day is , too low to significantly affect the opacity of the merger ejecta (Metzger & Piro, 2014). This satisfies the observational constraint of a “red kilonova” component as well as the spectral features of lanthanides elements (Kasen et al., 2017; Pian et al., 2017; Troja et al., 2017).
3.3 A NS as the central engine of short GRBs
Previous criticisms to a long-lived NS remnant included the apparent difficulty of producing a short GRB in a neutron star engine (Metzger et al., 2018; Margalit & Metzger, 2017). Mechanisms to produce a short GRB in a neutron star central engine without the introduction of a black hole have been discussed in the literature, including early accretion (Metzger et al., 2008) or magnetic activities due to differential rotation (Fan et al., 2013). A good fraction of short GRBs are found to possess an extended “internal plateau”(Troja et al., 2007), which suggested the existence of a supra-massive or stable neutron star (Rowlinson et al., 2013; Lü et al., 2015). Interpreting these features within the neutron star engine model indeed require significant energy loss in the gravitational wave channel (Gao et al., 2016).
3.4 Late time X-ray variability and a long-lived magnetized NS
On top of the overall trend produced by the relativistic outflow, X-ray monitoring of the source exhibited a candidate X-ray flare. Between January 17 and January 28 2018, six consecutive X-ray observations displayed a variation by a factor in the X-ray flux (Figure 1). The sparse sampling of X-ray observations prevents a search of similar temporal variations at other epochs.
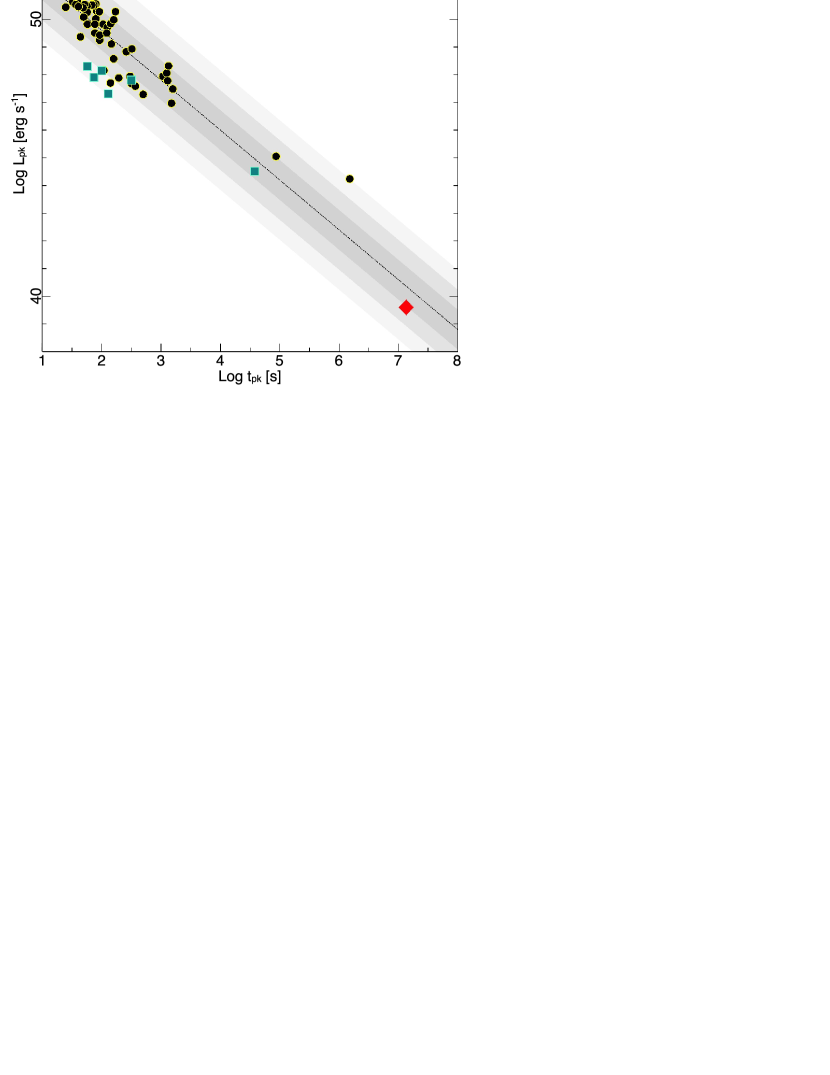
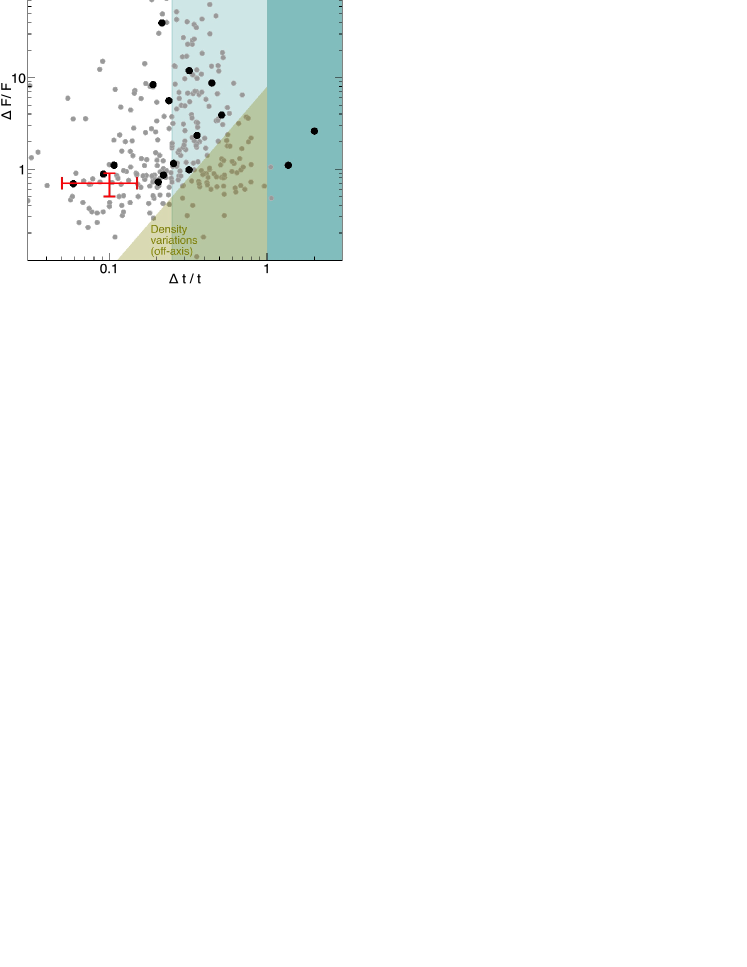
X-ray flares are erratic temporal features, commonly seen in GRB afterglows, and often attributed to a re-activation of the central power source (Burrows et al., 2005; Zhang et al., 2006; Chincarini et al., 2007). Their emission peaks in the X-ray range, and is often undetected at other energies (Troja et al., 2015). The X-ray observations of GW170817 do not sample the entire temporal profile of the candidate flare, thus preventing a detailed comparison with the population of GRB X-ray flares. Nevertheless, some of its basic properties can be estimated. The similar fluxes measured at 155 and 157 days, followed by a rapid decay phase, suggest that the emission peaked around those dates. The peak time, 156 d, and peak luminosity, erg s-1, fall within the expected range of values derived by extrapolating the distribution of GRB X-ray flares (Bernardini et al., 2011) to later times (Figure 4). We conservatively estimate the flare width as the time interval between the two X-ray observations consistent with the baseline continuum, that is t1=137 d and =161 d, which yield 24 d and 0.15. The decay phase observed after 157 d places a lower limit of 6 d and 0.04. Such rapid variability places our candidate flare in a region that is excluded by most afterglow models (Ioka et al. (2005), Figure 5 and Appendix).
Most naturally, and in analogy with X-ray flares in GRBs, the candidate flare observed in GW170817 is likely related to a central engine that is still active at late times. This scenario receives support from the so-called “curvature effect” test (Liang et al., 2006). Any flare is bound to follow a temporal decay shallower than (Kumar & Panaitescu, 2000), where and, in our case, (Troja et al., 2018b). By using the merger time as our reference time , the measured power law decay slope of the flare is , greater than the predicted value. This is likely due to a mis-identified zero time (Zhang et al., 2006). By imposing that 2.58 and fitting for , we find that is d. This marks the beginning of the flare, which is consistent with our hypothesis that the central engine was reactivated to power the flare.
If the final merger product is a BH, then its re-activation could be due to either fallback accretion (Rosswog, 2007) or disc fragmentation (Perna et al., 2006). In the former scenario, the total fallback power declines as and, for typical ejecta masses of NS mergers, is 1039 erg s-1 at 160 d after the merger. This is comparable to the observed X-ray luminosity, and would therefore require an unrealistic radiative efficiency in order to accommodate our observations. The latter scenario needs the accretion disc to survive for months, which is not expected based on our understanding of NS mergers (Perna et al., 2006).
As discussed above, a supra-massive or even a permanently stable NS can survive after the merger. Due to its initial rapid differential rotation, this post-merger NS likely has a strong toroidal component of the magnetic field and possibly also a strong poloidal component (Thompson & Duncan, 1993). The untwisting of the toroidal magnetic field may give rise to an abrupt injection of outflows with enhanced wind luminosity with a mechanism similar to GRB X-ray flares (Dai et al., 2006) or bursts and flares of soft gamma-ray repeaters (Thompson & Duncan, 2001). The internal magnetic dissipation of such an outflow (Zhang & Yan, 2011) would give rise to flaring emission observable in X-rays. We estimate the toroidal component of the magnetic field as follows. The total isotropic-equivalent energy of the flare is in the range . This is much smaller than the total spin energy of a new-born millisecond pulsar. If one exclusively attributes the flare energy to the NS magnetic field energy, then erg. Therefore, the required toroidal magnetic field stored in the NS must be G, which is reasonably expected (Thompson & Duncan, 1993).
The dipolar poloidal magnetic field at the NS surface should be G in order to satisfy the upper limits set by the broadband observations. Such a high-toroidal- and low-poloidal- NS is analogous to the source SGR 0418+5729 (Tiengo et al., 2013) that emits magnetar flares but has a dipolar magnetic field (Rea et al., 2010) lower than G.
3.5 Internal magnetic dissipation in the NS outflow
Since the “curvature effect” test (Kumar & Panaitescu, 2000; Liang et al., 2006) suggests restarting of the central engine at the flare, the X-ray emission likely originates from a radius , where d is the decay time scale of the flare. At d after the merger, the external shock blastwave has moved to a distance from the central engine. Around the flare, since the flare happens around the light curve turnover point when the jet tip is visible . Therefore the flare emission is “internal” if the Lorentz factor of the emitting material is . This is consistent with various constraints that GRB X-ray flares have a lower Lorentz factor than GRB themselves (Yi et al., 2015). The trigger of the flare may be through collision-induced magnetic reconnection and turbulence (Zhang & Yan, 2011; Deng et al., 2015) or an external-pressure triggered kink instability (Lazarian et al., 2018). Either way, an enhanced release of the Poynting flux energy due to reconnection is induced, giving rise to the flare emission.
According to the above estimate, the flare emitting region is outside the radius of the non-relativistic merger ejecta, . This can be understood as follows: in the observer’s viewing direction, there is already a funnel opened by the earlier relativistic ejecta that powered the prompt and afterglow emission of GRB 170817A. With continuous energy injection from a spinning-down NS, the funnel would remain open so that the newly ejected enhanced Poynting flux can penetrate through the non-relativistic merger ejecta and reach the large radius where X-ray emission is released.
In order to see whether the funnel remains open, one can compare the pressure of the non-relativistic merger ejecta and the comoving-frame magnetic pressure of the long-lasting pulsar wind. Suppose that the central engine spindown luminosity evolves with time as
| (13) |
the comoving-frame magnetic field strength of the pulsar wind may be estimated as , so that the magnetic pressure scales as . Here we have assumed that the Lorentz factor of the pulsar wind, , does not evolve significantly with time. The gas pressure of the ejecta, on the other hand, scales as assuming adiabatic evolution and no radial spreading of the ejecta. Radiative loss and radial spreading would further steepen the decay. We consider the competition between and at the radius of the ejecta, so that . One can then compare and . For a low- pulsar, the spindown time scale is long. One may make a connection between the spindown time scale and the turn-over time of X-ray emission ( d). Before this time, one has either 0 (dipole-spindown-dominated) or 1 (secular-GW-spindown-dominated). For both cases (and any intermediate value of ), the decay slope of is shallower than the decay slope of . This suggests that the funnel would remain open, and likely would widen as a function of time.
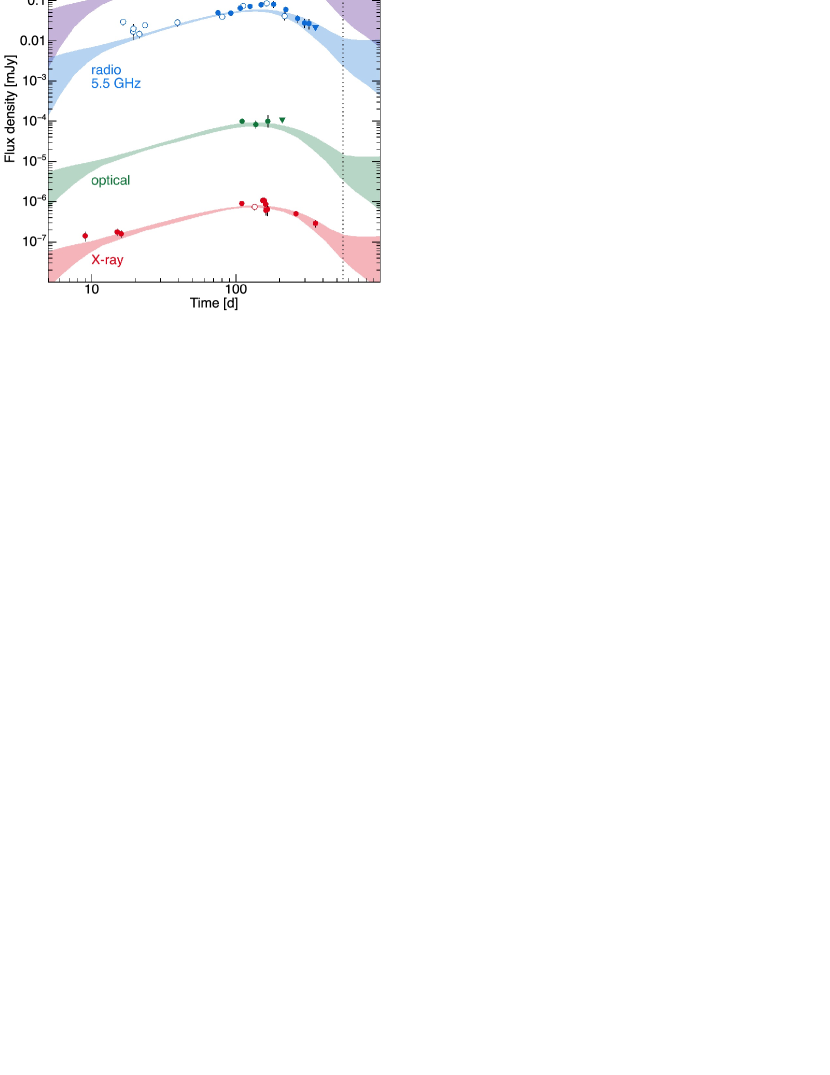
3.6 Effects of energy injection on the afterglow
Starting on August 26 2017 (Troja et al., 2017), X-ray light from the transient GW170817 is being detected by NASA’s Chandra X-ray Observatory and, more recently, by ESA’s XMM-Newton satellite (D’Avanzo et al., 2018). This X-ray emission brightened by a factor of five during the first three months following the NS merger (e.g. Troja et al., 2018b; Margutti et al., 2018), reaching a luminosity at peak of 41039 erg s-1. The temporal evolution of the X-ray signal can be described by a power-law rise, , followed by a smooth turn-over 100 days after the NS merger and then a phase of rapid decay (Troja et al. 2018a). A similar behavior is displayed by the radio and the sparser late-time optical data (Mooley et al., 2018a; Dobie et al., 2018; Lyman et al., 2018) and is well described by models of structured jets (Troja et al., 2018a; Lazzati et al., 2017; Margutti et al., 2018; Xie et al., 2018; Lyman et al., 2018).
The existence of a central engine pulsar could provide additional energy injection to the afterglow blastwave, potentially altering the evolution of the forward shock and the ensuing electromagnetic emission. Energy injection into a blastwave by an underlying pulsar has been extensively studied (Dai & Lu, 1998; Zhang & Mészáros, 2001). For an engine satisfying Eq.(13), in the spectral regime below (where the X-rays seem to lie in), the forward shock flux scales as (Zhang & Mészáros, 2001; Zhang et al., 2006)
| (14) |
which is valid for . The broad-band afterglow spectral index of GW170817 is . The observed rise of the afterglow demands , which is out the scope of the pulsar model. For (relevant for secular-GW-spindown-dominated case), energy injection is essentially negligible. This suggests that energy injection from the NS can at most partially contribute to the observed afterglow emission, and additional energy injection, either from high latitudes of a structured jet or from a stratified ejecta outflow, is needed to reproduce the rising phase of the GW170817 afterglow.
We verified that for (relevant for dipolar-spindown-dominated phase), the engine injection from the pulsar does not alter the afterglow emission provided erg/s. We expanded the Gaussian jet model to include isotropic energy injection of the form until a stop time . To fit this model to the data we perform Bayesian parameter estimation by sampling the posterior probability distribution with a Markov-Chain Monte Carlo (MCMC) package(Foreman-Mackey et al., 2013).
When included in an MCMC run, we find that the energy injection must be a sub-dominant component and obtain an upper limit erg s-1 with 95% confidence. The and parameters are unconstrained, and the other parameters of the jet as presented in Troja et al. (2018a) are unchanged. While energy injection from the pulsar has a negligible effect on the observed afterglow, it may cause a flattening at late times (yr, Figure 6).
4 Conclusions
GW observations constrain the mass of the remnant to , but do not break the degeneracy between a NS and a BH (Abbott et al., 2017b). Depending on the unknown NS equation of state and the spindown history, a supra-massive (up to 20% more massive than the maximum mass of a non-spinning neutron star (Breu & Rezzolla, 2016)) or even a permanently stable NS can survive after the merger. Due to its initial rapid differential rotation, this post-merger NS likely has a strong toroidal component of the magnetic field and possibly also a strong poloidal component (Thompson & Duncan, 1993). Previous criticism to a NS remnant was based on the high X-ray luminosity expected from a spinning NS, found to be marginally consistent with observations only for a relatively small value of the dipole magnetic field (Pooley et al., 2018). However, the aforementioned argument was based on the assumption that the spin down losses are dominated by electromagnetic dipole emission. Here we have analyzed the regime of spin down losses dominated by GW emission, that applies when . In this case the X-ray luminosity is much lower than the EM-dominated regime, by a factor thus relaxing the constraints on the dipole magnetic field (see also Ai et al. 2018). By requiring that the expected flux be below the observed flux we derive a joint constraint on the ellipticity and the dipolar component of the magnetic field, .
Such an ellipticity can be produced by the strong toroidal field that develops due to the differential rotation in a nascent NS after the merger (Rezzolla et al., 2018; Giacomazzo et al., 2015). The strong toroidal field can be responsible for the candidate X-ray flare detected, at a significance, 155 days after the merger. Indeed various properties of the flare (relative duration and amplitude, luminosity, curvature effect) are consistent with those observed in X-ray flares, and attributed to a long-lived central engine. We argue that this could also be the case for GW170817, specifically calling for a long-lived magnetized NS characterized by a strong toroidal component. The untwisting of the toroidal magnetic field may give rise to an abrupt injection of outflows (Thompson & Duncan, 2001; Dai et al., 2006), and the internal magnetic dissipation of such an outflow (Zhang & Yan, 2011) would give rise to the temporal variability observable in X-rays. From the total energy in the flare we estimate that the toroidal component of the magnetic field has to be G, which is reasonably expected (Thompson & Duncan, 1993).
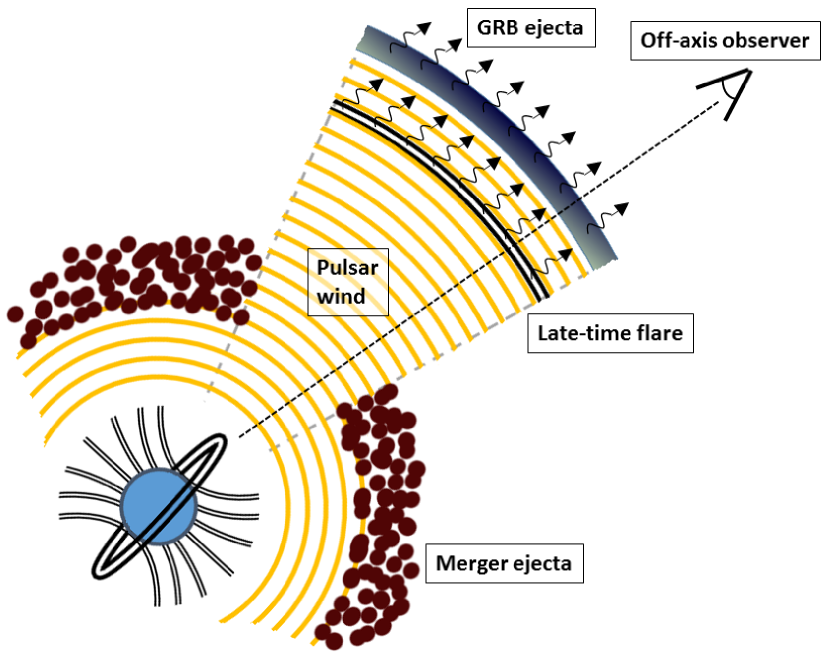
In conclusion, our model envisions a structured jet launched by rapidly spinning long-lived NS with a strong differential magnetic field (Figure 7). The structured jet fully accounts for the broad band non-thermal continuum. The existence of a central engine pulsar would inevitably provide additional energy injection to the blastwave and to the kilonova ejecta. This would influence the emission properties of the broad-band afterglow and the kilonova emission. The impact on the kilonova due to the energy injection of the underlying pulsar has been studied (Yu et al., 2018; Li et al., 2018). Both the early (blue) and late (red) kilonova components can be accounted for with reasonable values of ejected mass and opacity if the neutron star spindown is dominated by gravitational wave losses (Li et al., 2018). In this regime we have verified that energy injection into the blast-wave due to central engine is negligibly small, which does not affect the best fitting parameters of the structured jet. While energy injection from the pulsar has a negligible effect on the observed afterglow, it may cause a flattening at late times ( yr). Abrupt magnetic reconnection of the strong toroidal component launches brief relativistic outflow that produce X-ray flares via magnetic dissipation.
The sparse sampling of the afterglow did not allow us to robustly detect and characterize its temporal variability. Future X-ray campaigns of GW counterparts should aim at providing adequate sampling of the light curve, needed to firmly establish and characterize short-term temporal variability and its connection with the central engine.
If the remnant of GW170817 is a long-lived NS, then the maximum mass of a non-spinning NS should be at least greater than (Ruiz et al., 2018; Rezzolla et al., 2018; Margalit & Metzger, 2017), superseding the current lower limit of set by PSR J1614-2230 (Demorest et al., 2010). This new limit would eliminate essentially all the soft neutron star equations of state invoking hyperons and boson condensation (Lattimer & Prakash, 2007) and would support the suggestion (Gao et al., 2016) that a good fraction of NS-NS mergers leave behind supra-massive or stable NSs.
Appendix: Origin of the X-ray variability: afterglow
The rapid variability places our candidate flare in a region excluded by afterglow models (Ioka et al., 2005; Burrows et al., 2005; Piro et al., 2005, Figure 5). At 160 d the forward shock is still moving at a mildly relativistic velocity. The light crossing time across the shock front is then of the same order as the time since the explosion, i.e. (Kumar & Piran, 2000), much longer than observed. In principle a small region of angular size such that can accomodate the observed timescale (Ioka et al., 2005). However, it has been demonstrated both analytically and numerically that, even for strong density perturbations, flux changes are smoothed over much longer time scales (Nakar & Granot, 2007; Gat et al., 2013; Uhm & Zhang, 2014). A further argument is the following. By taking into account the volume of the variable region and the volume of the observable region one derives an upper limit
| (17) |
where the enhancement due to a overdensity is , where is the cooling frequency of the blob. When the density increases as much as to shift the cooling frequency below the observed frequency, there is no longer a gain and the flux remains constant. Thus the maximum gain is . From equation 17, in order to satisfy the flare properties requires Hz. This is not consistent with the value derived for the structured jet model and would require an unplausible low density of the ISM cm-3 for the cocoon model. At the projected distance of GW170817, massive elliptical and S0 galaxies typically have particle densities of cm-3 (Lakhchaura et al., 2018). Even accounting for the smaller mass of NGC4993 (about a factor of four smaller than the median of the Lakhchaura sample), this is still orders of magnitude larger than required for the cocoon model.
In the case of a cocoon, where energy injection by an outflow with a spread of Lorentz factors drives the shock, a strong modulation of the profile over the assumed power-law can produce a bump in the light curve when e.g. a massive late relativistic shell catches up with the shock front. However this interaction will produce bumps that have typically (Kumar & Panaitescu, 2000), thus much longer than observed. In addition the predicted stepwise increase above the baseline does not reproduce the observed flare-like feature. In the case of a structured jet while the broader and slower component will quickly lose its energy in the environment, the (faster) narrow-core of the jet will excavate a free path to the slower ejecta in its wave, thus allowing (Granot et al., 2003). However, as in the previous case, a stepwise light curve is expected. Finally, a structured jet with a significant angular structure (patchy jet) would also give a similar variability time scale , and therefore disfavored.
Acknowledgements
LP acknowledges partial support by the European Union Horizon 2020 Programme under the AHEAD project (grant agreement number 654215).
References
- Abbott et al. (2017a) Abbott B. P., et al., 2017a, ApJ, 848, L12
- Abbott et al. (2017b) Abbott B. P., et al., 2017b, ApJ, 851, L16
- Ai et al. (2018) Ai S., Gao H., Dai Z.-G., Wu X.-F., Li A., Zhang B., Li M.-Z., 2018, ApJ, 860, 57
- Aloy et al. (2005) Aloy M. A., Janka H.-T., Müller E., 2005, A&A, 436, 273
- Bernardini et al. (2011) Bernardini M. G., Margutti R., Chincarini G., Guidorzi C., Mao J., 2011, A&A, 526, A27
- Breu & Rezzolla (2016) Breu C., Rezzolla L., 2016, MNRAS, 459, 646
- Burrows et al. (2005) Burrows D. N., et al., 2005, Science, 309, 1833
- Cash (1979) Cash W., 1979, ApJ, 228, 939
- Chincarini et al. (2007) Chincarini G., et al., 2007, ApJ, 671, 1903
- Corsi & Mészáros (2009) Corsi A., Mészáros P., 2009, ApJ, 702, 1171
- Cutler (2002) Cutler C., 2002, Phys. Rev. D, 66, 084025
- D’Avanzo et al. (2018) D’Avanzo P., et al., 2018, preprint, (arXiv:1801.06164)
- Dai & Lu (1998) Dai Z. G., Lu T., 1998, A&A, 333, L87
- Dai et al. (2006) Dai Z. G., Wang X. Y., Wu X. F., Zhang B., 2006, Science, 311, 1127
- Dall’Osso & Stella (2007) Dall’Osso S., Stella L., 2007, Ap&SS, 308, 119
- Dall’Osso et al. (2009) Dall’Osso S., Shore S. N., Stella L., 2009, MNRAS, 398, 1869
- Dall’Osso et al. (2018) Dall’Osso S., Stella L., Palomba C., 2018, MNRAS, 480, 1353
- Demorest et al. (2010) Demorest P. B., Pennucci T., Ransom S. M., Roberts M. S. E., Hessels J. W. T., 2010, Nature, 467, 1081
- Deng et al. (2015) Deng W., Li H., Zhang B., Li S., 2015, ApJ, 805, 163
- Deustua (2016) Deustua S., 2016, Space Telescope Science Institute
- Dobie et al. (2018) Dobie D., et al., 2018, ApJ, 858, L15
- Evans et al. (2017) Evans P. A., et al., 2017, Science, 358, 1565
- Fan et al. (2013) Fan Y.-Z., Wu X.-F., Wei D.-M., 2013, Phys. Rev. D, 88, 067304
- Foreman-Mackey et al. (2013) Foreman-Mackey D., Hogg D. W., Lang D., Goodman J., 2013, PASP, 125, 306
- Gao et al. (2015) Gao H., Ding X., Wu X.-F., Dai Z.-G., Zhang B., 2015, ApJ, 807, 163
- Gao et al. (2016) Gao H., Zhang B., Lü H.-J., 2016, Phys. Rev. D, 93, 044065
- Gat et al. (2013) Gat I., van Eerten H., MacFadyen A., 2013, ApJ, 773, 2
- Ghirlanda et al. (2018) Ghirlanda G., et al., 2018, preprint, (arXiv:1808.00469)
- Giacomazzo et al. (2015) Giacomazzo B., Zrake J., Duffell P. C., MacFadyen A. I., Perna R., 2015, ApJ, 809, 39
- Goldstein et al. (2017) Goldstein A., et al., 2017, ApJ, 848, L14
- Gonzaga et al. (2012) Gonzaga S., Hack W., Fruchter A., Mack J., 2012, The DrizzlePac Handbook
- Granot et al. (2003) Granot J., Nakar E., Piran T., 2003, Nature, 426, 138
- Haggard et al. (2017) Haggard D., Nynka M., Ruan J. J., Kalogera V., Cenko S. B., Evans P., Kennea J. A., 2017, ApJ, 848, L25
- Ioka et al. (2005) Ioka K., Kobayashi S., Zhang B., 2005, ApJ, 631, 429
- Jones (1976) Jones P. B., 1976, Ap&SS, 45, 369
- Kargaltsev et al. (2013) Kargaltsev O., Rangelov B., Pavlov G. G., 2013, preprint, (arXiv:1305.2552)
- Kasen et al. (2015) Kasen D., Fernández R., Metzger B. D., 2015, MNRAS, 450, 1777
- Kasen et al. (2017) Kasen D., Metzger B., Barnes J., Quataert E., Ramirez-Ruiz E., 2017, Nature, 551, 80
- Kathirgamaraju et al. (2018) Kathirgamaraju A., Barniol Duran R., Giannios D., 2018, MNRAS, 473, L121
- Kumar & Panaitescu (2000) Kumar P., Panaitescu A., 2000, ApJ, 541, L51
- Kumar & Piran (2000) Kumar P., Piran T., 2000, ApJ, 532, 286
- Lakhchaura et al. (2018) Lakhchaura K., et al., 2018, MNRAS, 481, 4472
- Lasker et al. (2008) Lasker B. M., et al., 2008, AJ, 136, 735
- Lasky & Glampedakis (2016) Lasky P. D., Glampedakis K., 2016, MNRAS, 458, 1660
- Lattimer & Prakash (2007) Lattimer J. M., Prakash M., 2007, Phys. Rep., 442, 109
- Lazarian et al. (2018) Lazarian A., Zhang B., Xu S., 2018, preprint, (arXiv:1801.04061)
- Lazzati et al. (2017) Lazzati D., López-Cámara D., Cantiello M., Morsony B. J., Perna R., Workman J. C., 2017, ApJ, 848, L6
- Lazzati et al. (2018) Lazzati D., Perna R., Morsony B. J., Lopez-Camara D., Cantiello M., Ciolfi R., Giacomazzo B., Workman J. C., 2018, Physical Review Letters, 120, 241103
- Li et al. (2018) Li S.-Z., Liu L.-D., Yu Y.-W., Zhang B., 2018, ApJ, 861, L12
- Liang et al. (2006) Liang E. W., et al., 2006, ApJ, 646, 351
- Lü et al. (2015) Lü H.-J., Zhang B., Lei W.-H., Li Y., Lasky P. D., 2015, ApJ, 805, 89
- Lyman et al. (2018) Lyman J. D., et al., 2018, preprint, (arXiv:1801.02669)
- Margalit & Metzger (2017) Margalit B., Metzger B. D., 2017, ApJ, 850, L19
- Margutti et al. (2018) Margutti R., et al., 2018, ApJ, 856, L18
- Metzger & Piro (2014) Metzger B. D., Piro A. L., 2014, MNRAS, 439, 3916
- Metzger et al. (2008) Metzger B. D., Quataert E., Thompson T. A., 2008, MNRAS, 385, 1455
- Metzger et al. (2018) Metzger B. D., Thompson T. A., Quataert E., 2018, ApJ, 856, 101
- Mooley et al. (2018a) Mooley K. P., et al., 2018a, Nature, 554, 207
- Mooley et al. (2018b) Mooley K. P., et al., 2018b, Nature, 561, 355
- Murase et al. (2018) Murase K., et al., 2018, ApJ, 854, 60
- Nakar & Granot (2007) Nakar E., Granot J., 2007, MNRAS, 380, 1744
- Perna et al. (2006) Perna R., Armitage P. J., Zhang B., 2006, ApJ, 636, L29
- Pian et al. (2017) Pian E., et al., 2017, Nature, 551, 67
- Piro et al. (2005) Piro L., et al., 2005, ApJ, 623, 314
- Pooley et al. (2018) Pooley D., Kumar P., Wheeler J. C., Grossan B., 2018, ApJ, 859, L23
- Radice et al. (2018) Radice D., Perego A., Bernuzzi S., Zhang B., 2018, MNRAS, 481, 3670
- Rea et al. (2010) Rea N., et al., 2010, Science, 330, 944
- Rezzolla et al. (2018) Rezzolla L., Most E. R., Weih L. R., 2018, ApJ, 852, L25
- Rosswog (2007) Rosswog S., 2007, MNRAS, 376, L48
- Rowlinson et al. (2013) Rowlinson A., O’Brien P. T., Metzger B. D., Tanvir N. R., Levan A. J., 2013, MNRAS, 430, 1061
- Ruiz et al. (2018) Ruiz M., Shapiro S. L., Tsokaros A., 2018, Phys. Rev. D, 97, 021501
- Savchenko et al. (2017) Savchenko V., et al., 2017, ApJ, 848, L15
- Schlafly & Finkbeiner (2011) Schlafly E. F., Finkbeiner D. P., 2011, ApJ, 737, 103
- Smartt et al. (2017) Smartt S. J., et al., 2017, Nature, 551, 75
- Tanvir et al. (2017) Tanvir N. R., et al., 2017, ApJ, 848, L27
- Thompson & Duncan (1993) Thompson C., Duncan R. C., 1993, ApJ, 408, 194
- Thompson & Duncan (2001) Thompson C., Duncan R. C., 2001, ApJ, 561, 980
- Tiengo et al. (2013) Tiengo A., et al., 2013, Nature, 500, 312
- Troja et al. (2007) Troja E., et al., 2007, ApJ, 665, 599
- Troja et al. (2015) Troja E., Piro L., Vasileiou V., Omodei N., Burgess J. M., Cutini S., Connaughton V., McEnery J. E., 2015, ApJ, 803, 10
- Troja et al. (2017) Troja E., et al., 2017, Nature, 551, 71
- Troja et al. (2018a) Troja E., et al., 2018a, preprint, (arXiv:1808.06617)
- Troja et al. (2018b) Troja E., et al., 2018b, MNRAS, 478, L18
- Uhm & Zhang (2014) Uhm Z. L., Zhang B., 2014, ApJ, 789, 39
- Verbunt et al. (1996) Verbunt F., Kuiper L., Belloni T., Johnston H. M., de Bruyn A. G., Hermsen W., van der Klis M., 1996, A&A, 311, L9
- Xie et al. (2018) Xie X., Zrake J., MacFadyen A., 2018, ApJ, 863, 58
- Yi et al. (2015) Yi S.-X., Wu X.-F., Wang F.-Y., Dai Z.-G., 2015, ApJ, 807, 92
- Yu et al. (2013) Yu Y.-W., Zhang B., Gao H., 2013, ApJ, 776, L40
- Yu et al. (2018) Yu Y.-W., Liu L.-D., Dai Z.-G., 2018, ApJ, 861, 114
- Zhang & Mészáros (2001) Zhang B., Mészáros P., 2001, ApJ, 552, L35
- Zhang & Yan (2011) Zhang B., Yan H., 2011, ApJ, 726, 90
- Zhang et al. (2006) Zhang B., Fan Y. Z., Dyks J., Kobayashi S., Mészáros P., Burrows D. N., Nousek J. A., Gehrels N., 2006, ApJ, 642, 354
- van Putten & Della Valle (2018) van Putten M. H. P. M., Della Valle M., 2018, MNRAS,