Time resolved spectroscopy of dust and gas from extrasolar planetesimals orbiting WD 1145+017 ††thanks: Based on service observations (proposal SW2015b15) made with the William Herschel Telescope operated on the island of La Palma by the Isaac Newton Group of Telescopes in the Spanish Observatorio del Roque de los Muchachos of the Instituto de Astrofísica de Canarias.
Abstract
Multiple long and variable transits caused by dust from possibly disintegrating asteroids were detected in light curves of WD 1145+017. We present time-resolved spectroscopic observations of this target with QUCAM CCDs mounted in the Intermediate dispersion Spectrograph and Imaging System at the 4.2-m William Herschel Telescope in two different spectral arms: the blue arm covering 3800–4025 Å and the red arm covering 7000–7430 Å. When comparing individual transits in both arms, our observations show with significance an evident colour difference between the in- and out-of-transit data of the order of 0.05–0.1 mag, where transits are deeper in the red arm. We also show with significance that spectral lines in the blue arm are shallower during transits than out-of-transit. For the circumstellar lines it also appears that during transits the reduction in absorption is larger on the red side of the spectral profiles. Our results confirm previous findings showing the u′-band excess and a decrease in line absorption during transits. Both can be explained by an opaque body blocking a fraction of the gas disc causing the absorption, implying that the absorbing gas is between the white dwarf and the transiting objects. Our results also demonstrate the capability of EMCCDs to perform high-quality time resolved spectroscopy of relatively faint targets.
keywords:
methods: observational – methods: data analysis – techniques: spectroscopic – stars: individual: WD 1145+017.1 Introduction
Most Milky Way stars are orbited by planets (Cassan et al., 2012), and more than 97 per cent are expected to end their lives as white dwarfs (Althaus et al., 2010). However, the evolution of host stars after the main sequence will change properties of original planetary systems. While planets closer than approximately 5 AU will most likely not survive the post-main-sequence lifetime of their parent star, any planet with semimajor axis greater than approximately 5 AU will survive, and its semimajor axis will increase due to stellar mass loss (Burleigh et al., 2002; Debes & Sigurdsson, 2002). Numerical integrations show that some planets in previously stable orbits around a star undergoing mass loss will become dynamically unstable, because the stability of adjacent orbits to mutual planet-planet perturbations depends on the ratio of the planet mass to the central star’s mass (Debes & Sigurdsson, 2002). A planetesimal whose orbit is significantly perturbed can be ejected from the system, but in some cases may instead get sufficiently close to the white dwarf that tidal forces will be capable of disrupting it (Jura, 2003; Veras et al., 2014).
The indirect evidence of such disrupting events is the presence of debris discs around at least 4 per cent of white dwarfs (Rocchetto et al., 2015) and metal lines in the spectra of around 25–50 per cent of white dwarfs (Zuckerman et al., 2010; Koester et al., 2014). Theoretical works predict that circularisation of the dust resulting from the disrupting event forms a circumstellar debris disc. Within the disc, dust grains lose angular-momentum and are eventually sublimated and subsequently accreted onto the white dwarf, resulting in the appearance of metal lines in the stellar spectrum (Jura, 2003; Debes et al., 2012). Since the strong surface gravity of white dwarfs causes all heavy elements to settle below the photosphere on time-scales of days to Myrs (Wyatt et al., 2014), ‘pollution’ in white dwarfs is a strong indication of external ongoing accretion. It was shown that the accreted material does not originate from the interstellar medium (Farihi et al., 2010) and its composition is similar to terrestrial material in the Solar system (Zuckerman et al., 2007; Klein et al., 2010; Gänsicke et al., 2012). The most likely interpretation is that these white dwarfs are contaminated by circumstellar matter, i.e. the rocky remains of terrestrial planetary systems (Farihi et al., 2010).
1.1 WD 1145+017
So far the most compelling confirmation of the remnant planetary system has been the detection of asymmetric transits in the light curve of WD 1145+017 (hereafter WD 1145) (Vanderburg et al., 2015), caused by the material from possibly disintegrating planetesimal orbiting near the Roche limit. WD 1145 also shows an infra-red excess characteristic for a dust disc (Vanderburg et al., 2015), and metal photospheric lines in its spectrum (Xu et al., 2016; Redfield et al., 2017). In addition, a circumstellar gas was detected in WD 1145 by Xu et al. (2016), through observing numerous circumstellar absorption lines with line widths of approximately km s-1. No significant magnetic field was detected (Farihi et al., 2018).
Transits of WD 1145 first discovered in data from Kepler extended mission K2 (Howell et al., 2014) showed several distinct periods in the range of 4.5–4.9 h and were variable in depth (Vanderburg et al., 2015). Asymmetric transits were also observed during the first ground-based follow up (Croll et al., 2017). Subsequent ground-based observations (Gänsicke et al., 2016; Rappaport et al., 2016; Gary et al., 2017; Rappaport et al., 2018) showed that most of transits are fairly symmetric and the system evolves quickly, with the overall dip activity increasing from 2014 (Kepler K2) until mid-2017, with only a small activity decrease in mid-2016. Rappaport et al. (2016) found that nearly all transits appear to drift systematically in phase with respect to the presumed orbital period of an asteroid. They explain this drifting motion as due to smaller fragmented bodies that break off from the asteroid and go into a slightly shorter-period orbit. The fragments are heated up by the white dwarf until there is a freely escaping flow of vapours which then condense into dust clouds. Radiation pressure from the white dwarf may then push some of the dust into a trailing configuration analogously to solar system comets. They estimate that these fragments last for only a few weeks before disintegrating, with the maximum observed longevity of > 58 days. Gary et al. (2017) observed fragments with lifetimes up to half a year, and explain it using quasi-continual dust production. They also assume that collisions are behind some of the observed transit events. Rappaport et al. (2018) reported the highest level of optical activity of WD 1145 since the discovery, and observed some transits lasting up to 2 hours. This is a clear change compared to earlier observations with transit duration of 3–12 minutes (Gänsicke et al., 2016).
There have been several attempts to detect varying transit depth of WD 1145 in multiwavelength observations to constrain the properties of the transiting material. Croll et al. (2017) compared the transit depths in the V- and R-bands, and found no significant difference, concluding that the radius of dust particles must be equal to or larger, or or smaller. Alonso et al. (2016) observed in the wavelength range 480–920 nm, and found no significant differences in the flux between four bands centred at 530, 620, 710 and 840 nm, from which particle sizes can be excluded for most common minerals. Zhou et al. (2016) performed simultaneous observations in the optical and near-infrared, over the wavelength range of 0.5–1.2, with no measurable difference in transit depths for multiple photometric pass-bands, allowing them to place a lower limit of on the grain size in the putative transiting debris cloud. Xu et al. (2018) presented observations in the optical, and bands, and found the same transit depths at all wavelengths from which they conclude that there is a deficit of small particles (with radii ) in the transiting material. Most recently, results from simultaneous fast optical spectrophotometry and broad-band photometry of WD 1145 were published by Izquierdo et al. (2018), who found no significant colour differences between five wavelength bands over the wavelength range 4300–9200 Å.
Interestingly, Hallakoun et al. (2017) reported the detection of ‘bluing’ during transits, when transits are deeper in the redder bands, with a ur′ colour difference of up to mag. They concluded that the observed colour difference is most likely due to reduced circumstellar absorption in the spectrum during transits, which indicates that the transiting objects and the gas share the same line-of-sight, and that the gas covers the white dwarf only partially, as would be expected if the gas, the transiting debris, and the dust causing the infrared excess are part of the same general disc structure.
The suggestion of reduced circumstellar absorption during transits is further supported by Redfield et al. (2017), who found short-term variability in the circumstellar gas lines coinciding with the most significant photometric transits. They observed that the absorption on the red side of spectral profiles decreased during transits, and concluded that gas is between the white dwarf and transiting objects. They also observed circumstellar absorption variability on a scale of months, when over the course of a year blueshifted absorption disappeared, while redshifted absorption systematically increased. They proposed an eccentric inclined disc that can explain both long and short-term variations. Recently, Cauley et al. (2018) reported that over the course of 2.2 years their spectra show complete velocity reversals in the circumstellar absorption, moving from strongly redshifted in April 2015 to strongly blueshifted in June 2017. They suggest that eccentric circumstellar gas rings undergoing general relativistic precession with a precession period of approximately 5.3 years can explain the velocity reversals. Having simultaneous spectrophotometry and photometry of WD 1145, Izquierdo et al. (2018) recently unambiguously confirmed the equivalent width decrease of the circumstellar absorption lines during the deepest and longest transit in their observations, supporting spatial correlation between the circumstellar gas and dust.
To aid understanding the WD 1145 system, in this study we present time resolved optical spectroscopy that has sufficient spectral resolution to measure line strengths and circumstellar gas velocities, and at the same time provides high time resolution to sample transits by material possibly from disintegrating planetesimals with a typical duration of few minutes. In Sects. 2 and 3 we describe our observations and data reduction procedure. The photometric and spectroscopic data analysis is presented in Sects. 4.1 and 4.2, and we discuss our results in Sect. 5.
2 Observations
We observed WD 1145 on the night of 2016 January 7 with the QUCAM CCDs (Tulloch & Dhillon, 2011) mounted in the Intermediate dispersion Spectrograph and Imaging System (ISIS) at the 4.2-m William Herschel Telescope, La Palma, Spain. ISIS is a double-armed, medium-resolution long-slit spectrograph. Use of dichroic filters permits simultaneous observing in the blue and red arms. QUCAM2 and QUCAM3 are electron-multiplying CCD cameras in which the signal is amplified before readout, capable of performing high-speed or faint-target spectroscopy. In addition, both CCDs have a frame-transfer buffer which allows on chip storage of an image so that an exposure can be started while the previous one is still being read out. We used fast mode with an exposure time of 3.6 s (the minimum readout time of full frames for QUCAMs in fast mode) and cubes of 150 images before each read-out. The advantage of fast mode is minimized dead-time and essentially zero readout noise.
We used a wide (10 arcsec) slit to minimize systematic errors and slit losses, while also preventing a significant contribution from the sky background (e.g. Gibson et al., 2013). To better monitor our systematic errors, we used full-frame readout in order to observe the reference star 2MASS 11482519+0130345 simultaneously with our target. With the R1200B grating on the ISIS blue arm, the QUCAM3 provided a wavelength coverage of 225 Å. This allowed us to cover the strong Ca ii H & K lines, and He i 3888.65 Å line (from 3800–4025 Å). With the R600R grating on the ISIS red arm, we selected a region from 7000–7430 Å which is relatively clean from telluric lines, while also offering a significant wavelength baseline to allow for the grain-size to be measured.
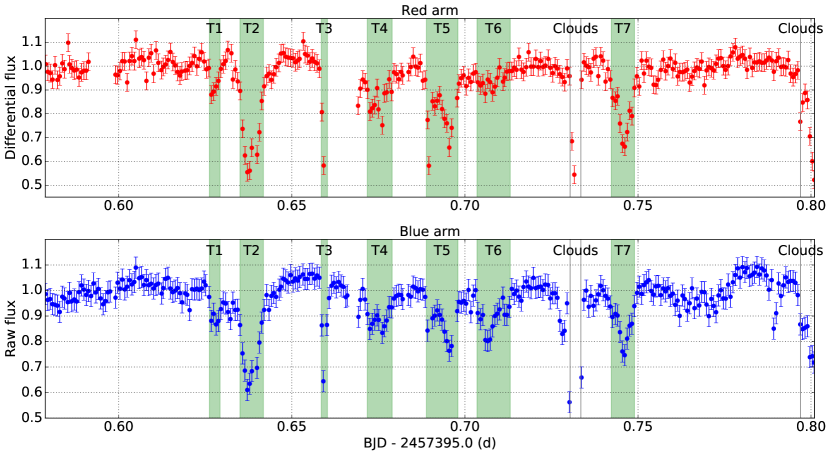
The observations took place from 1:50 to 7:11 UT on 2016 January 8, when we obtained 4650 and 4950 spectra in the red and blue arms of ISIS, respectively. The difference is due to a technical problem where two cubes in the red arm were not saved. This occurred around 2:23 and 4:01 UT where we lost approximately 20 minutes of red-arm observations. For the subsequent analysis, we removed the first spectrum in each cube of 150 spectra, due to the difference in integration-time for the first frame compared to the remainder. During the observations the seeing was around 1 arcsec or better. Conditions were photometric at least until 4:00 UT, based on a transparency plot from the SuperWASP survey (Pollacco et al., 2006) from the same night. Afterwards, thin clouds were likely around until about 5:30 UT, when there was an obvious cloud crossing for about 5 minutes. The guiding was lost for several seconds, but recovered promptly. At 7:00 UT more clouds passed, which also coincided with the end of the night (see Fig. 1). Between 5:30 and 7:00 UT there was likely to be more thin clouds present.
3 Data reduction
We used iraf111The Image Reduction and Analysis Facility (iraf) is distributed by the National Optical Astronomy Observatories, which are operated by the Association of Universities for Research in Astronomy, Inc., under cooperative agreement with the National Science Foundation. for bias subtraction and wavelength calibration. Arc spectra were taken just before and after the observations. The wavelength solution was determined by a linear interpolation between the two sets of arcs. We used data without a flat-field correction, as this provided light curves with a lower rms. The spectra of WD 1145 and the reference star were slightly tilted. Because they both have low count levels (their fluxes are only a few photo-electrons per wavelength step per frame), it is difficult to accurately fit the trace of the spectra in each individual frame. If the spectral trace is constant in time, we could stack multiple frames to overcome this problem. Unfortunately, we found that positions of spectra were moving along the spatial direction with timescales of roughly 1–2 minutes with a semi-amplitude of 2–3 pixels, equivalent to about 0.5 arcsec. Therefore, we used python to implement the following data reduction strategy. First, we determined a 2nd order polynomial trace and profile for optimal extraction for both stars after stacking each cube of 150 images. Then, we collapsed each individual image within each cube in the dispersion direction, taking into account the spectral tilt, and fitted a Gaussian function to both stellar profiles to get offsets in the spatial direction with respect to the original trace. Finally, we extracted each individual spectrum by summing all flux in the aperture 17 pixels wide. We note that as we are using EMCCDs, this does not introduce extra noise, as the readout noise is essentially zero. We used a trace corrected for offsets in the spatial direction. The sky regions for the background subtraction were shifted by the same offsets and were located on both sides of a stellar aperture with a size of 41 pixels each. To remove cosmic rays we used a median filter on data with a size of 11 by 11 pixels, and set a level of cosmic rays to 1200 counts above median.
4 Data analysis
4.1 Photometric time series
We summed the flux over each extracted spectrum to obtain a photometric signal for the target and a reference star. In the red arm, we constructed a differential light curve by dividing the two time-series. In the blue arm, however, this was not possible due to the reference star being too faint. In Fig. 1 we show light curves binned to an effective exposure time of 1 minute. The top panel of Fig. 1 shows the differential light curve for the red arm, and the bottom panel shows the raw light curve for the blue arm. Both light curves were normalized by fitting a 4th order polynomial to the out-of-transit data. Photometric uncertainties were calculated as rms errors over out-of-transit normalized light curves, using data binned in 1 minute in time, and were assumed to be constant in time.
We observed six full transits, shown in Fig. 1, and one partial transit (T3), which unfortunately coincided with the technical issues in the red arm resulting in the loss of about 10 minutes of observations. The normalization of the entire (masked) light curve with a 4th order polynomial of time was not optimal, particularly for the blue arm, and therefore we normalized each full transit separately by fitting a 1st order polynomial to the out-of-transit data immediately before and after the transit. These final, normalized light curves are shown in Fig. 2 along with their differences for all six full transits. Photometric uncertainties were calculated in the same way as before, but only using out-of-transit data immediately before and after each transit. The out-of-transit data used for a normalization and error calculations are displayed in Fig. 2, and we assumed constant uncertainties over each time interval.
Our observations (except for transit T6) show an evident colour difference between the in- and out-of-transit photometry, of the order of 0.05–0.1 mag, where transits are deeper in the red arm (see Fig. 2). We calculated the significance level of this detection from the differences of the red and blue light curve between the mid-ingress and mid-egress of each transit. The resulting significance levels and colour differences are shown in Table 1. We measured the most significant colour difference for transit T7 with 20 significance. Similar results were reported by Hallakoun et al. (2017) who detected bluing with 2–3 significance, i.e. deeper transits in the redder bands (ur′ of up to ).
| Transit | T1 | T2 | T4 | T5 | T6 | T7 |
| Red-Blue (mag) | -0.06 | -0.10 | -0.05 | -0.10 | +0.15 | -0.10 |
| Significance () | >2 | 14 | 5 | 15 | 16–20 | 20 |
In our analysis, we compared a differential light curve for the red arm (i.e. corrected with the reference star) and a raw light curve for the blue arm (i.e. with no reference star). For a consistency check, we also compared raw light curves for both arms. For all transits except for transit T6, differences between using differential and raw light curves for the red arm are insignificant, and so our results are also valid in this case. This is expected as the conditions were photometric during most of the night, and long term trends were removed by our analysis.
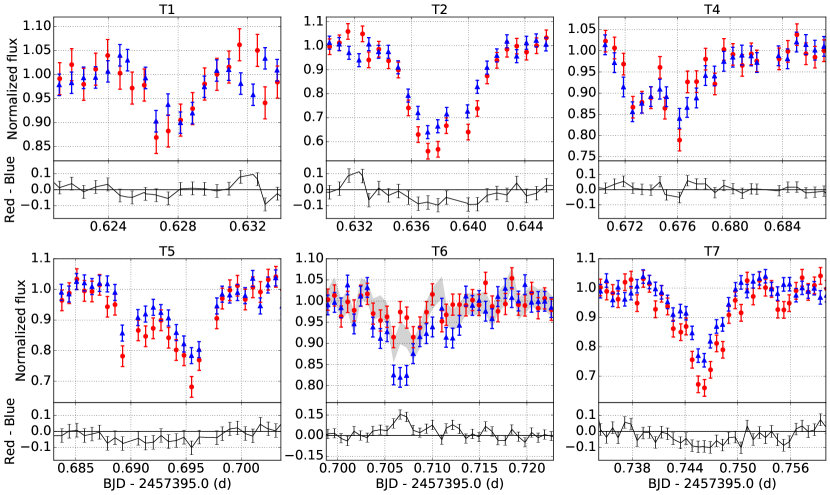
However, during transit T6, we observed the transit being deeper by about 0.15 mag in the blue arm compared to the differential flux in the red arm, with significance. This is the only transit for which we observe any significant difference between differential and raw fluxes in the red arm. In Fig. 2, for transit T6 we also show the raw flux for the red arm (grey shaded region). If we compare raw fluxes in both arms transit T6 is still deeper in the blue arm, with a slightly lower significance of . If this transit is real, it could be a sign of small dust grains in the transiting material, however, a signal faded and a full width at half maximum of stellar spectra degraded for a significant amount of time during transit T6, and we suspect that a thin cloud was passing by our field. This would also explain the difference between the differential and raw flux in the red arm, which is consistent during the remainder of the observations. We include transit T6 here as we detect a transit-like feature in the differential light curve, but conclude that this is most likely the result of imperfections of the differential photometry when thin clouds are passing by.
4.2 Spectroscopic time series
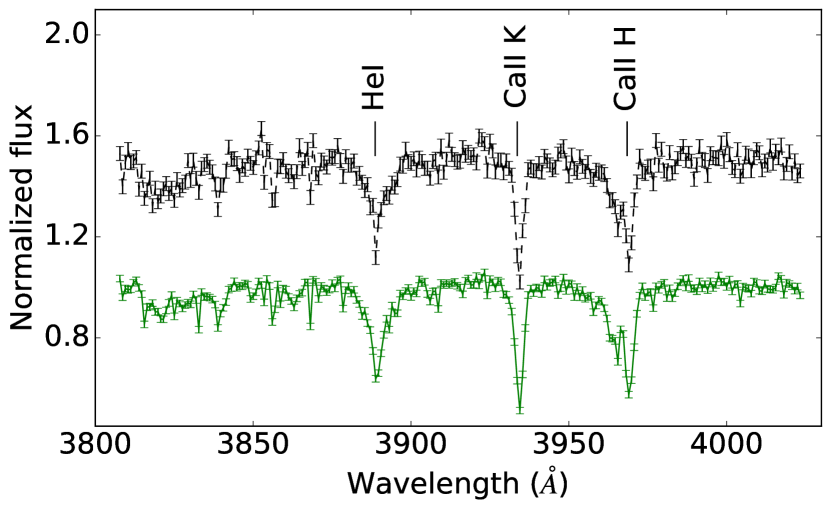
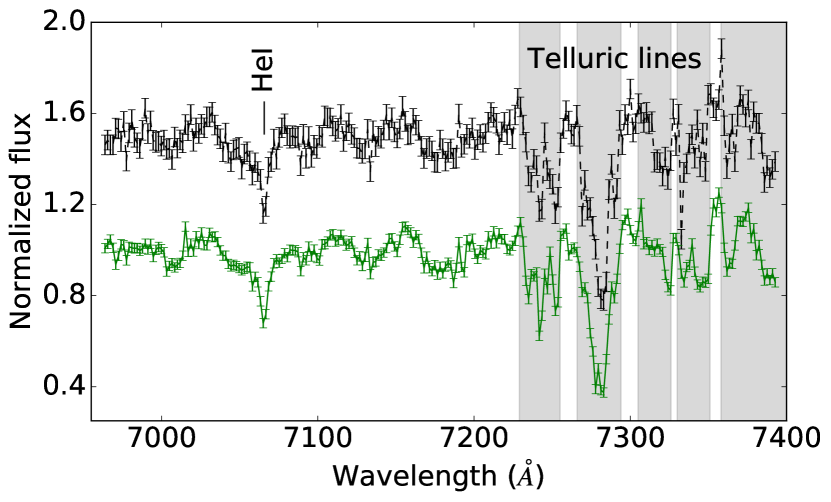
To normalize the data, we fitted a 6th order Legendre function in the continuum of all combined spectra and then divided each individual spectrum by this function. Our observations lasted for more than 5 hours, and in order to correct for atmospheric refraction at higher airmass, we fitted a second order polynomial to each spectrum to correct for possible tilts between individual spectra. From the red-arm differential light curve (see Fig. 1 top), we determined in- and out-of-transit times. During the out-of-transit times, we averaged spectra over 10 minute intervals, except for the last interval in each out-of-transit range for which spectra were averaged over the remaining time. This was typically more than 2.5 minutes, otherwise the continuum scatter was too high and the data were discarded. During the in-transit times, we averaged spectra over the whole transit duration (see Fig. 1, green background areas). We then binned all of the resulting spectra by 4 pixels in wavelength. We applied barycentric corrections to time and radial velocities using BarCor222http://www.ing.iac.es/mh/, and we adopted the system’s radial velocity of km s-1 (Xu et al., 2016; Redfield et al., 2017). In Fig. 3 and Fig. 4 we show averages of all out-of-transit and in-transit spectra for the blue and red arms, respectively. The uncertainties were calculated as a standard deviation of points out of the spectral lines over the wavelength and also over time, when we assumed that they are constant in wavelength or time. Resulting errors of the two approaches were comparable, and we used the former for the final interpretation of data. In the subsequent analysis, we will focus on the following lines: He i 3888.65 Å, Ca ii 3933.66 Å (K line) and Ca ii 3968.47 Å (H line) in the blue arm, and He i 7065 Å line in the red arm, which is free of contamination from telluric lines (see Fig. 4).
We measured that the position of lines was changing during the observations despite of earlier correction of the wavelength scale between the beginning and end of time-series. This is most likely due to the atmospheric differential refraction. In the blue arm, between the beginning and end of observations, He i 3888.65 Å line changed the position by 0.40 Å, Ca ii 3933.66 Å line by 0.44 Å and Ca ii 3968.47 Å line by 0.50 Å. Also, the observed spectral line wavelengths are redder than air wavelengths for all three lines (see Table 2). In the red arm, between the beginning and end of observations, He i 7065 Å line changed the position by 0.80 Å. The expected change of line positions between the beginning and end of observations due to the atmospheric differential refraction is approximately 0.44 and 0.68 Å for the blue and red arm, respectively, which agrees well with our measurements.
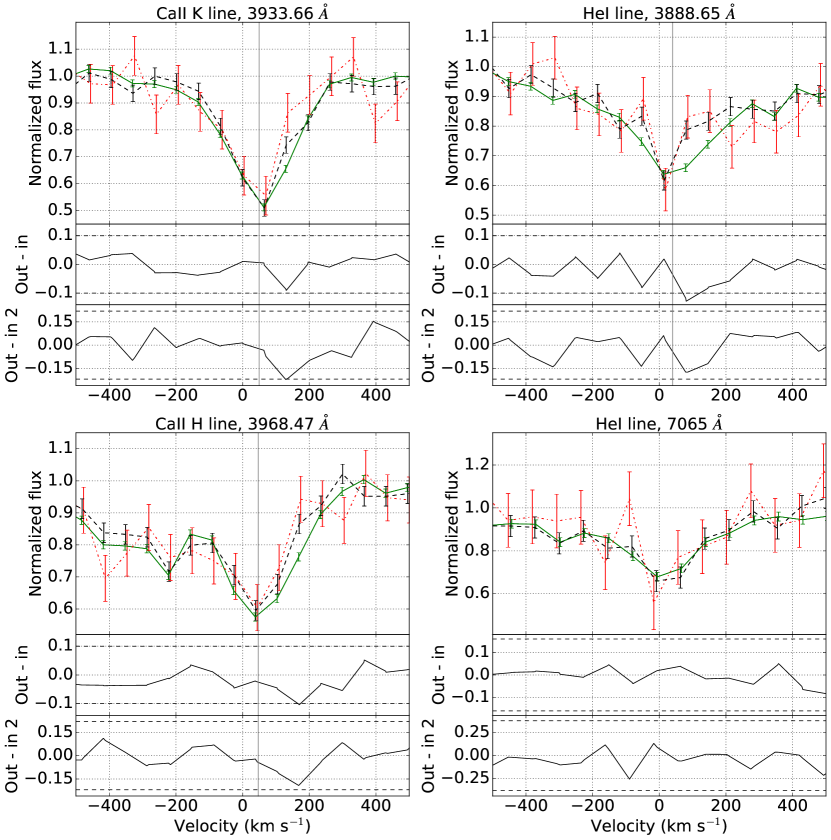
To assess whether there is a difference in spectral lines during transits compared to out-of-transit, for each line in the blue arm and the He i line in the red arm we show in Fig. 5 in upper panels the average of all out-of-transit (green solid line) and all (except transit T6, which was excluded due to its speculative nature) in-transit spectra (black dashed line). We also display in-transit spectrum during transit T2 (red dash-dotted line), which was the deepest transit during our observations. For each line in Fig. 5 we plot in middle panels the difference between average out-of-transit and in-transit spectrum, and in bottom panels the difference between average out-of-transit and in-transit T2 spectrum (black solid lines). The uncertainties were calculated as a standard deviation of points out of the spectral lines over the wavelength when we assumed that they are constant in wavelength.
For all three spectral lines in the blue arm, we detect with significance shallower lines during transits compared to the out-of-transit data (see Fig. 5). The significance level was calculated from the differences of the out-of-transit and in-transit spectra across each line profile. It also appears that during transits the reduction in absorption is larger on the red side of a spectral profile for the two circumstellar lines (Ca ii K and H). This has been reported by Redfield et al. (2017) who observed that the absorption on the red side of spectral profiles decreased during transits on 2016 March 29 and 2016 April 08. They explored time-resolved spectra and observed variations from the mean profile in a significant fraction (i.e., >10 per cent) of velocities across the circumstellar profile. Recently, Izquierdo et al. (2018) unambiguously confirmed the equivalent width decrease of the circumstellar absorption lines during the deepest and longest transit in their observations, supporting spatial correlation between the circumstellar gas and dust. Surprisingly, we also observe a reduction in absorption during transits for the photospheric He i 3888.65 Å line, which has a similar behaviour as the two circumstellar lines in the red side of a spectral profile, but in addition has a decreased absorption in the blue side of a spectral profile. For the He i line in the red arm we do not observe any differences of a spectral line profile between in-transit and out-of-transit spectra (see Fig. 5). This could be explained by a higher excitation energy of this line compared to the He i 3888.65 Å line.
We note that our results are not caused by variable seeing during observations. In order to check this, we made Fig. 5 using only out-of-transit data in the best seeing, and the differences between in-transit and out-of-transit line shapes were even larger.
| sp. line | Air | Observed | difference | |
|---|---|---|---|---|
| Å | Å | Å | km s-1 | |
| He i | 3888.65 | 3889.17 | 0.52 | 40 |
| Ca ii | 3933.66 | 3934.31 | 0.65 | 50 |
| Ca ii | 3968.47 | 3969.09 | 0.62 | 47 |
5 Conclusions
We present time resolved spectroscopy of WD 1145, discovered to exhibit transiting signals of orbiting material. The observations were taken on the night of 2016 January 7 with electron-multiplying frame-transfer CCD cameras (QUCAMs) (Tulloch & Dhillon, 2011), in two different spectral ranges: the blue (from 3800–4025 Å) and the red (from 7000–7430 Å). While the individual exposures have a low signal-to-noise per spectral pixel (exposure times were 3.6 s), the lack of readout noise with QUCAM CCDs means that we could choose the temporal binning of the light curve to optimize between signal-to-noise ratio, spectral resolution and time resolution based on the observed transit depths and durations.
When comparing individual transits in two different spectral ranges, our observations show with significance an evident colour difference between the in- and out-of-transit data, of the order of 0.05–0.1 mag, where transits are deeper in the red arm. The bluing is surprising and not usual in dusty environments, typically showing reddening. Our observations thus confirm findings of Hallakoun et al. (2017), who detected bluing with 2–3 significance, of the order of ur′ up to .
The analysis of spectral lines in the blue arm shows with significance that lines are shallower during transits compared to the out-of-transit data. It also appears that during transits the reduction in absorption is larger on the red side of a spectral profile for the two circumstellar lines (Ca ii K and H). This confirms results reported by Redfield et al. (2017) who observed that the absorption on the red side of spectral profiles decreased during transits on 2016 March 29 and 2016 April 08. They explored time-resolved spectra and observed variations from the mean profile in a significant fraction (i.e., >10 per cent) of velocities across the circumstellar profile. Recently, Izquierdo et al. (2018) unambiguously confirmed the equivalent width decrease of the circumstellar absorption lines during the deepest and longest transit in their observations, supporting spatial correlation between the circumstellar gas and dust. Surprisingly, we also observe a reduction in absorption during transits for the photospheric He i 3888.65 Å line, which has a similar behaviour as the two circumstellar lines in the red side of a spectral profile, but in addition has a decreased absorption in the blue side of its spectral profile. For the He i line in the red arm we do not observe any differences of a spectral line profile between in-transit and out-of-transit spectra, but this can be explained by a higher excitation energy of this line compared to the He i 3888.65 Å line.
Both detections of wavelength-dependent transits for WD 1145 (this analysis and Hallakoun et al. (2017)) are the only ones so far which included observations in the u′-band range, where WD 1145 displays many broad absorption lines caused by circumstellar gas. The fact that other studies (Alonso et al., 2016; Zhou et al., 2016; Croll et al., 2017; Izquierdo et al., 2018; Xu et al., 2018) did not observe wavelengths shorter than 4300 Å could explain why they did not detect bluing. As discussed by Hallakoun et al. (2017) and Redfield et al. (2017), the most plausible explanation for the u′-band excess during transits is the reduced circumstellar absorption along the line-of-sight. As suggested by Redfield et al. (2017), the decrease in line absorption during transits can be explained if an opaque body, like a parent body or it’s fragments, blocks a fraction of the gas disc causing the absorption, which means that the absorbing gas is between the white dwarf and the transiting objects.
For a consistency check of our results, we also compared raw light curves for both arms. We found that for all transits except for transit T6, differences between using the differential and raw light curve for the red arm are insignificant. During transit T6, we observe the transit being deeper by approximately 0.15 mag in the blue arm compared to the differential flux in the red arm, with significance. This is the only transit for which we observe significant difference between differential and raw fluxes in the red arm. If we compare raw fluxes in both arms transit T6 is still deeper in the blue arm, with less significance of . If this transit is real, it could be a sign of small dust grains in the transiting material. However, we suspect that a thin cloud was passing by our field during this time, which explains the difference between the differential and raw flux in the red arm. We conclude that transit T6 is most likely not to be a real transit event, and is caused by thin clouds passing by.
Finally, our results demonstrate the capability of QUCAM CCDs at the 4.2-m William Herschel Telescope (La Palma, Spain) to perform high-quality time resolved spectroscopy of relatively faint targets (r = 17.3 mag). Rappaport et al. (2018) reported that the optical activity of WD 1145 has increased to the highest level observed since its discovery, with approximately 17 per cent of the optical flux extinguished per orbit, and some transits with depths of up to 55 per cent and durations as long as two hours. As the transiting source material continues to evolve with time, there is likely to be a continuous deposition of material feeding the disc of gas responsible for the circumstellar absorption (Redfield et al., 2017). Future observations of WD 1145 with QUCAMs would be helpful to reveal changes of the circumstellar line profiles which would aid in understanding the geometry of the innermost circumstellar gas and provide constraints on white dwarf disc accretion models (Cauley et al., 2018). In addition, it would be interesting to re-observe the system during high activity levels to confirm a reduction in absorption during transits for the photospheric He i 3888.65 Å line.
Acknowledgements
We would like to thank the referee for helpful feedback. N. P. G. gratefully acknowledges support from the Royal Society in the form of a University Research Fellowship. This research has made use of the electronic bibliography maintained by NASA-ADS system, the SIMBAD database, operated at CDS, Strasbourg, France, and the VALD database, operated at Uppsala University, the Institute of Astronomy RAS in Moscow, and the University of Vienna.
References
- Alonso et al. (2016) Alonso R., Rappaport S., Deeg H. J., Palle E., 2016, A&A, 589, L6
- Althaus et al. (2010) Althaus L. G., Córsico A. H., Isern J., García-Berro E., 2010, A&ARv, 18, 471
- Burleigh et al. (2002) Burleigh M. R., Clarke F. J., Hodgkin S. T., 2002, MNRAS, 331, L41
- Cassan et al. (2012) Cassan A., et al., 2012, Nature, 481, 167
- Cauley et al. (2018) Cauley P. W., Farihi J., Redfield S., Bachman S., Parsons S. G., Gänsicke B. T., 2018, ApJ, 852, L22
- Croll et al. (2017) Croll B., et al., 2017, ApJ, 836, 82
- Debes & Sigurdsson (2002) Debes J. H., Sigurdsson S., 2002, ApJ, 572, 556
- Debes et al. (2012) Debes J. H., Walsh K. J., Stark C., 2012, ApJ, 747, 148
- Farihi et al. (2010) Farihi J., Barstow M. A., Redfield S., Dufour P., Hambly N. C., 2010, MNRAS, 404, 2123
- Farihi et al. (2018) Farihi J., et al., 2018, MNRAS, 474, 947
- Gänsicke et al. (2012) Gänsicke B. T., Koester D., Farihi J., Girven J., Parsons S. G., Breedt E., 2012, MNRAS, 424, 333
- Gänsicke et al. (2016) Gänsicke B. T., et al., 2016, ApJ, 818, L7
- Gary et al. (2017) Gary B. L., Rappaport S., Kaye T. G., Alonso R., Hambschs F.-J., 2017, MNRAS, 465, 3267
- Gibson et al. (2013) Gibson N. P., Aigrain S., Barstow J. K., Evans T. M., Fletcher L. N., Irwin P. G. J., 2013, MNRAS, 428, 3680
- Hallakoun et al. (2017) Hallakoun N., et al., 2017, MNRAS, 469, 3213
- Howell et al. (2014) Howell S. B., et al., 2014, PASP, 126, 398
- Izquierdo et al. (2018) Izquierdo P., et al., 2018, MNRAS, 481, 703
- Jura (2003) Jura M., 2003, ApJ, 584, L91
- Klein et al. (2010) Klein B., Jura M., Koester D., Zuckerman B., Melis C., 2010, ApJ, 709, 950
- Koester et al. (2014) Koester D., Gänsicke B. T., Farihi J., 2014, A&A, 566, A34
- Pollacco et al. (2006) Pollacco D. L., et al., 2006, PASP, 118, 1407
- Rappaport et al. (2016) Rappaport S., Gary B. L., Kaye T., Vanderburg A., Croll B., Benni P., Foote J., 2016, MNRAS, 458, 3904
- Rappaport et al. (2018) Rappaport S., Gary B. L., Vanderburg A., Xu S., Pooley D., Mukai K., 2018, MNRAS, 474, 933
- Redfield et al. (2017) Redfield S., Farihi J., Cauley P. W., Parsons S. G., Gänsicke B. T., Duvvuri G. M., 2017, ApJ, 839, 42
- Rocchetto et al. (2015) Rocchetto M., Farihi J., Gänsicke B. T., Bergfors C., 2015, MNRAS, 449, 574
- Tulloch & Dhillon (2011) Tulloch S. M., Dhillon V. S., 2011, MNRAS, 411, 211
- Vanderburg et al. (2015) Vanderburg A., et al., 2015, Nature, 526, 546
- Veras et al. (2014) Veras D., Leinhardt Z. M., Bonsor A., Gänsicke B. T., 2014, MNRAS, 445, 2244
- Wyatt et al. (2014) Wyatt M. C., Farihi J., Pringle J. E., Bonsor A., 2014, MNRAS, 439, 3371
- Xu et al. (2016) Xu S., Jura M., Dufour P., Zuckerman B., 2016, ApJ, 816, L22
- Xu et al. (2018) Xu S., et al., 2018, MNRAS, 474, 4795
- Zhou et al. (2016) Zhou G., et al., 2016, MNRAS, 463, 4422
- Zuckerman et al. (2007) Zuckerman B., Koester D., Melis C., Hansen B. M., Jura M., 2007, ApJ, 671, 872
- Zuckerman et al. (2010) Zuckerman B., Melis C., Klein B., Koester D., Jura M., 2010, ApJ, 722, 725