Baryon-induced dark matter cores in the EAGLE simulations
Abstract
We examine the formation of dark matter (DM) cores in dwarf galaxies simulated with the EAGLE model of galaxy formation. As in earlier work, we find that the star formation (SF) gas density threshold () plays a critical role. At low thresholds (LT), gas is unable to reach densities high enough to dominate the gravitational potential before being dispersed by feedback from supernovae. LT runs show little effect on the inner DM profile, even in systems with extended and bursty SF, two ingredients often cited as critical for core formation. For higher thresholds, gas is able to dominate the gravitational potential before being ejected by feedback. This can lead to a substantial reduction in the inner DM content, but only if the gas is gravitationally important over an extended period of time, allowing the halo to contract before gas removal. Rapid assembly and removal of gas in short SF bursts is less effective at altering the inner DM content. Subsequent gas accretion may draw DM back in and reform a cusp, unless SF is bursty enough to prevent it, preserving the core. Thus, for the EAGLE SF+feedback model, there is no simple relation between core formation and SF history, contrary to recent claims. The dependence of the inner DM content of dwarfs on hinders robust predictions and the interpretation of observations. A simulation of a volume with high results in dwarfs with sizeable cores over a limited halo mass range, but with insufficient variety in mass profiles to explain the observed diversity of dwarf galaxy rotation curves.
keywords:
galaxies: dwarf – galaxies: haloes – (cosmology: dark matter)1 Introduction
A fundamental prediction of cosmological collisionless N-body simulations of structure formation is that matter assembles into gravitationally bound haloes whose density profile approximately follows the universal Navarro-Frenk-White (hereafter, NFW) form, independently of initial conditions and cosmological parameters (Navarro et al., 1996b, 1997). This density law diverges towards the centre as and falls off in the outer parts as .
In contrast to this well established result, measurements of rotation curves and dynamical modelling of nearby low-mass galaxies have often been claimed to require much shallower (or even flat) inner density profiles (e.g., Moore, 1994; Flores & Primack, 1994; Walker & Peñarrubia, 2011; Oh et al., 2015, and references therein), although these claims have been recently disputed (Strigari et al., 2014; Pineda et al., 2017; Oman et al., 2017; Genina et al., 2018). The apparent discrepancy between collisionless simulations and observations is the “core-cusp” problem.
From a theoretical point of view, the existence of shallower than NFW density profiles in low-mass galaxies has sometimes been interpreted as the manifestation of dark matter self-interactions (e.g., Spergel & Steinhardt, 2000; Bullock & Boylan-Kolchin, 2017, and references therein). However, generating shallower density profiles is not particularly challenging for the Cold Dark Matter (CDM) cosmological model. Indeed, it was already recognized over twenty years ago that baryonic processes could, in principle, transform a central dark matter cusp () into a core (; Navarro et al. 1996a)111This does not necessarily imply that simulated cores are comparable to those inferred by observations.. Various specific mechanisms have been proposed to achieve this (see, e.g., de Blok, 2010, for an overview), but sudden loses of baryonic material from central regions of haloes is perhaps the most widely accepted. Using N-body simulations, Navarro et al. (1996a) showed that the sudden removal of a large amount of baryons from the centre of a cuspy dark matter halo leads to the formation of a core. This idea was later confirmed and extended using a variety of codes and numerical setups (e.g., Gelato & Sommer-Larsen, 1999; Read & Gilmore, 2005; Governato et al., 2010; Pontzen & Governato, 2012; Teyssier et al., 2013).
Particularly relevant is the work of Pontzen & Governato (2012) who used cosmological zoom-in simulations of the formation of dwarf galaxies to show that not only very violent (as suggested by Navarro et al., 1996a), but also moderate and repeated perturbations to the gravitational potential in the inner regions of dark matter haloes can significantly shallow the central cusp. This result confirmed that large-scale supernovae-driven winds may significantly affect the inner structure of dark matter haloes.
Subsequent cosmological simulations performed with different codes such as GASOLINE (e.g., Governato et al., 2010; Zolotov et al., 2012; Di Cintio et al., 2014a; Tollet et al., 2016) or FIRE (e.g. Chan et al., 2015; Wetzel et al., 2016; Fitts et al., 2017; Hopkins et al., 2017) have reinforced the idea that baryonic blowouts can perturb the inner regions of dark matter haloes. These simulations have shown that cores form more efficiently in a relatively narrow range of stellar/halo mass that matches roughly that of nearby bright dwarf galaxies in the Local Group (LG). The simulations also suggest that the inner slope of dark matter haloes may be mass dependent (Governato et al., 2012; Di Cintio et al., 2014b).
In sharp contrast, simulations performed with other codes such as EAGLE (e.g. Schaye et al., 2015; Oman et al., 2017; Genina et al., 2018) or AREPO (Vogelsberger et al., 2014) have shown that galaxies, irrespective of their stellar or halo mass, always reside in cuspy NFW haloes. This is certainly controversial: simulations from Zolotov et al. (2012) or the Latte project (Wetzel et al., 2016) report central cores in dwarf galaxies, whereas the APOSTLE (Sawala et al., 2016) and AURIGA (Grand et al., 2016) projects do not, yet they all claim a reasonably good agreement between structural and statistical properties of the simulated population of dwarfs and nearby LG dwarfs (Sawala et al., 2016; Simpson et al., 2017).
Why then do simulated dwarfs with similar overall properties differ so much in their inner mass distribution? One possibility are numerical errors; another is the subgrid physics modelling. The latter has been extensively invoked in the literature to explain the discrepancies among simulations, although with little quantitative support. For example, different degrees of “burstiness” in the star formation histories of simulated dwarfs is often argued as the source of the discrepancy (see e.g., Chan et al., 2015; Oñorbe et al., 2015; Bullock & Boylan-Kolchin, 2017, and references therein). However, the efficient stellar feedback implemented in the EAGLE and AURIGA codes produces star formation histories with a similar degree of “burstiness” (e.g. Sharma et al., 2016) as those reported by, e.g., Fitts et al. (2017). Yet none of the EAGLE haloes develop “cores” (Bose et al., 2018).
A clue to understanding the differences amongst simulations was already pointed out by Governato et al. (2010) and Pontzen & Governato (2012). These authors used zoom-in simulations of a dwarf galaxy to show that the “typical” density at which the gas becomes eligible to form stars determines the ability of baryonic processes to transform the central cusp into a core. Pontzen & Governato (2012) showed that if stars form from relatively low-density gas (), the halo remains cuspy because the gas is essentially removed from the system and its contribution to the gravitational potential never becomes important. If the density threshold for star formation () is high enough, gas is able to perturb the central gravitational potential of the halo before turning into stars; episodic star formation and subsequent supernovae-driven winds then drive a reduction of the inner mass density of the halo.
Although these authors considered only two values of , their numerical experiments do not only suggest that there must be a characteristic density threshold for star formation above which the inner density profile of low-mass haloes is effectively perturbed, but also that the structural properties of these haloes must inevitably depend on the value of this parameter. It is then surprising that, to date, few systematic studies of the impact of this parameter on the inner density profile of dwarf galaxies have been performed.
In this paper, we explore these ideas further in the context of the EAGLE model of galaxy formation. We use a set of zoom-in cosmological simulations of the formation of dwarf galaxies to demonstrate conclusively that the inner structure of their dark matter haloes is affected by the choice of the density threshold above which gas is deemed eligible to form stars. We describe the code and simulations in Sec. 2; we show and apply our main results in Sec. 3 and Sec. 4, respectively, and end with our conclusions in Sec. 5.
2 The Simulations
We first describe the simulation code used in this work and then provide details of the simulations themselves.
2.1 The Code
The simulations were performed with the version of the P-Gadget3 code (last described by Springel 2005) used for the EAGLE project (Schaye et al., 2015; Crain et al., 2015). The EAGLE code includes a set of subgrid prescriptions to model radiative cooling, photo-heating, star formation and evolution, feedback from star formation, black hole growth and AGN feedback. The necessary parameters were originally calibrated by requiring that simulations of a cosmological volume should approximately match the galaxy stellar mass function, the distribution of galaxy sizes and the amplitude of the black hole vs stellar mass relation. The original simulation, as well as its higher resolution counterpart, “RECAL,” (see nomenclature in Crain et al., 2015) turned out to match not only these observables, but also other population statistics and scaling relations as a function of redshift, as well as properties such as galaxy rotation curves (e.g., Schaller et al., 2015; Ludlow et al., 2017) and the luminosity function of galactic satellites (Sawala et al., 2016) at the present day. In this paper we shall refer to the “RECAL” calculation as the fiducial EAGLE model.
We summarize here the aspects of the subgrid modelling of star formation and supernova feedback that are most relevant for this work, and refer the reader to the original EAGLE papers for a more extensive description.
Star formation proceeds at the Kennicut-Schmidth rate in gas particles whose density is higher than a threshold, , at a temperature . The EAGLE model assumes a metallicity-dependent density threshold (as proposed by Schaye 2004):
| (1) |
where , , , and . For simplicity, in this work we depart from this relation and assume a unique density threshold. In practice, this is achieved by setting and . The EAGLE code also imposes a temperature floor, , for densities above , where and K. We retain this condition.
Supernova feedback is implemented following the stochastic thermal feedback scheme of Dalla Vecchia & Schaye (2012), namely, newly-formed star particles inject energy into some fraction of their neighbouring gas particles. In our simulations - in which the feedback implementation is identical to that of Schaye et al. (2015) and Crain et al. (2015) - the energy of each supernova explosion is deposited, on average, in one gas particle near each evolved stellar particle. The energy injection is implemented by heating gas particles to a temperature of , without turning radiative cooling off. Feedback particles thus receive an amount of thermal energy equal to:
| (2) |
where K. This ensures that, by construction, the gas cooling time of feedback particles is sufficiently long that supernovae energy can couple efficiently to the interstellar medium.
2.2 Zoom-in dwarfs
Our systematic study is based on high-resolution zoom-in cosmological hydrodynamical simulations of the formation of isolated dwarf galaxies with a relatively wide range of halo virial222Virial quantities correspond to those of the sphere within which the enclosed mean mass density is 200 times the critical density of the Universe, , and are identified with the subscript, . Throughout this paper, we assume . mass (). Initial conditions are obtained from the publicly available code, MUSIC (Hahn & Abel, 2011), which generates zoom-in initial conditions by refining a region centred around an object of interest selected from a parent cosmological volume, while degrading the resolution farther out. Our assumed cosmological parameters are consistent with the WMAP-7 values (Komatsu et al., 2011): , and , , and 333We adopt the WMAP-7 cosmological parameters rather than the Plank (Planck Collaboration et al., 2016) values in order to be consistent with the parameters adopted in the APOSTLE project. The choice of cosmological parameters has a negligible effect on the small scales studied in this work..
Dwarf galaxies were identified in a parent cosmological periodic volume of side 12 Mpc simulated at a resolution level L1, using the EAGLE fiducial model. The volume is filled with dark matter particles and the same number of gas particles, so that the dark matter particle mass is , and the gas particle mass is , where is the universal baryon fraction. The identification of dwarf candidates was performed at redshift using the group finder SUBFIND (Springel et al., 2001; Dolag et al., 2009), which identifies self-bound substructures within a catalogue of friend-of-friends (FoF) haloes built using a percolation length of 0.2 times the mean interparticle separation (Davis et al., 1985). SUBFIND produces a catalogue of “central” and “satellite” subhaloes within each FoF halo. Our analysis is based on “central” galaxies only for which, in addition, we apply an “isolation” criterion by requiring that they should have no “central” companion closer than 10 times their virial radius.
Our mass and isolation criteria yield a sample of 21 dwarf candidates, from which we select 4 that sample our chosen ranges of halo () and stellar () masses. Our simulation suite thus consists of 4 zoom-in cosmological simulations of the formation of isolated dwarf galaxies. These were all simulated at resolution level, L2, in which the gas particle mass is and the dark matter particle mass is .
The zoom-in simulations were performed keeping all the parameters of the EAGLE fiducial model fixed, as explained in Sec. 2.1, but systematically varying the density threshold for star formation, , from the lowest value considered in the EAGLE fiducial model, , to a largest value, . The latter is slightly lower than the values adopted in simulations that produce cores in dwarf galaxies, such as FIRE-2 (e.g., Fitts et al., 2017). Finally, the gravitational softening of the dark matter, gas and stellar particles is chosen so that its value never exceeds of the mean interparticle separation. This yields for the parent volume (resolution level L1), and for the zoom-in dwarfs (resolution level L2).
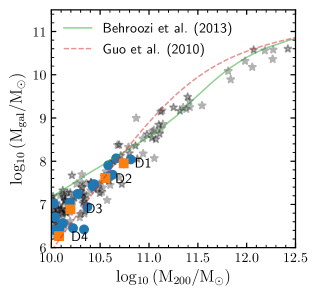
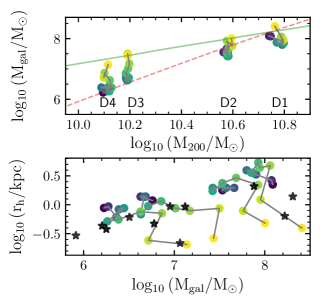
Fig. 1 shows the stellar mass, , as a function of the virial mass, , for “central” galaxies in the parent volume. Grey stars show all luminous galaxies444more than 1 stellar particle within a sphere of radius, . in the volume down to a virial mass, . The blue solid circles mark the 21 galaxies that fulfil our selection criteria of being isolated dwarfs in haloes of virial mass . The orange squares are the 4 zoom-in dwarf galaxies that we shall use for further analysis, and which span the entire range of halo and stellar mass of interest. The high-mass galaxies are consistent with abundance matching expectations from Behroozi et al. (2013) (solid line) whereas, as shown by Sawala et al. (2015), the low-mass galaxies already begin to deviate from these expectations and, for the mass range plotted, lie between the extrapolated abundance matching relations of Behroozi et al. (2013) and Guo et al. (2010) (dashed line).
3 Results
3.1 Role of the star formation density threshold
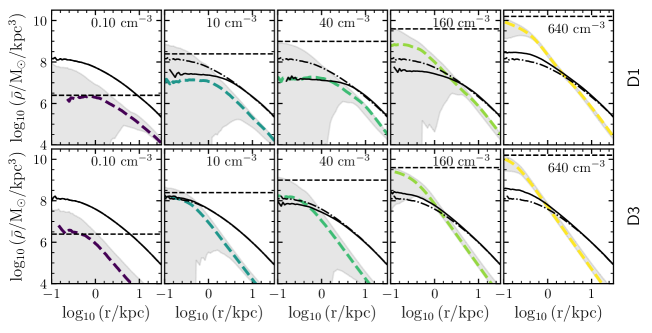
Our main result is shown in Fig. 2, where we plot the radial dependence of the mean enclosed dark matter density profile,
| (3) |
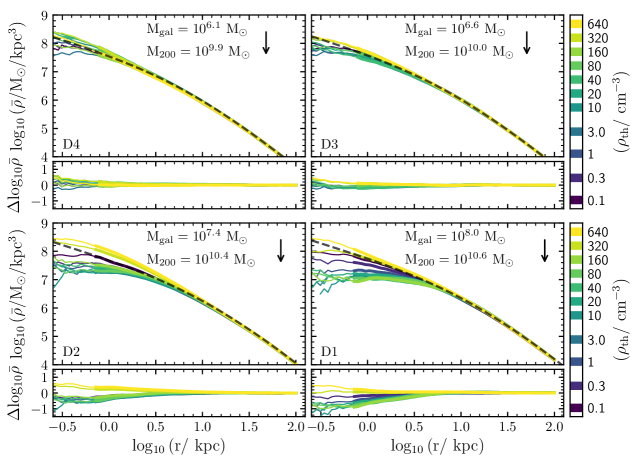
for our four (L2) zoom-in dwarf galaxies. Curves are coloured according to the value of the gas density threshold for star formation, as indicated by the colour bar on the right. The value of varies from (hereafter LT) to an arbitrary high value, (HT). The LT simulations are all consistent with NFW profiles (dashed lines) above times the convergence radius, , defined by Power et al. (2003). (Below , the density profiles of the LT runs are slightly shallower than the reference NFW profile as a result of numerical relaxation.) For higher values of , the dark matter density profiles, in some cases, depart systematically from NFW. The subpanels show the ratio of the individual profiles to the profile of the corresponding LT run. Clearly, the assumed value of has little impact on the inner dark matter density profiles of dwarfs D4 and D3, but dramatically alters those of dwarfs D2 and D1.
Consider the mean enclosed density profile of D1 (bottom-right panel) at : it decreases by a factor of as increases from to , and by a factor of when . For the profile is now very similar to that of the LT case and, for higher values of , it becomes slightly denser. Thus, for the wide range of values of considered here (), the inner dark matter density of D1 at first decreases roughly monotonically with increasing , but then increases for higher values of the threshold. D2 exhibits a similar behaviour.
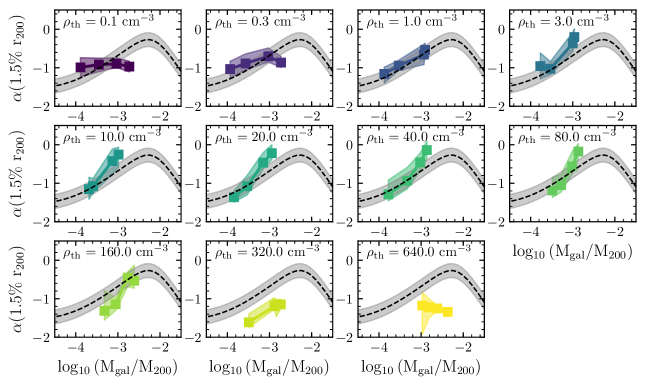
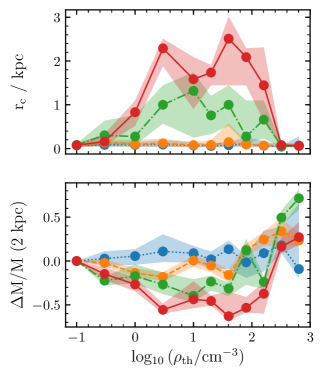
We show this quantitatively in Fig. 3. The top panel shows the median “core” radius, , as a function of for the four simulated dwarf galaxies. We define the “core” radius as the radius within which the mean enclosed dark matter density of the halo drops by a factor of 2 relative to the LT case 555Note that, by construction, this is also the radius at which the enclosed dark matter mass is lower by a factor of 2 than in the fiducial LT case. We assume if the core radius does not exist for that system.. Medians are taken over time using 100 snapshots equally spaced in time after redshift . This demonstrates that, as anticipated in Fig. 2, is effectively a function of for the more massive dwarfs D1 and D2, but the value of has little impact on the inner structure of dark matter haloes of the less massive dwarfs D3 and D4. The dependence of on halo mass, which holds over a wide range of (), is broadly consistent with earlier work that showed that very low-mass dwarfs do not exhibit large dark matter cores (Di Cintio et al., 2014b; Tollet et al., 2016; Bullock & Boylan-Kolchin, 2017, and references therein). However, the scatter in over time is large (the shaded regions show the 10th-90th percentiles of the temporal distribution of , after ). We will show in Sec. 3.3 that these dwarfs can experience a number of cusp/core transformations over their lifetime.
Consider again galaxy D1, which has a cuspy halo in the EAGLE fiducial model (LT run). This dwarf develops a core of when simulated assuming , and a core of when simulated assuming . This demonstrates that the particular choice of the gas density threshold at which stars are allowed to form in a simulation determines not only the creation (or not) of a core, but also that the size of the core itself (or the amount of mass displaced from the central regions) depends on the exact choice of threshold. This is consistent with the results of Governato et al. (2010) and Pontzen & Governato (2012, 2014), who probed only two values of ().
The bottom panel of Fig. 3 shows , the dark matter mass deficit (or excess if ) in the inner relative to the LT simulation, as a function of . We can see that the dark matter mass enclosed within this (arbitrary) radius is, as is too, very sensitive to the choice of for most dwarfs, and can be significantly reduced for intermediate values of . For very high values of the threshold (), some dwarfs develop an excess of dark matter mass within , not a deficit, relative to their LT counterpart, as anticipated from Fig. 2. We now explore the reasons why the core radius – or the mean dark matter mass enclosed by an inner radius – is so sensitive to the assumed density threshold for star formation.
3.2 The impact of the density threshold for star formation on the gas density profile of low-mass galaxies
The top panels of Fig. 4 show the median of the enclosed dark matter density profile of simulated dwarf D1 (black solid lines), for different values of the gas density threshold for star formation. The median is taken over a time interval starting well after the halo has collapsed and its overall dark matter density profile has stopped evolving () and ending at the present day. We also show the median of the enclosed gas density profiles (coloured dashed lines), and the minimum and maximum mean enclosed gas density at each radius (shaded regions), measured also for )666We performed the measurements over 150 snapshots equally spaced in time over the range .. This figure provides us with some immediate insight into why depends on .
Consider, for example, the fiducial LT simulation (). In this case, the dark matter halo remains cuspy during its entire lifetime, including at . The reason for this is straightforward: although supernova feedback is effective at removing baryons from the central region of the halo (as discussed in Sec. 1, this is a necessary condition for reducing the inner dark matter density), gas never contributes significantly to the gravitational potential of the system, which is also a necessary condition for baryons to perturb the mass profile of the halo. Indeed, gas is either turned into stars or expelled from the inner regions before reaching sufficiently high densities. The low gas density threshold for star formation, , ensures that little gas can become denser than this value; the median gas density profile, shown by the colour dashed line remains under this threshold (indicated by the black horizontal dashed line) at all radii.
Consider now a simulation of D1 with a higher value of the gas density threshold for star formation, say . The qualitative evolution of the galaxy is similar to that of its LT counterpart, but there is a significant quantitative difference: more gas collects in the inner region of the halo before turning into stars. The gas density threshold for star formation, now times larger than in the LT simulation, is much higher than any resolved dark matter density. The consequence is clear: baryons sometimes dominate the gravitational potential of the system in the inner before turning into stars or being expelled by feedback processes. Thus, in contrast to the LT example, baryons can now readily escape from the central regions of the system, but only after their gravitational pull has affected the dark matter halo. These are indeed the two ingredients commonly invoked in the literature that can lower the inner density of dark matter haloes Navarro et al. (1996a); Governato et al. (2010); Pontzen & Governato (2012). The resulting dark matter density profile (solid line) is, in fact, significantly shallower than its LT counterpart in the inner . A similar behaviour is observed for higher density thresholds (e.g., ), although in this case, the extent of the region in which the dark matter density profile is affected is larger, as anticipated from Fig. 3.
What determines the size of the core radius? Using our previous insight, the core radius must be related to the extent of the region where the gravitational force of the gas is non-negligible compared to that of the dark matter halo. For a spherically-symmetric system, this would occur at the radius where the mean enclosed gas density profile becomes comparable to that of the dark matter777This is the case because, at a given radius, .. The top panel of Fig. 4 indicates that this is the case for most values of , but not for very high gas density thresholds for star formation ( and ), for which . For these values of , the gas accumulates in the centre and becomes gravitationally dominant before turning into stars but is unable to evacuate the central regions efficiently because of the enhanced potential well depth caused by the accumulation of baryons, and because the EAGLE feedback scheme becomes inefficient at such high densities.
Consider, for example, the simulation with the highest gas density threshold for star formation, (rightmost top panel of Fig. 4). Although the gas density profile fluctuates in the innermost regions of the halo (see shaded region), the fluctuations are so small that the system remains baryon-dominated at all times and the dark matter halo contracts significantly in response. In principle, one might suspect that this could be due to lack of resolution to follow the collapse of high-density gas clouds and therefore, star formation events. However, we shall demonstrate below that this is not the case.
Fig. 5 summarises the changes in the main structural properties of our four simulated dwarf galaxies as the star-formation threshold, , varies. (The colour coding is as in Fig. 2). The top panel is analogous to Fig. 1 and shows the stellar mass - halo mass relation of the simulated dwarfs for different values of . Not surprisingly, for low values of (black dots), the stellar mass of the dwarfs is essentially consistent with the stellar mass they have in the parent volume from which they were selected (orange squares in Fig. 1). For a wide range of values of , the stellar mass changes little. However, it increases significantly, by more than a factor of , for very high values of . This plot clearly demonstrates that, for the highest values of , our simulated galaxies form even more stars than their LT counterparts.
Note, however, that the stellar content of the galaxies, regardless of , never accounts for more than of the total mass of the system, or for more than of the mass within . Thus, for large values of , most of the baryonic component of the galaxy is kept at the very centre in the form of gas, reflecting a significant reduction in the efficiency of feedback to drive gas out from high-density regions, which deepens the central gravitational potential. Indeed, the minimum requirement for supernovae explosions to push gas out to large radii is that the sound-crossing time, , of the expanding gas shell be much smaller than the cooling time, . For the EAGLE feedback implementation becomes larger than for densities higher than (see Eq. 18 of Dalla Vecchia & Schaye, 2012), which is close to the density threshold for star formation that produces the largest cores in our simulations (see e.g., Fig. 3). It is then not unexpected that a significant contraction of the dark matter halo is observed for high values of .
The bottom panel of Fig. 5 shows the half-stellar-mass radii of the simulated dwarfs as a function of their stellar mass, for different values of . The black stars show data for “field” dwarfs in the LG compiled by Fattahi et al. (2018). The value of has a significant impact on the size of the most massive dwarfs. The reduction of the inner dark matter density produced by gas blowouts also causes the galaxies themselves to expand (see e.g., Dutton et al., 2016; El-Badry et al., 2016, for a similar result). Note, however, that the effect is mild, and non-monotonic. Indeed, increasing the density threshold to very high values makes the galaxies not only more massive but also more compact.
A robust prediction of the value of for a given value of is difficult: the core radius depends not only on the radius within which the gas becomes important at sourcing the gravitational potential but also on the radius above which feedback processes, such as supernovae explosions, are effective at pushing gas out. This will ultimately depend on the feedback implementation of each particular model. This also implies that idealised models used to calculate core radii (e.g. Peñarrubia et al., 2012; Maxwell et al., 2015), are expected to have limited applicability (see also Pontzen et al., 2015). Indeed, dwarfs D1 and D2 exhibit very different dark matter profiles when simulated with, e.g., and , yet they form virtually the same amount of stars, implying that they have been subject to similar feedback processes over their lifetime. The difference in their dark matter profiles is mostly driven by the gravitational coupling between the gas and the dark matter halo, a crucial ingredient usually not taken into account in analytic models.
Finally, taken at face value, the LG data in Fig. 5 are broadly consistent with intermediate values of , but given the uncertainties just mentioned, we cannot confidently rule out any of the values of considered in this work.
We now focus on D3, whose dark matter density profile is largely insensitive to the choice of (see top right panel of Fig. 2 or dashed line in Fig. 3). The bottom panels of Fig. 4 show that for low values of , the baryons are unable to perturb the inner dark matter density profile, just as in D1 illustrated in the top left panels of the figure. For the highest value of , the dark matter halo becomes more centrally concentrated than in the LT simulation due to a significant increase in the gas-dominated gravitational potential. However, for intermediate values of , no significant reduction in the inner dark matter density profile is observed at redshift . We now explore the reasons why simulated dwarf D3, which appears to satisfy the conditions required for baryonic processes to reduce its central dark matter density profile for a wide range of , remains largely undisturbed.
3.3 Star formation history of dwarfs and its impact on their inner dark matter content
For a large range of values of neither D3 nor D4 experience a significant reduction in their inner dark matter density, despite: (i) having been baryon dominated in the past and (ii) having undergone significant baryonic blowouts. In order to understand this behaviour we explore the evolution and assembly history of D3 and contrast it with that of D1 which does end up with a reduced inner dark matter density.
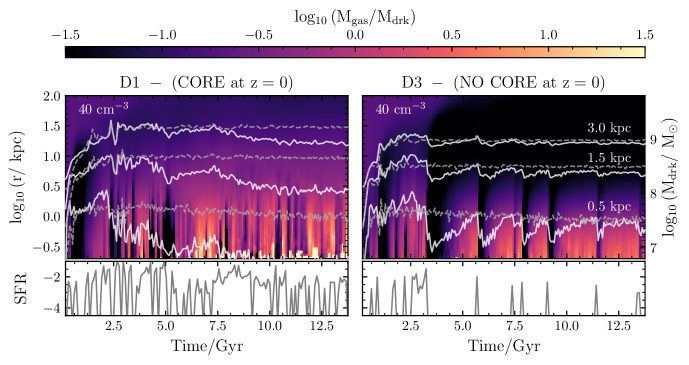
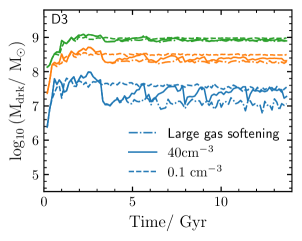
Fig. 6 shows the enclosed gas-to-dark matter mass ratio (colour scale on the top) as a function of time (x-axis) and distance to the centre of the main progenitor (y-axis) for D1 and D3 and . From top to bottom in each panel, the solid lines show the enclosed dark matter mass within , , and , respectively. The dashed lines show the same quantities in the LT run (i.e., for ). Individual star formation histories are shown in the lower panels. Bursts of star formation precede gas blowouts which are manifest as sudden reductions of the ratio.
The collapse of the dark matter haloes of both dwarfs is complete after a couple of Gyrs, after which the enclosed dark matter mass within (and therefore the density within that radius) remains roughly constant and is almost indistinguishable from that of the LT counterpart.
Soon after collapsing, dwarf D1 becomes gas dominated () in the inner and starts forming stars in earnest. The first major episode of star formation occurs at and is accompanied by a significant reduction of the inner gas mass (see darker regions in the left panel of Fig. 6). The central gravitational potential of D1 is thus suddenly reduced, allowing dark matter particles to migrate to larger orbits, and this causes a reduction of more than a factor of in the enclosed mass at . At , another intense episode of star formation empties the gas from the inner regions of the halo and also causes a major loss of dark matter mass. Some gas returns soon after, but the halo barely changes.
Most of the reduction of the inner dark matter mass takes place in one or two distinctive blowouts, which empty the central regions during a few million years. Following these events, the baryon mass at the centre is replenished but it is removed almost immediately by short bursts of star formation. Thus, the rapid assembly and removal of baryons from the central region is less effective at evacuating the inner dark matter mass, and therefore at forming cores, than a single massive blowout. Consider, for example, the enclosed dark matter mass at (middle line). This drops by roughly a factor of after the sudden removal of gas at , and by a similar amount from to as a result of the “burstiness” of the system. We demonstrate in Appendix A that the rapid assembly and removal of gas, although inefficient at forming dark matter cores, can allow star formation to continue while preventing the halo from contracting.
In the case of D3 (right panel of Fig. 6), the first important event of star formation takes place at . The associated supernovae explosions violently expel the central gas from the system and this causes a dramatic reduction (by a factor of 10) of the dark matter mass within , not dissimilar to the case of D1. After a protracted period of time (), more baryons have cooled and sunk to the centre of the halo, dragging dark matter from larger radii and allowing the halo to recover most of the inner dark matter mass that it had had initially. The dark matter halo, however, does not return to its initial (contracted) configuration, but to a configuration with a slightly shallower slope. At the central gas density in D3 has become comparable to and the galaxy undergoes another episode of star formation, which blows out the gas again and reduces once more the inner dark matter density. This process of star formation, gas blowout and recovery of the inner dark matter density is repeated at least 4 more times before redshift . The absence of a major event of star formation at late times leaves the dark matter halo of D3 in a configuration that is essentially indistinguishable from that of the fiducial LT counterpart.
As shown in Appendix B, dwarf D4 exhibits a similar evolution: its dark matter halo is perturbed by sparse episodes of star formation but recovers, and becomes even more compact than its LT counterpart, as more baryons condense at the centre. The evolution of D3 demonstrates that the sudden removal of gas from the centre is very efficient at reducing the enclosed dark matter mass; however, the lack of subsequent star formation activity allows gas to return and gradually accumulate at the centre causing the halo to contract.
The main difference between the evolutionary paths of D1 and D3 following the first episode of core formation stems from the different timescales on which the collapse of the gas that fuels star formation occurs in each case. If gas can condense and form stars but is expelled on a short timescale - as in D1 - the dark matter halo has no time to respond dynamically and contract and so it retains a shallow density profile. But if the accretion of gas occurs over a long timescale - as in D3 - the dark matter halo has time to contract in response to the accumulated gas at its centre. Fig. 6 indicates that D1 undergoes continuous perturbations whilst D3 does not. This suggests that the occurrence of repeated perturbations, although individually inefficient at perturbing the dark matter halo, serves to prevent the recovery of the cusp in the halo of D1.
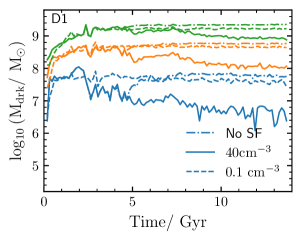
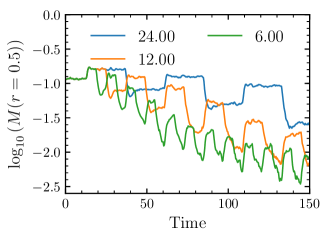
We test this interpretation with a simple experiment. We re-run the dwarf D1 simulation (assuming a value of ) until , after which we artificially halt star formation. Gas is then free to cool and sink to the centre of the halo. If it is repeated gaseous blowouts that maintain a shallow central density profile in the dark matter, then the absence of star formation should allow the halo to contract rapidly as gas accumulates at its centre. As shown in Fig. 7 this is indeed what happens. The solid and dashed lines show the enclosed dark matter mass within 3 different radii, for the fiducial model () and for the model with , respectively; the dot-dashed line shows the enclosed dark matter mass of the simulation in which star formation is turned off after . Clearly, in the absence of star formation, the dark matter halo reacts to the collapse of gas by contracting, with the result that the final density profile ends up being very similar to that in the fiducial simulation in which the halo has a density cusp.
To demonstrate that it is the accretion of baryons following a massive blowout and subsequent absence of star formation activity that enables the cusp to recover in the dark matter halo of D3 we carry out another experiment. Now we stop the simulation at and artificially increase the gravitational softening of the gas particles to a very large value, so that their gravitational force is negligible compared to that of the dark matter in the inner regions. The result of this experiment is shown by the dot-dashed line in Fig. 8. Clearly, the dark matter halo remains stable with a shallow density profile when the gravity of the gaseous component is neglected.
These experiments demonstrate that the main reason for the differences in the dark matter density profiles of the two dwarfs are the different timescales on which the potential is perturbed. The perturbation timescale is set by the timescale of individual star formation episodes, which ultimately depends on the timescale on which gas is able to sink to the centre of the halo. It is then pertinent to ask: why does it take longer for the gas to collapse and reach the density threshold for star formation in D3 than in D1?
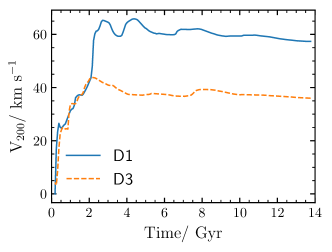
The collapse of D1 at early times is essentially indistinguishable from that of D3. As shown in Fig. 6, their baryonic (and dark matter) contents before are comparable at all radii. However, the similarity between the two is broken soon after. In Fig. 9 we show the virial circular velocity, , of the systems as a function of time. At early times (), the virial circular velocities of both dwarfs are almost identical. At , D1 increases its mass significantly, by a factor of , and this induces a sudden increase in from to . By contrast, the virial circular velocity of D3 remains roughly constant at . After neither D1 nor D3 change their mass or virial velocity significantly.
The higher mass of D1 at early times enables more baryons to cool and sink to the centre than in the case of D3888Note that most of the gas that supplies the dwarf galaxies has previously been heated by cosmic reionization to a temperature of the order of , which corresponds to an effective sound speed of . Galaxies whose is comparable to are therefore expected to accrete systematically less gas than those for which the ratio, .. This is clear from, e.g., Fig. 6, or from the median baryonic profiles in Fig. 4. This phase has a strong impact on the subsequent evolution of the galaxies. The amount of work that an expanding supernova-heated gas bubble needs to do against the gaseous halo is much larger in D1 than in D3, simply because the gaseous halo of D1 is denser. Consequently, supernova-heated gas travels shorter distances in D1 than in D3. This is seen in Fig. 6, which shows that baryonic blowouts push gas out to systematically smaller radii in D1 than in D3, where the gas is essentially completely ejected from the system after each episode of star formation. On top of that, the escape velocity of D1 is larger than that of D3, making it harder for the gas to escape the system.
The origin of the different degrees of “burstiness” in D1 and D3 is then clear: star formation in D1 proceeds on a much shorter timescale than in D3 because its gas supply is always much closer to the centre of the galaxy than in D3, for which gas needs to travel longer distances before collecting at the centre of the halo and forming stars.
3.4 Discussion
Our suite of zoom-in simulations demonstrates that baryons can effectively perturb the inner dark matter density profile of low-mass galaxies provided the density threshold for star formation is sufficiently high and supernova feedback is effective at evacuating the central (gas-dominated) regions. Our numerical experiments indicate, however, that largely disjoint episodes of star formation, accompanied by slow reaccretion of gas, leads to dark matter haloes contracting and erasing the signature of past baryonic blowouts.
These results help to clarify the emerging view in the literature that sufficient “burstiness” in the star formation activity of dwarfs is a necessary condition to lower the central dark matter halo density significantly. Indeed, our simulations indicate that the sudden removal of gas leads to a substantial reduction in the inner dark matter content but only when the baryonic component that is removed had previously been gravitationally significant over an extended period of time. Burstiness, understood as the rapid assembly and removal of baryons by star formation, is less effective than a single large blowout at forming a core, but is necessary to maintain the core in galaxies that continue forming stars. The inner dark mass may subsequently recover if baryons gradually reassemble at the center over a long period of time. We support these conclusions further, using a set of idealized experiments, in Appendix A.
We therefore conclude that gravitationally-dominant baryonic perturbations and efficient feedback are both necessary conditions for reducing the inner dark matter density of low-mass haloes. Experiencing rapid fluctuations in the gravitational potential is a necessary condition to prevent dark matter haloes from contracting in response to later accretion of gas. Thus, our simulations demonstrate that both baryonic blowouts and rapid fluctuations in the gravitational potential play no role in setting the inner mass content of dark matter haloes if baryons never dominate the inner gravitational potential.
Our conclusions have interesting implications. If these mechanism operate in our Universe, some “core-forming” dwarfs (like D1) should be currently star-forming and gas-dominated in the inner regions999We note that recently, Di Cintio et al. (2017) arrived to a similar conclusion in the context of ultra-diffuse galaxies.. Some blue compact dwarfs could fall into this category, as they often exhibit recent or ongoing star formation and high gas fractions (e.g., Tolstoy et al., 2009; Lelli et al., 2014).
Another implication is that dark matter cores, if they exist at all, could occur in systems (like D3) that are dark matter-dominated today and in which star formation shows signs of an abrupt truncation in the past. Some dwarf spheroidal galaxies could fall into this category if they were gas-dominated in the past (see e.g. Weisz et al., 2011).
Finally, we note that simulations by Read et al. (2016, 2018) indicate that dark matter cusps may turn into cores even if the baryonic component had not been gravitationally dominant in the inner regions of the halo, in contrast with our results. As shown by El-Zant et al. (2001), and more recently by Nipoti & Binney (2015), the transformation of a central cusp into a core could also be achieved through dynamical friction between dark matter and dense gaseous star-forming clumps that dominate the gravitational potential locally. These gaseous clumps are indeed present in the simulations by Read et al. (2016), but not in ours. The differences are likely due to the higher baryon fraction and the lower temperature of the interstellar medium of their simulated dwarfs compared to ours.
4 EAGLE with higher star formation threshold
The previous section demonstrates that in the EAGLE model of galaxy formation the inner structure of dark matter haloes is very sensitive to the assumed gas density threshold for star formation. For our suite of simulated dwarf galaxies, the size of the core reaches a maximum for values around (see Fig. 3). How do these results affect a larger sample of galaxies spanning a broader mass range? We address this question with a cosmological hydrodynamical simulation performed with the EAGLE code but assuming this high threshold, which is roughly higher than the value adopted in the original EAGLE simulations (see Schaye et al., 2015; Crain et al., 2015).
We have run one dark matter only simulation and two EAGLE hydrodynamical simulations of a (12 Mpc)3 cosmological volume, one with the fiducial density threshold for star formation (), and another with . We shall refer to these simulations as DMO (dark-matter-only), CLT (cosmological-low-threshold) and CHT (cosmological-high-threshold), respectively. The simulated volume is the same as the parent volume from which our sample of zoom-in dwarfs was drawn, but initialized at a resolution level comparable to that of our zoom-in suite (resolution level L2; ).
Galaxies were identified in the CHT simulation as described in Sec. 2 and cross-matched with those identified in the CLT and DMO simulations, so that all galaxies have a counterpart in the other volumes. We do not consider galaxies with obvious signs of interactions101010We decide whether galaxies are undergoing an obvious interaction by visually inspecting them at redshift . We removed galaxies from our sample., since these are expected to be out of equilibrium and even the location of their centres is ambiguous. We include in our sample all luminous galaxies (i.e., those with at least one stellar particle within the virial radius) in dark matter haloes of virial mass, . This implies that all dark matter haloes considered here are resolved with more than particles.
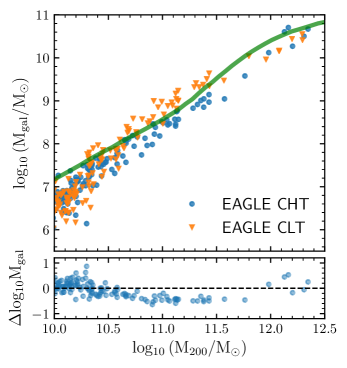
The top panel of Fig. 10 shows the stellar mass vs halo mass relation for the galaxies identified in both hydrodynamical simulations. The green solid lines show the expectations from abundance matching, as given by Behroozi et al. (2013). The bottom panel shows the ratio of stellar masses in each simulation, as a function of virial mass. Changing the density threshold for star formation has little impact on the stellar mass of low-mass systems () and of high-mass systems (). However, the stellar content of the intermediate-mass haloes () is significantly affected by the choice of .
In that mass range, CHT galaxies are systematically less massive than their CLT counterparts (by a factor of ). This systematic change in stellar mass will have an impact on the galaxy mass function, which is one of the primary observations used to calibrate the EAGLE model parameters (Crain et al., 2015). Since the main purpose of our exercise is to explore the effects of the threshold on potential “cores” in the inner dark matter profiles, we do not pursue this isue further here. However, we note that re-calibration of the EAGLE model parameters would be necessary to restore agreement with observations in this regime and there is no gurantee that such agreement will be achieved.
4.1 The diversity of simulated galaxy rotation curves
A key observable related to the inner mass distribution of galaxies is their rotation curve. Rotation curves of nearby galaxies display a great “diversity”, especially in the regime of dwarf galaxies. Recently, Oman et al. (2015) have quantified this diversity, showing that galaxies with similar values of the maximum circular velocity, , can have significantly different circular velocities at (). This is at odds with the expectation for CDM haloes, where fully determines (to within a small scatter).
The origin of this diversity is still not well understood. Part of it may be due to fluctuations in the rotation curves and from the fact that is approximated, for some dwarfs, by the maximum of the observed rotation curve. In addition, Oman et al. (2019) argue that some of the diversity may also arise from non-circular motions in the gas that are not well accounted for in the modelling of the data. Taken at face value, however, the data imply a mass deficit in the inner region of some dwarfs compared to the expectation from cosmological collisionless N-body simulations.
As shown by Oman et al. (2015), the diversity of “observed” rotation curves is at odds with the predictions of the EAGLE and APOSTLE simulations (which assume a low gas density threshold for star formation). Indeed, as discussed in the previous section, for low density thresholds the dark matter distribution in low-mass systems shows little difference from the dark-matter-only case. Raising the star formation threshold can in principle reduce the dark matter central density, but, can it also reproduce the observed diversity in dwarf galaxy rotation curves?
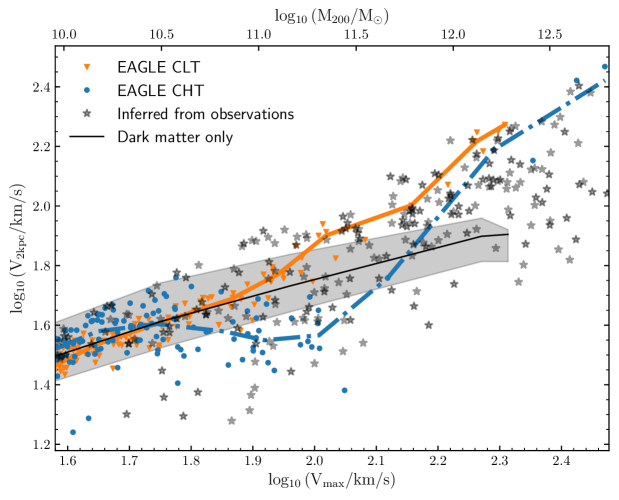
We explore this in Fig. 11, where we show, for CLT (in orange, triangles) and CHT (in blue, circles) galaxies, as a function of (or virial mass, scale on top). The grey band indicates the 10th-90th percentile range corresponding to the DMO run. Starred symbols are for observed galaxies from the compilation by Oman et al. (2015). Galaxies below the grey band are those with less mass within kpc than expected from the dark matter alone. This is a quantitative measure of the reduced inner dark matter density (“inner mass deficit”) that is associated with “cores”. Note that galaxies at large masses tend to have higher than expected from the dark matter alone. This is expected, and is just a result of the non-negligible contribution of the baryons to the inner rotation curve in massive galaxies.
As may be seen from the orange triangles (and the corresponding solid line tracing the median trend), CLT galaxies follow at low masses the same trend as the DMO run. In particular, no CLT galaxies fall substantially below the grey band, implying that the CLT model fails to explain the diversity of observed rotation curves and, in particular, the apparent existence of galaxies with substantial mass deficits at kpc.
CHT galaxies, on the other hand, exhibit greater diversity compared to those simulated with the CLT model. They also show pronounced “mass deficits” at kpc, particularly in the range, and seem able to explain some of the observed galaxies with cores in that range. However, since most CHT galaxies in the same range have large deficits, they fail to explain the large number of observed galaxies that are consistent with a “normal” dark matter content in that range. In other words, a higher EAGLE star formation threshold is able to modify the inner mass content as a function of , but is unable to explain the observed diversity, which demands a mechanism that creates cores of various sizes in only some galaxies, but not in others, over a wide range of (roughly between and km/s).
4.2 Comparison with earlier work
The fact that the baryon-induced reduction in central dark matter density is most effective over a relatively narrow range in mass (as shown in Fig. 11) has been reported in a number of recent papers (see; e.g, Di Cintio et al., 2014b; Tollet et al., 2016; Bullock & Boylan-Kolchin, 2017, and references therein). These papers argue that it is the galaxy formation “efficiency” (i.e., the ratio of stellar-to-virial mass, ) that controls the formation of a core. This is, in principle, reasonable. Galaxies with low are unable to form cores because the few stars that form cannot power the winds needed to remove baryons from the centre of a galaxy. At the other end, galaxies with high reside in very deep potential wells where, despite the large amount of feedback energy available, winds are also unable to remove baryons from the centre. We now compare some of those results with ours.
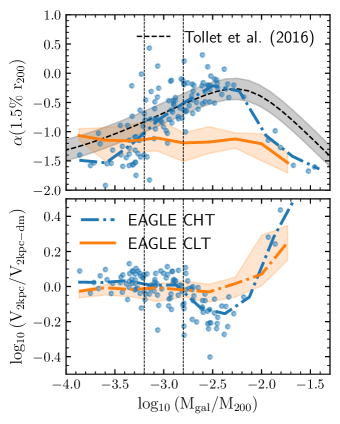
We choose for the comparison the results of Tollet et al. (2016), who show that, in their simulations, the slope () of the dark matter density profile at of the virial radius correlates strongly with , reaching a peak of for and decreasing for both lower and higher efficiency values. We compare these results to our CLT and CHT galaxies in Fig. 12. As expected, CLT galaxies show little dependence of on , reflecting the self-similar nature of their largely unperturbed cold dark matter haloes. CHT galaxies, on the other hand, exhibit a trend in rough agreement with the results from Tollet et al. (2016). This is an interesting result, for it shows that the EAGLE model can, for some choice of the star formation threshold, reproduce the results of other simulations where core formation is ubiquitous. We caution, however, about reading too much into the agreement between our CHT results of those of Tollet et al. (2016): the agreement is only crude and other choices of the threshold would have given different quantitative results (see Appendix 18).
A second important point to note is that shallower-than-NFW inner density profiles at of do not necessarily imply low-mass galaxies with a significant mass deficit at , which is what is required to match the observational data shown in Fig. 11. We show this in the bottom panel of Fig. 12, where we plot the change in circular velocity (at kpc) relative to the dark-matter-only case. Although most of the CHT galaxies in the range (the range between the vertical dashed lines) exhibit shallower-than-NFW slopes at of , they display hardly any mass deficit at . This is due to the fact that for low-mass systems becomes an increasingly large distance compared to the size of the dark matter core.
Our conclusion is that baryons can indeed induce reductions in the inner dark matter density, but the magnitude of the effect are still unclear, and are heavily dependent on the particular algorithmic choices made in different codes. Although increasing the star formation threshold in the EAGLE code can result in cores comparable to those in other simulations, the relatively narrow mass range of the effect, together with the tight scatter at fixed mass, result in rotation curves that, taken as an ensemble, do not compare well with the trends and scatter in existing data. Modifying the inner cusp over some limited mass range does not seem to be enough to explain the diversity of dwarf galaxy rotation curves (see, however, Santos-Santos et al., 2018, for a differing view).
5 Conclusions
We have carried out a set of zoom-in cosmological hydrodynamical simulations of the formation of low-mass galaxies in the CDM cosmology to perform a systematic study of the impact of the gas density threshold for star formation assumed in the simulations, , on their inner dark matter content. We have also simulated a (12 Mpc)3 cubic volume with a high gas density threshold in order to explore similar baryon effects over a wider range of galaxy masses. All the simulations of this paper used the fiducial EAGLE model for star formation and feedback, except for varying the gas density threshold for star formation.
Hydrodynamical simulations performed with different numerical codes and/or different models of galaxy formation often produce different inner dark matter density profiles. Although it has long been suspected that such discrepancies must be related to the way in which subgrid physical processes are modelled, in this paper we have studied these differences quantitatively. We have tracked down the main differences to details of the modelling of the star formation process, in particular, to the typical density at which gas is turned into stars in a simulation.
If the gas is converted into stars before it has come to dominate the gravitational potential in the inner regions of dark matter haloes, then baryonic blowouts do very little to the inner mass distribution of a dwarf galaxy. By contrast, when the spherically-averaged gas density becomes comparable to the density of the dark matter halo, baryon effects can perturb the inner profile. In practice, this can be achieved by increasing the gas density threshold for star formation to a value comparable to that of the inner density of dark matter within the relevant radius. In the EAGLE model density thresholds of order usually satisfy this condition for a wide range of halo masses (see e.g., Fig. 4). It is then perhaps not surprising that simulations performed with values of as high as this systematically predict shallower dark matter density profiles than simulations with lower values of this parameter.
Our experiments demonstrate that neither the star formation “burstiness” nor strong baryonic blowouts are a sufficient condition for the inner dark matter content of low-mass galaxies to be reduced. The gaseous content of their haloes must first become gravitationally dominant in the region of interest, and must be assembled over a timescale long enough to allow the halo to contract, before a blowout can flatten the central dark matter density profile.
For dwarfs that are baryon dominated in the inner parts, we demonstrated that the region of the dark matter halo that is affected by baryonic blowouts is very sensitive to the value of . For densities higher than , we find that the “core” radius (or the inner mass deficit) increases roughly monotonically with for , but only for values in the range (see Fig. 3). For higher densities, supernova feedback, as implemented in the EAGLE code, is inefficient at driving gas out from the inner regions. Gas then accumulates at the centre which becomes compact and overwhelmingly dominated by baryons (see Fig. 5), causing the dark matter halo to contract in response. This is a direct consequence of the reduction in feedback efficiency at high densities in the EAGLE implementation (see e.g., Dalla Vecchia & Schaye, 2012).
The suppresion of gas blowout in baryon-dominated dwarfs is likely to depend strongly on the specific numerical implementation. For example, this effect does not seem to be present in simulations of dwarfs galaxies with the FIRE-2 code (e.g., Wetzel et al., 2016; Fitts et al., 2017). These authors impose very stringent criteria for star formation on top of a very high value of the gas density threshold for star formation (); yet supernovae explosions seem to be efficient at driving gas out of their low-mass galaxies.
We have also shown that, for the EAGLE model, global properties of low-mass galaxies, such as their stellar mass or size are only weakly affected when increasing the gas density threshold for star formation from to . However, increasing it beyond makes supernova feedback less efficient allowing galaxies to form systematically more stars and become more compact (see Fig. 5). This implies that simulations performed with moderate values of may all produce similar dwarf galaxy populations even though their inner dark matter density profile may differ.
For more massive systems (), increasing the density threshold from to results in appreciable differences in galaxy masses. Masses are systematically reduced by a factor of when increasing the value of from to (see Fig. 10). This is likely to have an impact on the galaxy stellar mass function which is well reproduced in the non-core forming EAGLE simulation. Whether other parameters of the EAGLE model could be adjusted to recover the good match to the stellar mass function while accommodating cores in dwarfs remains an open question.
Finally, we have run a cosmological hydrodynamical simulation to demonstrate that increasing the density threshold for star formation to produces sizeable cores in essentially all galaxies in the halo mass range , or stellar mass range . This is at odds with the diverse population of dwarf galaxies observed nearby, where some galaxies seem to show cores of various sizes, and over a wider mass range than in our high-threshold simulation. We emphasize that these results apply to the EAGLE star formation/feedback model. It is unclear whether the observed diversity of rotation curves could be recovered by assuming lower values of the density threshold for star formation, or by adopting a different numerical prescription for the feedback processes.
Our results show that a key parameter that determines whether or not a core forms in a simulated dwarf is the value of the density threshold at which gas is turned into stars in the simulation. The size of dark matter cores also seems very sensitive to this choice, although we find, in addition, that, at fixed value of , the core size at redshift is a function of halo mass (see Fig. 2 and Fig. 3). This is particularly true for intermediate values of (), whereas this mass dependence breaks down for lower values of , in which gas is never dense enough to dominate the gravitational potential, and for higher values, for which the EAGLE feedback model becomes inefficient at producing baryonic blowouts. Whether this result holds for other simulation codes deserves further investigation, but if confirmed, it would expose a severe limitation of current cosmological simulations: they cannot provide detailed and reliable quantitative predictions for the inner dark matter content of low-mass dwarf galaxies. This limitation will be hard to overcome unless more realistic modelling of the star formation process is included.
The inner slope of our simulated dark matter haloes – measured at redshift – exhibits a mass dependence which is roughly similar to that reported in earlier work by Di Cintio et al. (2014a) and Tollet et al. (2016) but with much larger scatter. The larger scatter, although uncertain, might be related to the particular value of assumed in our work compared to that used by these authors.
If the main mechanisms discussed in our paper do apply in general to real galaxies, then we would expect that 1) “core-forming” dwarfs should be currently gas-dominated and star-forming, as our simulated dwarf D1 is, and 2) dark matter cores should predominantly occur in systems that are dark matter-dominated and where star formation shows signs of an abrupt truncation in the past, as seen in the early stages of evolution of our simulated dwarf D3 (Fig. 6). Some blue compact dwarf and dwarf spheroidal galaxies could be the place where these mechanisms operate. The relation between core formation and galaxy star formation history is, however, less clear; our simulations suggest that, in principle, cusps and cores may exist in galaxies with brief, truncated SFHs, contrary to recent claims Read et al. (2018). We caution that these conclusions are drawn from the few specific examples that we have considered in this paper. We are currently carrying out a comprehensive study of the formation of cores in our set of simulated cosmological volumes to see how general these conclusions are and plan to report on this in a forthcoming paper.
Acknowledgements
We thank an anonymous referee for useful comments that improved our presentation. We have benefited from the following public PYTHON packages: NUMPY (Van Der Walt et al., 2011), SCIPY (Jones et al., 2001), MATPLOTLIB (Hunter, 2007), IPYTHON (Pérez & Granger, 2007) and PY-SPHVIEWER (Benitez-Llambay, 2015). JFN acknowledges the hospitality of the Aspen Center for Physics, which is supported by National Science Foundation grant PHY-1607611. This research was supported in part by the National Science Foundation under Grant No. NSF PHY17-48958. This work was supported by the Science and Technology Facilities Council (grant number ST/L00075X/1) and European Research Council ERC Advanced Investigator grant to CSF, DMIDAS (GA 786910). This work used the DiRAC Data Centric system at Durham University operated by the Institute for Computational Cosmology on behalf of the STFC DiRAC HPC Facility (www.dirac.ac.uk). This equipment was funded by BIS National E-infrastructure capital grant ST/K00042X/1, STFC capital grants ST/H008519/1 and ST/K00087X/1, STFC DiRAC Operations grant ST/K003267/1 and Durham University. DiRAC is part of the National E-Infrastructure.
References
- Behroozi et al. (2013) Behroozi P. S., Wechsler R. H., Conroy C., 2013, ApJ, 770, 57
- Benitez-Llambay (2015) Benitez-Llambay A., 2015, py-sphviewer: Py-SPHViewer v1.0.0, doi:10.5281/zenodo.21703, http://dx.doi.org/10.5281/zenodo.21703
- Bose et al. (2018) Bose S., et al., 2018, arXiv e-prints,
- Bullock & Boylan-Kolchin (2017) Bullock J. S., Boylan-Kolchin M., 2017, ARA&A, 55, 343
- Chan et al. (2015) Chan T. K., Kereš D., Oñorbe J., Hopkins P. F., Muratov A. L., Faucher-Giguère C.-A., Quataert E., 2015, MNRAS, 454, 2981
- Crain et al. (2015) Crain R. A., et al., 2015, MNRAS, 450, 1937
- Dalla Vecchia & Schaye (2012) Dalla Vecchia C., Schaye J., 2012, MNRAS, 426, 140
- Davis et al. (1985) Davis M., Efstathiou G., Frenk C. S., White S. D. M., 1985, ApJ, 292, 371
- Di Cintio et al. (2014a) Di Cintio A., Brook C. B., Macciò A. V., Stinson G. S., Knebe A., Dutton A. A., Wadsley J., 2014a, MNRAS, 437, 415
- Di Cintio et al. (2014b) Di Cintio A., Brook C. B., Dutton A. A., Macciò A. V., Stinson G. S., Knebe A., 2014b, MNRAS, 441, 2986
- Di Cintio et al. (2017) Di Cintio A., Brook C. B., Dutton A. A., Macciò A. V., Obreja A., Dekel A., 2017, MNRAS, 466, L1
- Dolag et al. (2009) Dolag K., Borgani S., Murante G., Springel V., 2009, MNRAS, 399, 497
- Dutton et al. (2016) Dutton A. A., et al., 2016, MNRAS, 461, 2658
- El-Badry et al. (2016) El-Badry K., Wetzel A., Geha M., Hopkins P. F., Kereš D., Chan T. K., Faucher-Giguère C.-A., 2016, ApJ, 820, 131
- El-Zant et al. (2001) El-Zant A., Shlosman I., Hoffman Y., 2001, ApJ, 560, 636
- Fattahi et al. (2018) Fattahi A., Navarro J. F., Frenk C. S., Oman K. A., Sawala T., Schaller M., 2018, MNRAS, 476, 3816
- Fitts et al. (2017) Fitts A., et al., 2017, MNRAS, 471, 3547
- Flores & Primack (1994) Flores R. A., Primack J. R., 1994, ApJ, 427, L1
- Gelato & Sommer-Larsen (1999) Gelato S., Sommer-Larsen J., 1999, MNRAS, 303, 321
- Genina et al. (2018) Genina A., et al., 2018, MNRAS, 474, 1398
- Governato et al. (2010) Governato F., et al., 2010, Nature, 463, 203
- Governato et al. (2012) Governato F., et al., 2012, MNRAS, 422, 1231
- Grand et al. (2016) Grand R. J. J., Springel V., Gómez F. A., Marinacci F., Pakmor R., Campbell D. J. R., Jenkins A., 2016, MNRAS, 459, 199
- Guo et al. (2010) Guo Q., White S., Li C., Boylan-Kolchin M., 2010, MNRAS, 404, 1111
- Hahn & Abel (2011) Hahn O., Abel T., 2011, MNRAS, 415, 2101
- Hernquist (1990) Hernquist L., 1990, ApJ, 356, 359
- Hopkins et al. (2017) Hopkins P. F., et al., 2017, preprint, (arXiv:1702.06148)
- Hunter (2007) Hunter J. D., 2007, Computing In Science & Engineering, 9, 90
- Jones et al. (2001) Jones E., Oliphant T., Peterson P., et al., 2001, SciPy: Open source scientific tools for Python, http://www.scipy.org/
- Komatsu et al. (2011) Komatsu E., et al., 2011, ApJS, 192, 18
- Lelli et al. (2014) Lelli F., Verheijen M., Fraternali F., 2014, A&A, 566, A71
- Ludlow et al. (2017) Ludlow A. D., et al., 2017, Physical Review Letters, 118, 161103
- Maxwell et al. (2015) Maxwell A. J., Wadsley J., Couchman H. M. P., 2015, ApJ, 806, 229
- Moore (1994) Moore B., 1994, Nature, 370, 629
- Navarro et al. (1996a) Navarro J. F., Eke V. R., Frenk C. S., 1996a, MNRAS, 283, L72
- Navarro et al. (1996b) Navarro J. F., Frenk C. S., White S. D. M., 1996b, ApJ, 462, 563
- Navarro et al. (1997) Navarro J. F., Frenk C. S., White S. D. M., 1997, ApJ, 490, 493
- Nipoti & Binney (2015) Nipoti C., Binney J., 2015, MNRAS, 446, 1820
- Oñorbe et al. (2015) Oñorbe J., Boylan-Kolchin M., Bullock J. S., Hopkins P. F., Kereš D., Faucher-Giguère C.-A., Quataert E., Murray N., 2015, MNRAS, 454, 2092
- Oh et al. (2015) Oh S.-H., et al., 2015, AJ, 149, 180
- Oman et al. (2015) Oman K. A., et al., 2015, MNRAS, 452, 3650
- Oman et al. (2017) Oman K. A., Marasco A., Navarro J. F., Frenk C. S., Schaye J., Benítez-Llambay A., 2017, preprint, (arXiv:1706.07478)
- Oman et al. (2019) Oman K. A., Marasco A., Navarro J. F., Frenk C. S., Schaye J., Benítez-Llambay A., 2019, MNRAS, 482, 821
- Peñarrubia et al. (2012) Peñarrubia J., Pontzen A., Walker M. G., Koposov S. E., 2012, ApJ, 759, L42
- Pérez & Granger (2007) Pérez F., Granger B. E., 2007, Computing in Science and Engineering, 9, 21
- Pineda et al. (2017) Pineda J. C. B., Hayward C. C., Springel V., Mendes de Oliveira C., 2017, MNRAS, 466, 63
- Planck Collaboration et al. (2016) Planck Collaboration et al., 2016, A&A, 594, A13
- Pontzen & Governato (2012) Pontzen A., Governato F., 2012, MNRAS, 421, 3464
- Pontzen & Governato (2014) Pontzen A., Governato F., 2014, Nature, 506, 171
- Pontzen et al. (2015) Pontzen A., Read J. I., Teyssier R., Governato F., Gualandris A., Roth N., Devriendt J., 2015, MNRAS, 451, 1366
- Power et al. (2003) Power C., Navarro J. F., Jenkins A., Frenk C. S., White S. D. M., Springel V., Stadel J., Quinn T., 2003, MNRAS, 338, 14
- Read & Gilmore (2005) Read J. I., Gilmore G., 2005, MNRAS, 356, 107
- Read et al. (2016) Read J. I., Agertz O., Collins M. L. M., 2016, MNRAS, 459, 2573
- Read et al. (2018) Read J. I., Walker M. G., Steger P., 2018, MNRAS, 481, 860
- Santos-Santos et al. (2018) Santos-Santos I. M., Di Cintio A., Brook C. B., Macciò A., Dutton A., Domínguez-Tenreiro R., 2018, MNRAS, 473, 4392
- Sawala et al. (2015) Sawala T., et al., 2015, MNRAS, 448, 2941
- Sawala et al. (2016) Sawala T., et al., 2016, MNRAS, 457, 1931
- Schaller et al. (2015) Schaller M., et al., 2015, MNRAS, 451, 1247
- Schaye (2004) Schaye J., 2004, ApJ, 609, 667
- Schaye et al. (2015) Schaye J., et al., 2015, MNRAS, 446, 521
- Sharma et al. (2016) Sharma M., Theuns T., Frenk C. S., Cooke R. J., 2016, preprint, (arXiv:1611.03868)
- Simpson et al. (2017) Simpson C. M., Grand R. J. J., Gómez F. A., Marinacci F., Pakmor R., Springel V., Campbell D. J. R., Frenk C. S., 2017, preprint, (arXiv:1705.03018)
- Spergel & Steinhardt (2000) Spergel D. N., Steinhardt P. J., 2000, Physical Review Letters, 84, 3760
- Springel (2005) Springel V., 2005, MNRAS, 364, 1105
- Springel et al. (2001) Springel V., White S. D. M., Tormen G., Kauffmann G., 2001, MNRAS, 328, 726
- Strigari et al. (2014) Strigari L. E., Frenk C. S., White S. D. M., 2014, preprint, (arXiv:1406.6079)
- Teyssier et al. (2013) Teyssier R., Pontzen A., Dubois Y., Read J. I., 2013, MNRAS, 429, 3068
- Tollet et al. (2016) Tollet E., et al., 2016, MNRAS, 456, 3542
- Tolstoy et al. (2009) Tolstoy E., Hill V., Tosi M., 2009, ARA&A, 47, 371
- Van Der Walt et al. (2011) Van Der Walt S., Colbert S. C., Varoquaux G., 2011, Computing in Science & Engineering, 13, 22
- Vogelsberger et al. (2014) Vogelsberger M., Zavala J., Simpson C., Jenkins A., 2014, MNRAS, 444, 3684
- Walker & Peñarrubia (2011) Walker M. G., Peñarrubia J., 2011, ApJ, 742, 20
- Weisz et al. (2011) Weisz D. R., et al., 2011, ApJ, 739, 5
- Wetzel et al. (2016) Wetzel A. R., Hopkins P. F., Kim J.-h., Faucher-Giguère C.-A., Kereš D., Quataert E., 2016, ApJ, 827, L23
- Zolotov et al. (2012) Zolotov A., et al., 2012, ApJ, 761, 71
- de Blok (2010) de Blok W. J. G., 2010, Advances in Astronomy, 2010, 789293
Appendix A Short perturbations are less efficient than long perturbations
Fig. 6 suggests that long perturbations, in contrast with shorter ones, are more effective at reducing the inner mass of dark matter haloes. We use a set of idealized simulations to demonstrate that this is indeed expected.
We consider a set of numerical experiments in which we perturb an idealized dark matter halo repeatedly with perturbations of different timescales. More particularly, we simulate a perfectly spherical collisionless halo described by a Hernquist density profile (Hernquist, 1990):
| (4) |
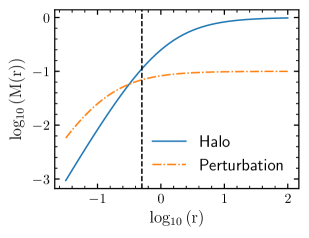
The halo, realised with particles in isotropic orbits, is evolved using the Gadget-2 code (Springel, 2005). Perturbations are modelled with an external spherical potential also described by a Hernquist density profile. For simplicity we adopt a system of units in which the gravitational constant, the halo scale radius, and the mass are , and , respectively. The structural parameters of the external perturbations are and . As shown in Fig. 13, these spherically symmetric perturbations are gravitationally dominant only in the inner regions of the halo.
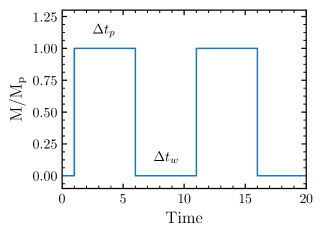
The external perturbations are grown instantaneously, after which they perturb the halo during a timescale . After this period of time the perturbation is removed, also instantaneously, and the halo is allowed to relax for a “waiting” period of time . We only consider the particular case in which . The complete cycle of two perturbations is shown schematically in Fig. 14. We note that our perturbation scheme is very particular; results will in general depend not only on the duration of single perturbations, but also on their separation.
The dark matter halo is evolved for a period of time , which roughly corresponds to the free-fall time of the system at . We run 4 simulations varying the frequency of perturbations, which are turned on after (which roughly corresponds to the time required to complete a circular orbit at ).
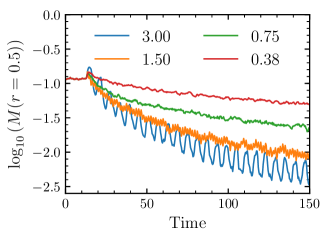
The result of these series of experiments is shown in Fig. 15, where we plot the enclosed dark matter mass within a sphere of radius – the free-fall time at this radius is – as a function of time, for different perturbation timescales. Individual perturbations that are active over a long period of time are clearly more effective at driving mass out of the system than shorter ones. Consequently, their integrated effect is also larger. Consider, for example, the perturbations with timescale (blue curve). These are a factor of 2 less frequent than those operating over the longer timescale (orange curve), yet their integrated effect, measured at , is almost a factor of larger by comparison. Perturbations acting over timescales much shorter than the free-fall time of the system at this radius, although very numerous, are very inefficient. Note, however, that in all cases the enclosed dark matter mass decreases secularly and the halo does not contract significantly in response to the perturbations, similarly to what is observed for the dwarf D1 (left panel of Fig. 6).
Perturbations that are much longer than the free-fall time are expected to have a maximal individual effect. Therefore, their maximum impact to the enclosed halo mass will ultimately depend on how numerous they are. Fig. 16 shows the cumulative effect of very long perturbations. In contrast to short perturbations, the more numerous the long perturbations are, the greater their integrated impact on the enclosed halo mass. Thus, although longer perturbations are more efficient individually, they must be numerous enough to cause a systematic reduction to the inner mass of the halo. Thus, having very few, separated, and long perturbations, will make the inner dark matter halo to evolve toward states of contraction and expansion, similarly to what is observed for dwarf D3 (right panel of Fig. 6).
We end by noting that the quantitative understanding of these processes requires a comprehensive study of the interplay between the mass distribution of the perturbations, their duration, and separation between them. We are currently performing such a study and will report on this in a forthcoming paper.
Appendix B Evolution of the inner dark matter mass for various values of
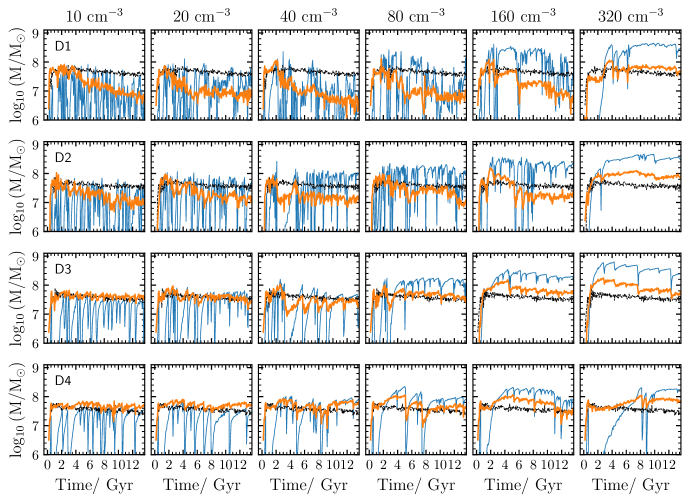
The two examples shown in Fig. 6 highlight the main mechanisms of core formation that apply to the EAGLE model. In Fig. 17 we show the evolution of the enclosed dark matter mass within a sphere of radius for the four zoom-in dwarf galaxies considered in our work (different rows), and for six different values of (different columns). The thin blue line shows the enclosed gas mass at the same radius; the black dashed line shows results from the LT fiducial model.
A number of distinctive trends are seen in this figure. Firstly, as discussed in Sec. 3, choosing higher values for the density threshold for star formation allows more gas to accumulate in the inner regions of dwarfs before it is turned into stars. This is clearly seen when comparing different columns of Fig. 17. Note, however, that star formation might occur at much inner radii than , and therefore the amount of gas mass contained at this radius may not necessarily reflect the actual value of . Secondly, the degree of “burstiness” of the dwarfs scales with mass: at a given gas threshold density, the timescale of baryonic perturbations becomes shorter as the dwarfs become more massive. Thirdly, most of the dark matter mass contained at this radius is more efficiently evacuated after a number of distinctive gaseous blowouts. However, dark matter may be recovered on a time interval set by the timescale over which baryons are reaccreted, unless the subsequent accretion and blowouts of gas occurs over a short period of time (“burstiness”).
Appendix C Relation between the inner slope of the dark matter profile and
In Sec. 4.2 we compared the inner dark matter profile of our high-resolution cosmological simulations with those of the NIHAO simulations, as reported by Tollet et al. (2016). The comparison was done for the specific value of . In this section, we perform a similar comparison but for all values of explored in our work and using all four zoom-in dwarf galaxies.
Fig. 18 shows the inner slope of the dark matter density profile, measured at of , as a function of , for different values of . Each symbol shows the median for each zoom-in dwarf, taken over time using 100 snapshots equally spaced in time after redshift . The coloured shaded regions show the 10th-90th percentiles of the distributions.
For the lowest values of (LT simulations), the inner slope is largely consistent with , independently of . For , the inner slope of the dark matter profile becomes a function of , and agrees well with results reported by Tollet et al. (2016) (dashed line). This is particularly true for . For values of , the agreement with Tollet et al. (2016) becomes poorer. In the range , our results also depart from those of NIHAO simulations, although our model exhibits little variation with . For , the inner slope of all zoom-in dwarfs becomes steeper, as discussed previously. We therefore conclude that, for the EAGLE model of galaxy formation, the relation between the inner slope of the density profile and the ratio is sensitive to the assumed value of .