Original Article \paperfieldSubmitted to Magnetic Resonance in Medicine \contrib[\authfn1]Equally contributing authors. \contribManuscript word count: 3987 \corraddressPaddy J. Slator PhD, Centre for Medical Image Computing, Department of Computer Science, University College London, London, UK \corremailp.slator@ucl.ac.uk \fundinginfoNational Institutes of Health (NIH) Human Placenta Project, Grant/Award Number: 1U01HD087202-01; Wellcome Trust (Sir Henry Wellcome Fellowship), Grant/Award Number: 201374/Z/16/Z; EPSRC, Grant/Award Numbers: N018702, M020533, EP/N018702/1; National Institute for Health Research (NIHR) Professorship (Chappell), Grant/Award Number: RP-2014-05-019; Tommy’s Charity and Holbeck Charitable Trust
Combined Diffusion-Relaxometry MRI to Identify Dysfunction in the Human Placenta
Abstract
Purpose: A combined diffusion-relaxometry MR acquisition and analysis pipeline for in-vivo human placenta, which allows for exploration of coupling between T2* and apparent diffusion coefficient (ADC) measurements in a sub 10 minute scan time.
Methods: We present a novel acquisition combining a diffusion prepared spin-echo with subsequent gradient echoes. The placentas of 17 pregnant women were scanned in-vivo, including both healthy controls and participants with various pregnancy complications. We estimate the joint T2*-ADC spectra using an inverse Laplace transform.
Results: T2*-ADC spectra demonstrate clear quantitative separation between normal and dysfunctional placentas.
Conclusions: Combined T2*-diffusivity MRI is promising for assessing fetal and maternal health during pregnancy. The T2*-ADC spectrum potentially provides additional information on tissue microstructure, compared to measuring these two contrasts separately. The presented method is immediately applicable to the study of other organs.
keywords:
placenta, diffusion, relaxometry, microstructure, multimodal MRI, inverse Laplace transform1 Introduction
The placenta provides the vital link between mother and fetus during pregnancy. It is implicated in many major pregnancy complications, such as pre-eclampsia (PE) and fetal growth restriction (FGR) [1]. PE affects 3-5% of pregnancies [2] and is a major cause of maternal and perinatal mortality [3, 4]. Late onset FGR, defined as that diagnosed after 32 weeks [5], affects 5-10% of pregnancies [6]. It is strongly associated with stillbirth [7, 8], pre-eclampsia [9], and late preterm birth [10]. For all these disorders, it is likely that placental dysfunction occurs before the onset of symptoms. New techniques for imaging the placenta therefore have the potential to improve prediction, diagnosis, and monitoring of pregnancy complications.
Placental MRI is emerging as a technique with substantial promise to overcome some disadvantages of ultrasound. For example, ultrasound parameters of fetal wellbeing are imperfect for determining which fetuses have late-onset FGR and are at greatest risk of adverse perinatal outcome, as opposed to those that are constitutionally small but healthy [11, 6]. Assessing the placenta with MRI has the potential to make this distinction. Two MRI modalities that show great promise for assessing placental function are T2∗ relaxometry - which has the potential to estimate oxygenation levels [12, 13], and diffusion MRI (dMRI) - which can estimate microstructure and microcirculatory properties [14, 15, 16, 17].
T2∗ relaxometry exploits the inherent sensitivity of the transverse relaxation time to the biochemical environment of tissue. In particular, the paramagnetic properties of haemoglobin mean that the T2* time constant can be used as a proxy estimation of oxygenation [18]. In placental studies, T2* is generally lower in FGR cases [19, 20, 21, 22]. A typical experiment acquires gradient echo data at several echo times (TE), either in separate or multi-echo scans, and hence estimates the T2* constant of the tissue. No diffusion weighting is typically applied to these scans. Applying diffusion gradients with different strengths (b-value) and directions provides sensitivity to various microstructural length scales and orientations. These measurements are usually taken at a fixed TE. In the placenta, dMRI has shown promise for discrimination between normal pregnancies and FGR [23, 24, 14, 25, 15, 26], and early onset PE [16]. However, despite the large number of placental T2* and dMRI studies in the literature, no method has shown sufficient discrimination between healthy pregnancies and those with complications to be introduced into routine clinical practice. Methods which combine multiple distinct measurements may provide a way to overcome this. Supporting Information Table 3 summarises T2* and dMRI studies in the placenta to date.
T2* and dMRI-derived measures are both influenced by the presence and composition of distinct tissue compartments (or microenvironments). Diffusion-relaxometry MRI can simultaneously measure multiple MR contrasts; for example by varying both TE and b-value it is possible to probe the multidimensional T2-diffusivity (or T2*-diffusivity) space. MR experiments dating back to the 1990s have simultaneously measured diffusivity and T2 [27, 28, 29, 30, 31]; such experiments are often categorised as diffusion-relaxation correlation spectroscopy (DRCOSY) [32]. These acquisitions naturally pair with multidimensional analysis techniques which quantify multiple tissue parameters simultaneously, and therefore have great potential to yield fine-grained information on tissue microstructure. Such analysis techniques have been recently applied to combined diffusion-relaxometry experiments in the context of nuclear magnetic resonance (NMR) spectroscopy, improving the ability the distinguish different compartments [33, 34]. Recent work applying these techniques to imaging has applications in the T1-diffusivity [35], T2-diffusivity [36, 37], and T1-T2-diffusivity [38] domains. These studies have shown that combining diffusion with other MR contrasts leads to more specific quantification of microscopic tissue compartments. One recent study demonstrated combined T2-diffusivity in the placenta [39], with the aim to separate signals from fetal and maternal circulations.
A major disadvantage of previous diffusion-relaxometry experiments are the very long scan times required when varying multiple contrast mechanisms, such as the TE and diffusion encoding. In this paper, we propose a combined acquisition and analysis technique which can estimate the T2*-ADC spectrum within a clinically viable timeframe. We apply this novel method in the placenta, an organ where T2* and ADC have both been shown to be informative. As well as demonstrating simultaneous estimation of T2* and diffusivity parameters within a clinically viable time, we hypothesise that the joint T2*-ADC spectrum will provide additional information compared to the individual measures.
2 Methods
2.1 Acquisition: Integrated T2∗-Diffusion sampling
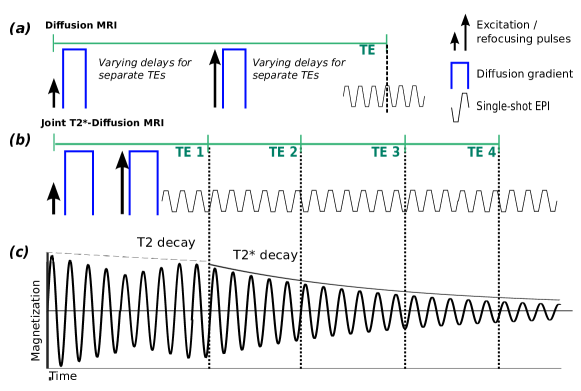
We adapt a novel MRI acquisition strategy, termed ZEBRA [40], in order to sample multiple TEs and diffusion encodings within a single repetition time (TR). The method combines a diffusion prepared spin echo sequence with subsequent gradient echoes. This allows simultaneous quantification of T2* and ADC, as opposed to standard independent multi-echo gradient echo and diffusion sequences (e.g. Figure 1a). Our technique also offers significant speed ups compared to existing T2-diffusivity techniques - which only sample a single TE-diffusion encoding pair for each TR (i.e. Figure 1a). The proposed combined acquisition is shown in Figure 1b. The multiple gradient echoes are acquired with minimal spacing after the initial spin echo and diffusion preparation. We note that by using gradient echo readouts rather than spin echoes, we measure T2∗ rather than T2 (see Figure 1c).
Figure 2 illustrates the resultant sampling of the TE-diffusion encoding domain for the three acquisition techniques presented in Figure 1. Separate multi-echo gradient echo and diffusion sequences do not adequately sample the full domain (Figure 2a). With repeat acquisitions of diffusion encodings at different TEs full sampling of the domain is possible, but very slow (Figure 2b). The proposed acquisition is able to sample the same domain in a much shorter, and clinically viable, scanning time (i.e. Figure 2c).
2.2 Modelling
The simplest model for analysing the data considers single tissue compartments, so that the signal attenuations caused by T2* relaxation and diffusion are both assumed to give rise to a single exponential decay. The MR signal for this combined ADC-T2* model is given by
| (1) |
where is the echo time, is the b-value, is the apparent diffusion coefficient, is the effective transverse relaxation time, and is the signal at the spin-echo time with zero diffusion weighting. is the product of proton density, T2 weighting caused by finite spin echo time, receiver coil properties, and system gain, so we do not treat it as an absolute quantity in the analysis.
A shortcoming of this model is that it assumes the attenuation due to diffusion is mono-exponential, when it is well established that the placental dMRI signal in-vivo is at least bi-exponential, as in the intravoxel incoherent motion (IVIM) model [41]. In this model, the slow and fast attenuating components are associated with diffusion in tissue and pseudo-diffusion in capillaries respectively. Incorporating T2* decay into the IVIM model gives
| (2) |
where is the perfusion fraction and is the pseudo diffusion coefficient. However, it seems likely that the diffusion and pseudo-diffusion compartments have different T2* values. A model incorporating this was proposed by Jerome et al. [42]
| (3) |
where and are the T2* values specific to the pseudo-diffusion and diffusion monoexponential signal components respectively.
A significant limitation of the models presented in Equations (1) (2) and (3) is that the number of signal components is assumed to be known. An alternative approach for analysing the signal is a continuum model, which considers that spins have a spectrum of relaxivity (or diffusivity) values all contributing to the MRI signal. Following Menon et al. [43] the 1D continuum models for relaxometry and diffusion are
Here and are the relaxation and diffusivity spectra to be estimated from the data. We can solve for these spectra using an inverse Laplace transformation, although this is an ill-posed problem requiring regularisation to smooth the resulting spectra [44, 45, 46, 38, 36]. The extension to combined diffusion-relaxometry acquisitions is simple. For the acquisition presented here, where and are simultaneously varied, the signal is (e.g. [47] )
| (4) |
The function we are interested in is the two-dimensional T2*-diffusivity spectrum, , which can be estimated by a regularised 2D inverse Laplace transform. This contains more information than the individual 1D spectra, and is hence more likely to resolve multiple distinct tissue compartments. Although we emphasise that, due to choice of kernels in the continuum models, these distinct compartments - i.e. separate peaks in 2D spectra - are assumed to be the result of monoexponential signal decays.
2.3 Experiments
The sequence described in the methods section was implemented on a clinical Philips Achieva-Tx 3T scanner using the 32ch adult cardiac coil placed around the participant’s abdomen for signal reception. All methods were carried out in accordance with relevant guidelines and regulations; the study was approved by the Riverside Research Ethics Committee (REC 14/LO/1169) and informed written consent was obtained prior to imaging. 17 pregnant women, with gestational age ranging from 23+5 to 35+4 (weeks + days), were successfully scanned using the described technique. Three of these participants, one of whom also had FGR, were diagnosed with pre-eclampsia according to standard definitions [48]. Three participants had chronic hypertension in pregnancy and were analysed distinct from normotensive pregnancy women (the control group). One pregnant woman with chronic hypertension was scanned twice, four weeks apart, and developed superimposed pre-eclampsia by the second scan. The full participant details are given in Table 1.
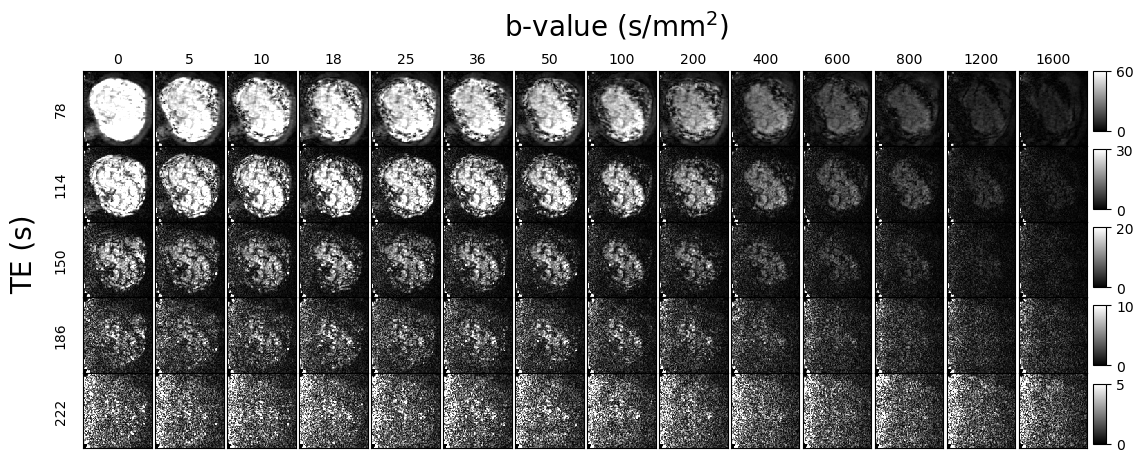
The combined T2∗-diffusivity scan was acquired with the proposed sequence, a dMRI prepared spin echo followed by multiple gradient echos. The number and timing of the gradient echos varied across scans (see Table 1), with most scans having five TEs. The diffusion encodings were chosen specifically for the placenta, as previously reported [49, 50], with 3 diffusion gradient directions at b = [5, 10, 25, 50, 100, 200, 400, 600, 1200, 1600] s mm-2, 8 directions at b = 18 s mm-2, 7 at b = 36 s mm-2, and 15 at b = 800 s mm-2. Further parameters were FOV = 30032084 mm, TR = 7 s, SENSE = 2.5, halfscan = 0.6, resolution = 3mm3. One participant was scanned at higher resolution: 2 mm isotropic. The total acquisition time was 8 minutes 30 seconds. We acquired all images coronally to the mother. Attempting to acquire images in the same plane relative to the placenta would be very difficult, due to the heterogeneity in placental positioning and curvature across subjects. In clinical practice the imaging plane with respect to the placenta has to vary widely; our samples allow us to demonstrate the method across a range of orientations. Supporting Information Figure S1 displays raw data from a single acquisition.
2.4 Model fitting
We first manually defined a region of interest (ROI) containing the whole placenta and adjacent uterine wall section on the first b=0 image with the lowest TE. We fit the T2*-ADC model described in Equation (1) voxelwise to the data (all TEs and all b-values). The fitting consisted of two-step (grid search followed by gradient descent) maximum log-likelihood estimation assuming Rician noise, similar to that previously described [17], with the exception that we use the unnormalised MRI signal. The gradient descent fitting constraints were as follows: T2* was constrained between 0.001 s and 1 s, the ADC between 10-5 and 1 mm2 s-1, and S0 between 0.001 and . We fixed the SNR for fitting to 20 for all voxels in all scans.
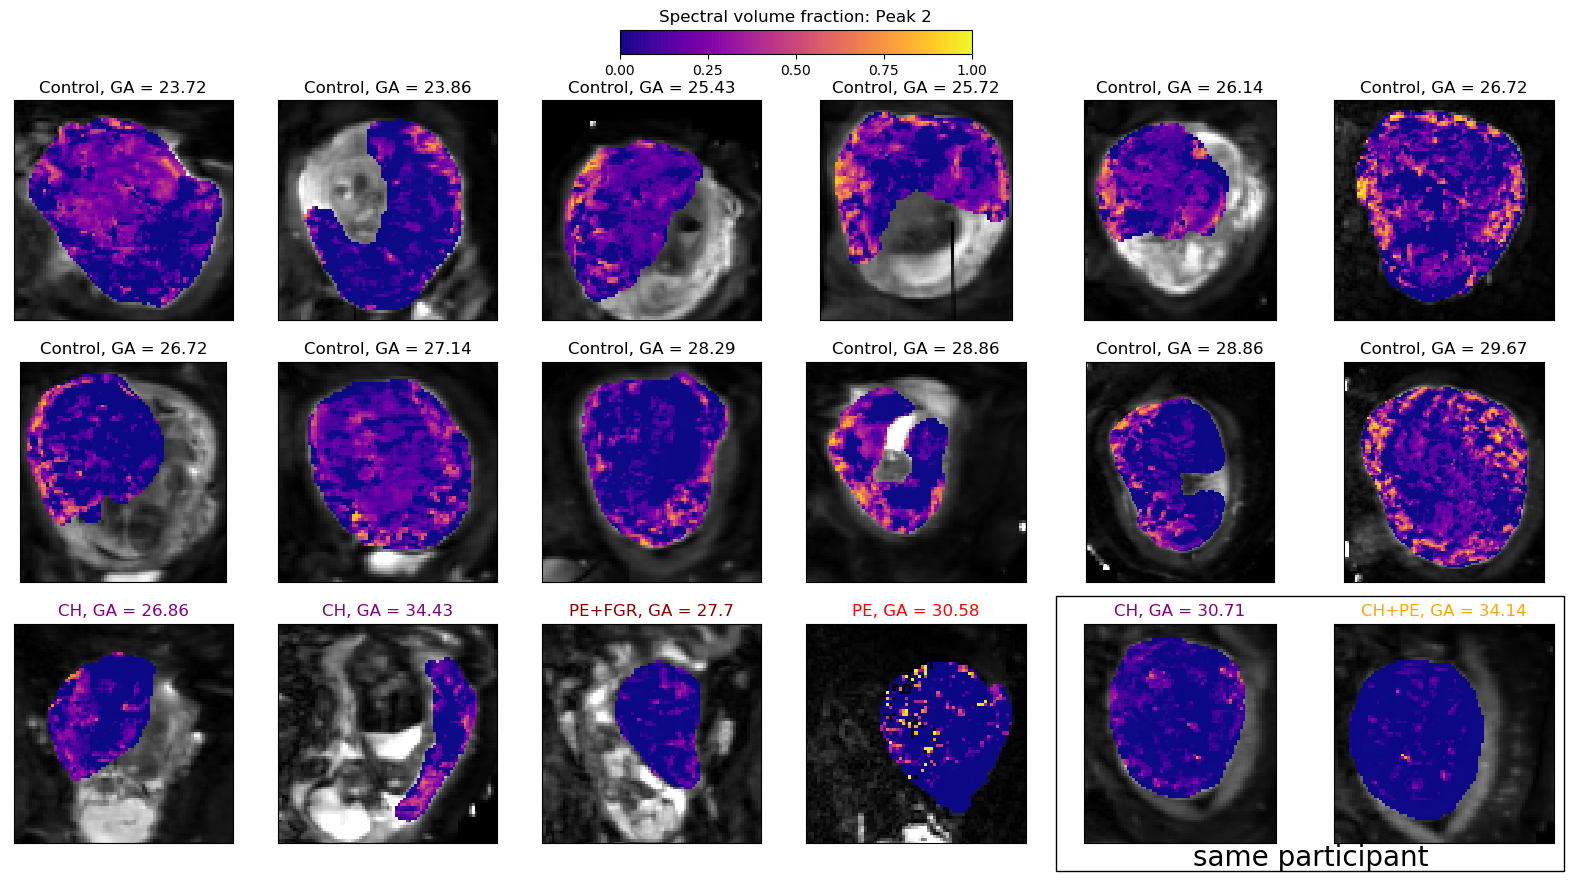
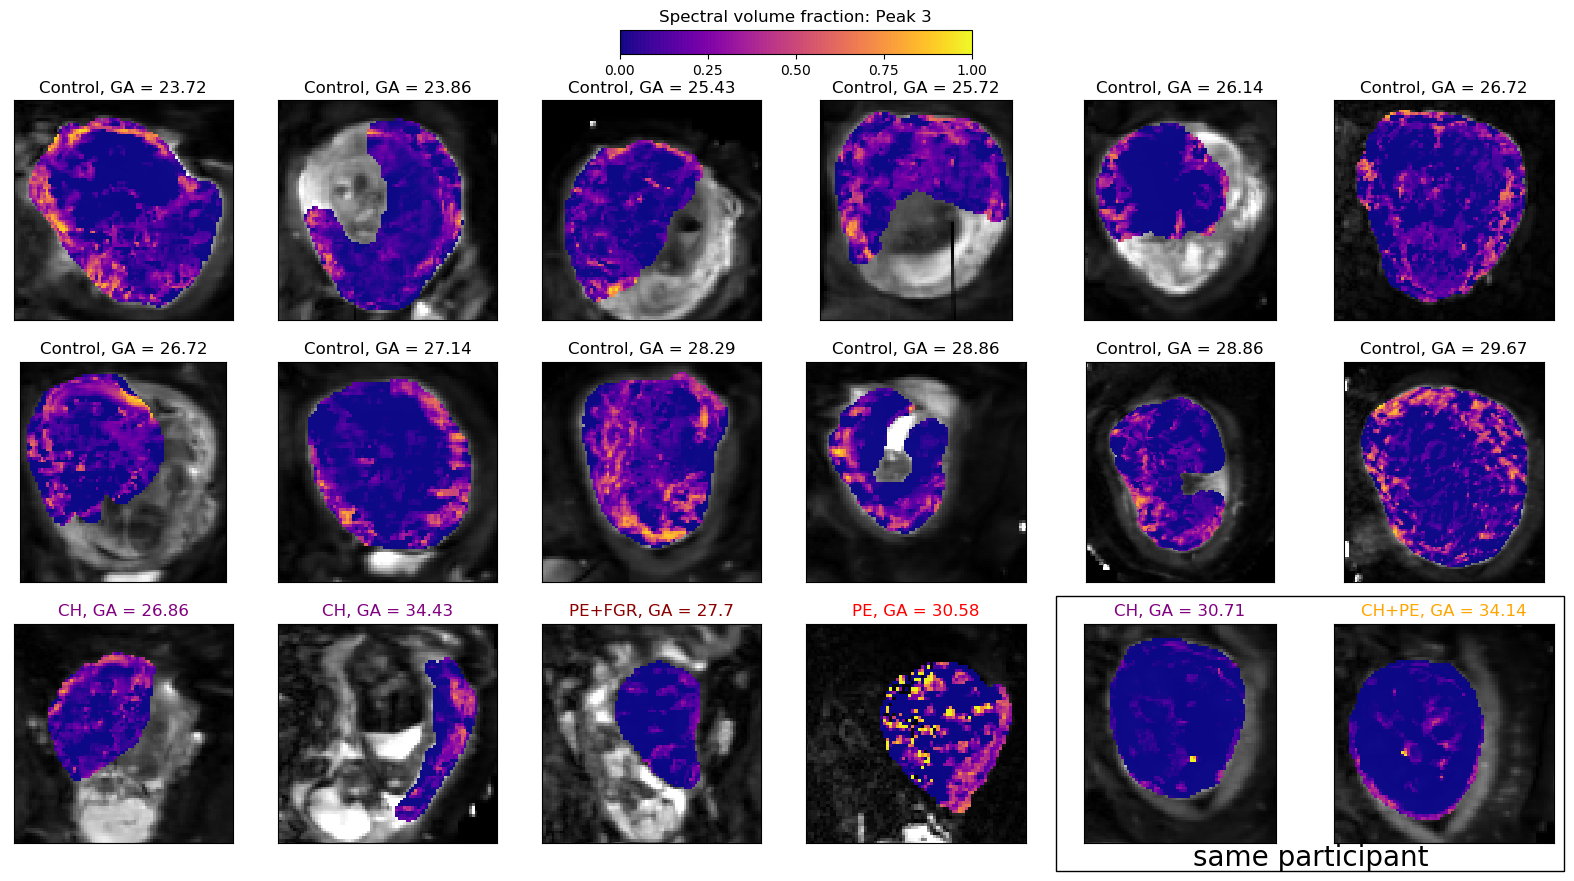
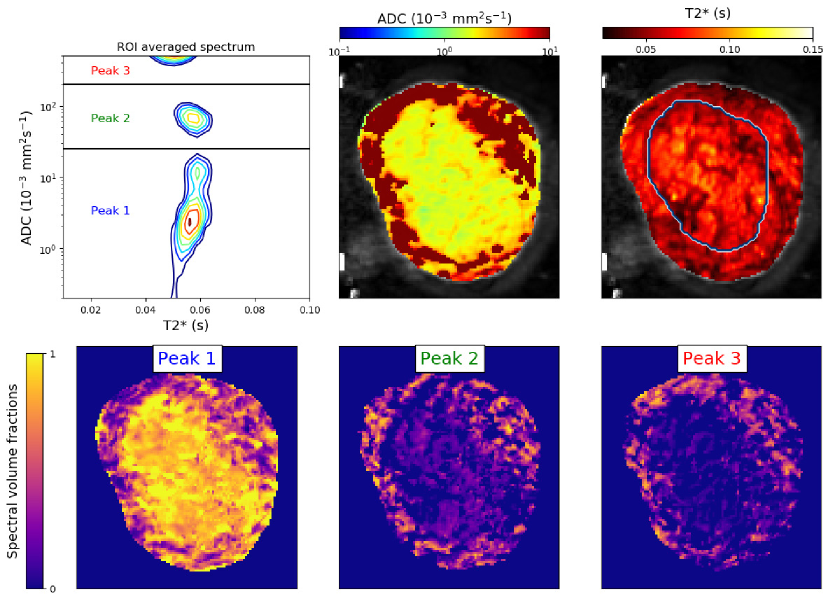
We calculated the T2*-ADC spectrum for each participant from the signal averaged over the ROIs, using the MERA toolbox [51], which incorporates minimum amplitude energy regularization as described by Whittall et al. [52]. We also calculated the T2*-ADC spectra voxelwise in all participants. We next quantified the spatial variation in T2*-ADC spectral components across the placenta and uterine wall with volume fraction maps, using a similar approach to Benjamini et al. [38] and Kim et al. [36]. Specifically, by inspecting the ROI-averaged spectra we chose a set of boundaries - based on the most common peak areas - which split the T2*-ADC domain into regions. These boundaries were the same across all participants, and are given in Table 2. For each voxel’s T2*-ADC spectrum, we then calculated the weight of the voxelwise spectra contained in each of these regions. By normalising these weights to sum to 1 across all regions, we produced spectral volume fraction estimates for each voxel. Figure 3 shows an illustrative example of this calculation; the spectral volume fraction essentially quantifies the proportion of each voxel’s spectrum which lies in each of the highlighted regions in the top-left panel.
3 Results
Figure 3 demonstrates the full analysis pipeline output for a single participant. We next present the parameter maps from combined ADC-T2* model fits (Figures 4 and 5) and spectral volume fraction maps (Supporting Information Figures S3, S4 and S5) for all participants. We probe the changes across gestation and in disease cases by examining the T2*-ADC spectra across all participants (Figures 6 and 7). Finally, in order to assess the independence of our diffusivity and relaxometry measurements, we plot the correlation between the derived ADC and T2* values (Supporting Information Figure S6).
The first panel in Figure 3 shows the placenta and uterine wall ROI averaged T2*-ADC spectrum for a single participant (scanned at higher resolution). We observe three peaks, clearly separated by ADC value but with similar T2* values. ADC and T2* maps show distinctive spatial patterns. The ADC is much higher in the uterine wall than the placenta. T2* maps show distinct ‘lobes’ surrounded by a patchwork of low T2* values, with many lobes displaying a small region of higher T2* in the centre. The bottom row of Figure 3 displays voxelwise spectral volume fractions, obtained by integrating (i.e summing spectral weights) within three regions of the T2*-ADC space, as described in Methods. The domain with the lowest ADC (e.g. peak 1) is associated with areas within the placenta, and the two domains (peaks 2 and 3) with higher ADC are more prominent in the uterine wall.
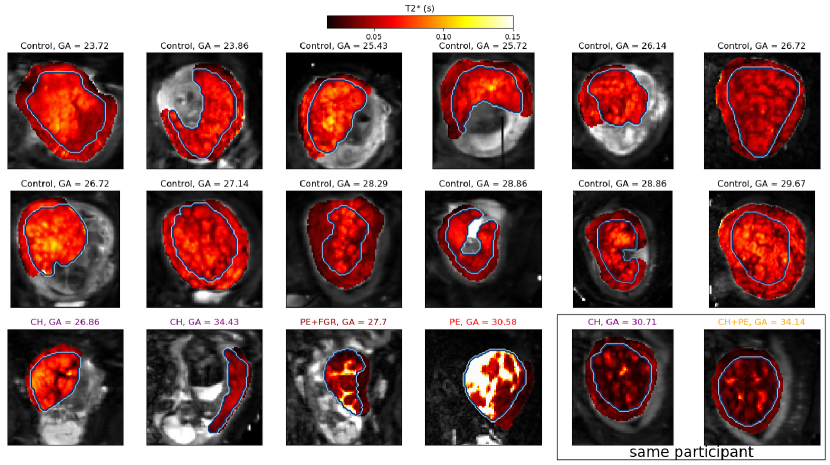
Figure 4 shows T2* maps across all participants from the combined T2*-ADC fit. The patterns are consistent with those previously reported in the literature [53, 50]. In most participants regions of high T2* encircled by low T2* borders are clearly visible, and most likely correspond to placental lobules, with high T2* indicating the presence of oxygenated blood. In agreement with previous observations the regions with low T2* are more prominent in pre-eclampsia [50], and FGR [22, 54] placentas.
ADC maps (Figure 5) also show anatomically-linked qualitative features which are consistent across participants. In all scans from the healthy pregnant group the ADC shows a significant increase at the border between the placenta and the uterine wall. This is most likely explained by the high levels of blood flow in these areas. This bordering area of high ADC is absent from many disease placentas. Additionally placentas from women with chronic hypertension and pre-eclampsia often show a distinctive pattern - small patches of high ADC surrounded by very low ADC.
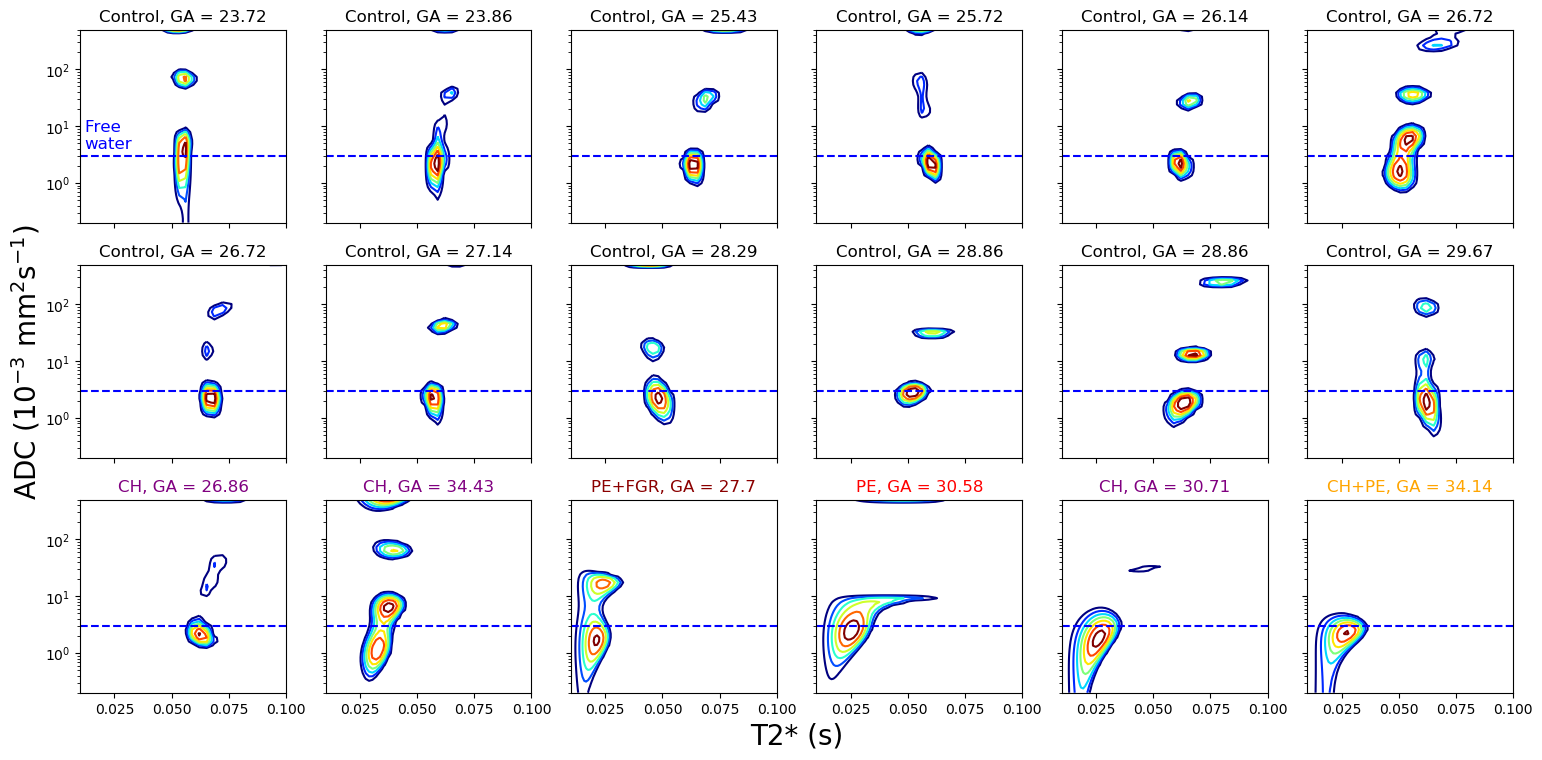
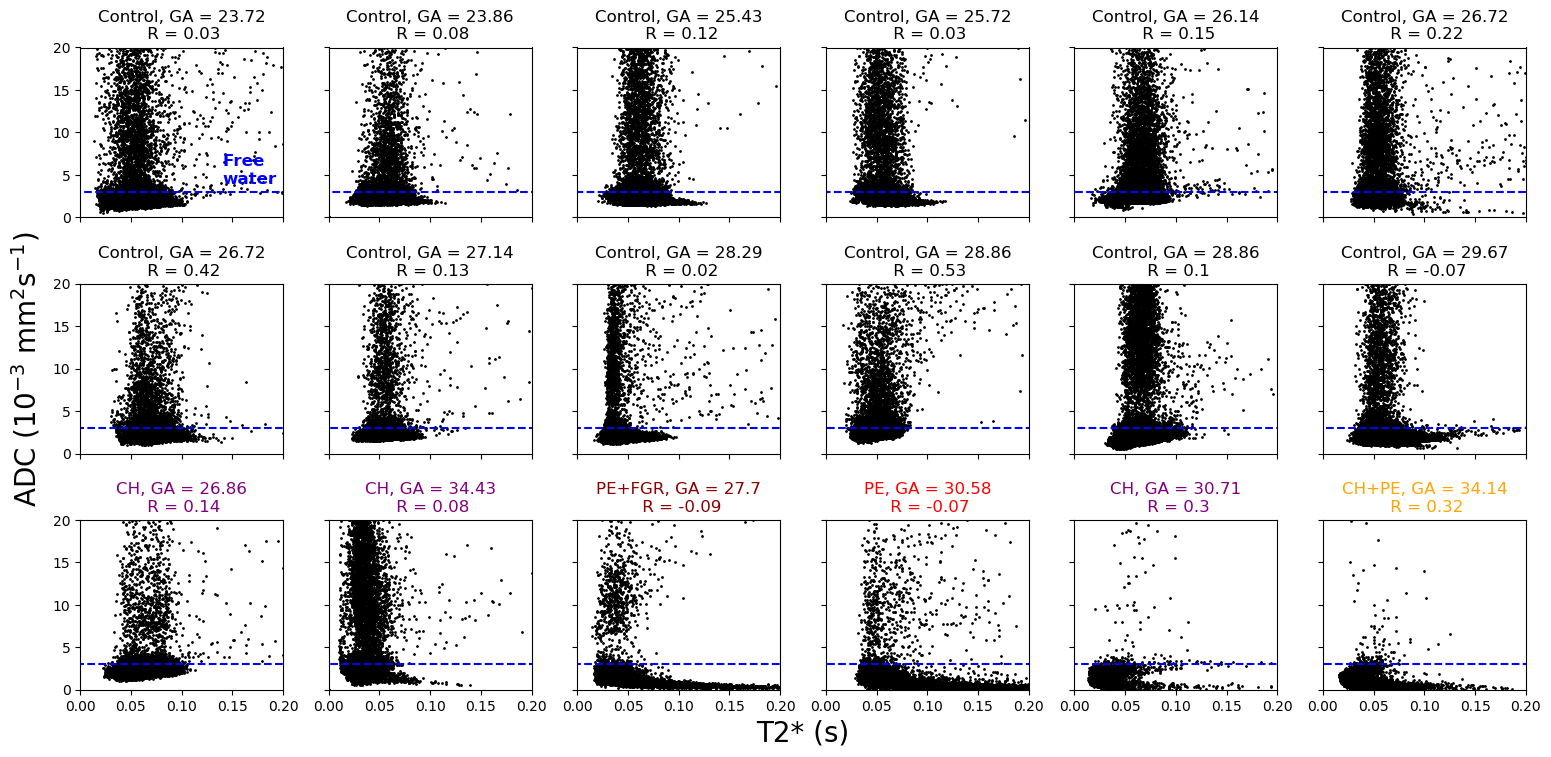
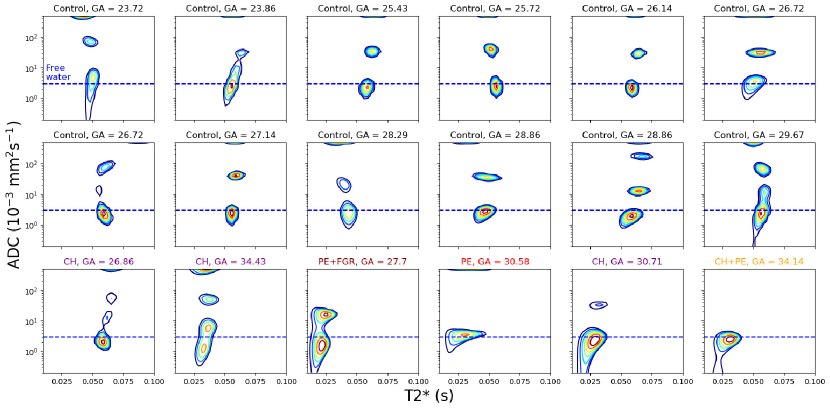
Figure 6 displays the spatially averaged T2*-ADC spectra for ROIs containing the placenta and uterine wall. We clearly observe separate peaks in all control participants, strongly suggesting the presence of multiple tissue compartments with distinct properties. In the vast majority (11/12) of these spectra from healthy controls we see at least three clearly separated peaks. The ADC values of two of these peaks are typically above the diffusivity of water in free media (Figure 6, blue dashed lines), suggesting multiple microenvironments with different incoherent flow speeds. These peaks, and their corresponding tissue compartments, appear more clearly separated by ADC (note the log-scale on the y-axis) than by T2* value. We also observed three distinct peaks in placentas from chronic hypertensive women. Interestingly, we did not see three distinct peaks in any spectra from participants with pregnancy complications (three PE, one PE+FGR). There is a distinct pattern in the T2*-ADC spectra for the three PE participants - a left and downward shift in the lowest peak. This suggests a decrease in both ADC and T2* distributions compared to control placentas. There is a similar leftward shift in the PE+FGR placental spectrum; however, the downward shift is not as pronounced, with the middle peak appearing to merge with the lowest peak. The peak with highest ADC often appears to span the boundary of the domain in which the inverse Laplace transform is calculated. This is likely because we are unable to sample enough low b-values to accurately estimate this very fast diffusing component - i.e. there is signal in the volume, which has all attenuated by the s mm-2 volume.
Spectral volume fraction maps showed similar patterns across all control participants (Supporting Information Figures S3, S4 and S5); peaks with higher ADC being more prominent in the uterine wall. This likely reflects the high flowing blood volumes in these areas, akin to the maps in Figure 5.
Supporting Information Figure S6 shows that we did not observe a consistent correlation between T2* and ADC values across participants. This suggests that we acquire complementary information from these two MR contrasts. Interestingly, we did not observe the small placental areas with high T2* and high ADC that we saw in previous work [50].
4 Discussion and Conclusion
4.1 Summary
This study demonstrates accelerated diffusion-relaxometry MRI on the in-vivo human placenta. Compared to existing approaches, it allows denser, faster, and more flexible sampling of the 2D (TE - diffusion encoding) acquisition space. This in turn allows visualization of the T2*-ADC spectrum, and thus provides enhanced capacity to separate multiple tissue microenvironments. The technique was demonstrated on 17 pregnant participants, including 3 scans on placentas clinically assessed as from women with pregnancy complications. In the following sections, we first putatively associate the observed T2*-diffusivity spectral peaks with distinct placental tissue microenvironments. We then hypothesise as to how the spectral changes observed in cases with complications reflect changes in these tissue microenvironments. Finally we discuss the clinical potential of the presented technique, which we emphasise is independent of the biological interpretation.
4.2 Biological interpretation of T2*-diffusivity spectra
In all controls, we observed a peak with high ADC, typically above mm2 s-1. Additionally, in nearly every control participant (11/12) we observe two further clearly distinct peaks, with ADC around 2 mm2 s-1 for the lower, and between and mm2 s-1 for the middle peak (Figure 6).
The appearance of three peaks clearly separated by diffusivity in all but one control placenta is consistent with each peak corresponding to a distinct placental tissue microdomain. Solomon et al. previously reported three placental compartments in mice [55], with these attributed to a slow-diffusing maternal blood compartment, a fetal blood compartment with diffusivity around two orders of magnitude faster, and an intermediate compartment associated with active filtration of fluid across the fetal-maternal barrier. We therefore speculatively assign tissue compartments to each of these three peaks in healthy control placentas as follows. The compartment with the lowest ADC, which has typical values (2 mm2 s-1) comparable to the diffusivity of water in tissue, is associated with water which is not subject to significant incoherent flow effects - this may be within tissue or slow-moving maternal blood. The highest ADC compartment is associated with perfusing fetal blood, and the intermediate compartment with fluid transitioning between the maternal and fetal circulations - a significant proportion of which may reside within tissue. This is consistent with the spectral volume fraction maps for the peaks with higher ADC (Supporting Information Figures S4 and S5), which show higher intensity in the vascular areas bordering the placenta. The accuracy of these speculative tissue compartment assignments could be tested by comparison with ex-vivo histology. Although such comparisons are notoriously challenging, achieving detailed correspondence would be highly valuable.
4.3 Spectral changes in disease
We observed three main trends in the T2*-diffusivity spectrum which discriminated between control and placentas from women with pregnancy complications:
-
1.
The disappearance of one (or both) of the middle and higher peaks
-
2.
The lowest peak has a lower T2*
-
3.
The lowest peak has a lower diffusivity
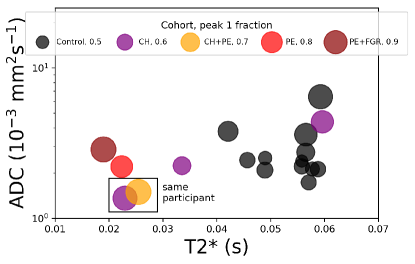
In placentas from women with pre-eclampsia we generally saw all three trends (Figure 6). The lower T2* mirrors the previously reported decrease in T2* in pre-eclampsia placentas [50]. We saw the same trend in the FGR+PE case, and note that lower T2* values have also been observed in FGR placentas [56, 22]. Regarding the lower diffusivity in the lowest peak, our initial speculation is that this could reflect increased water restriction due to inflammation - since placental inflammation is associated with PE [57]. This may relate to the disappearance of the middle peak, which we hypothesis could reflect decreased maternal-fetal fluid exchange. Inflammation is a potential mechanism facilitating the reduction in exchange, although we emphasise that this speculative link can only be confirmed (or refuted) by comparison with post-delivery histology. Figure 7 presents these observed changes in the T2*-ADC spectrum in a single plot, showing clear separation between the control and pregnancy complication (i.e. PE, PE+FGR) participants. We plot the position of the spectral peak with the lowest ADC in the T2*-ADC domain, with the marker area corresponding to the peak’s volume fraction. In this way, we capture both the peak shift, and the higher volume fraction due to the disappearance of the middle or higher peaks. Although these results are highly encouraging, we clearly need to scan many more participants, both control and women with pregnancy complications, to determine the discriminative power of these measures.
Limitations and Future Work
We used an “out-of-the-box" inverse Laplace transform toolbox to calculate the T2*-ADC spectrum. There are a number of known weaknesses for this method, including the need for regularization. In this study we chose minimum amplitude energy regularization. Future work could assess the utility of alternative optimization approaches, such as spatially constrained [36], or constrained by the 1D spectra [38].
Our T2* estimates are generally lower than those previously reported [50]. This may be due to the larger voxel size, leading to partial volume effects around areas with high T2*, such as spiral artery inlets. It could also be due to signal attenuation due to diffusion during the gradient echoes, something which we did not account for in our analysis.
The presented T2*-ADC spectral analysis assesses the data in two dimensions, but there are more dimensions to the data - such as diffusion gradient direction - which we did not include in our analysis. Therefore this dataset has the potential to be further analysed, for example with microstructural models that account for anisotropy in the signal.
In this study, we used b-values and gradient directions optimised for dMRI at a single TE [58, 50], and the TEs were constrained by the EPI read-out train length. Separate optimisation of T2∗ relaxometry and dMRI acquisition parameters is 1D (choice of TEs, choice of b-values). However, when moving to combined T2∗-diffusion this becomes a 2D problem - for example, in the isotropic case we need to choose optimal TE-diffusion encoding pairs. In future, we plan to optimise these TE-diffusion encoding values in order to give the best sampling of the 2D parameter space, and enhance estimation of the 2D spectra.
4.4 Outlook and clinical application
The combined acquisition and analysis technique presented here offers fast, simultaneous, and multidimensional assessment of placental T2* and diffusivity in less than 10 minutes. These two MR contrasts have been shown elsewhere to be sensitive to placental pathologies, we hypothesise that their simultaneous assessment could enable better separation of healthy and poorly functioning placentas. This is supported by the fact that we did not see consistent correlation between T2* and ADC values (Supporting Information Figure S6), suggesting that these modalities offer complementary information. This reinforces the value of the novel technique presented here as a quantitative tool for assessment of pregnancy complications, with the potential to ultimately inform clinical decisions. Furthermore, we believe that fast calculation of the T2*-ADC spectrum has many potential applications in other areas of biomedical research.
acknowledgements
We thank the midwives, obstetricians and radiographers who played a key role in obtaining the data sets. We would also like to thank all participating mothers.
conflict of interest
The authors have no conflicts of interest to declare.
References
- Brosens et al. [2011] Brosens I, Pijnenborg R, Vercruysse L, Romero R. The “Great Obstetrical Syndromes” are associated with disorders of deep placentation. American Journal of Obstetrics and Gynecology 2011 mar;204(3):193–201. http://www.ncbi.nlm.nih.gov/pubmed/21094932.
- Mol et al. [2016] Mol BWJ, Roberts CT, Thangaratinam S, Magee LA, de Groot CJM, Hofmeyr GJ. Pre-eclampsia. The Lancet 2016 mar;387(10022):999–1011. http://www.ncbi.nlm.nih.gov/pubmed/26342729http://linkinghub.elsevier.com/retrieve/pii/S0140673615000707.
- Duley [2009] Duley L. The Global Impact of Pre-eclampsia and Eclampsia. Seminars in Perinatology 2009 jun;33(3):130–137. https://www.sciencedirect.com/science/article/pii/S0146000509000214?via{\%}3Dihub.
- Say et al. [2014] Say L, Chou D, Gemmill A, Tunçalp Ö, Moller AB, Daniels J, et al. Global causes of maternal death: A WHO systematic analysis. The Lancet Global Health 2014 jun;2(6):e323–33. http://www.ncbi.nlm.nih.gov/pubmed/25103301.
- Gordijn et al. [2016] Gordijn SJ, Beune IM, Thilaganathan B, Papageorghiou A, Baschat AA, Baker PN, et al. Consensus definition of fetal growth restriction: a Delphi procedure. Ultrasound in Obstetrics & Gynecology 2016 sep;48(3):333–339. http://doi.wiley.com/10.1002/uog.15884.
- Figueras et al. [2018] Figueras F, Caradeux J, Crispi F, Eixarch E, Peguero A, Gratacos E. Diagnosis and surveillance of late-onset fetal growth restriction. American journal of obstetrics and gynecology 2018 feb;218(2S):S790–S802.e1. http://www.ncbi.nlm.nih.gov/pubmed/29422212.
- Gardosi et al. [2013] Gardosi J, Madurasinghe V, Williams M, Malik A, Francis A. Maternal and Fetal Risk Factors for Stillbirth: Population Based Study. BMJ: British Medical Journal 2013 jan;346(January):f108. http://www.ncbi.nlm.nih.gov/pubmed/23349424http://www.pubmedcentral.nih.gov/articlerender.fcgi?artid=PMC3554866http://www.pubmedcentral.nih.gov/articlerender.fcgi?artid=3554866{\&}tool=pmcentrez{\&}rendertype=abstract.
- Bukowski et al. [2017] Bukowski R, Hansen NI, Pinar H, Willinger M, Reddy UM, Parker CB, et al. Altered fetal growth, placental abnormalities, and stillbirth. PLOS ONE 2017 aug;12(8):e0182874. http://www.ncbi.nlm.nih.gov/pubmed/28820889http://www.ncbi.nlm.nih.gov/pubmed/28820889http://www.ncbi.nlm.nih.gov/pubmed/28820889.
- Srinivas et al. [2009] Srinivas SK, Edlow AG, Neff PM, Sammel MD, Andrela CM, Elovitz MA. Rethinking IUGR in preeclampsia: dependent or independent of maternal hypertension? Journal of Perinatology 2009 oct;29(10):680–684. http://www.ncbi.nlm.nih.gov/pubmed/19609308http://www.ncbi.nlm.nih.gov/pubmed/19609308http://www.ncbi.nlm.nih.gov/pubmed/19609308.
- Loftin et al. [2010] Loftin RW, Habli M, Snyder CC, Cormier CM, Lewis DF, Defranco EA. Late preterm birth. Reviews in obstetrics & gynecology 2010;3(1):10–9. http://www.ncbi.nlm.nih.gov/pubmed/20508778%****␣main.bbl␣Line␣100␣****http://www.ncbi.nlm.nih.gov/pubmed/20508778.
- MacDonald et al. [2015] MacDonald TM, McCarthy EA, Walker SP. Shining light in dark corners: Diagnosis and management of late-onset fetal growth restriction. Australian and New Zealand Journal of Obstetrics and Gynaecology 2015 feb;55(1):3–10. http://www.ncbi.nlm.nih.gov/pubmed/25557743http://www.ncbi.nlm.nih.gov/pubmed/25557743.
- Huen et al. [2013] Huen I, Wright C, Parker G, Sibley C, Johnstone E, Naish J. R1 and R2 * changes in the human placenta in response to maternal oxygen challenge. Magnetic Resonance in Medicine 2013;70(5):1427–33. http://www.ncbi.nlm.nih.gov/pubmed/23280967.
- Sørensen et al. [2013] Sørensen A, Peters D, Fründ E, Lingman G, Christiansen O, Uldbjerg N. Changes in human placental oxygenation during maternal hyperoxia estimated by blood oxygen level-dependent magnetic resonance imaging (BOLD MRI). Ultrasound in Obstetrics & Gynecology 2013;42(3):310–4. http://www.ncbi.nlm.nih.gov/pubmed/23303592.
- Moore et al. [2000] Moore RJ, Strachan BK, Tyler DJ, Duncan KR, Baker PN, Worthington BS, et al. In utero Perfusing Fraction Maps in Normal and Growth Restricted Pregnancy Measured Using IVIM Echo-Planar MRI. Placenta 2000 sep;21(7):726–732. http://linkinghub.elsevier.com/retrieve/pii/S0143400400905678.
- Derwig et al. [2013] Derwig I, Lythgoe DJ, Barker GJ, Poon L, Gowland P, Yeung R, et al. Association of placental perfusion, as assessed by magnetic resonance imaging and uterine artery Doppler ultrasound, and its relationship to pregnancy outcome. Placenta 2013;34(10):885–91. http://www.sciencedirect.com/science/article/pii/S0143400413005936.
- Sohlberg et al. [2014] Sohlberg S, Mulic-Lutvica A, Lindgren P, Ortiz-Nieto F, Wikström AK, Wikström J. Placental perfusion in normal pregnancy and early and late preeclampsia: a magnetic resonance imaging study. Placenta 2014 mar;35(3):202–6. http://www.sciencedirect.com/science/article/pii/S0143400414000095.
- Slator et al. [2017] Slator PJ, Hutter J, McCabe L, Gomes ADS, Price AN, Panagiotaki E, et al. Placenta microstructure and microcirculation imaging with diffusion MRI. Magnetic Resonance in Medicine 2017 dec;http://doi.wiley.com/10.1002/mrm.27036.
- Zhao et al. [2007] Zhao JM, Clingman CS, Närväinen MJ, Kauppinen RA, Van Zijl PCM. Oxygenation and hematocrit dependence of transverse relaxation rates of blood at 3T. Magnetic Resonance in Medicine 2007 sep;58(3):592–597. http://doi.wiley.com/10.1002/mrm.21342.
- Sinding et al. [2017] Sinding M, Peters DA, Frøkjær JB, Christiansen OB, Petersen A, Uldbjerg N, et al. Prediction of low birth weight: Comparison of placental T2* estimated by MRI and uterine artery pulsatility index. Placenta 2017 jan;49:48–54. https://www.sciencedirect.com/science/article/pii/S0143400416306397?via{\%}3Dihub.
- Ingram et al. [2017] Ingram E, Morris D, Naish J, Myers J, Johnstone E. MR Imaging Measurements of Altered Placental Oxygenation in Pregnancies Complicated by Fetal Growth Restriction. Radiology 2017 dec;285(3):953–960. http://www.ncbi.nlm.nih.gov/pubmed/28708473http://www.ncbi.nlm.nih.gov/pubmed/28708473.
- Derwig et al. [2013] Derwig I, Barker GJ, Poon L, Zelaya F, Gowland P, Lythgoe DJ, et al. Association of placental T2relaxation times and uterine artery Doppler ultrasound measures of placental blood flow. Placenta 2013;34(6):474–479. http://dx.doi.org/10.1016/j.placenta.2013.03.005.
- Sinding et al. [2018] Sinding M, Peters DA, Poulsen SS, Frøkjær JB, Christiansen OB, Petersen A, et al. Placental baseline conditions modulate the hyperoxic BOLD-MRI response. Placenta 2018 jan;61:17–23. https://www.sciencedirect.com/science/article/pii/S0143400417311724?via{\%}3Dihub.
- Moore et al. [2008] Moore RJ, Ong SS, Tyler DJ, Duckett R, Baker PN, Dunn WR, et al. Spiral artery blood volume in normal pregnancies and those compromised by pre-eclampsia. NMR in Biomedicine 2008 may;21(4):376–380. http://www.ncbi.nlm.nih.gov/pubmed/17893947http://www.ncbi.nlm.nih.gov/pubmed/17893947.
- Bonel et al. [2010] Bonel HM, Stolz B, Diedrichsen L, Frei K, Saar B, Tutschek B, et al. Diffusion-weighted MR Imaging of the Placenta in Fetuses with Placental Insufficiency. Radiology 2010 dec;257(3):810–819. papers3://publication/doi/10.1148/radiol.10092283http://pubs.rsna.org/doi/10.1148/radiol.10092283.
- Sohlberg et al. [2015] Sohlberg S, Mulic-Lutvica A, Olovsson M, Weis J, Axelsson O, Wikström J, et al. Magnetic resonance imaging-estimated placental perfusion in fetal growth assessment. Ultrasound in Obstetrics & Gynecology 2015 dec;46(6):700–705. http://onlinelibrary.wiley.com/doi/10.1002/uog.14786/fullpapers3://publication/doi/10.1002/uog.14786http://doi.wiley.com/10.1002/uog.14786.
- Song et al. [2017] Song F, Wu W, Qian Z, Zhang G, Cheng Y. Assessment of the Placenta in Intrauterine Growth Restriction by Diffusion-Weighted Imaging and Proton Magnetic Resonance Spectroscopy. Reproductive Sciences 2017 sep;24(4):575–581. http://journals.sagepub.com/doi/10.1177/1933719116667219http://rsx.sagepub.com/cgi/doi/10.1177/1933719116667219.
- Van Dusschoten et al. [1996] Van Dusschoten D, Moonen CTW, Adrie De Jager P, Van As H. Unraveling diffusion constants in biological tissue by combining Carr- Purcell-Meiboom-Gill imaging and pulsed field gradient NMR. Magnetic Resonance in Medicine 1996 dec;36(6):907–913. http://doi.wiley.com/10.1002/mrm.1910360613.
- Peled et al. [1999] Peled S, Cory DG, Raymond SA, Kirschner DA, Jolesz FA. Water diffusion, T2, and compartmentation in frog sciatic nerve. Magnetic Resonance in Medicine 1999 nov;42(5):911–918. http://doi.wiley.com/10.1002/{\%}28SICI{\%}291522-2594{\%}28199911{\%}2942{\%}3A5{\%}3C911{\%}3A{\%}3AAID-MRM11{\%}3E3.0.CO{\%}3B2-J.
- Does and Gore [2000] Does MD, Gore JC. Compartmental study of diffusion and relaxation measured in vivo in normal and ischemic rat brain and trigeminal nerve. Magnetic Resonance in Medicine 2000 jun;43(6):837–844. http://doi.wiley.com/10.1002/1522-2594{\%}28200006{\%}2943{\%}3A6{\%}3C837{\%}3A{\%}3AAID-MRM9{\%}3E3.0.CO{\%}3B2-O.
- Hürlimann and Venkataramanan [2002] Hürlimann MD, Venkataramanan L. Quantitative measurement of two-dimensional distribution functions of diffusion and relaxation in grossly inhomogeneous fields. Journal of Magnetic Resonance 2002 jul;157(1):31–42. https://www.sciencedirect.com/science/article/pii/S109078070292567X?via{\%}3Dihub.
- Callaghan et al. [2003a] Callaghan PT, Godefroy S, Ryland BN. Diffusion-relaxation correlation in simple pore structures. Journal of Magnetic Resonance 2003 jun;162(2):320–327. https://www.sciencedirect.com/science/article/pii/S1090780703000569.
- Callaghan et al. [2003b] Callaghan PT, Godefroy S, Ryland BN. Use of the second dimension in PGSE NMR studies of porous media. Magnetic Resonance Imaging 2003 apr;21(3-4):243–248. https://www.sciencedirect.com/science/article/pii/S0730725X03001310.
- Bernin and Topgaard [2013] Bernin D, Topgaard D. NMR diffusion and relaxation correlation methods: New insights in heterogeneous materials. Current Opinion in Colloid & Interface Science 2013 jun;18(3):166–172. https://www.sciencedirect.com/science/article/pii/S1359029413000460http://linkinghub.elsevier.com/retrieve/pii/S1359029413000460.
- De Almeida Martins and Topgaard [2018] De Almeida Martins JP, Topgaard D. Multidimensional correlation of nuclear relaxation rates and diffusion tensors for model-free investigations of heterogeneous anisotropic porous materials. Scientific Reports 2018 dec;8(1):2488. http://www.nature.com/articles/s41598-018-19826-9.
- De Santis et al. [2016] De Santis S, Barazany D, Jones DK, Assaf Y. Resolving relaxometry and diffusion properties within the same voxel in the presence of crossing fibres by combining inversion recovery and diffusion-weighted acquisitions. Magnetic Resonance in Medicine 2016;75(1):372–380.
- Kim et al. [2017] Kim D, Doyle EK, Wisnowski JL, Kim JH, Haldar JP. Diffusion-relaxation correlation spectroscopic imaging: A multidimensional approach for probing microstructure. Magnetic Resonance in Medicine 2017 dec;78(6):2236–2249. http://onlinelibrary.wiley.com/doi/10.1002/mrm.26629/full.
- Veraart et al. [2017] Veraart J, Novikov DS, Fieremans E. TE dependent Diffusion Imaging (TEdDI) distinguishes between compartmental T 2 relaxation times. NeuroImage 2017;http://linkinghub.elsevier.com/retrieve/pii/S1053811917307784.
- Benjamini and Basser [2017] Benjamini D, Basser PJ. Magnetic resonance microdynamic imaging reveals distinct tissue microenvironments. NeuroImage 2017;http://www.sciencedirect.com/science/article/pii/S1053811917307814.
- Melbourne et al. [2018] Melbourne A, Aughwane R, Sokolska M, Owen D, Kendall G, Flouri D, et al., Separating fetal and maternal placenta circulations using multiparametric MRI. John Wiley & Sons, Ltd; 2018. http://doi.wiley.com/10.1002/mrm.27406.
- Hutter et al. [2018] Hutter J, Slator PJ, Christiaens DC, Teixeira RPA, Roberts T, Jackson L, et al. Integrated and efficient diffusion-relaxometry using ZEBRA. ArXiv Preprint 2018 jun;p. 1–16. http://arxiv.org/abs/1806.03874.
- Le Bihan et al. [1988] Le Bihan D, Breton E, Lallemand D, Aubin MLL, Vignaud J, Laval-Jeantet M. Separation of diffusion and perfusion in intravoxel incoherent motion MR imaging. Radiology 1988 aug;168(2):497–505. http://pubs.rsna.org/doi/abs/10.1148/radiology.168.2.3393671papers3://publication/doi/10.1148/radiology.168.2.3393671http://onlinelibrary.wiley.com/doi/10.1002/cbdv.200490137/abstract{\%}5Cnhttp://www.ncbi.nlm.nih.gov/pubmed/3393671http://ebooks.cambridge.
- Jerome et al. [2016] Jerome NP, D’Arcy JA, Feiweier T, Koh DM, Leach MO, Collins DJ, et al. Extended T2-IVIM model for correction of TE dependence of pseudo-diffusion volume fraction in clinical diffusion-weighted magnetic resonance imaging. Physics in Medicine and Biology 2016 dec;61(24):N667–N680. http://stacks.iop.org/0031-9155/61/i=24/a=N667?key=crossref.b40ae5d5708ea8a2d760e1db820ebd1b.
- Menon and Allen [1991] Menon RS, Allen PS. Application of continuous relaxation time distributions to the fitting of data from model systmes and excised tissue. Magnetic Resonance in Medicine 1991 aug;20(2):214–227. http://doi.wiley.com/10.1002/mrm.1910200205.
- Ronen et al. [2006] Ronen I, Moeller S, Ugurbil K, Kim DS. Analysis of the distribution of diffusion coefficients in cat brain at 9.4 T using the inverse Laplace transformation. Magnetic Resonance Imaging 2006 jan;24(1):61–68. https://www.sciencedirect.com/science/article/pii/S0730725X05003279?via{\%}3Dihubhttp://linkinghub.elsevier.com/retrieve/pii/S0730725X05003279.
- Bai et al. [2014] Bai R, Koay CG, Hutchinson E, Basser PJ. A framework for accurate determination of the T2distribution from multiple echo magnitude MRI images. Journal of Magnetic Resonance 2014 jul;244:53–63. https://www.sciencedirect.com/science/article/pii/S1090780714001232.
- Ahola et al. [2015] Ahola S, Zhivonitko VV, Mankinen O, Zhang G, Kantola AM, Chen HY, et al. Ultrafast multidimensional Laplace NMR for a rapid and sensitive chemical analysis. Nature Communications 2015;6:1–7. http://dx.doi.org/10.1038/ncomms9363.
- English et al. [1991] English AE, Whittall KP, Joy MLG, Henkelman RM. Quantitative Two-Dimensional time Correlation Relaxometry. Magnetic Resonance in Medicine 1991 dec;22(2):425–434. http://doi.wiley.com/10.1002/mrm.1910220250.
- Tranquilli et al. [2014] Tranquilli AL, Dekker G, Magee L, Roberts J, Sibai BM, Steyn W, et al. The classification, diagnosis and management of the hypertensive disorders of pregnancy: A revised statement from the ISSHP. Pregnancy Hypertension: An International Journal of Women’s Cardiovascular Health 2014 apr;4(2):97–104. https://www.sciencedirect.com/science/article/pii/S221077891400018X?via{\%}3Dihubhttp://www.ncbi.nlm.nih.gov/pubmed/25198268{\%}5Cnhttp://www.scielo.br/scielo.php?script=sci{\_}arttext{\&}pid=S1516-31802014000100015{\&}lang=pthttp://koreascience.or.kr/journal/view.jsp?kj=POCPA9{\&}py=2014{\&}vnc=v15n16{\&}sp=6639http://linkinghub.elsevier.com/retrieve/pii/S221077891400018X.
- Slator et al. [2018] Slator PJ, Hutter J, Jackson L, Rutherford M, Hajnal J, Alexander D. Optimised B-Values & Gradient Directions for Placental Diffusion MRI, ISMRM workshop on placental MRI. In: ISMRM Workshop in the placenta; 2018. .
- Hutter et al. [2019] Hutter J, Slator PJ, Jackson L, Gomes ADS, Ho A, Story L, et al. Multi-modal functional MRI to explore placental function over gestation. Magnetic Resonance in Medicine 2019 feb;81(2):1191–1204. https://onlinelibrary.wiley.com/doi/abs/10.1002/mrm.27447.
- Does [????] Does MD, MERA Toolbox, Version 2;. https://vuiis.vumc.org/~doesmd/MERA/MERA_Toolbox.html.
- Whittall and MacKay [1989] Whittall KP, MacKay AL. Quantitative interpretation of NMR relaxation data. Journal of Magnetic Resonance 1989 aug;84(1):134–152. https://www.sciencedirect.com/science/article/pii/0022236489900115http://linkinghub.elsevier.com/retrieve/pii/0022236489900115.
- Schabel et al. [2016] Schabel MC, Roberts VHJ, Lo JO, Platt S, Grant KA, Frias AE, et al. Functional imaging of the nonhuman primate Placenta with endogenous blood oxygen level-dependent contrast. Magnetic Resonance in Medicine 2016 nov;76(5):1551–1562. http://doi.wiley.com/10.1002/mrm.26052.
- Lo et al. [2017] Lo JO, Roberts VHJ, Schabel MC, Wang X, Morgan TK, Liu Z, et al. Novel Detection of Placental Insufficiency by Magnetic Resonance Imaging in the Nonhuman Primate. Reproductive Sciences 2017 jan;25(1):193371911769970. http://journals.sagepub.com/doi/10.1177/1933719117699704.
- Solomon et al. [2014] Solomon E, Avni R, Hadas R, Raz T, Garbow JR, Bendel P, et al. Major mouse placental compartments revealed by diffusion-weighted MRI, contrast-enhanced MRI, and fluorescence imaging. Proceedings of the National Academy of Sciences 2014;111(28):10353–8. http://www.pubmedcentral.nih.gov/articlerender.fcgi?artid=4104865{\&}tool=pmcentrez{\&}rendertype=abstract.
- Sinding et al. [2016] Sinding M, Peters DA, Frøkjaer JB, Christiansen OB, Petersen A, Uldbjerg N, et al. Placental magnetic resonance imaging T2* measurements in normal pregnancies and in those complicated by fetal growth restriction. Ultrasound in Obstetrics & Gynecology 2016 jun;47(6):748–754. http://doi.wiley.com/10.1002/uog.14917.
- Kim et al. [2015] Kim CJ, Romero R, Chaemsaithong P, Kim JS. Chronic inflammation of the placenta: Definition, classification, pathogenesis, and clinical significance. American Journal of Obstetrics and Gynecology 2015;213(4):S53–S69. http://dx.doi.org/10.1016/j.ajog.2015.08.041.
- Slator et al. [2018] Slator PJ, Hutter J, Ianuş A, Panagiotaki E, Rutherford M, Hajnal JV, et al. A framework for calculating time-efficient diffusion MRI protocols for anisotropic IVIM and an application in the placenta. In: 2018 MICCAI Workshop on Computational Diffusion MRI (CDMRI’18); 2018.
- Moore et al. [2000] Moore RJ, Issa B, Tokarczuk P, Duncan KR, Boulby P, Baker PN, et al. In vivo intravoxel incoherent motion measurements in the human placenta using echo-planar imaging at 0.5 T. Magnetic Resonance in Medicine 2000 feb;43(2):295–302. http://doi.wiley.com/10.1002/(SICI)1522-2594(200002)43:2{\%}3C295::AID-MRM18{\%}3E3.0.CO;2-2http://doi.wiley.com/10.1002/{\%}28SICI{\%}291522-2594{\%}28200002{\%}2943{\%}3A2{\%}3C295{\%}3A{\%}3AAID-MRM18{\%}3E3.0.CO{\%}3B2-2.
- You et al. [2017] You W, Andescavage N, Zun Z, Limperopoulos C. Semi-automatic segmentation of the placenta into fetal and maternal compartments using intravoxel incoherent motion MRI. Proc SPIE 10137, Medical Imaging 2017: Biomedical Applications in Molecular, Structural, and Functional Imaging 2017;p. 1013726. http://proceedings.spiedigitallibrary.org/proceeding.aspx?doi=10.1117/12.2254610.
- Capuani et al. [2017] Capuani S, Guerreri M, Antonelli A, Bernardo S, Porpora MG, Giancotti A, et al. Diffusion and perfusion quantified by Magnetic Resonance Imaging are markers of human placenta development in normal pregnancy. Placenta 2017;58:33–39. http://linkinghub.elsevier.com/retrieve/pii/S0143400417310135.
- Siauve et al. [2017] Siauve N, Hayot PH, Deloison B, Chalouhi GE, Alison M, Balvay D, et al. Assessment of human placental perfusion by intravoxel incoherent motion MR imaging. The Journal of Maternal-Fetal & Neonatal Medicine 2017 oct;0(0):1–8. https://www.tandfonline.com/doi/full/10.1080/14767058.2017.1378334.
- Jakab et al. [2017] Jakab A, Tuura RL, Kottke R, Ochsenbein-Kölble N, Natalucci G, Nguyen TD, et al. Microvascular perfusion of the placenta, developing fetal liver, and lungs assessed with intravoxel incoherent motion imaging. Journal of Magnetic Resonance Imaging 2017;http://doi.wiley.com/10.1002/jmri.25933.
5 Figures and Tables

| Participant ID | GA at scan (weeks) | Cohort | TEs (ms) |
|---|---|---|---|
| 1 | 23.72 | Control | 78, 114, 150, 186, 222 |
| 2 | 23.86 | Control | 78, 114, 150, 186, 222 |
| 3 | 25.43 | Control | 78, 114, 150, 186, 222 |
| 4 | 25.72 | Control | 78, 114, 150, 186, 222 |
| 5 | 26.14 | Control | 78, 114, 150, 186, 222 |
| 6 | 26.72 | Control | 78, 114, 150, 186 |
| 7 | 26.72 | Control | 78, 114, 150, 186, 222 |
| 8 | 27.14 | Control | 78, 114, 150, 186, 222 |
| 9 | 28.29 | Control | 78, 114, 150, 186, 222 |
| 10 | 28.86 | Control | 82, 175, 268, 361, 454 |
| 11 | 28.86 | Control | 78, 114, 150, 186, 222 |
| 12 | 29.67 | Control | 85, 145, 205, 265, 325 |
| 13 | 26.86 | CH | 80, 121, 162, 203, 245 |
| 14 | 34.43 | CH | 78, 114, 150, 186, 222 |
| 15 | 27.7 | PE+FGR | 78, 114, 150, 186, 222 |
| 16 | 30.58 | PE | 78, 114, 150 |
| 17 (scan 1) | 30.71 | CH | 78, 114, 150, 186, 222 |
| 17 (scan 2) | 34.14 | CH+PE | 78, 114, 150, 186, 222 |
| Region | ADC Bounds ( mm2 s-1) | T2* Bounds (s) |
|---|---|---|
| Peak 1 | ||
| Peak 2 | ||
| Peak 3 |

6 Supporting Figures and Tables
| Reference | Parameters | Resolution | ROI selection | |
| T2∗ | ||||
| Sinding2016[56] | 1.5T, gradient-recalled echo) | 1.37x2.73x8mm | Entire placenta, | |
| 16 TEs(3-67.5) | (2 slices, gap 2mm) | outer border not crossed | ||
| BH 12s, 16 controls with repetitions | ||||
| Sinding2017[19] | 1.5T, gradient-recalled echo) | 1.37x2.73x8mm | Entire placenta, | |
| 16 TEs(3-67.5) | 3 slices | outer border not crossed | ||
| BH 12s | transverse evenly | |||
| Sinding2018[22] | 1.5T, gradient-recalled echo) | 1.37x2.73x8mm | entire placenta | |
| 16 TEs(3-67.5) | 3 planes evenly | adjusted for movements | ||
| BH 12s, 16 HC with repetitions | ||||
| Derwig2013a[21] | 1.5T, flow-compensated SE (ind. scans) | 3.76x3.75x8 | representative area of central part | |
| TEs= 40,80,120,180,240,300,360,440 | 3 slices, no gap | away from vessels | ||
| Ingram2017 [20] | gradient-recalled echo | 3.52x3.52 | largest contiguous placental region | |
| 5-50ms, 8 sec BH, under O2 | 1 slices transverse | non-placental tissue removed | ||
| Hutter2018[50] | 2D ss EPI Multi-echo GE | 2x2x2 | conservative | |
| dMRI | ||||
| Moore2000a[59] | 0.5T, 11 b-values (0-468 s mm-2) | 3.52.57 mm | Entire placenta | |
| Moore2000b[14] | 0.5T,11 b-values (0-468 s mm-2) | 3.52.57 mm | Entire placenta | |
| Derwig2013b[15] | 1.5T, 11 b-values (0-500 s mm-2) | 3.753.754 mm | Two: central, whole | |
| Sohlberg2015[25] | 1.5T, 5 b-values (0-800 s mm-2) | ????6 mm | excluding artefactual signal loss areas | |
| You2017[60] | 1.5T, 9 b-values (0-900 s mm-2) | 4.384.384 mm | Entire placenta | |
| Capuani2017[61] | 1.5T, 7 b-values (0-1000 s mm-2) | 224 mm | Three: central, peripheral, umbilical | |
| Siauve2017[62] | 1.5T, 11 b-values (0-1000 s mm-2) | ????5 mm | Three: entire placenta, fetal, maternal | |
| Slator2017[17] | 3T, 12 b-values (0-2000 s mm-2) | 222 mm | Entire placenta | |
| Jakab2017[63] | 1.5T and 3T, 17 b-values (0-900 s mm-2) | 224 mm | Central | |
| Hutter2018[50] | 3T, 14 b-values (0-1600 s mm-2) | 222 mm | Entire placenta |