Computer-Aided Arrhythmia Diagnosis by Learning ECG Signal
Abstract
Electrocardiogram (ECG) is one of the non-invasive and low-risk methods to monitor the condition of the human heart. Any abnormal pattern(s) in the ECG signal is an indicative measure of malfunctioning of the heart, termed as arrhythmia. Due to the lack of human expertise and high probability to misdiagnose, computer-aided diagnosis and analysis are preferred. In this paper, we perform arrhythmia detection with an optimized neural network having piecewise linear approximation based activation function to alleviate the complex computations in the traditional activation functions. Further, we propose a self-learning method for arrhythmia detection by learning and analyzing the characteristics (period) of the ECG signal. Self-learning based approach achieves 97.28% of arrhythmia detection accuracy, and neural network with optimized activation functions achieve an arrhythmia detection accuracy of 99.56%.
I introduction
Amelioration in the cyberphysical systems (CPS) and miniaturization of the systems made it feasible to devise wearable health monitoring and fitness tracking devices in the form of wristbands, smart watches and much more. These health monitoring devices capture biosignals, which are non-stationary signals representing the activity of the organ(s).
According to world health organization (WHO) cardiovascular disease (CVD) statistics 2015 [1], CVDs are the leading factors that cause human death. An Electrocardiogram (ECG) is a low-risk, non-invasive technique to represent the physiological state of heart. Physicians widely use ECG signals for diagnosing arrhythmias (deviation in ECG signal characteristics in reference to its previous or nominal characteristics is a representation of heart disorders) [2]. An Electrocardiogram (ECG) signal is a biosignal that facilitates tracking of cardiovascular (heart) activities over time, represented in the form of electrical signals.
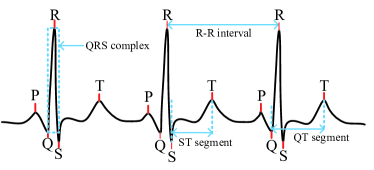
In arrhythmia detection, morphology and characteristics of the ECG signal play a vital role. As seen from Figure 1, ECG signal has different amplitude levels and shapes marked as P, Q, R, S, and T. Different physical activities from individual or group of heart chambers (arteries, ventricles) generate these components [3]. An ECG signal is a time series with few millivolts amplitude and a frequency between 0.01-250 Hz [4]. Figure 1 shows a pseudo-ECG signal. Spatial and temporal properties such as time intervals, the width of individual or a group of components are employed for arrhythmia detection, such as variation in T component morphology [5], ST segment duration, and the R-R interval [6, 7, 8, 3]. The terminology used in this paper to refer to ECG signal properties is defined below:
Component: It refers to the P, Q, R, S, and T peaks of an ECG signal (Figure 1).
Characteristics: It refers to a component’s
inherent properties such as period, amplitude, and width. For instance, R-R
interval is an R peak’s characteristic, similarly the width of the QRS complex, or the amplitude of the R peak.
Despite the progress achieved in component detection and feature extraction in ECG signal, arrhythmia detection with low computational complexity remains still unanswered. Feature extraction is referred to the process of obtaining the required characteristics of the ECG signal for further processing. We outline the primary challenges associated with arrhythmia detection below.
I-A Associated Research Questions in Arrhythmia Detection
Some of the general challenges associated with arrhythmia detection are: symptoms of anomalies might not show up all the time; monitoring the patient and observing ECG for a long time may not be feasible; and features of the ECG signal vary among different persons and even for the same person with time. As such, there exists no standard metrics that could represent the morphology and features of ECG signal that fit all the patients.
To overcome these challenges, computer-aided diagnosis (CADiag) is preferred over manual diagnosis to have an accurate arrhythmia detection with less false alarms and less human intervention. The associated research challenges for arrhythmia detection when using CADiag are:
-
•
Optimization of the required amount of data to be processed for accurate arrhythmia detection.
-
•
Machine learning techniques like neural networks though efficient for arrhythmia detection involves computational complexities.
-
•
As there exists no generic set of rules or parameters regarding ECG that can be applied to every one, devising a lightweight arrhythmia detection by learning the characteristics of the ECG signal trading off performance to some extent.
In this paper, we confine to neural networks among the machine learning techniques, as the arrhythmia detection using neural networks is proven to be one of the efficient techniques for arrhythmia detection [9, 10]. However, we compare the arrhythmia detection of proposed methods with other machine learning techniques like the support-vector machine (SVM).
I-B Contributions of this Work
The above-mentioned research challenges of arrhythmia diagnosis using CADiag as well the challenges involved in arrhythmia detection are solved in this paper. The primary focus of this work is to detect the arrhythmia rather than determining the type of arrhythmia. The contributions of this work can be outlined in a four-fold manner:
-
•
We propose an optimized neural network architecture preceded with data reduction technique for arrhythmia detection.
-
•
A piece-wise linear approximation for activation functions involved in neural networks is proposed to reduce the computational complexity without trading-off performance (accuracy).
-
•
An analysis of training algorithms’ impact on arrhythmia detection performance is explored and presented.
-
•
Lastly, we introduce a self-learning methodology in which system learns and use the characteristics of the extracted components for arrhythmia detection.
II Literature Review
While performing arrhythmia diagnosis, most of the medical experts take into account the following characteristics: the relative positions of the components, magnitudes, morphology, and other characteristics such as PR interval, PR segment, the width of QRS complex, QT interval and ST segment [3]. There exists various methods for denoising and identifying different components in the ECG signal such as Pan-Tompkins [11].
vast amount of research has been carried out on arrhythmia detection and classification. As the major focus of this work is on arrhythmia detection, we review the works on arrhythmia detection that are most relevant to this work.
For detecting arrhythmias, especially ventricular arrhythmias, R-R interval values are primarily used [6, 7]. Based on the variations in the R-R intervals, statistical parameters such as mean, variance, standard deviation are derived, and the existence of arrhythmia can be determined based on the derived statistical parameter values. Arrhythmia detection is performed with traditional statistical techniques like correlation [12], outlier detection [6], spectrum analysis [13] and other variants as well. Advanced predictors and regression techniques [14, 15] such as auto-regressive integrated moving average (ARIMA) are also used to predict the signal and compare the predicted and original signals to indicate arrhythmia. In [16], autocorrelation functions (ACF953 and ACF994) are used to analyze the periodicity of the ECG signal, and further utilized to obtain power spectrum. The arrhythmia detection algorithm performs a linear regression analysis of ACF peaks. Based on the detected periodicity and the regression errors, normal sinus rhythms and ventricular fibrillations (VFs) are classified. However, this technique suffers classifying VFs effectively, as VFs might have cosine-like shape.
Advancements in machine learning techniques led to its adoption in multiple applications such as on-chip power and resource management [17, 18, 19, 20, 21, 22, 23, 24, 25, 26, 27, 28, 29], hardware security [30, 31, 32, 33, 34], computer vision [35, 36, 37, 38] and other applications. Similarly, machine learning techniques, especially artificial neural networks (ANN) are also habituated for arrhythmia detection [39, 40, 41, 42]. Use of artificial neural networks (ANN) for the detection of left ventricular strain by classifying S-T abnormalities in the ECG by Devine and Macfarlane [43] is one of the first works that used ANNs for arrhythmia detection. Several variants of ANN such as like multi-layer perceptron (MLP) [44, 45], modular neural networks (MNN) [46], general feed-forward neural networks (GFFNN) [46, 47], radial basis function neural networks (RBFNN) and probabilistic neural networks (PNN) [48] have been implemented for ECG signal analysis and arrhythmia detection. To befit FPGA’s architecture, designers often choose block-based neural networks (BbNNs). In general, the BbNNs are trained using evolutionary algorithms such as genetic algorithms (GA). The Hermite basis function is one of the efficient feature extraction methods for ECG signals [49]. The coefficients of Hermite expansion characterizes the shape of QRS complex. A BbNN with Hermite expansion coefficients and R-R intervals as input is implemented for arrhythmia detection and classification in [50]. Though neural networks are efficient and effective in detecting arrhythmias, most of them are computationally expensive due to the involved floating point multiplications, hyperbolic functions, and other functions.
Other machine learning techniques such as support vector machine (SVM) is also employed for arrhythmia detection [51, 52]. For instance, in [51], ECG arrhythmia detection and classification using one-against-one (OAO) SVM, one-against-all (OAA) and fuzzy decision function (FDF) method based SVMs are employed. In [52], a genetic algorithm is used in combination with an SVM classifier for arrhythmia detection. Other machine learning techniques like Bayesian classifiers [53], fuzzy logic and its variants [44], Linear discriminant analysis [54] are as well used for arrhythmia detection. Irrespective of the machine learning technique used, in addition to the involved complex computations and training (for most of the techniques), the system needs to train every time it has to perform the analysis on a different person.
In this work, we use a neural network with resilient propagation (RPROP) with R-R intervals and ECG morphology for arrhythmia detection. To reduce the amount of data processing, principal component analysis (PCA) is performed prior to neural network. This helps to reduce the dimensionality of the input data and the computations in the neural network. To overcome the computational complexity, the activation functions are replaced with piecewise linear approximations. Precautionary measures are taken not to compromise the accuracy. In a similar vein, we propose a lightweight unsupervised and self-learning arrhythmia detection based on the learned ECG characteristics (R-R interval). Compared to the existing works, the proposed self-learning technique requires simple counters and pre-processing and does not need to have an explicit training or assumptions about the ECG signal.
III Arrhythmia Detection Process
The proposed workflow for arrhythmia detection along with a brief overview of solutions given in this section.
III-A Process Overview

An overview of arrhythmia detection process represented as blocks is presented in Figure 2. The input ECG data is initially pre-processed, i.e., noise and other artifacts are removed, followed by component detection. The component detection and removal of noises are inspired by the work presented in [55]. Once component detection is performed, the characteristics of the components are extracted. In this work, the R-R intervals and the morphology of ECG signal are used for arrhythmia detection. This is followed by arrhythmia detection process. We propose two different solutions with one based on machine learning (neural networks) and other with self-learning. We represented the processes for two methods in Figure 2 (a) and (b). Neural network based arrhythmia detection (Figure 2(a)) is accompanied by principal component analysis (PCA) to reduce the dimensionality of the input data. This data will be used by artificial neural network for arrhythmia detection. As the lightweight self-learner (Figure 2(b)) considers only characteristics of the signal obtained from pre-processing, there is no need to implement PCA. Based on the extracted characteristics and the learned characteristics, self-learners signals arrhythmia (if present) and updates the learned characteristics.
III-B Problem Formulation
For a well established supervised machine learning technique like neural networks which has
demonstrated efficient arrhythmia detection, the computational costs are
higher due to the involved activation functions.
As such, the first sub-problem is:
Problem 1: How to optimize the involved computations in a traditional
neural network to reduce the computational complexity
without compromising the performance of arrhythmia detection?
Furthermore, as the arrhythmia detection depends on the trained data
(when using supervised machine learning), it is not accurate or applicable
when the patient on whom the training is performed and testing is carried out has different heart rhythms.
As such, the second sub-problem is:
Problem 2: How to devise an user-independent, unsupervised, yet efficient arrhythmia detection methodology?
III-C Overview of Proposed Solutions
In this work, to solve the problems mentioned above, we propose two solutions.
-
•
To address the complexity involved in the neural network, we propose approximations for the involved activation functions (such as , ). Further, the data reduction technique such as principal component analysis (PCA) is employed to reduce the number of computations and the size of the neural network. These are performed under the constraints of arrhythmia detection performance and complexity i.e., to to reduce the complexity without trading off (much) performance.
-
•
Secondly, to address the problem of user-independent arrhythmia detection, we propose a self-learning technique where the characteristics of the signal learned by the system, based on which the system determines the signal as arrhythmia or not. For learning the characteristics, simple statistical operations are employed.
III-D Performance Metrics
The parameters used for evaluating arrhythmia detection performance are accuracy, sensitivity, and specificity. Accuracy (Acc.) is defined as the number of true positives and true negatives in the total number of samples. Sensitivity (Sens.) is defined as the ratio of the number of true positives to the total number of samples classified as positive (sum of True positives and false negatives). Specificity (Spec.) measures the portion of negatives that are correctly identified i.e., the percentage of normal beats identified correctly as normal. The positive predictive value (PPV.) represents amount of true positives among all the identified positives. The performance metrics can be mathematically expressed as
| Acc. | (1) | |||
| Spec. |
where , , and represents the number of true positives, true negatives, false positives, and false negatives, respectively.
Accuracy represents the percentage of beats which are correctly identified as normal or arrhythmia; sensitivity represents the percentage of arrhythmia beats correctly identified as arrhythmia; specificity represents the percentage of healthy beats correctly identified as healthy, and positive predictivity represents the percentage of correctly identified arrhythmias among all the beats identified as arrhythmias. Here, the term ‘correctly’ indicates that the indicated condition exists.
IV Neural Network based Arrhythmia Detection
Machine learning is an entrenched domain, employed in the health-care field to diagnose different kinds of sicknesses. One of the branches of machine learning in the arrhythmia diagnosis is the utilization of neural networks.
We first present a fully connected traditional neural network architecture, and activation functions for an effective arrhythmia detection. The utilized traditional neural network comprises of a single hidden layer and an output layer. Neural network architecture with a different number of nodes in hidden and output layers are explored, analysis is presented in our previous work [41].
IV-A Neural Network Architecture and Inputs
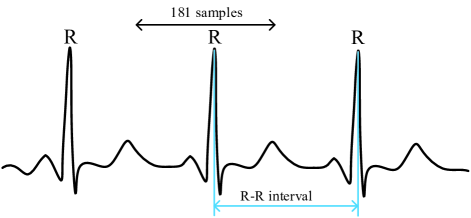
To perform arrhythmia detection, a neural network has to learn the ECG signal, hence has to be trained with features and/or morphology of the ECG signal. In this work, we train the fully connected neural network with morphological and temporal features of the ECG signal. The inputs used for the arrhythmia detection are two R-R intervals (preceding and succeeding interval) to validate the temporal properties; and 181 samples around the R-peak to learn the morphology of the ECG, as illustrated in Figure 3(a). The input considered for arrhythmia detection comprises of two R-R interval values, 181 samples around the R peak (183 values in total) as the input for processing. As designing a neural network with 183 inputs is computationally expensive, a data reduction technique needs to be employed.
To reduce the dimensionality of the input data, the morphological data i.e., 181 values around R peaks are processed through principal component analysis (PCA). PCA is a statistical procedure to convert a set of observations of possibly correlated variables into a set of values of linearly uncorrelated variables. The outcome of the PCA is smaller in dimension compared to the size of input data. Implementing Fuzzy clustering as in [45] did not prove efficient for pre-processing in this work, as the major focus is on arrhythmia (anomaly) detection rather than classification. Thus, the PCA has an input of 181 values (only the samples around R peak), and the ten principal components from the output of the PCA is chosen for further processing. As such, the input to the neural network is ten values representing the morphological information and the two R-R intervals, in total 12 values, called as the feature vector. The feature vector is used as the input for artificial neural network (ANN) to perform arrhythmia detection. Apart from the architecture and inputs for the neural network, the main parameters of choice that affects the performance are the training algorithm and the activation functions (in hidden and output layers).
IV-B Training Algorithm
There exist multiple learning methods to learn the input data in neural networks. As learning has an impact on the performance, we first evaluate performances of different learning algorithms in the arrhythmia detection application. Major concerns associated with traditional backpropagation training technique are slow convergence and the chance for the algorithm to terminate in a local minimum [56]. Paulin et al. [56] compared the performance of training algorithms for feed-forward artificial neural networks for classification of breast cancer. It is observed that Levenberg Marquardt (LM) performs slightly better than resilient backpropagation (RPROP) [57] and Conjugate Gradient (CG), in terms of diagnosis accuracy. In [58] a comparison of RPROP, CG ad LM is performed for streamflow forecasting and determination of lateral stress in cohesionless soils. In the two casestudies, RPROP has higher accuracy than the Levenberg-Marquardt (LM) during the test phase. As the existing works are on different kinds of applications and the performance of training differs with the application, we carry out a case study to compare the performance of training algorithms.
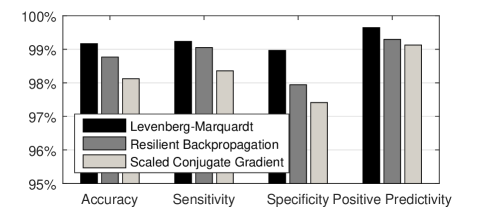
Figure 4 shows the performance of different training algorithms on ECG signals. Among different algorithms, RPROP is only outperformed by Levenberg-Marquardt algorithm. Considering the complexities [59] and generalization abilities [56, 58] of the training techniques, RPROP was chosen as neural network training algorithm. Though a slight degradation is experienced, considering the complexity, we chose RPROP in this work.
IV-C Activation Function
For artificial neural networks, several activation functions can be employed, such as sigmoid, hyperbolic, Gaussian and so on. Choosing the best fitting activation function secures the best result for the problem. In classification problems, the hyperbolic tangent () function is generally used activation function in the hidden layer [60].
One of the widely employed activation functions in the output layer for the classification problems is the softmax function [60], given by
| (2) |
where the output vector is -dimensional; the values from the -dimensional input vector are limited to the range of 0 to 1 and sum up to 1.
V Optimized Neural network with PLATanh Functions
As the activation functions in the nodes are the most frequently used and complex operations in the neural networks, optimizing the activation functions without losing accuracy reduces the complexity.
V-A Hidden Layer Activation Function Optimization
Considering that the final implementation with fixed-point arithmetic which fits better for resource constrained systems [41], the piecewise linear approximation was performed with gradients to simplify the complex multiplications to simple shift operations [61]. In comparison to ReLU activation function, has the advantage of a bounded output making it especially fit for fixed point implementation. Some of the previous works [62], [61] use a maximum of seven ranges. To minimize the error between approximated and exact values from the activation function. In this work, we propose the piecewise linearly approximated hyperbolic tangent function (PLAtanh) with thirteen ranges. The symmetric function is given in (4), with the limits given in (5).
V-B Output Layer
The softmax is replaced with the hyperbolic tangent function (). While softmax ensures that the sum of the output neurons equals 1, with as the output function, it is possible that none of the output values exceed the threshold resulting in no categorization i.e., no output provided. This problem is fixed by choosing the highest output value for class selection. In our case, to normalize the output layer results between 0 and 1, the hyperbolic tangent function is
| (3) |
An implementation in this form not only allows to also make use of the already implemented simplified hyperbolic tangent function but also reduces complexity.
Replacing the softmax function in (2) with Ntanh, given in (3), as activation function for output layer neurons, leads to faster convergence during the training phase and to better fitting due to the small number of output layer neurons. This difference occurs because in backpropagation the influence of all output signals on the results of the softmax function increases the complexity of the algorithm and was therefore simplified in our application. The in (3) can be further optimized by the PLAtanh given in (4).
| (4) |
| (5) |
To reduce the computational complexity, the slopes of PLAtanh are chosen as multiples of two. The offsets are chosen to minimize the maximal error of the function, which occurs at with approximately 0.03788.
VI Self-Learning based ECG Arrhythmia Detection
Despite the fact that neural networks are efficient in arrhythmia detection, it has to be trained (mostly) and has computational complexity though approximations are carried-out. We propose an user-independent arrhythmia detection technique based on the extracted characteristics of the ECG. This method comprises of two steps namely extraction of the signal characteristics and arrhythmia detection based on signal characteristics.
VI-A Extraction of Signal Characteristics
The pre-processing of the ECG signal is carried out with discrete wavelet transform (DWT) as described in [55] to detect P, Q, R, S, and T components.
The identified components play a vital role to extract the characteristics of the ECG signal and further processing. In this work, the characteristics of interest are the time interval and the period of detected components. For instance, if we consider the R component, the characteristics of interest are the interval between succeeding and preceding R components. This extraction can be performed using simple counters on hardware. As such, a sample characteristic set is:
| (6) |
Here represents the extracted features of the components; indicates the R-R interval in the ECG signal, and the same goes for Q-Q, P-P and QRS components. As such, the components are detected and the features are extracted without any assumptions or explicit training here, thus making it user independent.
The extracted characteristics are utilized for arrhythmia detection. We consider as the characteristic to determine arrhythmia in this work. The system monitors the characteristics of the components for four consecutive cycles (four consecutive R-R intervals), and if there is no substantial deviation, an average is considered as the characteristic that will be used for reference. The rationale to consider four continuous cycles is that in ECG signals, most of the irregular heartbeats (arrhythmia) can be detected by observing four consecutive cycles [3].
VI-B Signaling Arrhythmia
To perform the arrhythmia detection, the self-learner makes use of the extracted characteristics (R-R intervals) from the signal. The arrhythmia detection block validates the characteristics of the incoming signal with the previous learned and stored characteristics. Unlike machine generated signals, biosignals will have some variances in the period, amplitudes. For instance, a peak can occur at 0.70s, followed after 0.69s and 0.72s. Hence, tolerance is incorporated.
When the characteristic (time interval here) of a component is similar to the previously observed and learned characteristics, the system does not signal anomaly and updates the previously learned characteristics (as in Line 13 of Algorithm 1). However, when the learned characteristics vary significantly from the current characteristic value of the incoming ECG signal i.e., they both differ more than a tolerance value as in (7), the self-learner signals arrhythmia.
With the R-R feature, the arrhythmia detection output can be mathematically given as
| (7) |
where represents the R-R interval learned previously and indicates the R-R interval of the beat under analysis. The tolerance is given by . The tolerance value is determined by experimentation. The assumption of this process is that the anomalies or arrhythmias do not occur at the beginning of the process. In case of anomalies or arrhythmias in the first few samples, i.e., at the beginning of the setup, the intervals post anomaly will be used as the characteristic, i.e., there will be a slight delay in extracting and learning the characteristics.
The stored characteristics () are updated regularly in order to keep track of the signal changes and adapt to the user’s ECG characteristics rather than using standard values all the time. This provides the advantage of utilizing the derived characteristics from the user rather than using standard values, which might not be valid for all the users. If the characteristics of the incoming signal () is similar to the characteristic of the stored beat (), then an averaging is performed and the stored characteristic () is updated (Line 14 of Algorithm 1). Thus, the characteristics of the signal used for comparison are updated continuously by learning the signal. This helps in adapting to the signal characteristics of the user.
Significant variations in the width or any distortion(s) in the morphology of an individual component(s) is dealt in the pre-processing stage. Any distortion in morphology leads to false detection or not detecting the corresponding component, resulting in deriving wrong characteristics which eventually leads to indicating arrhythmia at the output. As the characteristics of the signal are learnt based on the input ECG signal, this technique is not limited to any single individual and can be adapted easily. Thus, the user independent and ECG signal based characteristic extraction is performed without any explicit training.
VI-C Summary:
A summary of arrhythmia detection process with self-learning is given in Algorithm 1. The input ECG signal is initially pre-processed, followed by component detection, as in Line 1-3. Further, the characteristics are extracted for the detected components, as in Line 4-5. The process of arrhythmia detection based on the extracted characteristics is given in Line 6-11. Here, represents the learned characteristic of the signal and denotes the characteristic of the signal or beat which needs to be tested for arrhythmia. The process of updating the characteristics is given in Line 13-14.
VII Simulation Results
VII-A Experimental Setup
An artificial neural network (ANN) with twelve input neurons, one hidden layer with six neurons (nodes) is implemented in Vivado HLS tool. The rationale for this configuration is the achieved arrhythmia detection accuracy, as given in Section VII-B2. Further, the optimized version of the ANN i.e., with PCA, PLAtanh as activation function and Ntanh for the output layer has been implemented as well in the Vivado HLS. The self-learning based arrhythmia detection is implemented using RTL in Xilinx ISE as well as in the Matlab. As the aim of this paper is to prove the performance of the techniques with optimization, rather than the hardware resource analysis, we confine to the performance analysis in this work. For verification of the algorithms, the MIT-BIH arrhythmia database [63] was used. The database contains forty-eight 30 minute ambulatory ECG recordings, which also includes unusual but clinically significant arrhythmias. The database is therefore suitable to evaluate the performance and accuracy of the optimization and self-learning techniques developed for a wide spectrum of heart diseases [64]. For classification, a variety of feature vectors have been compared in terms of best classification accuracy.
VII-B Arrhythmia Detection with Optimized Neural Network
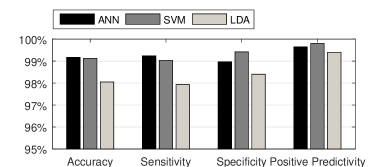
We evaluate the performance of different machine learning algorithms for arrhythmia detection first, followed by evaluation of actual neural network against neural network optimized activation functions. Figure 5 shows the comparison of arrhythmia detection with neural networks, Support vector machines (SVMs) and linear discriminant analysis (LDA). It can be seen that the neural networks and SVM perform better than LDA, While in terms of accuracy ANN and SVM achieve the similar performance, their performances differ (0.5%) in terms of sensitivity specificity and positive predictivity. These differences occur due to the class-imbalance of some of the ECG records. In terms of computations, SVMs have a higher complexity. Furthermore, performing the approximation of activation functions in neural networks greatly reduces the computational complexity. Additionally, computations in a neural network can be processed in parallel.
VII-B1 Efficiency of Optimized Activation Function
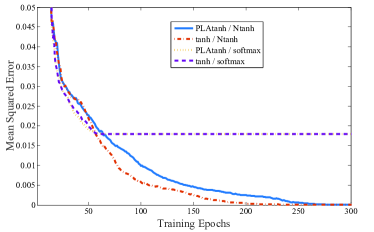
To evaluate the performance of the activation function (given in (4)) in comparison to the exact hyperbolic tangent function, neural network is trained once with exact functions and once with piecewise linear approximations, in both hidden and output layers. As a typical example, Figure 6 shows the mean square error for one specific record in the database for different activation functions. The error was logged after every training iteration with RPROP algorithm. The figure shows that using the piecewise linear approximated activation function for hidden layer neurons, does not worsen the results in comparison to exact implementation.
VII-B2 Arrhythmia Detection Efficiency
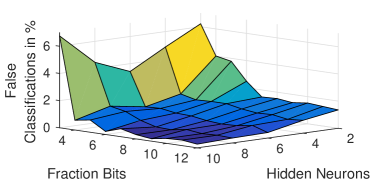
We first evaluate the arrhythmia detection performance (in terms of false classification) by varying the number of fraction bits and the number of neurons in the hidden layer. Figure 7 shows the false classification error in correlation with the number of fraction bits and number of neurons in the hidden layer. One can observe that the maximum false classification with optimized activation functions and a varied number of neurons and fraction bits is nearly 6%. For better performance, we choose 12 fraction bits and 6 neurons in the hidden layer which has nearly no false classification. Similarly, we evaluated the false classification by varying the number of input neurons in our previous work [41]. For twelve input neurons and six neurons in hidden layer, the false classification is found to be 1%. Hence, we chose twelve neurons at the input layer and six neurons in hidden layer with 12 fraction bits.
With 24 bit data size (12 fraction bits) and other settings described above, the optimized neural network approach achieves 99.56% accuracy. The achieved performance metrics with optimized and exact implementation of neural network is listed in Table I. In comparison with exact implementation of neural network, neural network with proposed optimized activation functions has nearly 0.03% degradation in performance. This is the trade-off with optimization. Approximation method such as ReLU has slightly lower performance compared to proposed approximation. Additionally, during the experiments it is found that ReLU based implementation has higher false positives and false negatives with same neural network structure than the proposed approximation based implementation.
| PLAtanh | Normal () | ReLU | |
|---|---|---|---|
| Accuracy | 99.56% | 99.59% | 99.15% |
| Specificity | 99.76% | 99.79% | 99.71% |
| Sensitivity | 99.07% | 98.06% | 96.96% |
| Positive Predictivity | 99.39% | 99.48% | 98.88% |
VII-C Arrhythmia Detection with Self-learning
Component detection, including denoising is performed using discrete wavelet transform, similar to [55] in Matlab. Based on the experiments carried out for the entire database, the tolerance, is set to 15% of the corresponding feature. For instance, if the R-R interval is 120ms, then a tolerance ( in (7)) is 18ms.
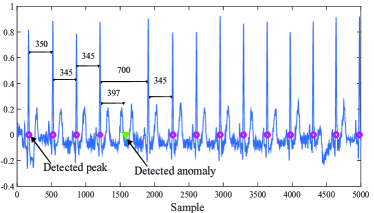
Arrhythmia detection with self-learning technique in Section VI for an ECG signal with missing R peak is shown in Figure 8. The time period of the signal is 0.69s (345 samples). From Figure 8, we can observe that first four peaks (circled) are properly detected, because they are placed at nearly equal time instants. However, after the fourth peak, the counter waits for the occurrence of the peak within the time period, and once the period (+tolerance) is passed and the peak is not encountered, the circuit outputs an anomaly. The anomaly is indicated by a (green) triangle marker in Figure 8, after 397 samples (period+tolerance). Similarly, the system signals an anomaly if the peak occurs at a non-periodic time instant.
| Accuracy | Specificity | Sensitivity | Positive Predictivity |
| 97.28% | 98.25% | 78.70% | 70.0% |
The arrhythmia detection performance of the self-learner is given in Table II. It has an accuracy of 97.28%, specificity of 98.25%, sensitivity of 78.70% and positive predictivity of 70.00%. Sensitivity indicates the percentage of sick people who are correctly identified as having arrhythmia and specificity indicates the percentage of healthy people who are identified as healthy. A low sensitivity and positive predictivity is achieved due to more number of false negatives and positives resulting from the existence of fusion beats (which resembles QRS complex), bigeminy and trigeminy ventricular rhythms.
VII-D Comparison and Discussion
| Acc. | Spec. | Sens. | Note | |
| ANN | 99.59% | 99.79% | 98.06% | Full ANN implementation |
| Optimized | 99.56% | 99.76% | 99.07% | Optimized ANN |
| ANN | implementation | |||
| Self-learner | 97.28% | 98.25% | 78.70% | Extracted characteristics |
| based analysis | ||||
| [65] | 70.00% | - | - | One-vs-one error minimization |
| with Bayesian classifier | ||||
| [48] | 98.10% | 99.78% | 98.10% | Probabilistic ANN |
| [66] | 99.00% | - | - | Beat-filtering and matching |
| [39] | 98.60% | - | - | 3-layer ANN |
| [50] | 97.50% | 98.80% | 74.90% | Evolvable Block-based ANN |
| [45] | 93.20-99% | - | - | FCM-PCA-NN |
| [5] | 92.54% | 55.4% | - | Decision tree |
| [9] | 99.64% | Block-based ANN | ||
| [10] | 99.90% | - | - | Cascaded ANN |
| [46] | 82.22% | 82.76% | 81.35% | Modular ANN |
| [47] | 82.35% | 89.13% | 68.18% | Feed-forward ANN |
| [44] | 97.97% | 99.20% | 90.67% | ANN with fuzzy membership |
Table III compares our arrhythmia detection performance with reported performance in other works. Compared to techniques like decision tree, Bayesian classifiers, the neural networks achieves a superior arrhythmia detection performance. We present the comparison of full implementation of feed-forward neural network with the optimized neural network using PLATanh. The optimized neural network performs similar to the full implementation of neural network (ANN). Also, the performance of optimized neural network based implementation is better or similar to other existing works. Compared to , PLAtanh based implementation has nearly 93.5% reduction in latency, 80.9% saving in terms of number of LUTs [41]. The self-learning technique involves much lesser computations (no need of back-propagation, multipliers and so on). The self-learner performs similar to some machine learning techniques in terms of accuracy but has higher false positives, which affects the sensitivity and specificity. The BbNN implementation in [50] and proposed self-learner has similar performance. The self-learning based method has a slightly lower accuracy (2.5%) and less sensitivity and positive predictivity in comparison with some neural network implementations. This comes at the cost of reduced complexity. Compared to optimized ANN implementation, self-learner utilizes nearly 75% less number of LUTs and has similar latency. The performance could be further improved by incubating other characteristics such as QRS complex width, period and so on which increases the complexity.
One can conclude from the above discussion that, neural networks with optimizations are a good fit when computational elements are limited. Under stringent resource constraints where slight performance loss can be tolerated, proposed self-learner is a potential solution.
VIII Conclusion
In this work, we have implemented a fully connected neural network for arrhythmia detection. To address the complexity constraints in the neural networks, piecewise linear approximations for activation functions is proposed. Furthermore, a self-learning method that learns the characteristics of the ECG signal for arrhythmia detection is devised. The optimized neural network achieves an accuracy of 99.56% and an accuracy with 97.28% with self-learner is achieved for arrhythmia detection. The self-learner suffers from false positives which can be improved by learning more characteristics, but at the cost of complexity. For much smaller hardware footprints, self-learning method could be adapted whereas for high accuracy requirements neural networks can be adapted.
References
- [1] World health organization cardiovascular disease facts, 2015. Last accessed: 2018-09-24.
- [2] Malcolm S Thaler. The only EKG book you’ll ever need. Lippincott Williams & Wilkins, 2010.
- [3] E. Braunwald, D. P. Zipes, P. Libby, and R. Bonow. Heart Disease: A Textbook of Cardiovascular Medicine. Elsevier, 9 edition, 2011.
- [4] John G. Webster. Medical Instrumentation Application and Design. John Wiley & Sons, 4 edition, 2010.
- [5] M. Hadjem and F. Nait-Abdesselam. An ECG T-wave anomalies detection using a lightweight classification model for wireless body sensors. In IEEE Int. Conf. on Communication, 2015.
- [6] M. Hadjem, O. Salem, and F. Nait-Abdesselam. An ECG monitoring system for prediction of cardiac anomalies using WBAN. In IEEE Int. Conf. on e-Health Networking, Applications and Services, 2014.
- [7] Chun-Chieh Chan and et.al. Energy efficient diagnostic grade mobile ECG monitoring. In IEEE Int. New Circuits and Systems Conf., 2012.
- [8] Hao Ding, Hong Sun, and Kun mean Hou. Abnormal ECG signal detection based on compressed sampling in wearable ECG sensor. In Int. Conf. on Wireless Communications and Signal Processing, 2011.
- [9] V. P. Nambiar, M. Khalil-Hani, and M. N. Marsono. Evolvable block-based neural networks for real-time classification of heart arrhythmia from ECG signals. In IEEE EMBS Conference on Biomedical Engineering and Sciences, 2012.
- [10] S. Ayub and J. P. Saini. ECG classification and abnormality detection using cascade forward neural network. International Journal of Engineering, Science and Technology, 3(3):41–46, 2011.
- [11] Jiapu Pan and Willis J Tompkins. A real-time QRS detection algorithm. IEEE Tran. on Biomedical Engineering, (3):230–236, 1985.
- [12] Bovas Abraham and Alice Chuang. Outlier detection and time series modeling. Technometrics, 31(2):241–248, May 1989.
- [13] G. Baselli, S. Cerutti, S. Civardi, D. Liberati, F. Lombardi, A. Malliani, and M. Pagani. Spectral and cross-spectral analysis of heart rate and arterial blood pressure variability signals. Computers and Biomedical Research, 19(6):520 – 534, 1986.
- [14] Da Chen, Xueguang Shao, Bin Hu, and Qingde Su. Simultaneous wavelength selection and outlier detection in multivariate regression of near-infrared spectra. Analytical Sciences, 21(2):161–166, Feb 2005.
- [15] A. M. Bianco, M. García Ben, E. J. Martínez, and V. J. Yohai. Outlier detection in regression models with ARIMA errors using robust estimates. J. of Forecasting, 20(8):565–579, Dec 2001.
- [16] Irena Jekova. Comparison of five algorithms for the detection of ventricular fibrillation from the surface ECG. Physiological Measurement, 21(4):429, 2000.
- [17] P. D. Sai Manoj, K. Wang, and H. Yu. Peak power reduction and workload balancing by space-time multiplexing based demand-supply matching for 3D thousand-core microprocessor. In ACM/EDAC/IEEE Design Automation Conf., 2013.
- [18] S. S. Wu, K. Wang, P. D. Sai Manoj, T. Y. Ho, M. Yu, and H. Yu. A thermal resilient integration of many-core microprocessors and main memory by 2.5D TSI I/Os. In Design, Automation Test in Europe Conference Exhibition (DATE), 2014.
- [19] H. Hantao, P. D. Sai Manoj, D. Xu, H. Yu, and Z. Hao. Reinforcement learning based self-adaptive voltage-swing adjustment of 2.5D I/Os for many-core microprocessor and memory communication. In IEEE/ACM Int. Conf. on Computer-Aided Design (ICCAD), 2014.
- [20] D. Xu, P. D. Sai Manoj, H. Huang, N. Yu, and H. Yu. An energy-efficient 2.5D through-silicon interposer I/O with self-adaptive adjustment of output-voltage swing. In IEEE/ACM International Symposium on Low Power Electronics and Design (ISLPED), 2014.
- [21] P. D. Sai Manoj, H. Yu, Y. Shang, C. S. Tan, and S. K. Lim. Reliable 3-D clock-tree synthesis considering nonlinear capacitive TSV model with electrical-thermal-mechanical coupling. IEEE Trans. on Computer-Aided Design of Integrated Circuits and Systems, 32(11):1734–1747, Nov 2013.
- [22] P. D. Sai Manoj, K. Wang, H. Huang, and H. Yu. Smart I/Os: a data-pattern aware 2.5D interconnect with space-time multiplexing. In ACM/IEEE International Workshop on System Level Interconnect Prediction (SLIP), 2015.
- [23] P. D. Sai Manoj, H. Yu, and K. Wang. 3D many-core microprocessor power management by space-time multiplexing based demand-supply matching. IEEE Trans. on Computers, 64(11):3022–3036, Nov 2015.
- [24] P. D. Sai Manoj, H. Yu, H. Huang, and D. Xu. A Q-Learning based self-adaptive I/O communication for 2.5D integrated many-core microprocessor and memory. IEEE Trans. on Computers, 65(4):1185–1196, Apr. 2016.
- [25] D. Xu, N. Yu, P. D. Sai Manoj, K. Wang, H. Yu, and M. Yu. A 2.5-D memory-logic integration with data-pattern-aware memory controller. IEEE Design Test, 32(4):1–10, Aug. 2015.
- [26] D. Xu, N. Yu, H. Huang, P. D. Sai Manoj, and H. Yu. Q-learning based voltage-swing tuning and compensation for 2.5D memory-logic integration. IEEE Design and Test, 35(2):91–99, April 2018.
- [27] S. Pagani, P. D. Sai Manoj, A. Jantsch, and J. Henkel. Machine learning for power, energy, and thermal management on multi-core processors: A survey. IEEE Transactions on Computer Aided Systems of Integrated Circuits and Systems, 2018.
- [28] P. D. Sai Manoj, A. Jantsch, and M. Shafique. SmartDPM: Dynamic power management using machine learning for multi-core microprocessors. Journal of Low-Power Electronics, 14(4), Dec 2018.
- [29] H. Sayadi, D. Pathak, I. Savidis, and H. Homayoun. Power conversion efficiency-aware mapping of multithreaded applications on heterogeneous architectures: A comprehensive parameter tuning. In Asia and South Pacific Design Automation Conference (ASP-DAC), 2018.
- [30] J. Stangl, T. Loruenser, and P. D. Sai Manoj. A fast and resource efficient FPGA implementation of secret sharing for storage applications. In ACM/EDAA/IEEE Design Automation and Test in Europe (DATE), 2018.
- [31] H. Sayadi, N. Patel, P. D. Sai Manoj, A. Sasan, S. Rafatirad, and H. Homayoun. Ensemble learning for hardware-based malware detection: A comprehensive analysis and classification. In ACM/EDAA/IEEE Design Automation Conference, 2018.
- [32] H. Sayadi, P. D. Sai Manoj, A. Houmansadr, S. Rafatirad, and H. Homayoun. Comprehensive assessment of run-time hardware-supported malware detection using general and ensemble learning. In ACM International Conference on Computing Frontiers, 2018.
- [33] H. Sayadi, H.M. Makrani, O. Randive, P. D. Sai Manoj, S. Rafatirad, and H. Homayoun. Customized machine learning-based hardware-assisted malware detection in embedded devices. In IEEE International Conference On Trust, Security And Privacy In Computing And Communications, 2018.
- [34] P. D. Sai Manoj, Ferdinand Brasser, L. Davi, A. Dhavlle, T. Frassetto, S. Rafatirad, A. Sadeghi, A. Sasan, H. Sayadi, S. Zeitouni, and H. Homayoun. Hardware-assisted security: Understanding security vulnerabilities and emerging attacks for better defenses. In International Conference on Compilers, Architecture, and Synthesis for Embedded Systems (CASES), 2018.
- [35] J. Lin, S. Zhu, Z. Yu, D. Xu, P. D. Sai Manoj, and H. Yu. A scalable and reconfigurable 2.5D integrated multicore processor on silicon interposer. In IEEE Custom Integrated Circuits Conf., 2015.
- [36] P. D. Sai Manoj, J. Lin, S. Zhu, Y. Yin, X. Liu, X. Huang, C. Song, W. Zhang, M. Yan, Z. Yu, and H. Yu. A scalable network-on-chip microprocessor with 2.5D integrated memory and accelerator. IEEE Transactions on Circuits and Systems I: Regular Papers, 64(6):1432–1443, June 2017.
- [37] M. Wess, P. D. Sai Manoj, and A. Jantsch. Weighted quantization-regularization in DNNs for weight memory minimization towards HW implementation. IEEE Transactions on Computer Aided Systems of Integrated Circuits and Systems, 2018.
- [38] P. D. Sai Manoj, Sairaj Amberkar, Setareh Rafatirad, and Houman Homayoun. Enhancing adversarial training towards robust machine learners and its analysis. In International Conference on Computer-Aided Design (ICCAD), 2018.
- [39] E. R. Adams and A. Choi. Using neural networks to predict cardiac arrhythmias. In IEEE Int. Conf. on Systems, Man, and Cybernetics, 2012.
- [40] S. Joo, K. J. Choi, and S. J. Huh. Prediction of ventricular tachycardia by a neural network using parameters of heart rate variability. In Computing in Cardiology, 2010.
- [41] M. Wess, P. D. Sai Manoj, and A. Jantsch. Neural network based ECG anomaly detection on FPGA and trade-off analysis. In IEEE Int. Symp. on Circuits and Systems, 2014.
- [42] P. D. Sai Manoj and A. Jantsch. ADDHard: arrhythmia detection on digital hardware by learning ECG signal. In ACM Great Lakes Symposium on VLSI (GLSVLSI), 2018.
- [43] B. Devine and PW. Macfarlane. Detection of electrocardiographic ’left ventricular strain’ using neural nets. Med Biol. Eng. Comput., 31(4):343–348, Jul 1993.
- [44] J. S. Lim. Finding features for real-time premature ventricular contraction detection using a fuzzy neural network system. IEEE Transactions on Neural Networks, 20(3):522–527, Mar 2009.
- [45] Rahime Ceylan and Yüksel Özbay. Comparison of FCM, PCA and WT techniques for classification ECG arrhythmias using artificial neural network. Expert Syst. Appl., 33(2):286–295, Aug 2007.
- [46] Shivajirao M Jadhav, Sanjay L Nalbalwar, and Ashok A Ghatol. ECG arrhythmia classification using modular neural network model. In IEEE EMBS Conference on Biomedical Engineering and Sciences, 2010.
- [47] S. M. Jadhav, S. L. Nalbalwar, and A. A. Ghatol. Generalized feedforward neural network based cardiac arrhythmia classification from ECG signal data. In IEEE Int. Conf. on Advanced Information Management and Service, 2010.
- [48] R. Ghongade, M. Deshmukh, and D. Joshi. Arrhythmia classification using morphological features and probabilistic neural networks. In Innovative Applications of Computational Intelligence on Power, Energy and Controls with their impact on Humanity, 2014.
- [49] Philip de Chazal, M. O’Dwyer, and R. B. Reilly. Automatic classification of heartbeats using ECG morphology and heartbeat interval features. IEEE Transactions on Biomedical Engineering, 51(7):1196–1206, Jul 2004.
- [50] W. Jiang and S. G. Kong. Block-based neural networks for personalized ECG signal classification. IEEE Transactions on Neural Networks, 18(6):1750–1761, Nov 2007.
- [51] N. Kohli, N. K. Verma, and A. Roy. SVM based methods for arrhythmia classification in ECG. In International Conference on Computer and Communication Technology, 2010.
- [52] J. A. Nasiri, M. Naghibzadeh, H. S. Yazdi, and B. Naghibzadeh. ECG arrhythmia classification with support vector machines and genetic algorithm. In European Symposium on Computer Modeling and Simulation, 2009.
- [53] H. Leutheuser, S. Gradl, P. Kugler, L. Anneken, M. Arnold, S. Achenbach, and B. M. Eskofier. Comparison of real-time classification systems for arrhythmia detection on android-based mobile devices. In Int. Conference of the IEEE Engineering in Medicine and Biology Society, 2014.
- [54] J. Lee, K. L. Park, M. H. Song, and K. J. Lee. Arrhythmia classification with reduced features by linear discriminant analysis. In IEEE Engineering in Medicine and Biology, 2005.
- [55] Saurabh Pal and Madhuchhanda Mitra. Detection of ECG characteristic points using multiresolution wavelet analysis based selective coefficient method. Measurement, 43(2):255 – 261, 2010.
- [56] F Paulin and A Santhakumaran. Classification of breast cancer by comparing back propagation training algorithms. International Journal on Computer Science and Engineering, 3(1):327–332, 2011.
- [57] Martin Riedmiller and Heinrich Braun. A direct adaptive method for faster backpropagation learning: The RPROP algorithm. In IEEE International Conference On Neural Networks, 1993.
- [58] Özgür Kişi. Comparison of three back-propagation training algorithms for two case studies. Indian journal of engineering & materials sciences, 12(5):434–442, 2005.
- [59] Christian Igel, Marc Toussaint, and Wan Weishui. Rprop using the natural gradient. In Trends and applications in constructive approximation, pages 259–272. Springer, 2005.
- [60] Wlodzislaw Duch and Norbert Jankowski. Transfer functions: hidden possibilities for better neural networks. In ESANN, 2001.
- [61] Hiroomi Hikawa. A digital hardware pulse-mode neuron with piecewise linear activation function. IEEE Transactions on Neural Networks, 14(5):1028–1037, 2003.
- [62] Hesham Amin, K Memy Curtis, and Barrie R Hayes-Gill. Piecewise linear approximation applied to nonlinear function of a neural network. IEE Proc. Circuits, Devices and Systems, 144(6):313–317, 1997.
- [63] A. L. Goldberger and et.al. PhysioBank, PhysioToolkit, and PhysioNet: Components of a new research resource for complex physiologic signals. Circulation, 101(23):e215–e220, Jun 2000.
- [64] George B Moody and Roger G Mark. The impact of the MIT-BIH arrhythmia database. IEEE Engineering in Medicine and Biology Magazine, 20(3):45–50, 2001.
- [65] A. F. Ahmed, M. I. Owis, and I. A. Yassine. Novel bayesian classifier discriminant function optimization strategies for arrhythmia classification. In IEEE-EMBS International Conference on Biomedical and Health Informatics (BHI), 2014.
- [66] P.S. Hamilton. Open source ECG analysis software documentation, 2013.