Coherent and incoherent bands in La and Rh doped Sr3Ir2O7
Abstract
In Sr2IrO4 and Sr3Ir2O7, correlations, magnetism and spin-orbit coupling compete on similar energy scales, creating a new context to study metal-insulator transitions (MIT). We use here Angle-Resolved photoemission to investigate the MIT as a function of hole and electron doping in Sr3Ir2O7, obtained respectively by Ir/Rh and Sr/La substitutions. We show that there is a clear reduction as a function of doping of the gap between a lower and upper band on both sides of the Fermi level, from 0.2eV to 0.05eV. Although these two bands have a counterpart in band structure calculations, they are characterized by a very different degree of coherence. The upper band exhibits clear quasiparticle peaks, while the lower band is very broad and loses weight as a function of doping. Moreover, their ARPES spectral weights obey different periodicities, reinforcing the idea of their different nature. We argue that a very similar situation occurs in Sr2IrO4 and conclude that the physics of the two families is essentially the same.
I Introduction
Metal-insulator transitions are a central feature of correlated systems ImadaRMP98 ; GeorgesRMP96 . They are often driven by doping, which is particularly well adapted to angle resolved photoemission (ARPES) studies, but still difficult to describe theoretically. Should the gap close progressively ? Will all carriers contribute to the emerging Fermi Surface (FS) or just those added by the dopants ? For a correlated system, coherent quasiparticles bands are expected to form within the gap, coexisting with incoherent Hubbard bands on both sides of the gap GeorgesRMP96 . These bands, as well as possible transfer of spectral weight between them, can be observed by ARPES. Consequently, this technique has been used extensively for the study of cuprates, where a particularly complicated situation takes place, as the FS emerges through a pseudogap phase, where parts of the FS are partially gapped VishikCondmat18 . Deciding whether this is intrinsic to cuprates or more generic awaits the investigation of more types of Mott insulators.
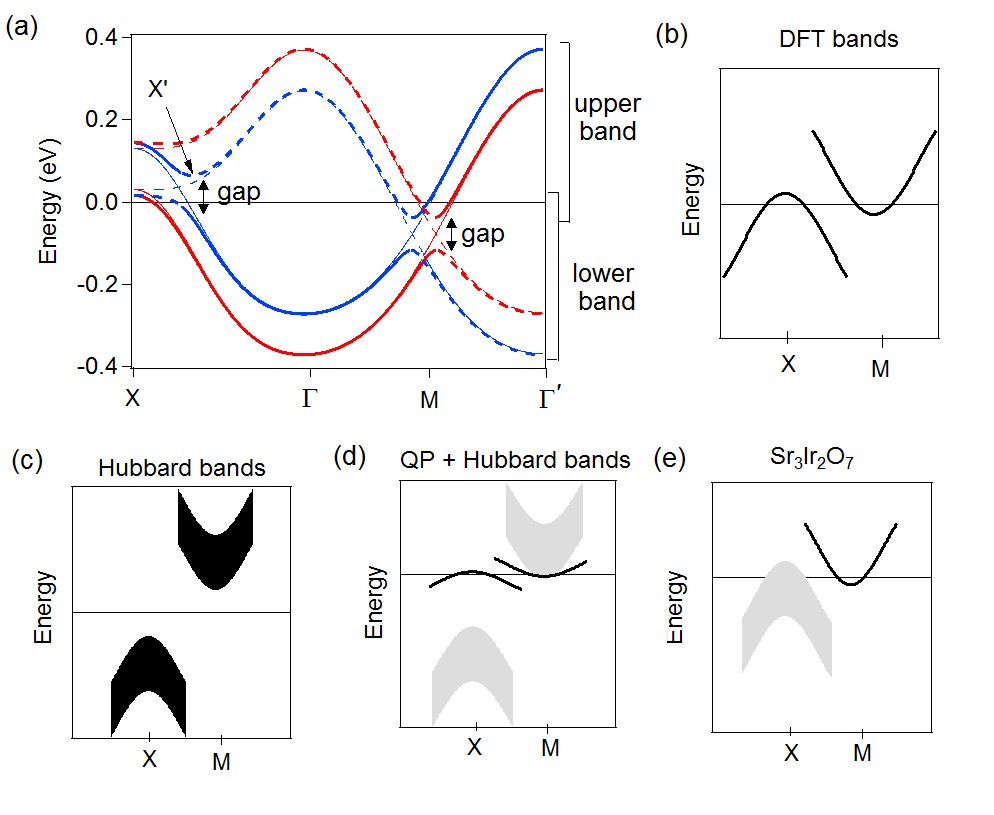
Layered iridates offer a new test family, which is unusual as correlations take place in presence of strong spin-orbit coupling (SOC). In Sr2IrO4, the SOC is necessary to remove the degeneracy of the ground state and form a narrow half-filled band at the Fermi level, where modest correlations open a Mott gap BJKimPRL08 ; MartinsPRL11 ; AritaPRL12 . Recent theoretical studies discuss whether, upon doping, the transition to the metallic state should occur through a pseudogapped phase MartinsPRM18 ; MoutenetPRB18 . Sr3Ir2O7 shares many properties with Sr2IrO4 CaoPRB02 ; DhitalPRB13 , but the role of correlations is not as obvious. Its bilayer structure creates a band gap of about 0.1eV in the doubled J=1/2 bands near the Fermi level, even without correlations CarterPRB13_TB ; OkadaNatMat13 ). Fig. 7 sketches this gap opening, which results in a semi-metallic case in density functional theory (DFT) band structure calculations (full calculations are shown in appendix). Although correlations and/or magnetism are usually found necessary to enlarge this gap and reach the insulating state CarterPRB13_TB ; OkadaNatMat13 , the two states are adiabatically connected, which is different from Sr2IrO4 DeLaTorrePRL14 . Indeed, one ARPES study of Sr3Ir2O7 doped with La concluded that it should be viewed as a doped semiconductor, very different from Sr2IrO4 and with little traces of correlations DeLaTorrePRL14 . A subsequent ARPES study clarified that there is nevertheless a gap that closes as a function of doping HeNatMat15 and STM OkadaNatMat13 ; HoganPRL15 or optical studies MoonPRB09 ; AhnSciRep16 also support a correlated behavior. As it would be quite interesting to have two examples of “spin-orbit Mott insulators”, with different strength of correlations and different symmetry of magnetic excitationsKimPRL12_327 , understanding how these two systems should be compared is crucial.
To address these questions, we present an ARPES study of Sr3Ir2O7 doped with La or Rh. To our knowledge Rh doping, which substitutes for Ir, was never reported in Sr3Ir2O7. We show it induces effective hole doping as it does in Sr2IrO4 ClancyPRB14 ; QiCaoPRB12 ; CaoNatCom16 ; LouatPRB18 . Previous ARPES studies have well documented the emerging FS under high La doping, characterized by small “lens-like” electron pockets around the M point DeLaTorrePRL14 ; HeSciRep15 ; HeNatMat15 . We focus on the bands below the Fermi level to determine more completely the evolution of the electronic structure. We confirm the reduction of the gap, not only at the X point of the Brillouin Zone (BZ) as previously reported HeNatMat15 , but also at the M point. At first sight, this brings the system back to the non-correlated case. Our key finding is however that, beyond the relative position of the bands, their nature is very different, as sketched in Fig. 1e. The band at the Fermi level exhibits well defined quasiparticle peaks, while the lower band has a much larger linewidth and loses weight as a function of doping, as expected for an incoherent band. This points to the presence of correlation effects, which go beyond predictions of simple band calculations. We also uncover different intensity modulation of these bands over neighboring BZ. The coherent band spectral weight follows the periodicity of the true unit cell (containing two Ir HoganPRB16 ), while the incoherent band is mainly sensitive to on-site properties. We conclude by a comparison with Sr2IrO4, where a similar dichotomy between the upper and lower bands can be deciphered.
II Experimental details
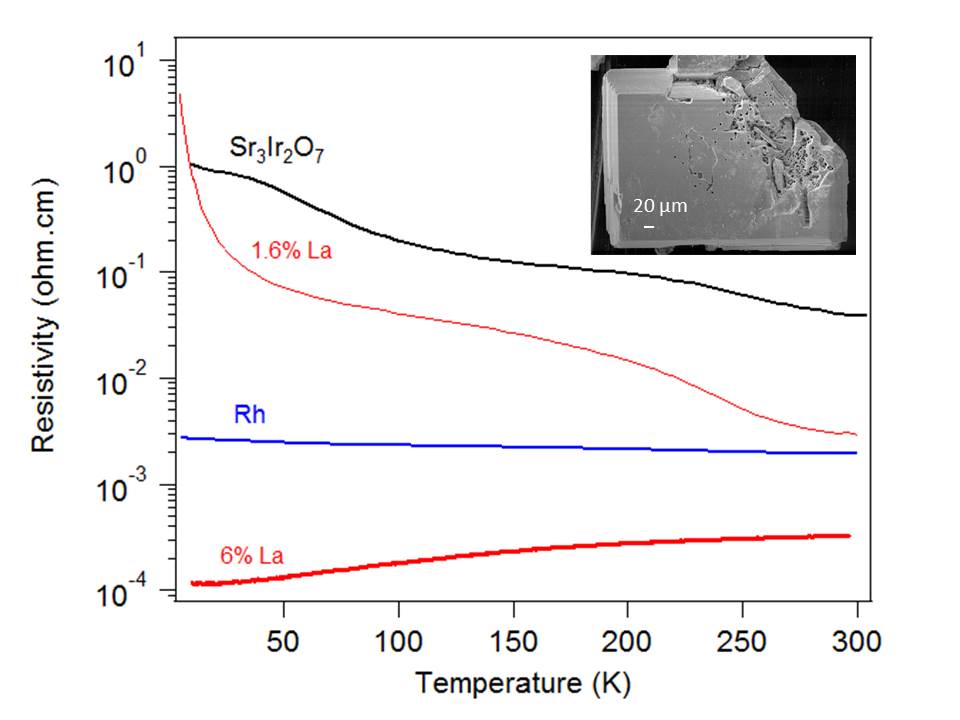
Single crystals of (Sr1-xLax)3Ir2O7 with x=0, 0.016, 0.06 and Sr3(Ir1-xRhx)2O7 with x= 0.03 were grown as follows. High purity powders of SrCO3 (99.995%), IrO2 (99%) (La2O3 (99.999%) or Rh2O3 (99.9%)) were dried, weighed, mixed in a glove box under argon with SrCl2 (99.5%) flux in the ratio 3:2:5. The mixture was loaded into a platinum crucible covered with a platinum tip, reacted in tubular furnace under oxygen flux (except for Rh, synthesized in air) at 1120∘C for 6 hours and slowly cooled (10∘C/h) to 600∘C. Then deionized water was used to dissolve the SrCl2 flux and extract the single crystals. The crystals are platelets with the smallest dimension along [001] direction and 0.3 to 1mm as side. The exact doping was estimated by Energy Dispersion X-ray analysis. Unit cell dimensions of pure Sr3Ir2O7 have been determined by X-ray diffraction data collected at 150 K on a Nonius Kappa-CCD area detector diffractometer using graphite-monochromated Mo K radiation ( = 0.71073 Å) : a = b= 3.8951(2) Å and c = 20.8941(13) Å with tetragonal space group I4/mmm. No impurity phases were detected for the pure and La cases, but about 5% pure Sr2IrO4 was detected by SQUID measurements in the Rh case. However, ARPES signature of Sr2IrO4 is easy to distinguish from Sr3Ir2O7 and none was observed on the cleaved surface for our measurements. Typical resistivity curves are shown in appendix. They are similar to those published in literature for the same La dopings LiCaoPRB13 ; HoganPRL15 . For 3% Rh, the resistivity is in between the two La cases, on the insulating side of the transition. It increases weakly with decreasing temperatures.
ARPES experiments were carried out at the CASSIOPEE beamline of SOLEIL synchrotron, with a SCIENTA R-4000 analyser and an overall resolution better than 15 meV. All data shown here were acquired at a photon energy of 100 eV, with linear polarization along M. The temperature is 50 K, which is in the magnetic phase for all compounds, except for 6% La doping, where no magnetic transition is detected by SQUID measurements.
III ARPES in Sr3Ir2O7
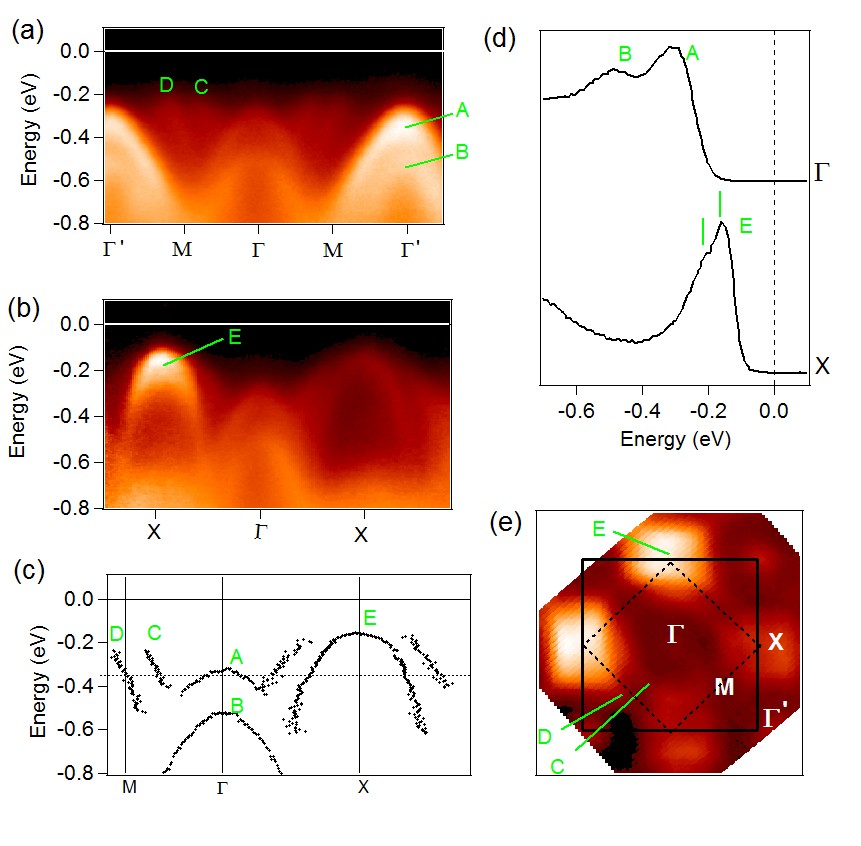
We start with a discussion of the band structure of Sr3Ir2O7 to set clear the context of our measurements. In Fig.2, we show the energy-momentum plots of ARPES intensity obtained in Sr3Ir2O7 along M (a) and X (b). Similar results were published previously WangDessauPRB13 ; KingPRB13 ; MoreschiniPRB14 . At , the characteristic double peak structure of the J=3/2 band can be recognized. The two J=3/2 doublets are completely filled with 4 electrons. The two peaks at -0.35 and -0.5eV are noted A and B and are also shown in the EDC at in Fig.2d. There is a clear alternation of weak bands at and strong bands at ’ for this double peak. These two points are equivalent in a 2 Ir BZ (dotted square in Fig. 2e) but inequivalent in a 1Ir BZ (solid square). Hence, the relative intensities are modulated with a strength proportional to that of the symmetry breaking VoitScience00 .
In Fig.2a, we also see quite clearly bands going up from to M with a maximum around -0.2eV at C and D. Their dispersion is reported in Fig. 2c. They have not been discussed in previous ARPES papers, but they form two well defined circles around , as can be observed in Fig. 2e with the map of the ARPES spectral weight integrated at -0.2eV. They evidently correspond to the J=1/2 band gapped by 0.2eV. Their map reminds the circular FS expected for the J=1/2 band in Sr2IrO4 (with an additional splitting) and their dispersion corresponds well to the one of the J=1/2 band (a basic band structure of Sr2IrO4 is recalled in appendix). Only the part from to M is clearly visible in ARPES, because the other side is folded in the 2Ir BZ and is then very weak, as for the J=3/2 bands at . This explains the anomalous “stopping” at C and D, also observed in Sr2IrO4 (see appendix).
The J=1/2 band is also clear at X, with a maximum located at E, near -0.2eV (Fig. 2b and 2d for the corresponding EDC). We note that there seems to be a small splitting of the band at X, of about 0.1eV (see marks on the EDC), which may either be an intrinsic structure of the band due to correlations or may reveal a further lowering of symmetry.
IV ARPES in doped Sr3Ir2O7
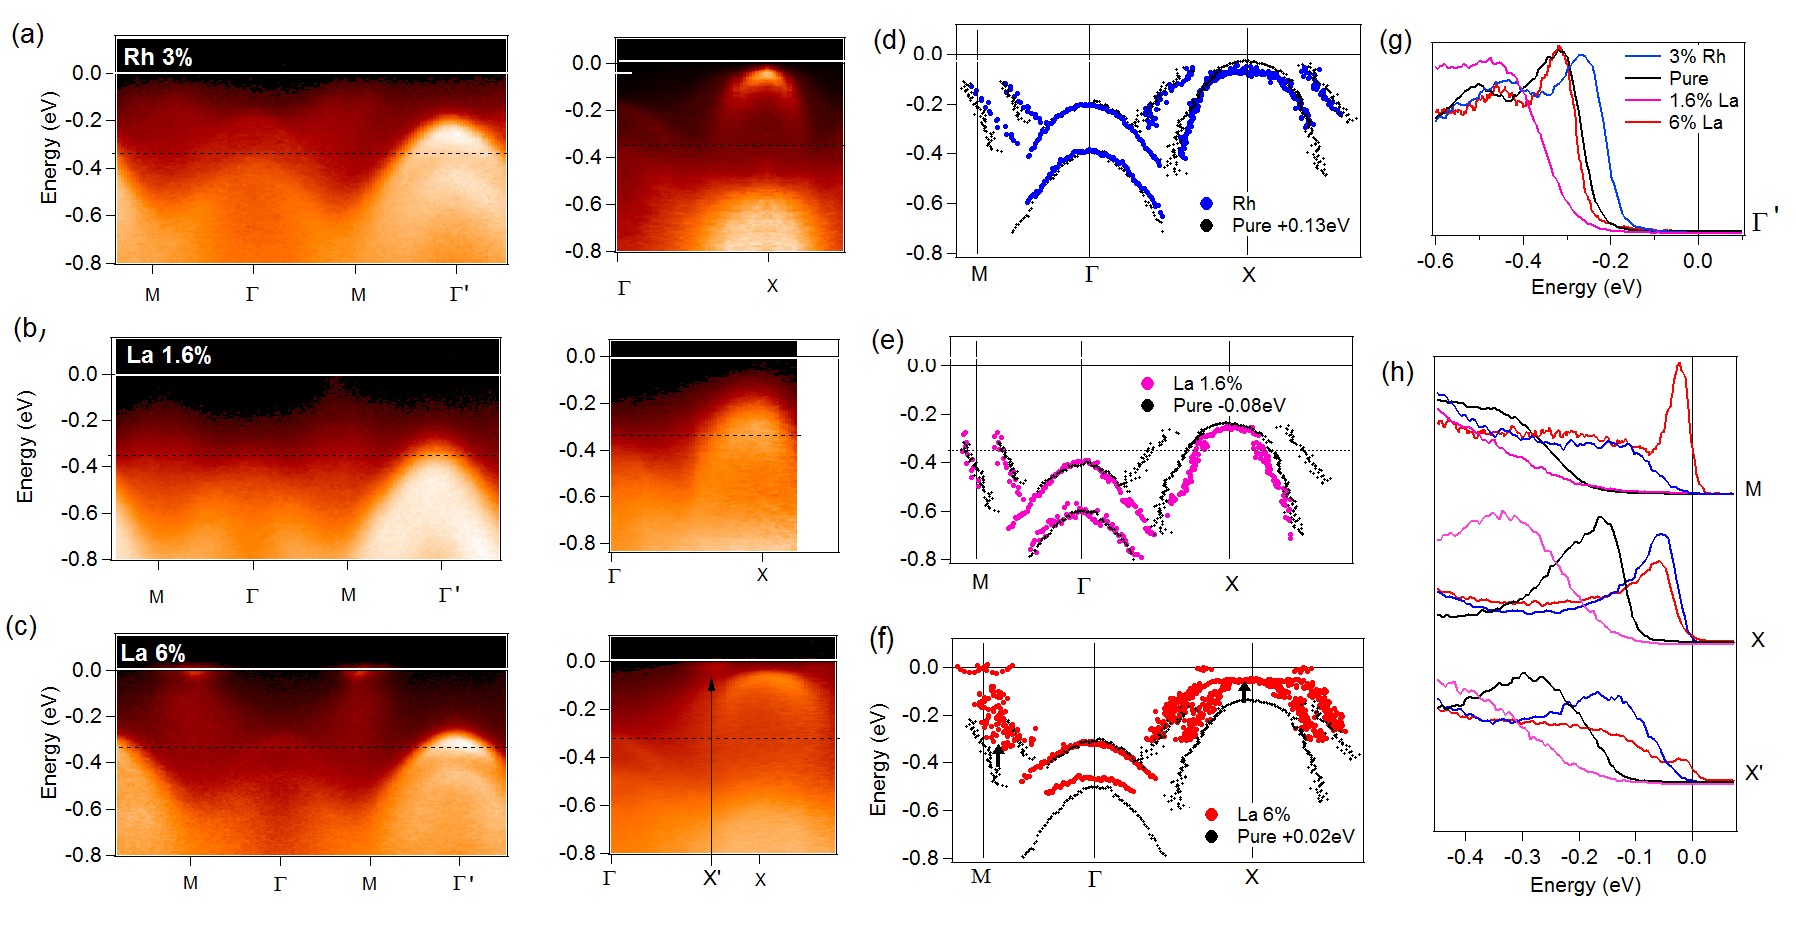
Fig. 3 displays the evolution of the electronic structure for Rh (a) and La (b-c) dopings. At first sight, they look very similar to the pure case, except for 6% La, where small pockets appear at the Fermi level. There are nevertheless significant shifts of the structures for the low dopings. As a reference, we show by black dotted line the position of the first J=3/2 band in Sr3Ir2O7 (-0.35eV). For 3% Rh doping (Fig.3a), all bands move up by 0.13eV, which is confirmed by the nearly perfect overlap of the dispersions when this shift is applied, as done in Fig.3d. Although the bands at X are very close to EF, the leading edge is still at -20meV (see Fig. 3h), in agreement with the non-metallic character. Also, the double peak structure that existed in the pure case at X has weakened or disappeared. This rigid shift up towards the Fermi level is analogous to the one observed in Sr2IrO4 and can be attributed to effective hole doping CaoNatCom16 ; LouatPRB18 .
For 1.6% La (Fig. 3b), there is also a rigid shift, except it is of -0.08eV, to higher binding energies, consistent with electron doping. The bands also tend to broaden, which may be due to inhomogeneities introduced by doping. As can be seen on the EDC spectra in Fig. 3h, there are no in-gapped states around -0.1 eV, neither at M nor X, contrary to what was reported in AffeldtPRB18 . Such states then probably comes from some type of disorder and/or inhomogeneities. We also do not observe any significant change of the effective mass for the main bands, as can be seen from the good overlap of all dispersions, contrary to what was reported based on these in-gapped states AffeldtPRB18 .
It is likely that the Fermi level is very near the top of the lower band for 3% Rh and the bottom of the upper band for 1.6% La (see Fig. 1 for a definition of what we call lower and upper bands). This gives an estimate of the gap of about 0.2eV, in good agreement with other measurements, like STM HoganPRL15 . We have found a very similar behavior in Sr2IrO4 BrouetPRB15 , so that this shift of Fermi level characterizes the low doping behaviors in these iridates. We note that for the pure compound, EF is closer to the electron doped side. This may indicate that our sample is slightly electron doped. Indeed, bands around -0.25 and -0.45eV were reported in literature of Sr3Ir2O7 MoreschiniPRB14 ; KingPRB13 , 50meV above ours, and shifting to lower values with La doping.
On the contrary, in 6% La [Fig. 3(c) and (f)], the shift is not rigid anymore. The J=3/2 band is near the position of the pure case, but, remarkably, the J=1/2 bands at X have moved up by 0.15eV (see arrows). This evidences a true reduction of the gap within the lower and upper J=1/2 bands. As we estimated the gap in the pure case to 0.2eV, this reduction is very sizable. The remaining gap of about 50meV is even smaller than the “structural gap” obtained in band structure calculations (about 100meV, see appendix and ref. CarterPRB13_TB ; OkadaNatMat13 ), so that it seems the magnetic/correlated part of the gap has totally collapsed. We do not know if this smaller gap should be assigned to renormalization effects or shortcomings of the band structure calculations. An additional confirmation of this gap reduction is the appearance of the upper band at the Fermi level, forming small pockets at the position X’ (arrow in Fig. 3c, see also Fig. 1a). In fact, the position of the lower band at X is almost the same as for Rh, but this pocket is not present in the Rh case, in good agreement with the idea that there is still a larger gap for Rh. A small QP peak appears at X’, which can be better seen on the spectra in Fig. 3h. Importantly, detecting a QP there, even if it is small, means that there is no “pseudogap” in this region, which corresponds to the “antinodal region” in cuprates and is the one where a pseudogap is discussed in Sr2IrO4 for similar La dopings DeLaTorrePRL15 or surface doping KimScience14 .
The same situation is observed at M. The upper band forms small pockets near EF, as reported before DeLaTorrePRL14 ; HeNatMat15 , but we also see trace of the lower band shifted up by 0.15eV (see Fig. 3c). Its dispersion becomes however quite diffuse and difficult to track, as evidenced by the larger scattering in experimental points. This loss of coherence is anomalous in a band picture. Indeed, this hump was previously identified as the incoherent part of the QP in ref. DeLaTorrePRL14 . The connection with the lower J=1/2 band questions its nature (this connection was noted in ref. DeLaTorrePhD ). An EDC spectrum at M in Fig. 3(h) shows that these lower bands form a hump of full width 160meV, below the QP peak of full width 40meV. Similarly, the peak due to the lower J=1/2 at X’ has evolved into a hump in the 6% La case. It is much broader and has smaller weight than in the pure and Rh-doped cases. The much larger width is not simply due to the higher binding energy, as the peak in J=3/2 remains relatively narrow despite its higher binding energy (full width 80meV, see Fig. 3g). The difference of behavior in width and weight between the two bands is surprising because they have similar orbital character. In a band view, there should be no difference between the upper and lower band of J=1/2, contrary to what we see in Fig. 3(h). The change in spectral weight rather reminds a correlated case. Evidently these two bands have a different “status”, which will be discussed further in conclusion.
V Intensity modulations
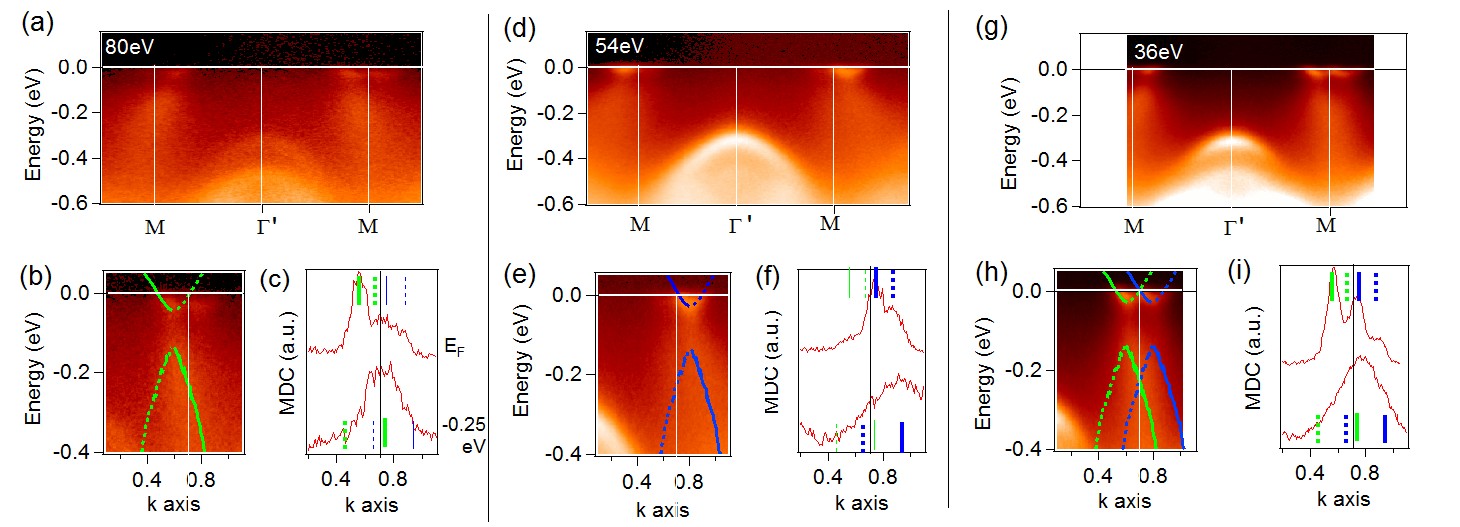
Another difference between the lower and upper bands is detailed in Fig. 4. While the pockets at EF are rather symmetric, it is never the case for the lower tail. Only the part of the dispersion going up from to M is clear, its "folded" side (dotted line in Fig. 4) is simply missing.
The green and blue bands on this figure correspond to the bonding and antibonding bands formed by the two layers. The change of phase within the bilayer gives rise to an oscillation of intensity between green and blue bands as a function of kz. This can be probed by changing the photon energy and was observed in Bi cuprates KordyukPRL02 or Sr3Ir2O7 MoreschiniPRB14 . This can be conveniently observed at the point between the two J=3/2 bands. At 80eV (Fig. 4a), the weight is almost entirely in the band at -0.5eV; at 54eV, it is in the one at -0.3eV and at 36eV, it is similar in both. The J=1/2 bands near M follow exactly the same trend, both for the small pocket at EF and the tail. The left one is strong for 80eV, the right one for 54eV and they have similar weight at 36eV. This can also be seen by the momentum distribution curves of Fig. 4. The vertical lines indicate where the peaks are expected for the 4 different bands and it is easy to check that it is almost entirely on the green ones at 80 eV, the blue ones at 54 eV and is more evenly distributed for 36eV, both for the upper and lower bands.
The dephasing between the 2 Ir in the plane gives rise to a very similar modulation of intensity, but this time it is in-plane, between the direct and folded bands (solid and dotted lines). This is very obvious between and ’ for J=3/2, as we discussed before with Fig. 2a. As for the J=1/2 band, the same modulation is observed for the lower band (the part from to M is strong, but the part from M to ’ is not visible), but not for the upper band forming quite a symmetric pocket. This can be appreciated more quantitatively on the MDC spectra of Fig. 4. Two peaks can be distinguished on solid and dotted lines at , while the spectra are mostly peaked on the solid lines at 250meV. Although it was shown HeSciRep15 that, in some conditions, one can also obtain an asymmetric pocket (which changes the appearance of the FS from a pocket to a Fermi arc), it remains that the modulation of intensity is much more ubiquitous for the lower band.
As the intensity of the folded bands is related to the strength of the potential at the origin of the symmetry breaking, this suggests that the upper band probes a larger difference between the two Ir than the lower one. Following our previous observations, we could suggest that the lower/incoherent band is essentially sensitive to on-site properties (hence obeying a 1Ir BZ periodicity), while the upper/coherent band delocalizes over many sites and therefore respects the true 2Ir BZ periodicity of the unit cell.
Interestingly, a very similar behavior was observed for Sr2IrO4 at high La doping DeLaTorrePRL15 ; GretarssonPRL16 . A clear and symmetric pocket is observed at M near EF, followed by a tail, which rapidly loses weight and is not the symmetric part of the Dirac cone expected in the calculation. On the other hand, when the lower J=1/2 band is clear, for smaller dopings, only the direct part is observed, as shown in appendix.
VI Conclusion
Our study points to a large role of correlations in Sr3Ir2O7. Even though it has a structure that already breaks the J=1/2 doublet into lower and upper bands, the size of the gap between them changes as a function of doping, from 200meV to 50meV, demonstrating the impact of correlations and/or magnetism. Furthermore, Sr3Ir2O7 presents a peculiar type of insulator to metal transition, where the bands have intermediate character between “Hubbard” and “coherent” bands. On the one hand, we observe for the lower band spectral weight transfer and large linewidth that are typical of Hubbard bands. On the other hand, this band exists in a DFT calculation, suggesting a coherent nature. This situation may be closer to that of an antiferromagnetic insulator, where DMFT CamjayiPRB06 predicts “Slater” bands to appear within the Mott gap, which may have such an intermediate status.
The bands we observe in Sr3Ir2O7 are not renormalized compared with DFT calculations, which is usually taken as a sign of small correlations. However, correlations are patent in the width and loss of weight behaviors of the lower band. The absence of renormalization should rather be viewed here as a sign of the incoherent nature of the bands away from . The coherent region in the vicinity of the Fermi level is very narrow, of the order of 50 meV. If this is the energy scale for coherence in this system, it is indeed a rather strongly correlated metal.
Our study of Sr3Ir2O7 also gives a fresh view on the situation in Sr2IrO4. As a gap is always present in Sr3Ir2O7, it is possible to study independently the distance between the lower and upper bands and their respective widths. This makes the separation of coherent and incoherent bands on the two sides of the gap easier. In Sr2IrO4, a clear and symmetric pocket can be observed at the Fermi levelDeLaTorrePRL15 ; GretarssonPRL16 followed by an incoherent tail. It is difficult to determine whether the gap is closed or not, as the incoherent tail of the lower band extends to the upper band, yielding a very asymmetric shape. This asymmetry is precisely the one we have described between the lower and upper bands of Sr3Ir2O7, suggesting a unified picture. This has important consequences to discuss the presence/absence of a pseudogap. In Sr3Ir2O7, the FS should always consist of pockets around M and X and we have shown that when a peak appears at X, it is not gapped. In Sr2IrO4, a simple circular FS would be expected if the gap is closed, at variance with the pocket observed at intermediate dopings, both for La doping DeLaTorrePRL14 and surface doping KimScience14 . If the gap is really completely closed, observing a pocket means a pseudogap is present, but if it is only partially closed, it is natural to observe only a pocket around M. A progressive closing of the gap is expected from the behavior of Sr3Ir2O7 HeNatMat15 , so that the meaning of these pockets is not straightforward. On the other hand, the different width of the lower and upper bands emerges clearly from the comparison of the two systems as an intrinsic fingerprint of their correlations. Interestingly, these different widths are in very good agreement with predictions of cluster DMFT calculations in Sr2IrO4, where they also lead to a pseudogap behavior MoutenetPRB18 . We conclude that both Sr2IrO4 and Sr3Ir2O7 are suitable systems to study this physics in more details.
VII Acknowledgements
We thank M. Civelli and F. Bert for useful discussions. We thank ANR “SOCRATE” (ANR-15-CE30-0009-01), the Université Paris-Sud (“PMP MRM Grant”) and the Investissement d’Avenir LabEx PALM (ANR-10-LABX-0039-PALM) for financial support.
References
- (1) M. Imada, A. Fujimori, and Y. Tokura, Rev. Mod. Phys. 70, 1039 (Oct 1998), https://link.aps.org/doi/10.1103/RevModPhys.70.1039
- (2) A. Georges, G. Kotliar, W. Krauth, and M. J. Rozenberg, Rev. Mod. Phys. 68, 13 (1996)
- (3) I. Vishik, cond-mat/1803.11228
- (4) B. J. Kim, H. Jin, S. J. Moon, J.-Y. Kim, B.-G. Park, C. S. Leem, J. Yu, T. W. Noh, C. Kim, S.-J. Oh, J.-H. Park, V. Durairaj, G. Cao, and E. Rotenberg, Phys. Rev. Lett. 101, 076402 (2008)
- (5) C. Martins, M. Aichhorn, L. Vaugier, and S. Biermann, Phys. Rev. Lett. 107, 266404 (2011)
- (6) R. Arita, J. Kuneš, A. V. Kozhevnikov, A. G. Eguiluz, and M. Imada, Phys. Rev. Lett. 108, 086403 (2012)
- (7) C. Martins, B. Lenz, L. Perfetti, V. Brouet, F. m. c. Bertran, and S. Biermann, Phys. Rev. Materials 2, 032001 (Mar 2018), https://link.aps.org/doi/10.1103/PhysRevMaterials.2.032001
- (8) A. Moutenet, A. Georges, and M. Ferrero, Phys. Rev. B 97, 155109 (Apr 2018), https://link.aps.org/doi/10.1103/PhysRevB.97.155109
- (9) G. Cao, Y. Xin, C. S. Alexander, J. E. Crow, P. Schlottmann, M. K. Crawford, R. L. Harlow, and W. Marshall, Phys. Rev. B 66, 214412 (Dec 2002), https://link.aps.org/doi/10.1103/PhysRevB.66.214412
- (10) C. Dhital, T. Hogan, Z. Yamani, C. de la Cruz, X. Chen, S. Khadka, Z. Ren, and S. D. Wilson, Phys. Rev. B 87, 144405 (Apr 2013), https://link.aps.org/doi/10.1103/PhysRevB.87.144405
- (11) J.-M. Carter, V. Shankar V., and H.-Y. Kee, Phys. Rev. B 88, 035111 (Jul 2013), https://link.aps.org/doi/10.1103/PhysRevB.88.035111
- (12) Y. Okada, D. Walkup, H. Lin, C. Dhital, T.-R. Chang, S. Khadka, W. Zhou, H.-T. Jeng, M. Paranjape, A. Bansil, Z. Wang, S. D. Wilson, and V. Madhavan, Nature Materials 12, 707 EP (May 2013), http://dx.doi.org/10.1038/nmat3653
- (13) A. de la Torre, E. Hunter, A. Subedi, S. McKeown Walker, A. Tamai, T. Kim, M. Hoesch, R. Perry, A. Georges, and F. Baumberger, Phys. Rev. Lett. 113, 256402 (2014)
- (14) J. He, T. Hogan, T. R. Mion, H. Hafiz, Y. He, J. D. Denlinger, S.-K. Mo, C. Dhital, X. Chen, Q. Lin, Y. Zhang, M. Hashimoto, H. Pan, D. H. Lu, M. Arita, K. Shimada, R. S. Markiewicz, Z. Wang, K. Kempa, M. J. Naughton, A. Bansil, S. D. Wilson, and R.-H. He, Nature Materials 14, 577 EP (Apr 2015), http://dx.doi.org/10.1038/nmat4273
- (15) T. Hogan, Z. Yamani, D. Walkup, X. Chen, R. Dally, T. Z. Ward, M. P. M. Dean, J. Hill, Z. Islam, V. Madhavan, and S. D. Wilson, Phys. Rev. Lett. 114, 257203 (Jun 2015), https://link.aps.org/doi/10.1103/PhysRevLett.114.257203
- (16) S. Moon, H. Jin, W. Choi, J. Lee, S. Seo, J. Yu, G. Cao, T. Noh, and Y. Lee, Phys. Rev. B 80, 195110 (2009)
- (17) G. Ahn, S. Song, T. Hogan, S. D. Wilson, and S. Moon, Scientific reports 6, 32632 (2016)
- (18) J. Kim, A. H. Said, D. Casa, M. H. Upton, T. Gog, M. Daghofer, G. Jackeli, J. van den Brink, G. Khaliullin, and B. J. Kim, Phys. Rev. Lett. 109, 157402 (Oct 2012), https://link.aps.org/doi/10.1103/PhysRevLett.109.157402
- (19) J. P. Clancy, A. Lupascu, H. Gretarsson, Z. Islam, Y. F. Hu, D. Casa, C. S. Nelson, S. C. LaMarra, G. Cao, and Y.-J. Kim, Phys. Rev. B 89, 054409 (2014)
- (20) T. Qi, O. Korneta, L. Li, K. Butrouna, V. Cao, X. Wan, P. Schlottmann, R. Kaul, and G. Cao, Phys. Rev. B 86, 125105 (2012)
- (21) Y. Cao, Q. Wang, J. A. Waugh, T. J. Reber, H. Li, X. Zhou, S. Parham, S.-R. Park, N. C. Plumb, E. Rotenberg, A. Bostwick, J. D. Denlinger, T. Qi, M. A. Hermele, G. Cao, and D. S. Dessau, Nature Communications 7, 11367 EP (Apr 2016), article, http://dx.doi.org/10.1038/ncomms11367
- (22) A. Louat, F. Bert, L. Serrier-Garcia, F. Bertran, P. Le Fèvre, J. Rault, and V. Brouet, Phys. Rev. B 97, 161109 (Apr 2018), https://link.aps.org/doi/10.1103/PhysRevB.97.161109
- (23) J. He, H. Hafiz, T. R. Mion, T. Hogan, C. Dhital, X. Chen, Q. Lin, M. Hashimoto, D. H. Lu, Y. Zhang, R. S. Markiewicz, A. Bansil, S. D. Wilson, and R.-H. He, Scientific Reports 5, 8533 EP (Feb 2015), article, http://dx.doi.org/10.1038/srep08533
- (24) T. Hogan, L. Bjaalie, L. Zhao, C. Belvin, X. Wang, C. G. Van de Walle, D. Hsieh, and S. D. Wilson, Phys. Rev. B 93, 134110 (Apr 2016), https://link.aps.org/doi/10.1103/PhysRevB.93.134110
- (25) L. Li, P. P. Kong, T. F. Qi, C. Q. Jin, S. J. Yuan, L. E. DeLong, P. Schlottmann, and G. Cao, Phys. Rev. B 87, 235127 (Jun 2013), https://link.aps.org/doi/10.1103/PhysRevB.87.235127
- (26) Q. Wang, Y. Cao, J. A. Waugh, S. R. Park, T. F. Qi, O. B. Korneta, G. Cao, and D. S. Dessau, Phys. Rev. B 87, 245109 (2013)
- (27) P. D. C. King, T. Takayama, A. Tamai, E. Rozbicki, S. M. Walker, M. Shi, L. Patthey, R. G. Moore, D. Lu, K. M. Shen, H. Takagi, and F. Baumberger, Phys. Rev. B 87, 241106 (Jun 2013), https://link.aps.org/doi/10.1103/PhysRevB.87.241106
- (28) L. Moreschini, S. Moser, A. Ebrahimi, B. Dalla Piazza, K. S. Kim, S. Boseggia, D. F. McMorrow, H. M. Ronnow, J. Chang, D. Prabhakaran, A. T. Boothroyd, E. Rotenberg, A. Bostwick, and M. Grioni, Phys. Rev. B 89, 201114 (May 2014), https://link.aps.org/doi/10.1103/PhysRevB.89.201114
- (29) J. Voit, L. Perfetti, F. Zwick, H. Berger, G. Margaritondo, G. Grüner, H. Höchst, and M. Grioni, Science 290, 501 (2000), ISSN 0036-8075, http://science.sciencemag.org/content/290/5491/501.full.pdf, http://science.sciencemag.org/content/290/5491/501
- (30) G. Affeldt, T. Hogan, J. D. Denlinger, A. Vishwanath, S. D. Wilson, and A. Lanzara, Phys. Rev. B 97, 125111 (Mar 2018), https://link.aps.org/doi/10.1103/PhysRevB.97.125111
- (31) V. Brouet, J. Mansart, L. Perfetti, C. Piovera, I. Vobornik, P. Le Fèvre, F. Bertran, S. C. Riggs, M. C. Shapiro, P. Giraldo-Gallo, and I. R. Fisher, Physical Review B 92, 081117 (2015)
- (32) A. de la Torre, S. McKeown Walker, F. Y. Bruno, S. Riccó, Z. Wang, I. Gutierrez Lezama, G. Scheerer, G. Giriat, D. Jaccard, C. Berthod, T. K. Kim, M. Hoesch, E. C. Hunter, R. S. Perry, A. Tamai, and F. Baumberger, Physical Review Letters 115, 176402 (2015)
- (33) Y. K. Kim, O. Krupin, J. D. Denlinger, A. Bostwick, E. Rotenberg, Q. Zhao, J. F. Mitchell, J. W. Allen, and B. J. Kim, Science 345, 187 (2014), ISSN 0036-8075, http://science.sciencemag.org/content/345/6193/187.full.pdf, http://science.sciencemag.org/content/345/6193/187
- (34) A. de la Torre, Spectroscopic Studies of Layered Iridium Oxides, PhD Geneve(2015)
- (35) A. A. Kordyuk, S. V. Borisenko, T. K. Kim, K. A. Nenkov, M. Knupfer, J. Fink, M. S. Golden, H. Berger, and R. Follath, Phys. Rev. Lett. 89, 077003 (Jul 2002), https://link.aps.org/doi/10.1103/PhysRevLett.89.077003
- (36) H. Gretarsson, N. H. Sung, J. Porras, J. Bertinshaw, C. Dietl, J. A. N. Bruin, A. F. Bangura, Y. K. Kim, R. Dinnebier, J. Kim, A. Al-Zein, M. Moretti Sala, M. Krisch, M. Le Tacon, B. Keimer, and B. J. Kim, Phys. Rev. Lett. 117, 107001 (Sep 2016), https://link.aps.org/doi/10.1103/PhysRevLett.117.107001
- (37) A. Camjayi, R. Chitra, and M. J. Rozenberg, Phys. Rev. B 73, 041103 (Jan 2006), https://link.aps.org/doi/10.1103/PhysRevB.73.041103
- (38) M. K. Crawford, M. A. Subramanian, R. L. Harlow, J. A. Fernandez-Baca, Z. R. Wang, and D. C. Johnston, Phys. Rev. B 49, 9198 (1994)
- (39) P. Blaha, K. Schwarz, G. Madsen, D. Kvasnicka, and J. Luitz, WIEN2K: An Augmented Plane Wave + Local Orbitals Program for Calculating Crystal Properties (Karlheinz Schwarz, Techniche Universitat, Wien, Austria)(1999)
- (40) G. Q. Liu, V. N. Antonov, O. Jepsen, and O. K. Andersen., Physical Review Letters 101, 1 (2008)
- (41) S. Zhou, K. Jiang, H. Chen, and Z. Wang, Phys. Rev. X 7, 041018 (Oct 2017), https://link.aps.org/doi/10.1103/PhysRevX.7.041018
- (42) J.-M. Carter and H.-Y. Kee, Phys. Rev. B 87, 014433 (Jan 2013), https://link.aps.org/doi/10.1103/PhysRevB.87.014433
VIII Appendix
VIII.1 Sample characterization
In Fig. 5, we show typical resistivity for samples used in this study. They were measured via standard four-wire measurements within a Quantum Design PPMS.
VIII.2 Sketch of the band structure in Sr2IrO4
In Fig. 6, we show for reference a sketch of the band structure of Sr2IrO4, using only the J=1/2 band at the Fermi level (solid blue line). The expected Fermi Surface in DFT calculations is a circle. This band is folded with respect to the 2 Ir BZ boundaries, as shown as dotted line. The 2 inequivalent Ir arise due to rotations of the oxygen octahedra CrawfordPRB94 . The AF order gives rise to the same doubling of the unit cell. The direct and folded bands cross at the M point.
In the case of AF order, a gap opens where the bands cross (arrow). The resulting dispersion is shown as thick blue lines. The size of the line is proportional to the expected ARPES spectral weight VoitScience00 . By contrast, in Sr3Ir2O7, this crossing is already gapped by interaction within the bilayer (see Fig. 1 and below), so that the effect of the AF order/correlations is only to enlarge this gap.
Very similarly to Sr3Ir2O7, ARPES along M (Fig. 6c) shows a band going up from to M, but the folded side form M to ’ is missing.

VIII.3 Band structure calculations for Sr3Ir2O7
Band structure calculations were done using the WIEN2k package Wien2k and including spin-orbit coupling. Due to the complexity of the structure of Sr3Ir2O7 HoganPRB16 and to a systematic underestimation of the strength of SOC in LDA calculations LiuPRL08 ; ZhouPRX18 , calculations for Sr3Ir2O7 have often been done using tight-binding models CarterPRB13_327 ; DeLaTorrePhD . Our results will be in qualitative agreements with these previous findings, but we use the actual experimental structure with space group #68 (Ccca) to avoid using adjustable parameters.
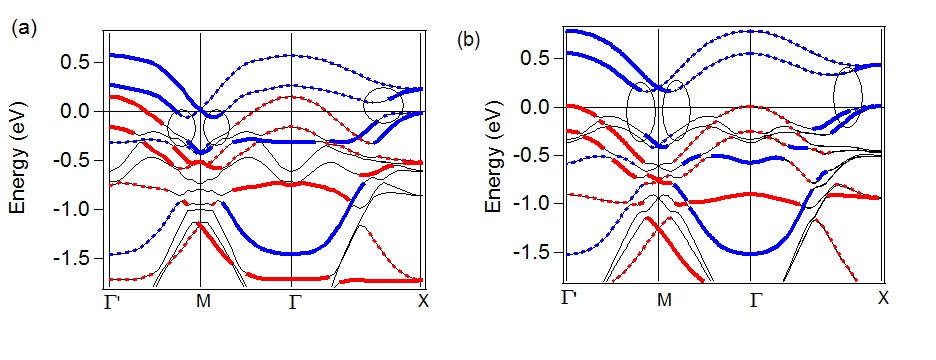
In Fig. 7(a), we highlight bands of J=1/2 and J=3/2 characters by blue and red colors, respectively. It is easy to see that the bands of Sr2IrO4 have split, by about 0.3eV at . The J=3/2 band will be pushed lower in energy by a stronger SOC (below -0.2eV, see ref. MoreschiniPRB14 ; KingPRB13 and Fig. 2), so that we can focus on the J=1/2 band alone. We see that the J=1/2 bands interact with each other, opening a gap of structural origin in the black circles (100meV near X, 200meV near M). In this calculation, the small electron pockets at M are compensated by the J=3/2 hole pocket at . If this band was pushed lower in energy, it would be compensated by narrow hole pockets at X, forming a semi-metallic structure presented in Fig. 1(a-b).
In Fig. 7(b), we stabilize the magnetic state by adding an orbital potential U=2.7eV. This yields a magnetic moment M=0.28, somewhat larger than in experiment DhitalPRB13 . The structure of J=1/2 into lower and upper band remains the same, but the gap between them (defined as in Fig. 1a) is enlarged to about 0.4eV.
