The XXL Survey: XXVII. The 3XLSS point source catalogue. ††thanks: The 3XLSS X-ray catalogue described in Tables 9 and 10, the 3XLSSOPTN and 3XLSSOPTS multiwavelength catalogues described in Table 11, the redshift catalogue (Full Table 12), and the updated XMM XXL observation list (Full Table 12) are only available at CDS. ††thanks: Based on observations obtained with XMM-Newton, an ESA science mission with instruments and contributions directly funded by ESA Member States and NASA.
We present the version of the point source catalogue of the XXL Survey that was used, in part, in the first series of XXL papers. In this paper we release, in our database in Milan and at CDS: (i) the X-ray source catalogue with 26 056 objects in two areas of 25 deg2 with a flux limit (at 3) of erg s-1 cm-2 in [0.5-2] keV, and 3 erg s-1 cm-2 in [2-10] keV, yielding a 90% completeness limit of 5.8 and 3.8 respectively ; (ii) the associated multiwavelength catalogues with candidate counterparts of the X-ray sources in the infrared, near-infrared, optical, and ultraviolet (plus spectroscopic redshift when available); and (iii) a catalogue of spectroscopic redshifts recently obtained in the southern XXL area. We also present the basic properties of the X-ray point sources and their counterparts. Other catalogues described in the second series of XXL papers will be released contextually, and will constitute the second XXL data release.
Key Words.:
surveys – X-rays: general – catalogs –1 Introduction
The XXL Survey is an X-ray survey carried out by the XMM-Newton satellite, covering two 25 deg2 areas called XXL-N and XXL-S, complemented by observations at multiple wavelengths. Initial results from the survey were published in a dedicated issue of Astronomy & Astrophysics (volume 592). For the scientific motivations of the survey, the characteristics of the observing programme, and the multiwavelength follow-up programmes, refer to Pierre et al. (2016, hereafter XXL Paper I).
The first XXL data release (hereafter DR1), which is associated with the first series of papers, included the catalogue of the 100 brightest galaxy clusters, published in Pacaud et al. (2016, hereafter XXL Paper II), and the catalogue of the 1000 brightest point-like sources, published in Fotopoulou et al. (2016, hereafter XXL Paper VI). A second release (DR2) will occur jointly with the publication of the present paper. A list of the contents of DR1 and DR2 (inclusive of references) is tabulated in section 4.
We present here the catalogue of all the sources used for DR1 and DR2, from which the above DR1 catalogues were drawn (as well as a recent study on the environment and clustering of AGN, Melnyk et al. 2018, also known as XXL Paper XXI). After DR2, the XXL collaboration plans to reprocess the data with an improved pipeline, described in Faccioli et al. (2018, hereafter XXL Paper XXIV).
The plan of the paper is as follows. Section 2 presents the X-ray data, the X-ray processing pipeline (2.1), and basic properties such as sky coverage, , and flux distribution (2.2). Section 3 presents the multiwavelength data, describes the counterpart association (3.2), provides some statistics (3.4), presents the spectroscopic redshifts (3.5), and describes the additional spectra obtained with the AAOmega spectrograph in 2016 (3.6), supplementing those published in Lidman et al. (2016, hereafter XXL Paper XIV). Section 4 presents the Master Catalogue database site, the X-ray catalogue tables (4.1) with associated data products (4.2), and the multi- catalogue tables (4.3) with associated data products (4.5). Section 5 summarises the work. Appendix A compares the present catalogue with the previous XMM-LSS catalogue (Chiappetti et al., 2013).
2 X-ray material
The X-ray (XMM-Newton) observations of the XXL survey were obtained over several years in two sky regions as a collection of uniformly spaced contiguous pointings with an exposure time of at least 10 ks (complemented by a few GO pointings from the archives, and by pointings from earlier surveys, sometimes deeper). The list of the 622 XMM pointings (294 in the northern area at , hereafter XXL-N; and 328 in the southern area at , hereafter XXL-S) is given in Appendix B of XXL Paper I (which also provides details on the observing strategy), and is available at the Centre de Données astronomiques de Strasbourg (CDS) and in our database (see section 4 and Appendix B).
2.1 The X-ray pipeline
We use version 3.3.2 of the Xamin X-ray pipeline Pacaud et al. (2006) to process the XMM X-ray data. Earlier versions of the pipeline were used to process data for the production of the XMM-LSS survey catalogues, which can be considered the precursors of the present catalogue on a smaller area (see Table 1). For this reason we prefix all sources in the current catalogue with 3XLSS.
With respect to the newer pipeline reference paper, (XXL Paper XXIV), all catalogues produced to date, including the present one, use pipeline versions collectively grouped as the basic version called XAminP06 in paper XXIV; in other words, detections are done on each pointing separately.
Version 3.3.2 of the pipeline differs from earlier versions in relatively minor details, including an optimisation of the code for the detection of point sources, especially bright ones, with a fix for some numeric problems. They will be retained in the newer XAminF18 pipeline presented in XXL Paper XXIV.
As described in section 2.1 of XXL Paper XXIV, the basic pipeline starts from event lists filtered for soft proton flares, produced by standard sas tasks, to generate wavelet images and ends with a sextractor source list. Xamin characterises the sources with a maximum likelihood fit with both a pointlike and an extended (-profile) model, and provides a fits file for each pointing with basic parameters separately for the soft [0.5-2] keV, or B, band and for the hard [2-10] keV, or CD, band.
The parameters produced by Xamin (which can be summarised as exposure times, statistics, raw source positions, source and background counts, and source count rates) are listed in detail in Table 1 of XXL Paper XXIV and Table 2 of Pacaud et al. (2006), and are flagged in Col. 4 (‘X’) of Tables 9 and 10 of this paper. Other parameters are computed a posteriori during database ingestion on individual bands, as in Chiappetti et al. (2013). These parameters include the following:
-
•
The application of the C1/C2 recipe to classify extended sources (Pacaud et al., 2006), which are characterised by
the C1 recipe for a sample of clusters uncontaminated by point-like sources,
ext 5″and ext_stat 33 and ext_det_stat 32, and
the C2 recipe for clusters allowing a 50% contamination by misclassified point sources,
ext 5″and ext_stat 15;Although validated extensively only for the soft band, the recipe is nominally applied also to the hard band. A detection that satisfies either C1 or C2 in a band is flagged extended in that band (and by definition not spurious). The source extent, ext, the so-called detection likelihoods111 The detection statistic used by Xamin, although customarily but improperly referred to as likelihood, is a modified Cash statistic, and the extension statistic ext_stat is function of the difference of the detection statistics as pointlike and as extended. The detection statistic is a linear function of the logarithm of the true likelihood. The formulae used for computation are reported in section 2.3.1 of Pacaud et al. (2006). , ext_det_stat (fit as extended) and ext_pnt_stat (fit as pointlike), and the likelihood of being extended, ext_stat, are Xamin parameters for which we follow the notation used in XXL Paper XXIV. The correspondence to database column names is reported in Table 9.
-
•
The application of the P1 recipe, which aims to define a sample of point sources with a high degree of purity and which is complete down to the lowest count rate possible (XXL Paper XXIV), used for the first time in the 3XLSS catalogue, characterised by
pnt_det_stat 30 and (ext 3″or ext_stat=0).Stricly speaking, the sources which are not C1, C2, or P1 are to be considered undefined (i.e. there are not enough photons to unambiguously characterise them). The undefined sources are flagged as pointlike in the database. Those with pnt_det_stat 15 are considered spurious in the band (i.e. not considered for inclusion in the catalogue).
-
•
Flux conversion. A conventional mean flux in both bands is computed from count rates via the usual conversion factors CF listed in Table 2 with a fixed spectral model (, N cm-2).
-
•
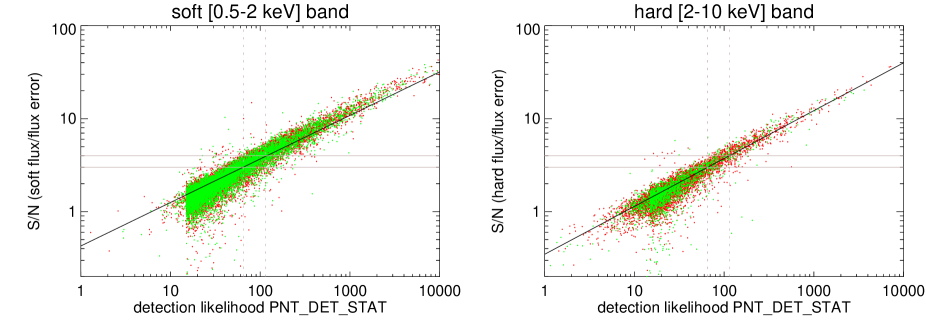
Error computation. Xamin currently does not provide errors on count rates, fluxes, or position. A positional error is computed as a function of count rate and off-axis angle (e.g. Table 4 of Chiappetti et al. 2013). Flux errors are computed by calculating the Poissonian error on gross counts222 Gross counts are reconstructed by adding net counts and background counts in the extraction area, which are parameters produced by Xamin. The Gehrels formula on gross counts was used, e.g. in XMDS (Chiappetti et al., 2005) and HELLAS2XMM (Baldi et al., 2002). according to the formula of Gehrels (1986), assuming that the fractional error on rates is the same as that on counts, and propagating them through the CF formula. In Fig. 3 we compare the S/N using the computed flux errors to the Xamin detection statistic. The customary and levels seem to occur for likelihood levels 65 and 115, higher than those found in the comparison of Xamin 3.2 with the XMDS pipeline given in Chiappetti et al. (2013), which only deals with some of the longest exposures in XXL, and uses a different analysis software.
Additional steps are performed after the ingestion of the band tables in the database for the preparation of the catalogues. These steps are described next.
| EPIC camera | soft (B) band | hard (CD) band |
|---|---|---|
| MOS | 5.0 | 23.0 |
| pn | 1.5 | 7.9 |
2.1.1 Band merging
Band merging of detections in the soft and hard bands
occurs in a 10 arcsec radius
following the
procedure used for
XMM-LSS and described in detail in Chiappetti et al. (2013).
A merged source can be classified
(using a two-letter code, P for pointlike, E for extended,
- for undetected, respectively in the soft and hard bands)
as
extended (and by definition non-spurious) if it is
extended in both
bands (EE) or in the single one where
it
is detected (E- and -E),
or
if it is extended in the soft band (EP).
It is classified as pointlike in all the other cases (PP, P-, -P, and
PE).
Band merging acts on all detections in all pointings, including those
considered as spurious
(i.e. detection statistic
det_stat15 in both bands),
which
are not included
in the released catalogue. We have
26 555 merged detections in XXL-N, of which 17 398
are
non-spurious.
The respective numbers for XXL-S are
27 173 and 18 145.
A band-merged detection in two bands
that
is spurious in one band (flagged by
the boolean flags
Bspurious=1 or CDspurious=1)
still
provides some
usable information
(rate, flux, etc.) and is
retained
in the catalogue.
For detections in two bands,
the band in which the detection likelihood of the source is
the highest
is the band from which the coordinates are taken.
If we compare the
separation
between B and CD positions
(column Xmaxdist in the database)
with the positional uncertainties in the two bands added in quadrature ()
we
find
that
Xmaxdist in 33% of the cases, within in 71%
of the cases
and within in 77%,
which looks reasonable.
It is possible to have an ambiguous band merging
case
when a detection
in a band happens to be associated with two different objects in the
other band (i.e. it gives rise to two entries in the merged table).
If the two entries both have Xmaxdist or
Xmaxdist, they are
both retained
as intrinsically ambiguous.
If one is below 6″and one above, the lower-distance entry remains a
merged two-band detection, while the other is ‘divorced’ as a hard-only or
soft-only source.
The naming of ambiguous sources is described in section 4.1.
The number of
such
ambiguous
cases in the final catalogue (i.e.
after the next step of overlap handling) is very limited:
74
out of
14 168
sources
in XXL-N
and 69
out of
11 888
sources
in XXL-S, i.e. approximately 0.5% of the total.
For comparison, 0.7% of the sources in the 2XLSS catalogue (Chiappetti et al., 2013)
were ambiguous.
2.1.2 Pointing overlap removal
Accounting for duplicate detections in pointing overlap regions (‘overlap removal’) is the final stage of catalogue generation. Consistently with the selection criteria defined in Pacaud et al. (2006), aimed at the best balance between contamination and completeness, and already used in Pierre et al. (2007) and Chiappetti et al. (2013), detections with det_stat15 are discarded at this stage and only non-spurious sources are brought forward as catalogue sources (for an object to be kept a non-spurious detection in one band is sufficient).
Detections occurring in a single pointing are always kept irrespective of the pointing quality; instead, in all cases where two or more detections occur within 10″ of one another in different pointings, the same procedure used for XMM-LSS and described in Chiappetti et al. (2013) is applied, i.e. if one detection is in a pointing with a better bad-field flag (column Xbadfield in the database), then it is kept in preference to any other. Otherwise if Xbadfield is the same, the source closest to the XMM pointing centre (columns Boffaxis and CDoffaxis in the database) is kept. There is, however, a difference with the XMM-LSS case: Xbadfield is not a boolean flag, but can have a range of values:
-
•
0 : pointing belongs to XXL, has good quality, and is the single or best pointing of a sequence of repeats;
-
•
1 : pointing does not belong to XXL (archival or deep followup pointing) and has good quality;
-
•
2 : another XXL pointing in a sequence of repeated pointings (see below) that has good quality;
-
•
3 : quality is bad (which may occur if the exposure is too shallow, or background is too high, or both).
We note that 94% of the sources have Xbadfield=0 and only 2% have Xbadfield=3.
One should remember that a given pointing might have been re-observed (repeats) if previous observation(s) did not achieve the scheduled exposure. Repeats are characterised by a XFieldName of the form XXLsmmm-ppc with a different letter c=a,b,c,… in the rightmost position. In some cases it has been possible to combine the event files of repeats (called z-pointings because the last letter in the XFieldName is conventionally z, e.g. XXLn000-04z): z-pointings are by definition considered superior to the individual repeats in the sequence.
2.1.3 Astrometric correction
Following the procedure used for XMM-LSS, an astrometric correction was applied to all sources using the sas task eposcorr, applying to all positions in a pointing a global rigid shift (no rotation was applied). The offsets were computed using reference optical catalogues. For XXL-N the CFHT Legacy Survey T007 version from Vizier (catalogue II/317, Hudelot et al., 2012) was used, except for one pointing where the USNO A2.0 catalogue was used and 16 pointings for which no correction could be computed (bad pointings, with few X-ray detections, which are usually ignored by the overlap removal procedure in favour of better repeats of the same pointing). For XXL-S the reference catalogue was from the Blanco Cosmology Survey (BCS, Menanteau et al., 2009), except for 11 pointings for which no correction could be computed for the same reasons noted above. The offsets per pointing, available in web pages reachable from the ‘table help pages’ in the database, have been added as new columns in the pointing list table, already published in XXL Paper I; the updated table is presented in Appendix B.
2.2 Basic properties
Table 3 provides the number of pointlike and extended sources in the catalogue, split by the C1, C2, and P1 recipes described above.
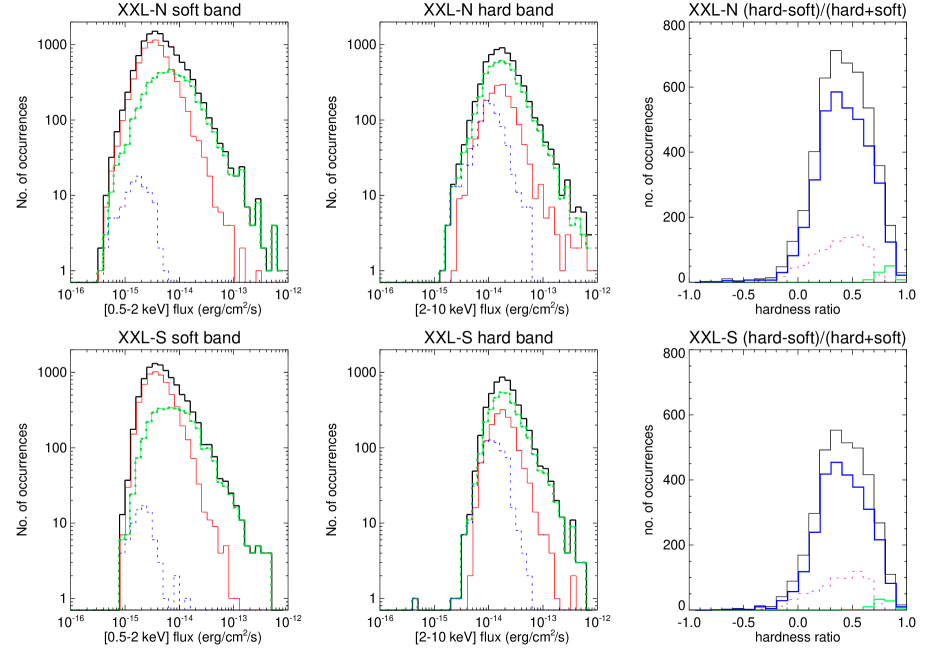
In Fig. 2 we show the X-ray flux distributions for both the soft and hard bands, and the hardness ratio (customarily defined as [hard-soft]/[hard+soft]) distribution (for sources detected in both bands) for XXL-N and XXL-S.
The relationship between flux and detection statistic pnt_det_stat was reported in Fig. 4 of XXL Paper I. Therefore, we felt it unnecessary to repeat the information here.
| N. of sources | XXL-N | XXL-S |
|---|---|---|
| total | 14 168 | 11 888 |
| pointlike | 13 770 | 11 413 |
| …and P1 | 7 246 | 5 565 |
| PP (detected in 2 bands) | 4 597 | 3 479 |
| …and P1 | 3 917 | 2 907 |
| PE (detected in 2 bands) | 14 | 21 |
| …and P1 | 10 | 19 |
| P- (only soft) | 7 389 | 6 247 |
| …and P1 | 3 085 | 2 451 |
| -P (only hard) | 1 770 | 1 666 |
| …and P1 | 234 | 188 |
| extended for Xamin | 398 | 475 |
| soft C1 (Bc1c2=1 in database) | 136 | 118 |
| soft C2 (Bc1c2=2 in database) | 188 | 208 |
| hard-only C1 or C2 (-E) | 74 | 149 |
| XLSSC clustersa𝑎aa𝑎a All of these are present in the 365 cluster catalogue of XXL Paper XX, but two southern objects (XLSSC 613 and 630) flagged ‘tentative’; 17 clusters from XXL Paper XX (all but one in Table G.1 of such paper) are not listed in our pointlike catalogues because the original X-ray detection was flagged point-like and spurious; 22 clusters in Table G.2 of XXL Paper XX have no XLSSC number assigned, but could be matched to our pointlike catalogues using the Xcatname database column. | 186 | 142 |

The cross-calibration of the S/N using the computed flux errors versus the Xamin detection statistic has been reported above in Fig. 3.
The photometric accuracy of the present pipeline is presented in Fig. 4 of Chiappetti et al. (2013), to which we refer the reader since it is unaffected by the changes in the pipeline version.
2.2.1 Sky coverage
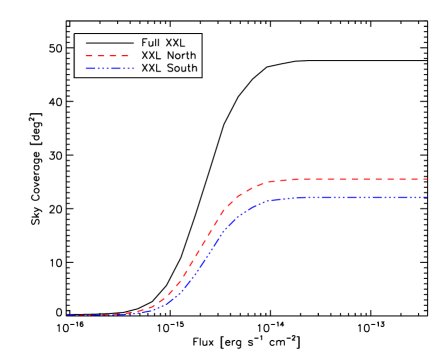
The sky coverage for XXL-N and XXL-S is shown in Fig. 3. Removing bad fields, i.e. keeping only (Xbadfield), the sky coverage is 95% of that shown. The process of removing duplicates keeps sources in 273 northern and 321 southern pointings, of which respectively 242 and 288 are good. However, since the removal operates on individual sources, 98% of the catalogue entries are in good pointings (only 313 XXL-N and 261 XXL-S sources are in bad pointings ).
The 90% of the coverage is achieved for a flux of 5.8 erg s-1 cm-2 in the soft band, and of 3.8 erg s-1 cm-2 in the hard band.
2.2.2 Source counts
The relation has been calculated (in the two energy bands) as described in Elyiv et al. (2012), taking into account the numerically calculated probabilities to detect sources with a certain flux, an off-axis distance in a pointing with effective exposure, and a particle background level. The sources in the overlaps between pointings were taken into account according to the Voronoi tessellation technique described in detail in Elyiv et al. (2012), and only good pointings with exposures below 15 ks were considered in order to have uniformity of coverage. It is shown in Fig. 4 for the entire survey; the curves calculated separately for the XXL-N and XXL-S areas are extremely similar, which indicates no effect of cosmic variance.
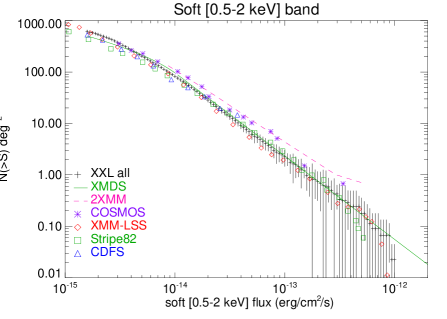
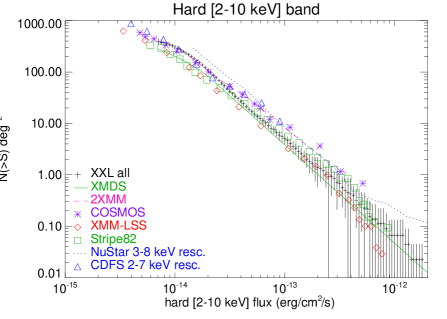
We plot representative data from the literature. We show the XMM-LSS data (which are a subset of XXL-N analysed with a previous version of our pipeline, compare Table 1 and Appendix A) reported by Elyiv et al. (2012), plotted as red diamonds. We also plot earlier data shown in the latter paper: a green solid line for the fit from XMDS (a subset of XMM-LSS analysed with a different pipeline, Chiappetti et al., 2005), and results from two independent surveys, COSMOS (violet star data points, Cappelluti et al., 2007) and 2XMM (magenta dashed line, Ebrero et al., 2009). Among the more recent publications we show data from NuSTAR (blue dotted line, for the hard band only, rescaled from 3-8 keV, Harrison et al., 2016), Stripe82 (observed by XMM, green squares, LaMassa et al., 2016), and Chandra CDFS 7Ms (blue triangles, Luo et al., 2017). The hard-band points for CDFS were rescaled555 Band rescaling entails shifting the flux to the right, multiplying by a factor equal to the ratio of the flux in the 2-10 keV band to the flux in the original band, computed for an unabsorbed power law with , consistently with the CFs in Table 2. from 2-7 keV. Our is consistent with the result of earlier surveys, with COSMOS being the most deviant. The slight difference with Elyiv et al. (2012) in the hard band could be due to the different pipeline version or to the lower average exposure of the entire XXL versus the XMM-LSS pointings.
3 Multiwavelength material
For the purpose of identifying the X-ray detections at other wavelengths, we use optical, near-IR (NIR), IR, and UV photometric data as described in Tables 3 and 4 of XXL Paper VI, to which the reader is referred in particular for details about the limiting magnitudes in the various bands, and for the data archives used. In total, there are eight surveys covering XXL-N and six surveys covering XXL-S in various filters, as summarised in Table 4 and in Sect. 3.1.
Rather than using publicly available catalogues, we performed our own homogeneous photometric extraction per filter and per tile, handling tile overlaps. All magnitudes for all surveys are in the AB system, corrected to 3″ aperture magnitudes, and corrected for galactic extinction as described in XXL Paper VI.
The full photometric catalogues, including the photometric redshift computed as described in XXL Paper VI, and all sources (not just the counterparts of the X-ray sources) will be published in a forthcoming paper (Fotopoulou, in preparation).
The association of published spectroscopic redshifts with our counterparts is described in section 3.5, while more detail about the new AAOmega spectroscopic observations for which we publish the complete catalogue is given in section 3.6.
| North | |||
| Survey | sub-surveys | mnemonic | filters |
| SDSS | – | sdss | u g r i z |
| CFHT | D1 W1 WA WB WC | cfht | u g r i y z |
| VISTA | VHS VIDEO VIKING | vista | z Y J H K |
| UKIDSS | UDS DXS | ukidss | J H K |
| WIRcam | – | wircam | K |
| IRAC | – | irac | 36 45 |
| GALEX | DIS MIS AIS GI | galex | fuv nuv |
| WISE | – | wise | w1 w2 w3 w4 |
| South | |||
| Survey | sub-surveys | mnemonic | filters |
| BCS | – | bcs | g r i z |
| DECam | – | decam | g r i z |
| VISTA | VHS | vista | J H K |
| SSDF | – | irac | 36 45 |
| GALEX | MIS AIS GI | galex | fuv nuv |
| WISE | – | wise | w1 w2 w3 w4 |
3.1 Summary of photometric surveys
The XXL-N area is covered by the following surveys:
-
•
Most of XXL-N was covered by the CFHT Legacy Survey (CFHTLS) Wide1 (W1) and Deep1 (D1) fields in five filters (); we used the T0007 data release (Veillet, 2007; Hudelot et al., 2012). Observations were obtained with the 3.6m Canada-France-Hawaii Telescope (CFHT), using the MegaCam wide field optical imaging facility. The northernmost part was observed at CFHT in the bands (PI: M. Pierre) and the relevant fields are labelled WA, WB, WC in Table 4.
-
•
The Sloan Digital Sky Survey (SDSS) also provides shallower observations in the whole XXL-N area. We used the DR10 data release (Ahn et al., 2014).
-
•
XXL-N has been observed with the WIRcam camera on CFHT in the band (2.2 m), see Moutard et al. (2016).
-
•
The UKIRT Infrared Deep Sky Survey (UKIDSS, Dye et al. 2006) has two fields (in the J,H,K bands) targeted on the XMM-LSS area, enclosed in XXL-N: the Ultra Deep Survey (UDS), and the Deep Extragalactic Survey (DXS). We used the DR10 data release.
The XXL-S area is covered by the following surveys:
- •
- •
The following surveys cover both areas:
-
•
The Vista Hemisphere Survey (VHS, McMahon et al. 2013), using the Visible and Infrared Survey Telescope for Astronomy (VISTA) covered XXL-N and XXL-S in the J,H,K bands. Additional coverage of XXL-N is supplied by the VISTA Kilo-degree Infrared Galaxy Survey (VIKING, Edge et al. 2013) and VISTA Deep Extragalactic Observations Survey (VIDEO, Jarvis et al. 2013).
-
•
The Spitzer satellite has observed the large Spitzer South Pole Telescope Deep Field (SSDF), with its Infrared Array Camera (IRAC) in channel 1, 3.6m, and 2, 4.5m. This field fully covers XXL-S. See Ashby et al. (2014). Similar observations (PI: M. Bremer) were acquired over XXL-N.
-
•
The Wide-field Infrared Survey Explorer (WISE) mission observed the whole sky in four mid-IR (MIR) bands: W1=3.4m, W2=4.6m, W3=12m, W4=22m (Wright et al., 2010). We used the ALLWISE data release.
-
•
The GALEX satellite surveyed the entire sky (Morrissey et al., 2005) in two ultraviolet bands, 1344-1786 Å (far-UV, FUV) and 1771-2831 Å (near-UV, NUV), with various surveys: All-Sky Imaging Survey (AIS), Medium Imaging Survey (MIS), and guest investigator (GI) programmes in both XXL areas, and the Deep Imaging Survey (DIS) in XXL-N only.
3.2 Counterpart association
In order to associate X-ray sources with potential counterparts at other wavelengths, we first generated multiwavelength counterpart sets, matching the individual primary photometric catalogues (one per survey per band: 28 in XXL-N and 19 in XXL-S, see Table 4) among them (using a matching radius of 0.7″ for the optical and IR catalogues where the image PSF is small, and 2″ for GALEX, IRAC, and WISE) as described in XXL Paper VI. For the further association with X-ray sources, we also considered the case of counterparts in one single primary catalogue.
For the association of entire counterpart sets with the X-ray sources within a search radius of 10″, we use two estimators. In one case, we computed the simple probability of chance coincidence according to Downes et al. (1986) (done purely as a cross-check and for reference since it is what was used for the XLSS and 2XLSS catalogues):
| (1) |
In the other case, we used the more robust likelihood ratio estimator (Sutherland & Saunders, 1992), which has been used for other surveys, e.g. Brusa et al. (2007):
| (2) |
In both formulae, is the distance in arcsec between the X-ray position and the candidate counterpart position, the positional error is assumed for simplicity equal to 1″, while the dependency on the magnitude of the counterpart is either via the sky density (sources per square arcsec) of objects brighter than , or the sky density per magnitude bin . The term in Eq. 2 is defined as
| (3) |
where is the sky density of putative true counterparts, i.e. unique objects within a suitable radius (in our case 3″) of each X-ray source, and K is the ratio between the number of such putative counterparts and the total number of all (also non-unique) objects in the band close to the X-ray sources within the same radius, i.e. inclusive of background objects.
We computed these estimators for each survey and band where a potential counterpart is present, and assigned the best value (highest LR) to the counterpart set. We then ordered the counterpart sets by decreasing LR, and also divided them into three broad groups: good, fair, and bad according to , , using P as a cross-check.
We then assign a preliminary rank, rejecting most of the cases with bad scores. A primary single counterpart is either a physical solitary association, a single non-bad association, or exceptionally the best of the rejects, which is ‘recovered’. When several candidates above the thresholds exist, the one with best estimator is considered the primary counterpart, and all the others are secondaries. If the estimator ratio between the primary and the best secondary is above 10, the primary should be definitely preferred and the secondaries are just nominally included. Otherwise the primary is only nominally better than the secondaries, but it is indicative of an intrinsic ambiguity.
Finally, we tie everything together by comparing the ranks assigned by the different methods, cleaning up ambiguous counterpart sets sharing a counterpart in more than one survey, demoting to secondaries the detection in just the surveys with poorer position resolution (WISE, IRAC, GALEX) and promoting the cases with counterparts in several surveys.
We assign a final rank (numbers provided in Table 5) so that each X-ray source has a single primary counterpart, and zero, one, or more secondaries. Rejected counterparts will not be listed in the multiwavelength catalogues. The identification rank is coded by a three-character string. There will be always one primary counterpart with rank between 0 and 1, and there may be one or more secondary counterparts with rank above 2. The codes are as follows:
-
•
0.0 physically single counterpart within 10″ of the X-ray position;
-
•
0.1 logically single counterpart (all others were rejected);
-
•
0.2 ‘recovered’ (the single counterpart has bad estimators);
-
•
0.4 ‘blank field’ (no catalogued counterpart within 10″ of the X-ray position;
-
•
0.9 the primary counterpart is much better than all the secondaries (ranked 2.2);
-
•
1.0 the primary counterpart is just marginally better than one of the secondaries;
-
•
2.1 this secondary counterpart is just marginally worse than the corresponding rank 1.0 primary;
-
•
2.2 any other secondary counterpart.
Ranks below 0.2 correspond to single primaries; a rank of 0.9 corresponds to a preferred primary which is better than all its secondaries; a rank of 1 to a nominal primary which is only marginally better than one of the secondaries.
3.3 Bright star clean-up
We have associated our counterparts with sources in the SIMBAD and NED databases, and are providing an identifier for the relevant cases. We used this information as one way of partially screening out stars, which are not of interest for AGN studies. We also used the USNO A2.0 catalogue to screen stars, as well as our own spectroscopic redshifts, described in section 3.5.
We assign a star flag of 1 to the counterparts with , i.e. stars confirmed spectroscopically, a flag of 2 to objects that look like a star upon visual inspection, and a flag of 3 when both conditions occur. Visual inspection of thumbnail optical images (see section 4.5) was done systematically for all counterparts with a match to a source in a known star catalogue in SIMBAD or NED. We also added objects in other catalogues (like 2MASS) which were inspected visually and found to be star-like. We also systematically inspected the counterparts with a match in USNO A2.0 with a magnitude brighter than (usually all the unnamed objects, i.e. not otherwise in SIMBAD or NED, are stars and the rest are galaxies).
Of the 14 168 primary counterparts in XXL-N we find 163 ‘spectroscopic’ stars, and visually identify 177 more; 23 were flagged as stars by both methods. In XXL-S, the corresponding numbers are 384, 174, and 7. We note that this screening is not at all complete.
3.4 Statistics
Table 5 lists the number of counterparts sorted by rank. For 60% of the cases (rank) there is a single counterpart or a counterpart that is clearly preferred. In the remainder of the cases there is some ambiguity in the identity of the real counterpart.
The number of X-ray sources that have no apparent catalogued counterpart at all (‘blank fields’) is very small: 18 in XXL-N and 21 in XXL-S. Not all blank fields are really empty (11 in XXL-N and 4 in XXL-S), as they might have been affected by contamination from a nearby source which prevents a detection, or the potential counterpart could actually be a bright source that went undetected by the photometric extraction.
To be conservative, one could exclude the rank of 0.2 counterparts (i.e. those where there is a single object near to the X-ray source but with bad association estimators).
| Rank | explanation | XXL-N | XXL-S |
|---|---|---|---|
| all | distinct X-ray sources | 14 168 | 11 888 |
| Primary counterparts | |||
| 0.0 | physically single | 77 | 57 |
| 0.1 | logically single | 3 462 | 2 789 |
| 0.2 | “recovered” bad | 764 | 468 |
| 0.4 | “blank field” | 18 | 21 |
| 0.9 | definite primary | 4 138 | 3 768 |
| 1.0 | marginal primary | 5 709 | 4 785 |
| Secondaries | |||
| 2.1 | marginal secondary | 5 709 | 4 785 |
| 2.2 | any other secondary | 11 708 | 10 850 |
In XXL-N about 67% of the counterparts are observed in at least four surveys; 89% of the primaries have a CFHT counterpart in some band; 77% have IRAC; 70% have a VISTA, WIRcam, or WISE detection; 39% have GALEX; and 28% have a UKIDSS counterpart.
In XXL-S about 61% of the counterparts are observed in at least four surveys; 90% of the primaries have a DECam counterpart; 80% a BCS counterpart; 78% have IRAC; 63% VISTA; 44% WISE; and 26% have a GALEX counterpart.
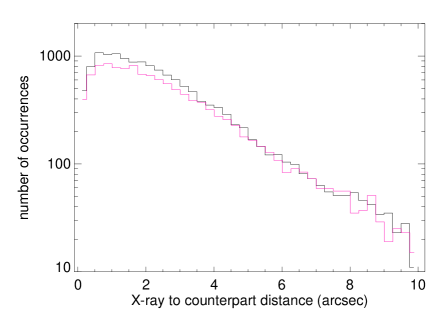
For each X-ray source primary counterpart, we compute the distance between the astrometrically corrected X-ray position and the counterpart in the survey that is nearest. A histogram of these distances is shown in Fig. 5.
In XXL-N (XXL-S) 85% (81%) of all primary counterparts are within 4″. This occurs for 94% (93%) of the best single primaries (ranks 0.0 and 0.1) or for 91% (91%) for the bona fide primaries (ranks 0.0, 0.1, and 0.9). Larger distances occur for the marginal primaries (rank 1.0), with 74% (69%) within 4″, or for the ‘bad singles’ (rank 0.4) with 57% (54%).
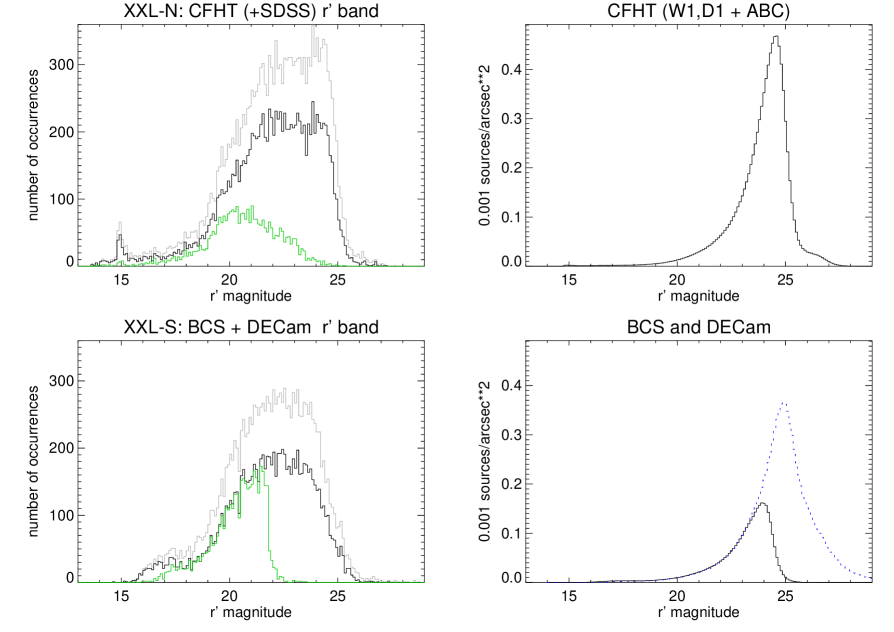
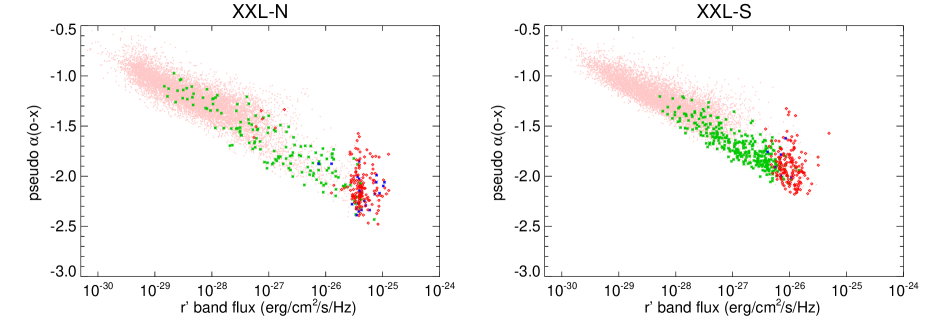
In the left column of Fig. 6 we plot, as an example, the distribution of the magnitude of the counterparts in the filter (the other filters are similar) in XXL-N and XXL-S. This is compared with the overall source density (used in section 3.2) from the corresponding surveys, shown in the right column of the same figure. We note that the spectroscopic coverage (green curves) has a sharper cut-off in XXL-S (and is more regular under the cut-off), where the data is mainly based on pointed observations around our X-ray targets (see section 3.6), while in XXL-N the spectroscopic data comes from a variety of observations (see section 3.5).
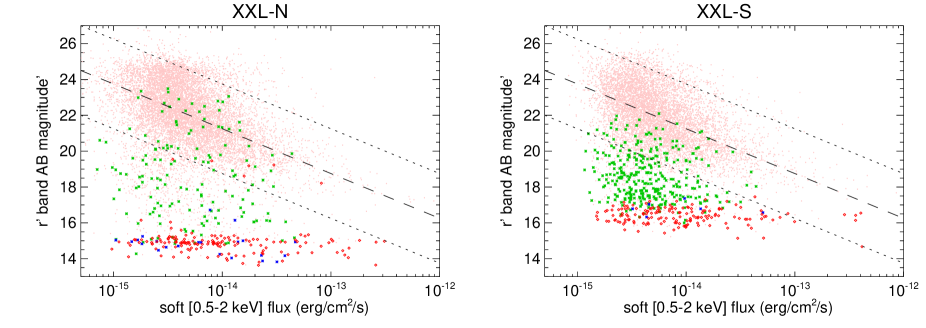
In order to compare the X-ray and optical fluxes, in Fig. 7 we plot the magnitude versus the soft (B) broad-band flux. In absence of a systematic X-ray spectral fit or SED analysis (currently available only for the 1000 brightest sources, see XXL Paper VI), we prefer to show raw parameters. The optical magnitude is taken from any available catalogue (i.e. CFHT and SDSS in XXL-N, and BCS and DECam in XXL-S), preferring CFHT or BCS when two measurements are present for a given counterpart. The different coverage characteristics of the various surveys is apparent from the plots. With reference to the star flag described in section 3.3, we see that the stars identified spectroscopically (flag=1, green asterisks in the figure) cover the entire space, while those identified visually (flag=2, red diamonds in the figure) are usually concentrated at the brighter magnitudes. In XXL-N there are six exceptions with : four of them are in the PB faint blue star catalogue (Berger & Fringant, 1984), one is in USNO A2.0, and one is LP 649-93. The last has a definite star-like appearance, the others are unconspicuous, and two of them are reported by SIMBAD as possible quasars. This gives an idea of the limited contamination of the method used in section 3.3.
3.5 Associating redshifts with the counterparts
For the X-ray sources whose counterparts have spectroscopic observations, we report the redshift . The redshifts may come from large spectroscopic surveys with which we have collaborative agreements, like VIPERS (Guzzo et al., 2014) or GAMA (Liske et al., 2015; Baldry et al., 2017) in the XXL-N area; or, in XXL-S, from large campaigns of our own (see XXL Paper XIV and section 3.6); or from the compilation held in Marseille at CESAM666http://cesam.oamp.fr/xmm-lss/, which includes both published data of external origin and smaller campaigns by XXL PIs. The origins are briefly listed in the footnote to Table 11; a full list with references is provided in Table 2 of Guglielmo et al. (2018), hereafter XXL Paper XXII. More details about the collection and reduction of spectroscopic information at CESAM is provided in section 3 of Adami et al. (2018), hereafter XXL Paper XX. For the case where the same counterpart has more than one redshift measurement, the procedure described in XXL Paper XXII is adopted. Namely, it first groups the originating surveys by priority into three classes, and inside the same priority group it takes the spectrum with the best quality flag, dividing the survey-provided redshift flags into four uniform classes.
In XXL-N we actually used the very same sample used in XXL Paper XXII, to which we re-added the stars () excluded there, and applied exactly the same quality choice. For XXL-S we once more applied an analogous recipe: the highest origin flag was assigned to the recent AAOmega campaign (section 3.6), then to the previous one from XXL Paper XIV, then to the other campaigns in the CESAM compilation, and finally to NED; the quality flags are identical to the ones in XXL Paper XXII, to which we refer for a complete description, except for the ‘star’ flag 6 listed in section 3.6.4, ignored in XXL Paper XXII, but considered equivalent to the ‘best’ flag 4.
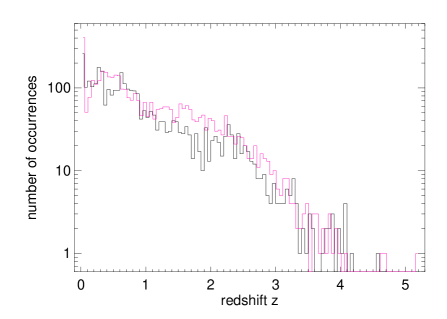
Finally we associated the spectroscopic targets with our optical and NIR photometric potential counterparts within 1″. In XXL-N we dealt with a total of 5521 redshifts, of which 3235 refer to primary counterparts, 1098 to secondaries, and 1188 to rejected candidates. In XXL-S, excluding 540 sources observed with no valid redshift, we have a total of 4745 redshifts (3873 primary counterparts, 661 secondaries and 211 rejects). Figure 9 gives the redshift distribution of the primary counterparts.
In XXL-N 33% of the redshifts of primary counterparts derive from GAMA, 30% from VIPERS, 14% from SDSS DR10, and the rest from miscellaneous origins. In XXL-S 60% of the redshifts come from XXL Paper XIV, 38% from our own 2016 observations described in the next section, and only a handful from other origins.
3.6 The 2016 AAOmega spectra
In XXL Paper XIV, we noted that we used the AAOmega spectrograph (Smith et al., 2004) in conjunction with the two-degree field (2dF) fibre positioner on the AAT (Lewis et al., 2002) to measure the redshifts of 3660 sources in the XXL-S field. Here we report on new observations with the same instrument.
3.6.1 Target selection
The targets were split into several categories, as explained below. There were two categories for AGN, one for radio galaxies, three for cluster galaxies, one for field galaxies, and one for objects of special interest (e.g. gravitational lenses and fossil groups). The highest priority was for AGN, the next highest for radio sources, followed by cluster galaxies and field galaxies.
The AGN were selected from our X-ray source list, targeting only objects brighter than . Obvious bright stars were removed by excluding objects that were 3″ from a bright star in the UCAC4 catalogue. There were two categories of AGN, those detected in the BCS survey, and all the rest.
The radio sources were selected from the ATCA 2.1 GHz survey of the XXL-S (Butler et al., 2018), hereafter XXL Paper XVIII. Only radio sources brighter than (equivalent to ) were targeted, with a maximum of 120 radio sources per 2dF pointing.
Candidate cluster galaxies were selected according to their position and magnitude. For a given cluster, a galaxy was selected if it was within 1 Mpc of the cluster centre and had an r-band magnitude within the range , where is the r-band magnitude of an galaxy at the redshift of the cluster. Only cluster galaxy candidates brighter than were targeted. There were three categories of clusters. Clusters that lacked spectroscopic confirmation had the highest priority. For these clusters, we used photometric redshift to estimate and the angular distance corresponding to 1Mpc. Next came clusters that were spectroscopically confirmed, followed by clusters that were optically identified. We also assigned 17 fibres to candidate fossil group members, as part of the search for fossil groups described in XXL Paper XX; 13 of them had redshifts with quality flags above 3, as defined in section 3.6.4. Of these, two were found to be stars.
Finally, randomly selected field galaxies brighter than were chosen to ensure that all fibres could be used. Incidentally, we note that one fibre was placed at the centre of a gravitational lens independently rediscovered by one of the co-authors (GW) upon visual inspection of DECam images, but already known as ‘the Elliot Arc’ (Buckley-Geer et al., 2011). This is ‘a z = 0.9057 galaxy that is being strongly lensed by a massive galaxy cluster at a redshift of z=0.3838’. The lens is listed in our redshift catalogue as XXL-AAOmega J235138.01-545254.2 at z=0.379. The cluster is SCSO J235138-545253 (Menanteau et al., 2010). Unfortunately, its position is in one of the outermost XXL pointings, XXLs053-08; moreover, because it was at 15′ from its centre, it was not processed by Xamin, which stops at 13′, even though extended emission is visible in the X-ray image.
3.6.2 Observations
We observed 3572 targets in the XXL-S footprint during two observing runs in 2016 (see Table 6).
| August 23 to August 28 | six half nights |
| September 24 to September 27 | four half nights |
The fields in XXL-S were first targeted with 2dF in 2013 (XXL Paper XIV). On that occasion, the footprint of XXL-S was covered with 13 2dF pointings. This time, we found a better optimised solution that required one fewer pointing.
The set-up of AAOmega was almost identical to the set-up used in XXL Paper XIV, so we refer the reader to that paper for details. We adjusted the central wavelength of the blue grating 2 nm further to the red (482 nm). This allowed more overlap between the red and blue arms of AAOmega. The amount of overlap between the two channels varies with fibre number, and is typically 5 nm. The spectra start and end at 370 nm and 890 nm, respectively, with a spectral resolution of about 1500.
Science exposures lasted 40 minutes, and two of these were taken consecutively in an observing sequence. Prior to each sequence, an arc frame and two fibre flats were taken. The arc frame is used to calibrate the wavelength scale of the spectra and the fibre flats are used to determine the locations of the spectra on the CCD (called the tramline map), to remove the relative wavelength dependent transmission of the fibres (absolute normalisation is done using night sky lines), and to determine the fibre profile for later use in extracting the spectra from the science frames.
We also took dome flats. These were taken once for each plate at the beginning of each of the runs, and were used in combination with the fibre flats to determine the wavelength and fibre dependent transmission of the fibres.
| Quality | AGN | Radio | Cluster | Field | Total |
| flag | Galaxies | Galaxies | Galaxies | ||
| 6 | 201 | 11 | 8 | 51 | |
| 4 | 891 | 749 | 305 | 63 | |
| 3 | 328 | 132 | 41 | 20 | |
| 2 | 178 | 83 | 42 | 22 | |
| 1 | 251 | 71 | 65 | 42 | |
| Targeted | 1849 | 1046 | 461 | 198 | 3572 |
| Obtained | 1420 | 892 | 354 | 134 | 2813 |
| Table name | CDS | Description | Ref. |
| DR2 | |||
| xxlpointings | IX/52/xxlpoint | list of pointings and astrometric offsets | 4 |
| 3XLSS | IX/52/3xlss | band merged X-ray catalogue | 1 |
| 3XLSSB | — | soft band X-ray catalogue | 1 |
| 3XLSSCD | — | hard band X-ray catalogue | 1 |
| 3XLSSOPTN | IX/52/3xlsoptn | multiwavelength catalogue for XXL-N | 2 |
| 3XLSSOPTS | IX/52/3xlsopts | multiwavelength catalogue for XXL-S | 2 |
| XXL_AAOmega_16 | IX/52/xxlaaoz | AAOmega redshifts | 3 |
| XXL_365_GC | IX/52/xxl365gc | 365 brightest clusters | 10 |
| XXL_ATCA_16_comp | IX/52/atcacomp | final ATCA 2.1GHz radio catalogue (components) | 11 |
| XXL_ATCA_16_src | IX/52/atcasrc | final ATCA 2.1GHz radio catalogue (sources) | 11 |
| XXL_ATCA_16_ctpt | IX/52/atcactpt | optical-NIR counterparts of ATCA 2.1GHz radio sources | 14 |
| XXL_GMRT_17 | IX/52/xxl_gmrt | GMRT 610MHz radio catalogue | 12 |
| – | IX/52/xxlngal | XXL-N spectrophotometric galaxy sample | 13 |
| – | IX/52/xxlnbcg | XXL-N Bright Cluster Galaxies sample | 15 |
| DR1 | |||
| xxlpointings | IX/49/xxlpoint | list of pointings | 4 |
| XXL_100_GC | IX/49/xxl100gc | 100 brightest clusters | 5 |
| XXL_1000_AGN | IX/49/xxl1000a | 1000 brightest pointlike | 6 |
| XXL_VLA_15 | IX/49/xxl_vla | VLA 3Ghz radio catalogue | 7 |
| XXL_ATCA_15 | IX/49/xxl_atca | pilot ATCA 2.1GHz radio catalogue | 8 |
| XXL_AAOmega_15 | IX/49/xxlaaoz | AAOmega redshifts | 9 |
(1) this paper, sect. 4.1; (2) this paper, sect. 4.3; (3) this paper, sect. 3.6 (supplements XXL_AAOmega_15); (4) the table originally reported in XXL Paper I has been incorporated in a new Table 12 in this paper adding astrometric offsets; (5) XXL Paper II; (6) XXL Paper VI; (7) Baran et al. (2016); XXL Paper IX; (8) Smolčić et al. (2016); XXL Paper XI; (9) XXL Paper XIV; (10) XXL Paper XX (supersedes XXL_100_GC); (11) XXL Paper XVIII (supersedes XXL_ATCA_15); (12) Smolčić et al. (2018); XXL Paper XXIX; (13) XXL Paper XXII; (14) Ciliegi et al. (2018); XXL Paper XVI; (15) Ricci et al. (2018); XXL Paper XXVIII;
3.6.3 Data processing
After each run, we processed the raw data with a customised version of 6.32 of the 2dfdr pipeline777http://www.aao.gov.au/science/instruments/AAOmega/reduction. Further details on the processing of the data can be found in XXL Paper XIV and Childress et al. (2017).
Once processed, we first spliced and then combined the data. Since some targets can appear in more than one field (because of field overlap) we summed all the data on a single target into one spectrum, weighting on the variance.
Redshifts were then measured (see Sect. 3.6.4), and all objects with secure redshifts were removed from the target catalogue before the second run. This maximised the observing efficiency.
3.6.4 Redshift estimates
We used marz (Hinton, 2016) to inspect each spectrum and to manually assign a redshift. For each spectrum, we assign a quality flag that varies from 1 to 6. The flags are identical to those used in the OzDES redshift survey (Yuan et al., 2015), and have the following meanings:
-
•
6 - a star;
-
•
4 - % probability that the redshift is correct;
-
•
3 - % probability that the redshift is correct;
-
•
2 - based on one or more very weak features;
-
•
1 - unknown.
Only objects with flag 3, 4, and 6 are listed in our catalogue. Flag 5 is an internal flag used by OzDES, and is not used here. The fraction of objects with flags set to 6, 4, or 3, or less than 3 were 0.08, 0.56, 0.15, and 0.21, respectively.
All redshifts are placed in the heliocentric reference frame. The typical redshift uncertainty for galaxies is . For AGN, it is .
Of the 1849 objects targeted from the AGN catalogue, 1420 have redshifts. The numbers for radio galaxies, cluster galaxies and field galaxies are listed in Table 7.
4 The XXL database
The catalogues and selected datasets of the XXL survey are publicly available in two ways:
-
•
Basic static catalogues are deposited at the CDS;
-
•
Complete queryable catalogues are available via the XXL Master Catalogue browser888http://cosmosdb.iasf-milano.inaf.it/XXL/, in a database, which allows one to select a subset of sources and to retrieve the associated data products, and provides online documentation and help files.
The list of database tables associated with the earlier DR1 release or released with the present paper or in other DR2 papers is given in Table 8.
| Column name/s | units | explanation | X | m | o | C |
|---|---|---|---|---|---|---|
| Bseq—CDseq | – | internal sequence number (unique) | ✓ | ✓ | ✓ | |
| Bcatname—CDcatname | – | IAU catalogue name 3XLSSx Jhhmmss.s-ddmmss, x=B or CD | ✓ | ✓ | ✓ | |
| Xseq | – | numeric pointer to merged entry see Table 10 | ✓ | ✓ | ✓ | |
| Xcatname | – | name pointer to merged entry see Table 10 | ✓ | ✓ | ✓ | |
| Xlsspointer | – | Xseq of corresponding source in 2XLSSd catalogue | ✓ | ✓ | ✓ | |
| XFieldName | – | XMM pointing name | ✓ | ✓ | ||
| Xbadfield | 0—1—2—3 | pointing quality from best (0) to worst (3) | ✓ | ✓ | ||
| expm1 | s | MOS1 camera exposure in the band | ✓ | |||
| expm2 | s | MOS2 camera exposure in the band | ✓ | |||
| exppn | s | pn camera exposure in the band | ✓ | |||
| gapm1 | ″ | MOS1 distance to nearest gap | ✓ | |||
| gapm2 | ″ | MOS2 distance to nearest gap | ✓ | |||
| gappn | ″ | pn distance to nearest gap | ✓ | |||
| Bnearest—CDnearest | ″ | distance to nearest detected neighbour | ✓ | ✓ | ||
| Bc1c2—CDc1c2 | 0—1—2 | 1 for class C1, 2 for C2, 0 for undefined | ✓ | ✓ | ✓ | |
| Bp1—CDp1 | 0—1 | application of the P1 recipea𝑎aa𝑎a Bp1 or CDp1 is set to 1 if the nominal application of the P1 recipe (see section 2.1) is successful in the soft or hard band, respectively. There is a limited number of sources (9 in XXL-N and 9 in XXL-S) band-merged as EP, i.e. extended in the soft and pointlike in the hard band, for which the P1 recipe is successful in the hard band. | ✓ | ✓ | ✓ | |
| Bcorerad—CDcorerad | ″ | core radius ext (for extended sources) | ✓ | ✓ | ✓ | |
| Bextlike—CDextlike | – | extension statistic ext_stat | ✓ | ✓ | ✓ | |
| Bdetlik_pnt—CDdetlik_pnt | – | detection statistic pnt_det_stat for point-like fit | ✓ | |||
| Bdetlik_ext—CDdetlik_ext | – | detection statistic ext_det_stat for extended fit | ✓ | |||
| Boffaxis—CDoffaxis | ′ | off-axis angle | ✓ | ✓ | ||
| Brawra_pnt—CDrawra_pnt | source RA (not astrometrically corrected) for point-like fit | ✓ | ||||
| Brawdec_pnt—CDrawdec_pnt | source Dec (not astrometrically corrected) for point-like fit | ✓ | ||||
| Brawra_ext—CDrawra_ext | source RA (not astrometrically corrected) for extended fit | ✓ | ||||
| Brawdec_ext—CDrawdec_ext | source Dec (not astrometrically corrected) for extended fit | ✓ | ||||
| Bra_pnt—CDra_pnt | source RA (astrometrically corrected) for point-like fit | |||||
| Bdec_pnt—CDdec_pnt | source Dec (astrometrically corrected) for point-like fit | |||||
| Bra_ext—CDra_ext | source RA (astrometrically corrected) for extended fit | |||||
| Bdec_ext—CDdec_ext | source Dec (astrometrically corrected) for extended fit | |||||
| Bposerr—CDposerr | ″ | error on coordinates per Table 4 of Chiappetti et al. (2013) | ✓ | ✓ | ||
| Bratemos_pnt—CDratemos_pnt | ct/s/detector | MOS count rate for point-like fit | ✓ | |||
| Bratepn_pnt—CDratepn_pnt | ct/s | pn count rate for point-like fit | ✓ | |||
| Bratemos_ext—CDratemos_ext | ct/s/detector | MOS count rate for extended fit | ✓ | |||
| Bratepn_ext—CDratepn_ext | ct/s | pn count rate for extended fit | ✓ | |||
| countmos_pnt | ct | MOS number of counts for point-like fit | ✓ | |||
| countpn_pnt | ct | pn number of counts for point-like fit | ✓ | |||
| countmos_ext | ct | MOS number of counts for extended fit | ✓ | |||
| countpn_ext | ct | pn number of counts for extended fit | ✓ | |||
| bkgmos_pnt | ct/pixel/detector | MOS local background for point-like fit | ✓ | |||
| bkgpn_pnt | ct/pixel | pn local background for point-like fit | ✓ | |||
| bkgmos_ext | ct/pixel/detector | MOS local background for extended fit | ✓ | |||
| bkgpn_ext | ct/pixel | pn local background for extended fit | ✓ | |||
| Bflux—CDflux | erg/cm2/s | source flux (undefined i.e. -1 for extended) | ✓ | ✓ | ||
| Bfluxerr—CDfluxerr | erg/cm2/s | error on source flux | ✓ | ✓ | ||
| Bfluxflag—CDfluxflag | 0—1—2 | 0 if MOS-pn difference , 1 btw. 20%-50%, 2 | ✓ | ✓ |
| Column name/s | units | explanation | X | m | o | C |
|---|---|---|---|---|---|---|
| Xseq | – | Internal sequence number (unique) | ✓ | ✓ | ✓ | |
| Xcatname | – | IAU catalogue name 3XLSS Jhhmmss.s-ddmmssc, see section 4.1 | ✓ | ✓ | ✓ | |
| Bspurious, CDspurious | 1|0 | set to 1 when soft/hard component has pnt_det_stat15 | ✓ | |||
| Bdetlike, CDdetlike | – | detection statistic det_stat (pnt or ext according to source class) | ✓ | ✓ | ✓ | |
| Xra | source RA (astrometr. corrected) (pnt or ext acc. to source class in best band) | ✓ | ✓ | ✓ | ||
| Xdec | source Dec (astrometr. corrected) (pnt or ext acc. to source class in best band) | ✓ | ✓ | ✓ | ||
| Bra, CDra | source RA (astrometr. corrected) (pnt or ext according to source class) | ✓ | ✓ | ✓ | ||
| Bdec, CDdec | source Dec (astrometr. corrected) (pnt or ext according to source class) | ✓ | ✓ | ✓ | ||
| Xbestband | 2 or 3 | band with highest likelihood: 2 for B, 3 for CD | ✓ | |||
| Xastrocorr | 0—1—2—7 | astrometric correction from CFHTLS (7), BCS (1), USNO (2) or none (0) | ✓ | |||
| Xmaxdist | ″ | distance between B and CD positions | ✓ | |||
| Xlink | – | pointer to Xseq of secondary association, see section 4.1 | ✓ | |||
| Bratemos, CDratemos | ct/s/detector | MOS count rate (pnt or ext according to source class) | ✓ | ✓ | ✓ | |
| Bratepn, CDratepn | ct/s | pn count rate (pnt or ext according to source class) | ✓ | ✓ | ✓ | |
| Xextended | 0—1 | extended flag (based on Xamin C1/C2) | ✓ | ✓ | ||
| XLSSC | 1-1000 | XLSSC cluster number; 0 if not assigned, -1 if not applicable | ✓ | ✓ | ||
| agn1000 | 1—0 | 1 if source listed in XXL Paper VI | ✓ | ✓ |
| Column name | units | explanation |
| Columns appearing once | ||
| seq | – | sequential counter of the counterpart set (kept internally but not provided) |
| Ctpra,Ctpdec | degree | counterpart coordinates from the closest survey |
| Columns appearing once for each survey. Survey mnemonics surv are given in Table 4 | ||
| survseq | – | seq pointers to the various photometric tables (kept internally but not provided) |
| survra,survdec | degree | counterpart coordinates in the individual survey |
| survdist | arcsec | X-ray to counterpart distance |
| Columns appearing per survey and per band. Band (filter) mnemonics per survey are given in Table 4 | ||
| survmagband | AB mag | 3″ aperture magnitude in given band for given survey |
| survmagband_e | AB mag | error on magnitude |
| Again columns appearing once | ||
| Xrank | Identification rank (see main text) | |
| Pbest | – | best band (smallest) chance probability (formula 1) |
| LRbest | – | best band (highest) likelihood ratio (formula 2) |
| zspec | – | spectroscopic redshift |
| origin | origin of zspeca𝑎aa𝑎aSpectroscopic surveys used are: 1: AAT_AAOmega; 2: AAT_AAOmega_GAMA; 3: Akiyama_1; 4: Akiyama_2; 5: Alpha_compilation; 6: ESOLP; 7: ESO_FORS2_600RI; 8: ESO_NTT; 9: AAOmega2012; 10: LDSS03; 11: Magellan; 12: Milano; 13: NED; 14: NED_Vizier; 15: NED_Vizier_north; 16: NED_south; 17: NTT08; 18: NTT_EFOSC2; 19: SDSS_DR10; 20: SNLS; 21: Simpson2006; 22: Simpson2012; 23: Stalin; 24: Subaru; 25: VIPERS_XXL; 26: VVDS_UD; 27: VVDS_deep; 28: WHT; 29: XMMLSS_NTT; 30: XMMLSS_PI_FORS-LDSS; 31: XMMLSS_PI_NTT05; 32: XMMLSS_PI_NTT08; 33: lidman15 (XXL Paper XIV); 34: lidman16 (this paper, sect. 3.6). References for cases 1-32 are given in Table 2 of XXL Paper XXII. | |
| simbadId | – | SIMBAD identifier (may be one of many) |
| nedId | – | NED identifier (may be one of many) |
| star | 0—1—2—3 | star flag: 1 if zspec=0, 2 by visual inspection, 3 both |
| agn1000 | -1—0—1 | 1 if counterpart in XXL Paper VI is confirmed, -1 if X-ray source is listed in Paper VI |
| but counterpart changed, 0 if X-ray source not listed in Paper VI | ||
4.1 X-ray tables
In an analogous manner to the XMM-LSS releases (Pierre et al., 2007; Chiappetti et al., 2013), we are providing a band-merged catalogue, called 3XLSS, and single-band tables for the B [0.5-2] keV and CD [2-10] keV bands (called 3XLSSB and 3XLSSCD). Redundant sources detected in overlapping regions of different pointings are removed, as explained in section 2.1. Only sources above a detection statistic of 15 (i.e. non-spurious) are made available in the single-band tables, while the band-merged tables may include data with a likelihood below 15 in the other (non-best) band.
For the table layout and column naming, we tried to be as consistent as possible with earlier XMM-LSS catalogues. The list of database columns with brief descriptions is given in Tables 9 and 10. Additional details about some columns are provided here:
-
•
The official source catalogue name Xcatname is in the form 3XLSS Jhhmmss.s-ddmmss to highlight the continuity with the IAU-registered names of the XMM-LSS catalogues (which the present catalogue overrides in the relevant sub-area).
-
•
The single-band catalogue names Bcatname and CDcatname use the unofficial prefixes 3XLSSB or 3XLSSCD.
-
•
Band-merging ambiguities (see section 2.1) may cause a detection in one band to be associated with two different objects in the other band. These catalogue entries are flagged by a non-zero value in column Xlink, pointing to the Xseq of the other entry. This might generate an ambiguity in the Xcatname which is resolved (only four cases in XXL-N and six cases in XXL-S) by the addition of a suffix (e.g. the two members of a couple will appear as 3XLSS Jhhmmss.s-ddmmssa and 3XLSS Jhhmmss.s-ddmmssb).
-
•
Column Xlsspointer assumes a non-zero value (only in XXL-N) if the source was already listed in the 2XLSSd catalogue (taking the value of Xseq in 2XLSSd).
-
•
Column Bc1c2 gives the C1/C2 classification for soft extended sources. The corresponding classification for sources nominally extended in the hard band is given in CDc1c2. A new Xextended flag tags all sources flagged as extended by Xamin (see next subsection).
As we did for XMM-LSS, sources flagged as extended by Xamin are included in the catalogue, and now flagged as such using column Xextended. This also includes the nominal application of the C1/C2 recipe to hard-only sources. Their numbers are provided in Table 3. Their fluxes are set to -1 for all C1 sources, and left to the flux computed according to Table 2 for C2, consistent with the XMM-LSS usage (see caption of Table 9 in Pierre et al. 2007). An additional column XLSSC contains the number of the official designation XLSSC nnn of confirmed clusters (mostly published in XXL Paper XX). It contains 0 for candidates reserved for future analysis and -1 when not applicable (for pointlike sources). For the confirmed clusters we advise looking for more meaningful parameters in the XXL_365_GC catalogue (XXL Paper XX).
4.2 X-ray data products
The per-pointing XMM photon and wavelet-smoothed images, and the camera exposure maps were already released in XXL Paper I as data products associated with the pointing table xxlpointings. The same data products are also associated with the 3XLSS source catalogue table. With any query returning some X-ray sources (in some pointings), it will be possible to retrieve the data products related to these pointings.
We note that the WCS of X-ray images is the one generated by sas and does not take into account astrometric corrections. Strictly speaking one should use uncorrected X-ray positions to overlay on X-ray images and corrected positions to overlay on optical thumbnails (see section 4.5). However, for X-ray images, the difference is unimportant, since the X-ray pixel size is 2.5″.
4.3 Multiwavelength tables
Since the number of multiwavelength catalogues available in the north and the south are different (summarised in Sect. 3.1), we supply two separate database tables for XXL-N and XXL-S, named 3XLSSOPTN and 3XLSSOPTS.
The multiwavelength tables can have one or more records per X-ray source. They have one record when there is no catalogued counterpart (blank fields) or exactly one counterpart, and more records for ambiguous cases. Each record correspond to a multiwavelength counterpart set as defined in section 3.2. The X-ray information (see below) will be duplicated for all records in our own database tables, and will be set to blank/undefined for secondary records at CDS.
The columns in the multiwavelength tables include a subset of the X-ray columns from the 3XLSS table (those with a tick in column ‘o’ of Tables 9 and 10) plus the specific information in Table 11: the essential multiwavelength photometric information (position, homogenised magnitudes, and errors), the spectroscopic redshift (see section 3.5), additional information like separations or likelihoods, the rank of the counterpart (primary/secondary), the identifier in SIMBAD or NED where available, and a star flag. There will be a multiplicity of database columns for the photometric information, named as described in Table 11 according to the survey and band (filter) mnemonics given in Table 4: e.g. the RA coordinate from CFHT will be named cfhtra and the one from GALEX galexra, the magnitude from CFHT cfhtmagz, etc.
An AGN1000 flag applies to the 1000 brightest sources already published in XXL Paper VI (where X-ray spectral fits for the sources are available), and in particular if the counterpart matches. We find that for 510 northern and 393 southern sources the primary counterpart matches the same counterpart chosen in the AGN1000 catalogue. For 32 and respectively 44 cases the AGN1000 counterpart matches one of our secondaries, and for 5 and 3 cases it matches a rejected candidate.
4.4 AAOmega redshift catalogue
The first four lines of the redshift catalogue are shown in Table 12 as an example of the layout of the database table (analogous to previous version XXL_AAOmega_15). The full catalogue can be obtained from CDS, via the XXL Master Catalogue Browser as table XXL_AAOmega_16, and from CESAM.
4.5 Multiwavelength data products
For each X-ray source a number of thumbnail FITS images for the various surveys and bands are available as associated data products.
The arrangement of the Master Catalogue database allows one to access as data products the links to the SIMBAD and NED pages for the sources which have such associations.
| Name | R.A. (J2000) | Dec. (J2000) | Redshift | Redshift flag |
|---|---|---|---|---|
| (deg) | (deg) | |||
| XXL-AAOmega J231218.27-532406.0 | 348.07616 | -53.40167 | 0.7788 | 4 |
| XXL-AAOmega J231218.67-533715.3 | 348.07782 | -53.62094 | 2.2062 | 4 |
| XXL-AAOmega J231221.27-534529.1 | 348.08865 | -53.75811 | 0.0001 | 6 |
| XXL-AAOmega J231233.28-532314.0 | 348.13867 | -53.38723 | 2.6824 | 4 |
5 Concluding remarks
In this paper, we have presented the intermediate release of the XXL X-ray catalogue (3XLSS) with 26 056 sources over two 25 deg2 areas. We have also included a multiwavelength catalogue with candidate counterparts in the UV, optical, NIR, and IR bands, and published the redshifts obtained with the AAOmega spectrograph in 2016 in the southern area.
Catalogues and associated data products are available through the XXL Master Catalogue browser111111http://cosmosdb.iasf-milano.inaf.it/XXL/ with a reduced summary stored at the CDS.
A final version of the XXL catalogue is planned for the end of 2018, with the reprocessing of all XXL data with the new XAminF18 pipeline (XXL Paper XXIV). By combining events from overlapping pointings, we will make use of the full survey depth.
Acknowledgements.
XXL is an international project based around an XMM Very Large Programme surveying two 25 deg2 extragalactic fields at a depth of ~5 erg s-1 cm-2 in [0.5-2] keV. The XXL website is http://irfu.cea.fr/xxl. Multiband information and spectroscopic follow-up of the X-ray sources are obtained through a number of survey programmes, summarised at http://xxlmultiwave.pbworks.com/. Based in part on data acquired through the Australian Astronomical Observatory, under programmes A/2016B/107. This research has made use of the SIMBAD database, operated at CDS, Strasbourg, France, and of the NASA/IPAC Extragalactic Database (NED), which is operated by the Jet Propulsion Laboratory, California Institute of Technology, under contract with the National Aeronautics and Space Administration. The Saclay team acknowledges long-term financial support from the Centre National d’Etudes Spatiales. This paper uses data from the Galaxy And Mass Assembly (GAMA) survey and from the VIMOS Public Extragalactic Redshift Survey (VIPERS). GAMA is a joint European-Australasian project based around a spectroscopic campaign using the Anglo-Australian Telescope. The GAMA input catalogue is based on data taken from the Sloan Digital Sky Survey and the UKIRT Infrared Deep Sky Survey. GAMA is funded by the STFC (UK), the ARC (Australia), the AAO, and the participating institutions. The GAMA website is http://www.gama-survey.org/. VIPERS has been performed using the ESO Very Large Telescope, under the ‘Large Programme’182.A-0886. The participating institutions and funding agencies are listed at http://vipers.inaf.it. The Saclay group acknowledges long-term support from the Centre National d’Etudes Spatiales (CNES). F.P. acknowledges support by the German Aerospace Agency (DLR) with funds from the Ministry of Economy and Technology (BMWi) through grant 50 OR 1514 and grant 50 OR 1608. S.A. acknowledges a post-doctoral fellowship from TUBITAK-BIDEB through 2219 programme. E.K. thanks CNES and CNRS for support of post-doctoral research.References
- Adami et al. (2018) Adami, C., Caretta, C., Ettori, S., et al. 2018, A&A, 620, A5, (XXL Paper XX)
- Ahn et al. (2014) Ahn, C. P., Alexandroff, R., Allende Prieto, C., et al. 2014, ApJS, 211, 17
- Ashby et al. (2014) Ashby, M. L. N., Stanford, S. A., Brodwin, M., et al. 2014, ApJS, 212, 16
- Baldi et al. (2002) Baldi, A., Molendi, S., Comastri, A., et al. 2002, ApJ, 564, 190
- Baldry et al. (2017) Baldry, I. K., Liske, J., Brown, M. J. I., et al. 2017, ArXiv e-prints [arXiv:1711.09139]
- Baran et al. (2016) Baran, N., Smolčić, V., Milaković, D., et al. 2016, A&A, 592, A8, (XXL Paper IX)
- Berger & Fringant (1984) Berger, J. & Fringant, A.-M. 1984, A&AS, 58, 565
- Brandt & Hasinger (2005) Brandt, W. N. & Hasinger, G. 2005, ARA&A, 43, 827
- Brusa et al. (2007) Brusa, M., Zamorani, G., Comastri, A., et al. 2007, ApJS, 172, 353
- Buckley-Geer et al. (2011) Buckley-Geer, E. J., Lin, H., Drabek, E. R., et al. 2011, ApJ, 742, 48
- Butler et al. (2018) Butler, A., Huynh, M., Delhaize, J., et al. 2018, A&A, 620, A3, (XXL Paper XVIII)
- Cappelluti et al. (2007) Cappelluti, N., Hasinger, G., Brusa, M., et al. 2007, ApJS, 172, 341
- Chiappetti et al. (2013) Chiappetti, L., Clerc, N., Pacaud, F., et al. 2013, MNRAS, 429, 1652
- Chiappetti et al. (2005) Chiappetti, L., Tajer, M., Trinchieri, G., et al. 2005, A&A, 439, 413
- Childress et al. (2017) Childress, M. J., Lidman, C., Davis, T. M., et al. 2017, MNRAS, 472, 273
- Ciliegi et al. (2018) Ciliegi, P., Jurlin, N., Butler, A., et al. 2018, A&A, 620, A11, (XXL Paper XVI)
- Desai et al. (2012) Desai, S., Armstrong, R., Mohr, J. J., et al. 2012, ApJ, 757, 83
- Desai et al. (2015) Desai, S., Mohr, J. J., Henderson, R., et al. 2015, Journal of Instrumentation, 10, C06014
- Downes et al. (1986) Downes, A. J. B., Peacock, J. A., Savage, A., & Carrie, D. R. 1986, MNRAS, 218, 31
- Dye et al. (2006) Dye, S., Warren, S. J., Hambly, N. C., et al. 2006, MNRAS, 372, 1227
- Ebrero et al. (2009) Ebrero, J., Mateos, S., Stewart, G. C., Carrera, F. J., & Watson, M. G. 2009, A&A, 500, 749
- Edge et al. (2013) Edge, A., Sutherland, W., Kuijken, K., et al. 2013, The Messenger, 154, 32
- Elyiv et al. (2012) Elyiv, A., Clerc, N., Plionis, M., et al. 2012, A&A, 537, A131
- Faccioli et al. (2018) Faccioli, L., Pierre, M., Valotti, A., et al. 2018, A&A, 620, A9, (XXL Paper XXIV)
- Flaugher et al. (2015) Flaugher, B., Diehl, H. T., Honscheid, K., et al. 2015, AJ, 150, 150
- Fotopoulou (in preparation) Fotopoulou, S. in preparation
- Fotopoulou et al. (2016) Fotopoulou, S., Pacaud, F., Paltani, S., et al. 2016, A&A, 592, A5, (XXL Paper VI)
- Gehrels (1986) Gehrels, N. 1986, ApJ, 303, 336
- Guglielmo et al. (2018) Guglielmo, V., Poggianti, B., Vulcani.B., et al. 2018, A&A, 620, A7, (XXL Paper XXII)
- Guzzo et al. (2014) Guzzo, L., Scodeggio, M., Garilli, B., et al. 2014, A&A, 566, A108
- Harrison et al. (2016) Harrison, F. A., Aird, J., Civano, F., et al. 2016, ApJ, 831, 185
- Hinton (2016) Hinton, S. 2016, MARZ: Redshifting Program, Astrophysics Source Code Library
- Hudelot et al. (2012) Hudelot, P., Cuillandre, J.-C., Withington, K., et al. 2012, VizieR Online Data Catalog, 2317
- Jarvis et al. (2013) Jarvis, M. J., Häußler, B., & McAlpine, K. 2013, The Messenger, 154, 26
- LaMassa et al. (2016) LaMassa, S. M., Urry, C. M., Cappelluti, N., et al. 2016, ApJ, 817, 172
- Lewis et al. (2002) Lewis, I. J., Cannon, R. D., Taylor, K., et al. 2002, MNRAS, 333, 279
- Lidman et al. (2016) Lidman, C., Ardila, F., Owers, M., et al. 2016, PASA, 33, e001, (XXL Paper XIV)
- Liske et al. (2015) Liske, J., Baldry, I. K., Driver, S. P., et al. 2015, MNRAS, 452, 2087
- Luo et al. (2017) Luo, B., Brandt, W. N., Xue, Y. Q., et al. 2017, ApJS, 228, 2
- McMahon et al. (2013) McMahon, R. G., Banerji, M., Gonzalez, E., et al. 2013, The Messenger, 154, 35
- Melnyk et al. (2018) Melnyk, O., Elyiv, A., Smolčić, V., et al. 2018, A&A, 620, A6, (XXL Paper XXI)
- Menanteau et al. (2010) Menanteau, F., Hughes, J. P., Barrientos, L. F., et al. 2010, ApJS, 191, 340
- Menanteau et al. (2009) Menanteau, F., Hughes, J. P., Jimenez, R., et al. 2009, ApJ, 698, 1221
- Morrissey et al. (2005) Morrissey, P., Schiminovich, D., Barlow, T. A., et al. 2005, ApJ, 619, L7
- Moutard et al. (2016) Moutard, T., Arnouts, S., Ilbert, O., et al. 2016, A&A, 590, A102
- Pacaud et al. (2016) Pacaud, F., Clerc, N., Giles, P. A., et al. 2016, A&A, 592, A2, (XXL Paper II)
- Pacaud et al. (2006) Pacaud, F., Pierre, M., Refregier, A., et al. 2006, MNRAS, 372, 578
- Pierre et al. (2007) Pierre, M., Chiappetti, L., Pacaud, F., et al. 2007, MNRAS, 382, 279
- Pierre et al. (2016) Pierre, M., Pacaud, F., Adami, C., et al. 2016, A&A, 592, A1, (XXL Paper I)
- Ricci et al. (2018) Ricci, M., Benoist, C., Maurogordato, S., et al. 2018, A&A, 620, A13, (XXL Paper XXVIII)
- Smith et al. (2004) Smith, G. A., Saunders, W., Bridges, T., et al. 2004, in Proc. SPIE, Vol. 5492, Ground-based Instrumentation for Astronomy, ed. A. F. M. Moorwood & M. Iye, 410–420
- Smolčić et al. (2016) Smolčić, V., Delhaize, J., Huynh, M., et al. 2016, A&A, 592, A10, (XXL Paper XI)
- Smolčić et al. (2018) Smolčić, V., Intema, H., Šlaus, B., et al. 2018, A&A, 620, A14, (XXL Paper XXIX)
- Sutherland & Saunders (1992) Sutherland, W. & Saunders, W. 1992, MNRAS, 259, 413
- Veillet (2007) Veillet, C. 2007, in Bulletin of the American Astronomical Society, Vol. 39, American Astronomical Society Meeting Abstracts #210, 170
- Wright et al. (2010) Wright, E. L., Eisenhardt, P. R. M., Mainzer, A. K., et al. 2010, AJ, 140, 1868
- Yuan et al. (2015) Yuan, F., Lidman, C., Davis, T. M., et al. 2015, MNRAS, 452, 3047
Appendix A Comparison with earlier XMM-LSS catalogues
In order to assess the reproducibility across different versions of the Xamin pipeline, we compare the present 3XLSS catalogue with the XMM-LSS 2XLSSd (Chiappetti et al. 2013), which overlaps a portion of XXL-N (XMM-LSS pointings represent a subset fully enclosed in XXL; the same data were reanalysed with a different version of the pipeline as indicated in Table 1).
There are 5827 entries that have the column Xlsspointer (described in section 4.1) set, i.e. these sources are in common between the old and new catalogue within a nominal separation of 10″. In only eight cases the same Xlsspointer occurs twice, of which four correspond to ambiguous band merging (see section 2.1.1).
2XLSSd included 6721 X-ray sources in 125 distinct XMM pointings. Of these, 902 sources are not confirmed in the newer catalogue. Conversely, of the 7277 sources in the new catalogue that are in the XMM-LSS pointings (those with identifiers of the form XXLn000-ppc or XXLn998-ppc), 1496 were not present in the older catalogue. We note that Xlsspointer may not necessarily relate detections in the same pointing because of differences in how the pointing overlap is treated, although the pointing is the same in 86% of the cases. In 3% of the cases a different XMM-LSS pointing was chosen; in the remaining 11% one of the surrounding non-XMM-LSS pointings was chosen.
Of the 902 unconfirmed sources in 2XLSSd, 91% are single-band detections (only 78 are detected in both bands). Most of them are very poor (64% with detection statistics det_stat20), only 7% have det_stat40 (which is about a detection according to the cross-calibration in Chiappetti et al. 2013) and less than 3% det_stat75 (about ). Similarly, 94% of the 1496 newly detected sources are single-band detections, 68% are very poor (det_stat20), only 4% above , and 2% above . Conversely, of the 5827 common objects, 46% are detected in both bands in one of the catalogues. Only 14% of the 2XLSSd and 11% of the 3XLSS sources are below det_stat20, while about one-third in either catalogue are above det_stat75. Not surprisingly, all the above means that the sources unaffected by the pipeline version change are those with larger significance.
More than 99% of the common objects have the same extended/pointlike flagging. Only 45 have changed classification, in equal proportion from pointlike to extended or vice versa; the vast majority of the extended being classified C2.
Concerning the detection likelihood, this is usually comparable with a reasonable scatter. It improves in the cases where 3XLSS uses a different pointing, possibly because one with better quality was chosen.
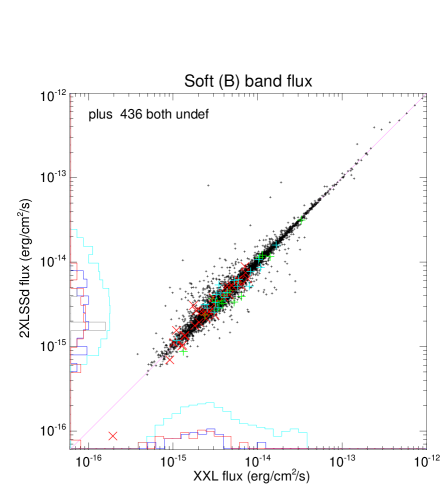
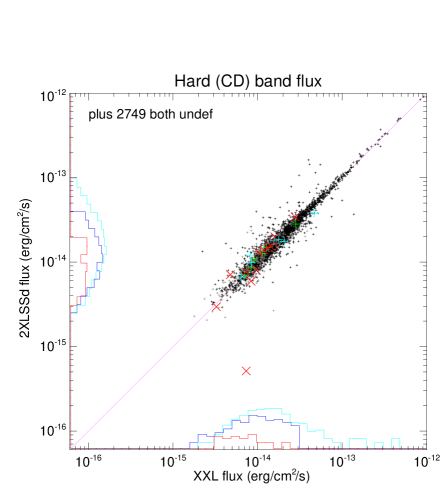
Also the fluxes, as shown in Fig. 10, are usually comparable with a reasonable scatter (here the spread is larger when 3XLSS uses a different pointing). The scatter can be quantified in terms of the percentage deviation in absolute value between 2XLSSd and 3XLSS fluxes. For all sources with a defined soft flux in both catalogues, 66% of the cases differ by less than 10%, 87% are within 20%, and 97% within 50%. In the hard band the percentages are respectively 57%, 82%, and 97%.
Concerning the reproducibility of source positions, Fig. 11 shows the histogram of the separation between the position in the new and old catalogues, which takes into account both the differences in pipeline version and the astrometric corrections.

Appendix B Pointing list and astrometric offsets
Table 12 integrates the pointing list table, already published in XXL Paper I, with the astrometric correction offsets described in section 2.1.3.
| (1) | (2) | (3) | (4) | (5) | (6) | (7) | (8) | (9) | (10) | (11) | (12) | (13) | (14) |
|---|---|---|---|---|---|---|---|---|---|---|---|---|---|
| ObsId | FieldName | RA | Dec | MOS1 | MOS2 | pn | quality | badfield | db | cat | RA | Dec | corr |
| 0037980101 | XXLn000-01a | 35.68970 | -3.84966 | 14.1 | 14.4 | 10.0 | 0 | 0 | X | X | CFHTLS | ||
| 0037980201 | XXLn000-02a | 36.02333 | -3.85000 | 13.1 | 13.3 | 8.8 | 0 | 0 | X | X | CFHTLS | ||
| 0037980301 | XXLn000-03a | 36.35712 | -3.84977 | 13.4 | 13.4 | 9.1 | 0 | 0 | X | X | CFHTLS | ||
| 0037980401 | XXLn000-04a | 36.68933 | -3.85002 | 5.3 | 4.9 | 3.6 | 0 | 2 | X | X | CFHTLS | ||
| 0404960101 | XXLn000-04b | 36.64175 | -3.81891 | 8.9 | 9.0 | 3.3 | 0 | 2 | X | X | CFHTLS | ||
| 0553910101 | XXLn000-04c | 36.64454 | -3.81438 | 11.2 | 11.5 | 8.6 | 0 | 2 | X | X | CFHTLS | ||
| 0037980401 | XXLn000-04z | 36.64454 | -3.81891 | 25.3 | 25.4 | 15.5 | 0 | 0 | X | X | CFHTLS | ||
| 0037980501 | XXLn000-05a | 37.02270 | -3.85013 | 15.9 | 15.9 | 11.8 | 0 | 0 | X | X | CFHTLS | ||
| 0037980601 | XXLn000-06a | 35.52316 | -3.51672 | 13.0 | 13.0 | 8.8 | 0 | 0 | X | X | CFHTLS | ||
| 0037980701 | XXLn000-07a | 35.85716 | -3.51575 | 12.3 | 12.3 | 7.8 | 0 | 0 | X | X | CFHTLS |