The long outburst of the black hole transient GRS 1716–249 observed in the X-ray and radio band
Abstract
We present the spectral and timing analysis of X-ray observations performed on the Galactic black hole transient GRS 1716–249 during the 2016-2017 outburst. The source was almost continuously observed with the Neil Gehrels Swift Observatory from December 2016 until October 2017. The X-ray hardness ratio and timing evolution indicate that the source approached the soft state three times during the outburst, even though it never reached the canonical soft spectral state. Thus, GRS 1716–249 increases the number of black hole transients showing outbursts with “failed" state transition. During the softening events, XRT and BAT broadband spectral modeling, performed with thermal Comptonization plus a multicolor disc black-body, showed a photon index ( < 2) and an inner disc temperature (kTin = 0.2-0.5 keV) characteristic of the hard intermediate state. This is in agreement with the root mean square amplitude of the flux variability (rms > 10). We find that, coherently with a scenario in which the disc moves closer to the compact object, the accretion disc inner radius decreases with the increase of the inner disc temperature, until a certain point when the temperature starts to increase at constant radius. This, in addition with the spectral analysis results, suggests that either the accretion disc reached the innermost stable circular orbit during the hard intermediate state or the hot accretion flow might re-condensate in an inner mini-disc. We report on the radio observations performed during the outburst finding that GRS 1716–249 is located on the radio-quiet “outlier" branch of the radio/X-ray luminosity plane.
keywords:
X-rays: general – accretion, accretion disc – black hole – X-rays: binaries – stars: jet1 Introduction
Black hole transients (BHTs) are binary systems with a black hole (BH) accreting matter from a less evolved star. They alternate quiescent periods characterized by X-ray luminosities of L1030-33 erg s-1 and episodic outbursts during which the source can reach L1036-39 erg s-1.
During outbursts they can show different X-ray spectral states, characterized by different luminosities (low or high), spectral shapes (hard or soft; Zdziarski
& Gierliński 2004; Remillard &
McClintock 2006) and timing properties (Belloni et al., 2011; Belloni &
Motta, 2016).
The spectral evolution of BHTs can be described in terms of the Hardness-Intensity Diagram (HID, Homan &
Belloni, 2005) based on X-ray measurements, where the spectral states are positioned on different regions of a q-shaped pattern.
There are two main spectral states: the hard state (HS) and the soft state (SS), in which X-ray spectra are dominated by the hard X-ray emission and soft X-ray emission, respectively, and are usually explained in terms of changes in the geometry of the accretion flow onto the central object (Zdziarski, 2000; Done
et al., 2007).
The HS corresponds to the right-hand branch of the HID, while the SS is located on the left-hand side.
BHTs start their outbursts in the HS with a spectrum well described by a power law (typical photon index ) with a high-energy cut-off at 50-100 keV. This is physically interpreted as thermal Comptonization due to Compton up-scattering of soft disc photons by a corona of hot electrons (100 keV) located close to the BH (Zdziarski
& Gierliński, 2004).
A weak soft X-ray thermal component with a temperature of 0.1-0.2 keV is usually observed and interpreted as emission from an optically thick, geometrically thin, accretion disc (Shakura &
Sunyaev, 1973). In this state, the accretion disc is thought to be truncated at large radii (roughly 100 Rg) from the BH (Done
et al., 2007).
During the SS, BHTs spectra show a strong soft thermal component with inner disc temperature kTin1 keV. This emission is likely associated to the Shakura-Sunyaev disc extending down to the innermost stable circular orbit (ISCO). In addition, a steep power-law tail ( > 2.5), which often extends to the high energies (500 keV), is observed.
Usually, this component is interpreted as due to non-thermal Comptonisation, although its origin is still debated (Poutanen &
Coppi, 1998; Laurent &
Titarchuk, 1999; Niedźwiecki & Zdziarski, 2006).
Two further spectral states, namely the Hard and Soft Intermediate States (HIMS and SIMS, respectively), are also defined (see, e.g., Belloni &
Motta 2016). They are located along the horizontal branches in the HID, with spectral parameters in between those of the main states.
Not all BHTs reproduce the standard q-track pattern during their outbursts: an increasing number of sources show the transition HS-to-HIMS, but never make the transitions to the SIMS and SS (Capitanio et al., 2009; Ferrigno et al., 2012; Soleri
et al., 2013; Del Santo
et al., 2016). These outbursts, which do not evolve through the full set of spectral states, are called “failed" state transition. The reasons why these sources fail to make transition to the soft state is still debated.
The X-ray Power Density Spectra (PDS) of BHTs show different properties depending on the spectral state. The variability is typically quantified in terms of fractional root mean squared (rms) variability. In the HS the fractional rms can be as high as 30% (see, e.g., Belloni & Motta 2016), while the SS is characterized by very low variability levels (rms < 5%). During the HIMS, the fractional rms is observed to decrease from 30% to 10% and correlates with the hardness (Muñoz-Darias et al., 2011). The most dramatic changes in the power density spectra occur at the transition between the HIMS and the SIMS (Belloni & Motta, 2016). This timing transition is extremely fast, as opposed to the smooth spectral changes usually observed across the HIMS to SIMS transition (Del Santo et al., 2009; Motta et al., 2009). The fractional rms in the SIMS is estimated to be between 7 and 10 per cent (Muñoz-Darias et al., 2011).
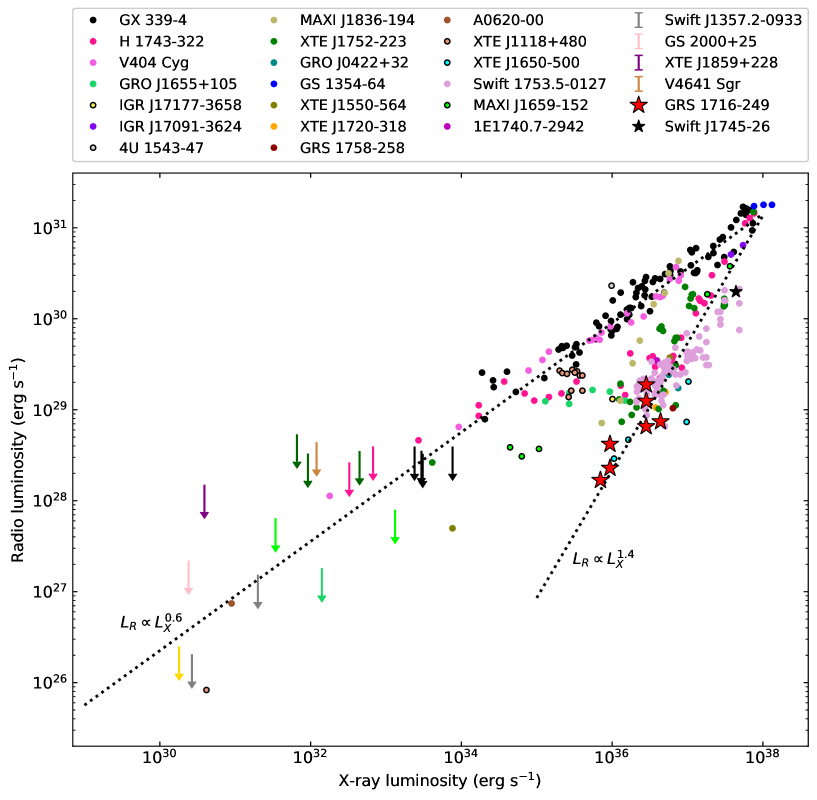
In addition to the X/-ray phenomenology, the BHTs spectral states are also characterized by the production of different outflow (Mirabel, 1994; Fender et al., 2006). Jets, whose emission is observed mainly in the radio band, are coupled to the accretion flow, even though the nature of this connection is still unclear. The hard states of BHTs are typically associated with a compact jet, characterized by a flat or slightly-inverted radio spectrum (e.g Fender et al. 2001; Corbel & Fender 2002). This is interpreted as self-absorbed synchrotron emission from steady jets, as also observed in low-luminosity AGNs (Blandford & Königl, 1979). However, during the SS these compact jets are thought to be quenched (Fender et al., 1999; Corbel et al., 2000). During the HS, a radio/X-ray connection has been observed in several sources in the form of a non-linear flux correlation F F, where a 0.5-0.7, and FR and FX are the radio and X-ray fluxes, respectively (see e.g. Corbel et al. 2003; Gallo et al. 2003). In recent years, a number of Galactic BHTs were found to have a steeper correlation index, i.e. 1.4, in the radio/X-ray luminosity plane (Coriat et al., 2011; Corbel et al., 2013). They were called “outliers", even though the increasing number of these sources could in fact turn out to be the norm (Coriat et al., 2011; Motta et al., 2018). We refer to the “outliers" also as radio-quiet since they can be radio fainter by 1-2 magnitudes around L1036-1037 erg s-1.
1.1 GRS 1716–249
The BH X-ray transient GRS 1716–249 (also known as GRO J1719–24, Nova Oph 1993) was discovered in 1993 September with the CGRO/BATSE and Granat/SIGMA telescopes (Harmon et al., 1993; Ballet
et al., 1993).
At that time, it reached a maximum flux of 1.4 Crab in the 20–100 keV energy band.
The optical counterpart was identified with the spectral type K (or possibly later) star V2293 Oph and a distance of kpc was derived (della Valle et al., 1994). Masetti et al. (1996) estimated a lower limit for the compact object mass of 4.9 M⊙ (confirming the BH nature), an evolved companion star mass of 1.6 M⊙ and an orbital period of 14.7 hr. The hydrogen column density along the line of sight was estimated being 4 1021 atoms cm-2 (Tanaka, 1993).
In 1993 October, the source was also observed in radio by the Very Large Array (VLA), showing a flat spectrum (della Valle
et al., 1993; della Valle et al., 1994). A peculiar outburst showing five sawtooth-like shapes in the X-ray light curve was observed in 1995 (Hjellming
et al., 1996). Simultaneous radio observations detected a synchrotron radio flare, implying the presence of relativistic particles and magnetic fields.
GRS 1716–249 was detected again in outburst on 2016 December 18 by MAXI after more than twenty years in quiescence (Negoro
et al., 2016; Masumitsu
et al., 2016). Soon after, a Neil Gehrels Swift Observatory (hereafter Swift, Gehrels
et al., 2004) XRT monitoring campaign (Del Santo
et al., 2017a) was triggered and a preliminary spectral study showed a hard X-ray spectrum. On 2017 February 10, an INTEGRAL ToO of 90 ks showed that the source was in hard state (Del Santo
et al., 2017b). INTEGRAL results combined with simultaneous radio and infrared observations will be presented in a further paper.
In this paper, we present Swift spectral and timing analysis results and radio observations performed during the whole 2016-2017 outburst of GRS 1716–249 which lasted about ten months.
2 X-ray Observations and Data Reduction
GRS 1716–249 was observed both with the X-Ray Telescope (XRT, Burrows
et al., 2005) and the Burst Alert Telescope (BAT, Barthelmy
et al., 2005) on board Swift. XRT works in the soft X-ray band (0.2–10 keV) in four different operating modes depending on the source count rate (for more details see Burrows
et al., 2005).
The Windowed Timing (WT) mode is used to obtain high time resolution light curves (1.7 ms) and it is used to observe very bright sources (1–600 mCrab).
BAT is a highly sensitive coded mask instrument. It can daily observe up to 80% of the whole sky in survey mode in the 15–150 keV band, aiming to catch gamma-ray burst events.
We retrieved and analyzed all XRT and BAT observations performed in the period 2016 December-2017 October.
We used XSPEC v. 12.9.1 for X-ray spectral analysis.
Errors on spectral parameters are given at the 90 confidence level.
2.1 XRT
The XRT monitoring campaign of GRS 1716–249 was performed in WT observing mode from 2017 January 28 (MJD 57781) to 2017 October 20 (MJD 58046), with target IDs 34924 and 88233 (the observation log is provided in Table LABEL:log). In observations 046, 059 and 067 the source was out of the part of the CCD used in WT mode and we therefore excluded these data from the analysis. We extracted the 0.2–10 keV count rate from each observation (see Tab. LABEL:log) corrected for instrumental artifacts (i.e. bad columns on the CCD) using the on-line products generator111http://www.swift.ac.uk/user_objects/ (Evans et al., 2007, 2009). With the same tool, we extracted pointing by pointing the count rate in 0.5–2 keV and 2–10 keV energy ranges in order to study the Hardness-Ratio (HR), defined as the ratio of the hard count rate over the soft one (see Sec. 4 and Fig. 1). Then, we reprocessed the XRT data using the FTOOLS software package (HEASoft v.6.20) and the Swift Calibration Database (CALDB; release 20160609). We ran the task xrtpipeline, selecting only events with grade 0. This filter is applied in the analysis of bright sources in order to reduce the spectral distortion at low energies ( 1.0 keV) observed in WT mode222http://www.swift.ac.uk/analysis/xrt/digest_cal.php. Then we selected a circle of 20 pixel (1 pixel = 2.357′′) radius centred on the source position to extract the spectra using the task xrtproducts. When the source was on the edge of the CCD, we selected a region with the largest size possible; in pointings 054, 058 and 060, radii of 5, 8 and 4 pixels respectively were chosen. The background was extracted from a region of the same size of the source region located away from the source.
According to Romano et al. (2006) the pile-up correction should be applied for sources with count rate above 100 ct/s. However, we have evaluated that pointings with count rate between 90–100 ct/s were still affected by pile-up333http://www.swift.ac.uk/analysis/xrt/pileup.php. Thus, the pile-up correction was carried out for observations with count rate (values plus uncertainties) 90 ct/s (see Tab. LABEL:log). For these observations we extracted the spectra from an annular region centred on the source with an outer radius of 20 pixels and an inner radius of 3 pixels. In order to apply the statistics we grouped the channels for having at least 50 counts per energy bin. We computed power spectra in the energy band 0.4–10.0 keV from each XRT observation, using custom software written in IDL444GHATS, http://www.brera.inaf.it/utenti/belloni/GHATS_Package/Home.html. We used 29-s long intervals and a Nyquist frequency of 280 Hz. We averaged the PDS in order to obtain one PDS per observation, which we normalized according to Leahy et al. (1983). We measured the fractional rms in the frequency range 0.035–10 Hz. After MJD 58000 (2017 September 4) the source count rate was too low ( 5 counts/s) to allow us to measure the fractional rms, the upper limit to which is essentially 100%. For this reason, we do not report any fractional rms value after this date.
2.2 BAT
GRS 1716–249 was almost daily observed in survey mode with BAT from 2016 December 1 (MJD 57723). We processed the BAT data, available from the HEASARC public archive, using the BAT-IMAGER software (Segreto et al., 2010).
This software performs screening, mosaicking and source detection, and produces scientific products for any detected source. We used the official BAT spectral redistribution matrix.
We extracted the light curves in two energy bands (15–30 keV and 30–90 keV) in order to compute the HR, defined as the count rate ratio [30–90] keV/[15–30] keV, with one-day time interval.
Spectra were extracted in 30 channels with logarithmic binning in the energy range 15–185 keV. Due to the poor statistics of the hard X-ray emission at the beginning of the outburst, data from MJD 57723 until MJD 57739 were excluded.
| Seq | Start Time | Exposure | Count Rate | (dof) | |
|---|---|---|---|---|---|
| (s) | (ct/s) | ||||
| (1) | (2) | (3) | (4) | (5) | (6) |
| 001∗ | 2017-01-28 00:08:01 | 992 | 93.10.4 | 1.55 | 1.08(342) |
| 002∗ | 2017-01-29 19:08:57 | 999 | 1023 | 1.57 | 0.93(315) |
| 003∗ | 2017-01-31 00:05:15 | 683 | 952 | 1.58 | 1.10(248) |
| 004∗ | 2017-02-02 17:31:57 | 990 | 1004 | 1.60 | 1.04(372) |
| 005∗ | 2017-02-04 18:56:10 | 924 | 100.20.3 | 1.58 | 1.03(373) |
| 006∗ | 2017-02-06 10:59:09 | 305 | 961 | 1.53 | 0.95(138) |
| 007∗ | 2017-02-08 04:15:42 | 946 | 97.90.3 | 1.59 | 1.12(384) |
| 008∗ | 2017-02-09 02:19:11 | 1478 | 8012 | 1.62 | 1.07(432) |
| 009∗ | 2017-02-09 05:43:11 | 1282 | 8711 | 1.57 | 1.02(365) |
| 010∗ | 2017-02-09 09:01:44 | 1451 | 97.40.3 | 1.62 | 1.03(452) |
| 011∗ | 2017-02-09 13:27:07 | 1287 | 1021 | 1.64 | 1.14(400) |
| 012∗ | 2017-02-09 18:11:07 | 1360 | 1033 | 1.64 | 0.89(364) |
| 013∗ | 2017-02-09 21:27:58 | 1367 | 1030.7 | 1.62 | 1.00(425) |
| 014∗ | 2017-02-11 07:11:47 | 949 | 1013 | 1.57 | 0.99(299) |
| 015∗ | 2017-02-12 13:17:33 | 1209 | 8112 | 1.57 | 1.06(431) |
| 016∗ | 2017-02-14 08:42:43 | 921 | 874 | 1.55 | 1.10(322) |
| 017∗ | 2017-02-14 19:35:14 | 975 | 91.60.4 | 1.60 | 0.99(358) |
| 018∗ | 2017-02-16 03:30:55 | 997 | 90.20.3 | 1.59 | 1.17(357) |
| 019∗ | 2017-02-22 13:56:26 | 1734 | 925 | 1.57 | 1.05(398) |
| 020∗ | 2017-02-24 09:00:33 | 966 | 100.30.3 | 1.56 | 1.19(362) |
| 021∗ | 2017-02-26 15:27:03 | 934 | 100.10.3 | 1.60 | 1.05(348) |
| 022∗ | 2017-03-09 12:48:10 | 1063 | 97.40.4 | 1.63 | 1.04(375) |
| 024∗ | 2017-03-15 18:46:20 | 985 | 90.20.3 | 1.59 | 1.08(348) |
| 025∗ | 2017-03-21 20:16:46 | 959 | 98.70.3 | 1.67 | 0.92(384) |
| 026∗ | 2017-03-27 22:36:50 | 940 | 12411 | 1.69 | 0.92(333) |
| 027∗ | 2017-04-02 09:07:26 | 960 | 1286 | 1.76 | 1.09(389) |
| 029∗‡ | 2017-04-07 08:50:41 | 1664 | 1311 | 1.85 | 1.21(511) |
| 030∗‡ | 2017-04-08 23:11:36 | 965 | 131.00.7 | 1.93 | 1.33(413) |
| 031∗‡ | 2017-04-10 21:12:42 | 1933 | 1436 | 2.01 | 1.19(514) |
| 032∗‡ | 2017-04-11 03:50:28 | 727 | 1473 | 2.06 | 1.20(383) |
| 033∗‡ | 2017-04-12 11:26:48 | 1852 | 1373 | 1.98 | 1.23(508) |
| 034∗‡ | 2017-04-14 00:37:03 | 929 | 1237 | 1.92 | 1.13(351) |
| 035∗ | 2017-04-21 01:39:30 | 444 | 98.10.5 | 1.75 | 1.07(236) |
| 036 | 2017-05-05 17:42:16 | 1152 | 830.3 | 1.72 | 1.17(525) |
| 037 | 2017-05-11 01:28:31 | 1258 | 79.20.3 | 1.71 | 1.03(538) |
| 038∗‡ | 2017-05-22 22:52:31 | 839 | 100.30.4 | 1.90 | 1.11(333) |
| 039∗ | 2017-05-26 17:55:22 | 724 | 91.80.5 | 1.79 | 1.15(261) |
| 040 | 2017-06-02 12:29:01 | 354 | 78.60.5 | 1.79 | 0.99(295) |
| 041 | 2017-06-07 00:25:55 | 1059 | 74.80.3 | 1.75 | 1.20(486) |
| 042 | 2017-06-12 04:46:37 | 3354 | 75.40.9 | 1.81 | 1.15(641) |
| 043 | 2017-06-17 02:58:56 | 1058 | 761 | 1.82 | 1.17(475) |
| 044 | 2017-06-23 21:29:38 | 1033 | 74.00.3 | 1.91 | 1.13(464) |
| 045∗‡ | 2017-06-30 20:57:38 | 437 | 914 | 2.13 | 1.29(267) |
| 046† | 2017-07-09 18:39:24 | 964 | - | - | - |
| 047‡ | 2017-07-16 03:43:26 | 978 | 66.90.3 | 2.12 | 1.31(413) |
| 048∗‡ | 2017-07-23 11:12:15 | 988 | 100.10.3 | 2.64 | 1.35(295) |
| 049∗‡ | 2017-07-25 15:33:47 | 980 | 106.00.3 | 2.68 | 1.30(286) |
| 050∗‡ | 2017-07-26 17:10:39 | 1491 | 110.60.3 | 2.79 | 1.34(349) |
| 051‡ | 2017-07-29 20:00:17 | 972 | 80.60.3 | 2.57 | 1.41(404) |
| 052‡ | 2017-07-30 18:30:24 | 973 | 78.30.3 | 2.55 | 1.42(397) |
| 053‡ | 2017-07-31 22:58:09 | 919 | 74.70.3 | 2.53 | 1.46(388) |
| 054⋄‡ | 2017-08-06 19:19:08 | 863 | 20.80.2 | 1.95 | 0.99(229) |
| 055‡ | 2017-08-11 06:27:11 | 817 | 28.70.2 | 1.87 | 0.99(263) |
| 056 | 2017-08-13 09:08:40 | 1081 | 23.10.2 | 1.81 | 1.17(277) |
| 057 | 2017-08-15 05:46:59 | 1058 | 21.40.1 | 1.74 | 0.95(252) |
| 058⋄ | 2017-09-08 03:38:00 | 1667 | 4.240.07 | 1.58 | 0.93(107) |
| 059† | 2017-09-11 01:47:00 | 1529 | - | - | - |
| 060⋄ | 2017-09-15 00:05:15 | 1226 | 2.850.08 | 1.52 | 0.89(51) |
| 061 | 2017-09-17 00:05:15 | 1106 | 3.310.07 | 1.58 | 0.95(45) |
| 062 | 2017-09-21 01:07:13 | 1639 | 3.240.06 | 1.55 | 0.95(94) |
| 063 | 2017-10-01 00:10:50 | 1425 | 4.090.06 | 1.47 | 0.99(84) |
| 064 | 2017-10-05 01:25:00 | 1591 | 4.290.07 | 1.56 | 1.29(69) |
| 065 | 2017-10-10 00:57:59 | 1372 | 3.610.06 | 1.63 | 1.05(68) |
| 066 | 2017-10-15 00:33:11 | 1477 | 3.660.06 | 1.61 | 1.27(75) |
| 067† | 2017-10-20 11:21:50 | 1388 | - | - | - |
| ID 88233001∗‡ | 2017-07-28 16:51:27 | 3716 | 100.00.2 | 2.75 | 1.57(481) |
3 Radio observations and data reduction
3.1 ATCA
We observed GRS 1716–249 with the Australia Telescope Compact Array (ATCA) from 18:52–21:00 UTC on 2017 February 9, under program code C2538. We observed simultaneously in two 2-GHz bands, centred at 5.5 and 9.0 GHz, with the array in its extended 6D configuration, with a maximum baseline of 6 km. We used PKS 1934638 as our amplitude and bandpass calibrator, and PKS 1710269 (2.4∘ from GRS 1716–249) as our complex gain calibrator, adopting a cycle time of 16.5 min, with 15 min spent on GRS 1716–249 and 1.5 min on the calibrator in each cycle. Data reduction was performed according to standard procedures in the Multichannel Image Reconstruction, Image Analysis, and Display Miriad software package (Sault et al., 1995). The calibrated data were imported into the Astronomical Image Processing System (aips; Greisen, 2003) for imaging, where we used pure uniform weighting to minimise the elongation of the synthesised beam that arose from the sparse uv-coverage. Following deconvolution, the source flux density was measured by fitting a point source in the image plane.
3.2 LBA
We observed GRS 1716–249 with the Australian Long Baseline Array (LBA) on three occasions; 2017 February 21, April 22 and August 13, under program code V447. The first two observations were taken outside formal LBA sessions, with a minimal array of just four antennas. However, the August 13 observation was taken during an official LBA run, allowing us to include ten stations in the array. Details of the different observations are given in Table 2.
Data were correlated using the DiFX software correlator (Deller et al., 2011), and reduced using standard procedures within aips. Given the faintness of the target, we observed in phase referencing mode, nodding between GRS 1716–249 and the nearby phase reference calibrator J1711-2509, located from GRS 1716–249. In each cycle, we spent 90 s on the calibrator and 210 s on the target. Every fifth target scan was substituted for a scan on a nearby check source, J1713-2658. Amplitude calibration was performed using the system temperatures recorded at the individual stations where available, and nominal values in other cases. We used a bright fringe finder source to perform instrumental phase and delay corrections, and subsequently to calibrate the instrumental frequency response. We hybrid mapped the phase reference source, before using it to derive the time-dependent amplitude, phase, delay and rate solutions, which were applied to GRS 1716–249. After imaging the target source, its flux density was determined by fitting a point source in the image plane, since in no case was it observed to be extended. The loss of one antenna (Cd) for the majority of the first observation (2017 February 21) meant that imaging with three antennas could not reliably reproduce the source structure, so for this epoch we fit the data with a point source in the uv-plane.
| Program code | Date, Time (UT) | MJD | Bandwidth | Array |
|---|---|---|---|---|
| V447D | 2017-02-21, 17:18–02:30 | MHz | At-Cd-Ho-Mp | |
| V447E | 2017-04-22, 11:56–23:00 | MHz | At-Cd-Ho-Mp | |
| V447F | 2017-08-13, 06:56–16:00 | MHz | At-Cd-Ho-Ke-Mp-Pa-Td-Ti-Wa-Yg |
3.3 VLA
We observed GRS 1716–249 with the Karl G. Jansky Very Large Array (VLA) from 05:48–06:35 UTC on 2017 August 12, under program code SI0462. The array was in its moderately compact C configuration, and we split the antennas into two subarrays of 14 and 12 antennas, each of which observed simultaneously in two 1-GHz basebands, centred at 5.25 and 7.45 GHz, and 8.8 and 11.0 GHz, respectively. GRS 1716–249 was setting during the observations, with an elevation decreasing from 19∘ to 14∘. The weather was poor, with overcast skies, light rain and thunderstorms over the array leading to poor atmospheric phase stability. Combined with the low elevation, this led to significant phase decorrelation, even at frequencies as low as 5 GHz.
We used 3C 286 as our flux and bandpass calibrator, and J17512524 as our complex gain calibrator. We conducted two 17.5-minute scans on GRS 1716–249 each of which was bracketed by a 1-minute scan on the complex gain calibrator. Data reduction was carried out following standard procedures within the Common Astronomy Software Application (casa; McMullin et al., 2007). We imaged the calibrated data using Briggs weighting, with a robust parameter of 1. The image noise levels we achieved were significantly higher than expected theoretically (by factors of 2–4, increasing with frequency). We attribute this to the higher system temperatures arising from the poor weather. GRS 1716–249 was significantly detected at all frequencies, and we determined the source flux density by fitting it with a point source in the image plane.
Given the weather conditions at the array, we used the middle scan on the complex gain calibrator to quantify the extent of the phase decorrelation. We re-reduced the data, using only the first and last calibrator scans to solve for the complex gain solutions, treating the middle calibrator scan as a second target. A comparison of the calibrator flux densities when treated as a target (interpolating the gain solutions from the initial and final scans) showed that the peak amplitudes were lower by 9.6, 14.3, 25.7 and 32.3% at 5.25, 7.45, 8.8 and 11.0 GHz, respectively. We therefore corrected the fitted flux densities of GRS 1716–249 by these factors to derive the final flux densities, as detailed in Table 3.
| Array | Date | MJD | Frequency | Flux density | Spectral Index |
| (GHz) | (mJy) | ||||
| ATCA | 2017 Feb 9 | 5.5 | |||
| ATCA | 2017 Feb 9 | 9.0 | |||
| LBA | 2017 Feb 21 | 8.4 | - | ||
| LBA | 2017 Apr 22 | 8.4 | - | ||
| VLA | 2017 Aug 12 | 5.25 | |||
| VLA | 2017 Aug 12 | 7.45 | |||
| VLA | 2017 Aug 12 | 8.8 | |||
| VLA | 2017 Aug 12 | 11.0 | |||
| LBA | 2017 Aug 13 | 8.4 | - |
4 Results
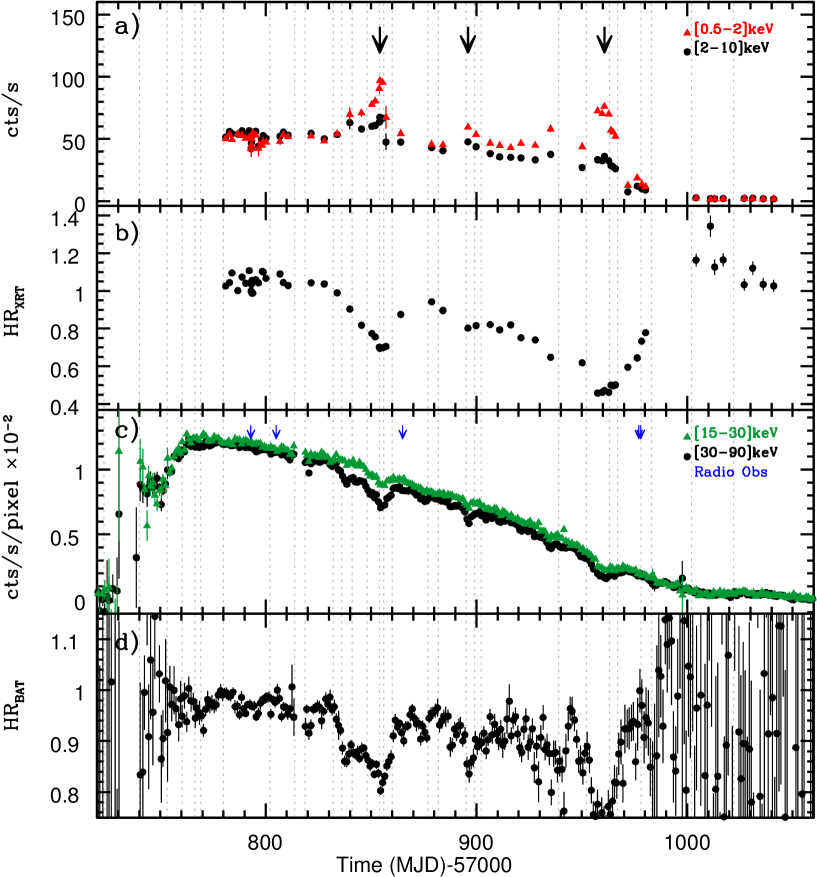
The XRT and BAT count rate and HR evolution of GRS 1716–249 are shown in Figure 1. We noted three peaks in the XRT light curves (panel a in Fig. 1) which reach their maximum on MJD 57854.16 () with a total of 143 ct/s, on MJD 57895.95 () with 97 ct/s and on MJD 57960.72 () with 103 ct/s. They correspond to dips in the BAT light curves (panel c in Fig. 1) and in both the HRs (panels b and d in Fig. 1), and clearly indicate a spectral softening. The third peak corresponds to the softest observed episode: the 2–10 keV count rate was lower than the 0.5–2 keV count rate by a factor of two, whereas it was of 30 and 20 for the first two peaks.
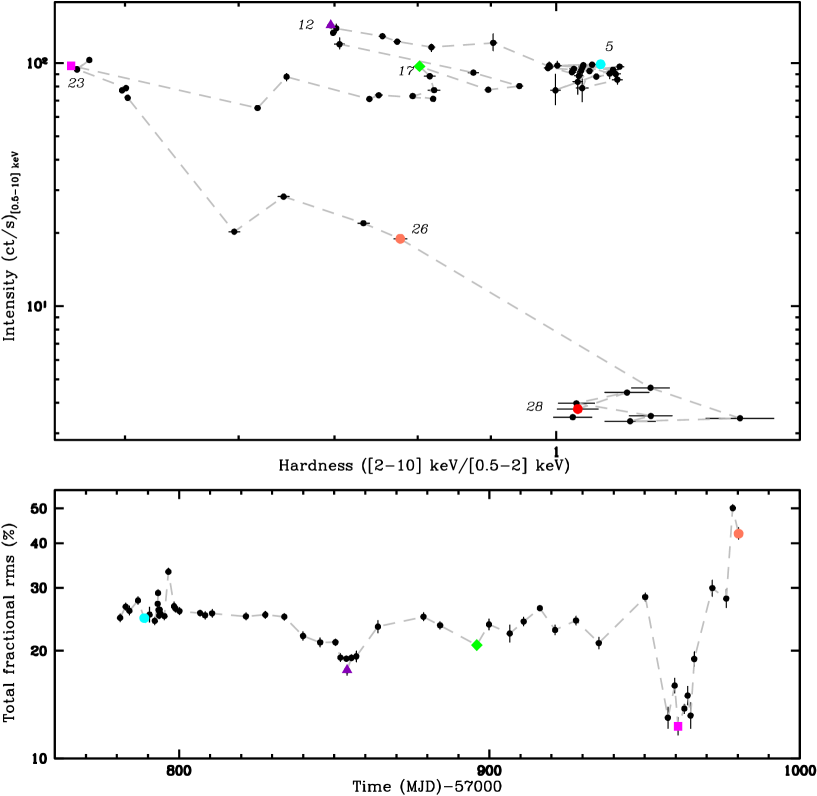
In Figure 2 (top panel) we show the XRT Hardness-Intensity Diagram (HID) of GRS 1716–249. We plotted the total 0.5–10 keV count rate versus the count rate ratio 2–10 keV/0.5–2 keV. It is worth noting that due to the late XRT trigger with respect to the outburst beginning (the XRT monitoring started a few days after the hard X-ray peak), the HS right-hand branch in the HID was missed and the GRS 1716–249 q-track starts from the bright HS. The outburst evolved towards the intermediate states (IMS) on the horizontal branch. The three soft X-ray peaks in the XRT light curves are shown on the HID with a purple triangle, a green diamond and a magenta square. The X-ray spectra of GRS 1716–249 are observed to soften and harden twice along the IMS branch, until it reaches the softest observed state (magenta square), then the flux starts to decrease and the source simultaneously becomes harder along a diagonal track. We noted that the shape of this HID is different from that observed in the majority of BHTs (e.g. GX 339-4, Belloni et al., 2006; Dunn et al., 2010). Indeed there is not a clear SS branch on the left side of the diagram as observed in H 1743–322 and MAXI J1836–194 by Capitanio et al. (2009) and Ferrigno et al. (2012), respectively.
4.1 XRT temporal variability
In BHTs the fractional rms of the variability is related to the spectral state (Muñoz-Darias et al., 2011). Therefore, we studied the evolution of the fractional rms during the GRS 1716–249 outburst (Fig. 2 bottom panel). We noted that the fractional rms measured from the XRT data is not directly comparable with those from RXTE/PCA (Muñoz-Darias et al., 2011), because of the different energy bands which the two instruments are sensitive to. However, the overall behaviour of the fractional rms measured with XRT is expected to be similar to that would be measured by RXTE (with a difference in normalization). In the first XRT observations GRS 1716–249 showed fractional rms between 25 and 30 (e.g. cyan dot), typical of the bright HS at the beginning of the HIMS branch. Then, after MJD 57830, the fractional rms started to decrease down to a value of 17 (MJD 57854), which corresponds to the purple triangle in the HID (Fig. 2 top panel) and to the first dip in the HRs (Fig. 1, b and d). Afterwards the fractional rms increased again up to values of about 25, then a second dip (green diamond) with fractional rms of 20 at MJD 57896 (corresponding to the second softening) occurred. Simultaneously with the third HR softening, the fractional rms decreased down to 12 (magenta square, at MJD 57961). Finally, it rose back to 40 in the final part of the outburst, indicating that the source returned to the HS.
4.2 XRT spectral analysis
We fit each XRT spectrum in the 0.5–10 keV energy band with an absorbed (tbabs in XSPEC) power-law model with Wilms
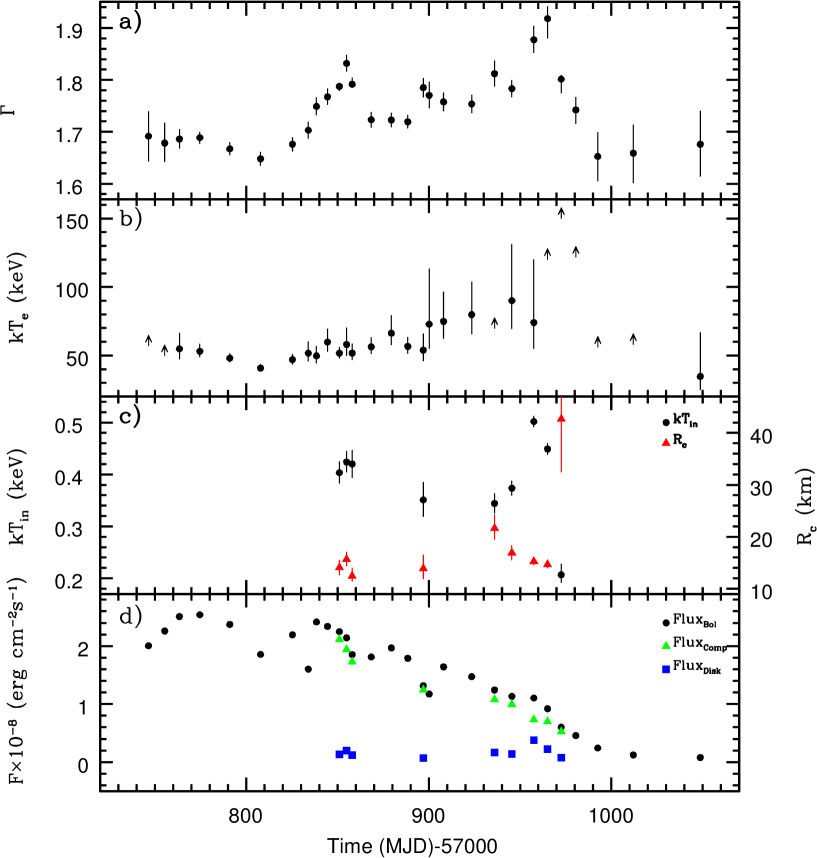
et al. (2000) cosmic abundances and Verner et al. (1996) cross-sections for the interstellar absorption. In Figure 3 we show the evolution of the spectral parameters.
NH shows values around (0.6-0.7) 1022 cm-2, with a peak value at 0.9 1022 cm-2 (MJD 57960.72).
The photon index () remains between 1.5 and 1.7 throughout the whole outburst, with the exception of significant increases during the three XRT peaks and BAT dips observed over the periods of spectral softening (Fig. 1). The XRT spectrum corresponding to the first peak (2017 April 11, 032) shows a photon index 2.1, while on May 22 (038) we obtained a photon index of 1.9. The source reached its steepest spectral slope on July 26 (050) with 2.8, corresponding to the lowest HR value and the highest N0.9 cm-2, even though the reduced is not statistically acceptable (see Tab. LABEL:log).
The large column density variations derived could be caused by the inadequacy of our model, i.e. an accretion disc could be required to fit the data.
We therefore added a multicolor disc black-body (diskbb in XSPEC) component to the previous model in all spectra with > 1.1. We estimated with the F-test that this component is required by all spectra with 1.8.
However, we noted that in a few spectra where < 1.8 with > 1.1, the bad residuals are due to the known strong instrumental silicon (1.84 keV) and gold (2.2 keV) edges555https://heasarc.gsfc.nasa.gov/docs/heasarc/caldb/swift/docs/xrt/SWIFT-XRT-CALDB-09_v19.pdf, so these fits can be considered acceptable.

4.3 Broadband X-ray spectra
We improved the spectral analysis by adding averaged BAT spectra in order to perform a broadband fit.
Using the light curves and HRs (see Fig. 1), we selected good time intervals (GTIs, see Tab. 4) based on two selection criteria: 1) constant HR in both BAT and XRT, 2) BAT flux variation lower than 20, with the exception of the two last intervals where the variation is about 30. We point out that there are a number of BAT GTIs averaged spectra which do not overlap with any XRT observations.
On the other hand, we selected one XRT spectrum for each GTI, making sure that it was consistent, in terms of spectral parameters and flux, with the other XRT spectra within the same GTI.
In the broadband spectra we introduced a systematic error of 2 according to the instrument calibration guidelines.
The broadband spectra were fitted with an absorbed thermal Comptonisation model (tbabs plus nthcomp in XSPEC, see Tab. 4). We assumed that the seed photons followed a disc black-body distribution (parameter inptype1) and we fixed the seed photon temperature at 0.1 keV every time the disc black-body component was not required.
We verified that the diskbb component, when required, improved our fits significantly (F-test values always lower than 810-5).
When fitting all spectra with a constant NH, we noticed statistically significant discrepancies in the residuals of several spectra, so that we left this parameter free to vary.
However, we fitted simultaneously the nine spectra in which the disc component was required, keeping the NH tied (see Tab. 4).
The photon index varies from 1.6 up to 1.9 (see panel a in Fig. 4) while the electron temperature (kTe, see panel b in Fig. 4) is well constrained when the source is bright in hard X-ray. However, in some cases, in particular during the last spectral softening, we only obtained a lower limit on this parameter. Extra components in addition to the thermal Comptonisation could play a role (i.e., non-thermal Comptonisation, reflection) in the intermediate states.
Nevertheless, the BAT statistics and the poor high energy coverage do not allow us to disentangle the X-ray continuum of BHTs.
The thermal disc component is well detected in the spectra collected during the three peaks observed in the XRT light curve.
The inner disc temperature (kTin) varies between 0.2 and 0.5 keV, the latter was observed during the third peak softening (see panel c in Fig. 4). Our findings are in agreement with Muñoz-Darias et al. (2011) who found that the presence of the accretion disc is detected when the fractional rms is 20%.
In the spectra collected during the peak of the three softenings (spectra 12, 17 and 23 in Tab. 4), we estimated that the disc flux contributes 9, 5 and 34, respectively, to the total unabsorbed bolometric flux of GRS 1716–249.
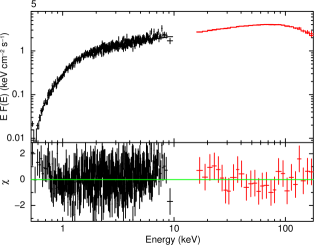
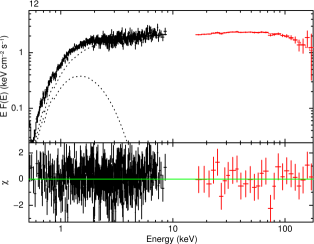
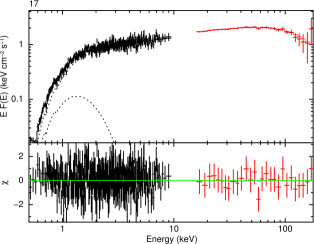
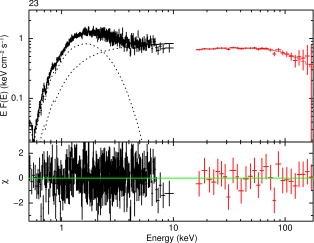
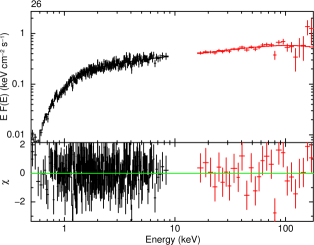
In Fig. 5 we show energy spectra, models and residuals for six representative observations: the three softening peaks (HIMS), one bright HS spectrum (5), one HIMS spectrum collected during the outburst decreasing phase (26) and a HS spectrum (28) collected before the source quiescence.
In addition, we have estimated the inner disc radius as a function of the inclination angle (see Tab. 4) from the diskbb normalization. Then we applied the correction factor between the apparent and true inner radius by Kubota et al. (1998) and the hardening factor of 1.7 (Shimura & Takahara, 1995). In Fig. 6 (left), we plot Rin (cos (hereafter Rc) versus kTin which shows that most of our measurements are consistent with a constant radius R15 km. There is only one point (at lower temperature) that appears to have a significantly higher inner disc radius and a second point with a value (23 km) which is not consistent with the mean radius. We also estimated whether the disc luminosity varies as a function of the inner disc temperature according to L T4. In Fig. 6 (right) we plot the observed disc flux and temperature against each other for all observations where Rc was almost constant. The power-law index from the best-fit is ((dof) = 4.5(5)). The probability to have the obtained is of 0.52. This suggests that the inner disc temperature variations are driven only by changes in mass accretion rate at constant inner disc radius, and appears inconsistent with a varying inner disc radius at constant mass accretion rate (L T4/3; Done et al., 2007). This is particularly evident within the third softening when a flux variation of about a factor of three is observed in combination with a constant Rc and an increase of kTin (see Tab. 4 and Fig. 4, c).
4.4 Radio and correlation with X-rays
In Figure 7, we show the radio/X-ray luminosity correlation combining data made available by Bahramian
et al. (2018) and references therein666https://github.com/arushton/XRB-LrLx_pub. All X-ray luminosities are calculated in the 1–10 keV energy range.
We also added a simultaneous XRT (in hard state, see Del Santo
et al. 2016) and radio observation performed on MJD 56187.99 of the source Swift J174510.8–262411 (hereafter Swift J1745–26) which has been never taken into account in previous radio/X-ray luminosity correlation planes.
We estimated a X-ray luminosity for Swift J1745–26 of 4.4 1037 erg s-1 at a distance of 7 kpc (Muñoz-Darias
et al., 2013) and we used the 5 GHz radio flux density from Curran
et al. (2014).
We measured the X-ray flux of GRS 1716–249 in the 1–10 keV energy band, using data that were quasi-simultaneous with the radio observations performed at 5 and 9 GHz (see Tab. 3). We estimated X-ray luminosities (d=2.4 kpc) of 2.8 1036 erg s-1 on MJD 57793, 4.4 1036 erg s-1 on MJD 57805, 2.8 1036 erg s-1 on MJD 57865, 9.4 1035 erg s-1 on MJD 57977 and 7.0 1035 erg s-1 on MJD 57978.
GRS 1716–249 is located on the branch consistent with the slope of 1.4.
The radio spectral indices measured by ATCA at the beginning ( -0.150.08 on MJD 57793.835) and close to the end of the outburst ( -0.070.19 on MJD 57977.256) by VLA are both consistent with a flat-spectrum compact jet.
Espinasse &
Fender (2018) performed a study on a sample of 17 bright BHBs in hard state. They show that the radio spectral indices distribution could be related to the position of the sources on the radio/X-ray luminosity correlation plane (see Sec. 5).


∗ broadband spectra fitted all together keeping linked NH and letting the other parameters to vary.
| n | Seq. | MJD Start | MJD Stop | N 1022 | kTe | kTin | Rin (cos | Flux 10-8 | (dof) | |||
|---|---|---|---|---|---|---|---|---|---|---|---|---|
| () | (cm-2) | (keV) | (keV) | (km) | (erg cm-2 s-1) | |||||||
| Bol | Disc | Comp | ||||||||||
| (1) | (2) | (3) | (4) | (5) | (6) | (7) | (8) | (9) | (10) | (11) | ||
| 1 | - | 57740.08 | 57752.85 | - | 1.69 | >57 | - | - | 2.01 | - | 2.01 | 1.22(25) |
| 2 | - | 57753.24 | 57757.49 | - | 1.68 | >50 | - | - | 2.26 | - | 2.26 | 1.01(25) |
| 3 | - | 57760.41 | 57766.39 | - | 1.69 | 55 | - | - | 2.51 | - | 2.51 | 0.91(25) |
| 4 | - | 57769.24 | 57779.96 | - | 1.69 | 53 | - | - | 2.54 | - | 2.54 | 0.97(25) |
| 5 | 005 | 57780.01 | 57801.96 | 0.69 | 1.67 | 48 | - | - | 2.37 | - | 2.37 | 1.01(399) |
| 6 | 020 | 57802.01 | 57813.70 | 0.61 | 1.65 | 41 | - | - | 1.86 | - | 1.86 | 1.18(388) |
| 7 | 022 | 57818.61 | 57831.99 | 0.70 | 1.68 | 47 | - | - | 2.19 | - | 2.19 | 0.99(401) |
| 8 | 025 | 57832.02 | 57835.98 | 0.67 | 1.70 | 52 | - | - | 1.60 | - | 1.60 | 0.89(410) |
| 9 | 026 | 57836.02 | 57840.96 | 0.57 | 1.75 | 50 | - | - | 2.42 | - | 2.42 | 0.90(359) |
| 10 | 027 | 57841.00 | 57848.00 | 0.58 | 1.77 | 60 | - | - | 2.34 | - | 2.34 | 1.03(415) |
| 11∗ | 030 | 57848.06 | 57853.97 | 0.59 | 1.79 | 52 | 0.40 | 14.1 | 2.25 | 0.13 | 2.12 | 1.12(3411) |
| 12∗ | 032 | 57854.02 | 57855.96 | 0.59 | 1.83 | 58 | 0.42 | 15.6 | 2.14 | 0.20 | 1.94 | 1.12(3411) |
| 13∗ | 034 | 57856.01 | 57860.00 | 0.59 | 1.79 | 52 | 0.42 | 12.5 | 1.85 | 0.12 | 1.73 | 1.12(3411) |
| 14 | 035 | 57860.00 | 57876.96 | 0.62 | 1.72 | 56 | - | - | 1.81 | - | 1.81 | 1.00(262) |
| 15 | 036 | 57877.00 | 57881.95 | 0.71 | 1.72 | 66 | - | - | 1.97 | - | 1.97 | 1.09(550) |
| 16 | 037 | 57882.00 | 57894.97 | 0.62 | 1.72 | 57 | - | - | 1.79 | - | 1.79 | 0.96(563) |
| 17∗ | 038 | 57895.02 | 57898.94 | 0.59 | 1.79 | 54 | 0.35 | 13.9 | 1.32 | 0.07 | 1.24 | 1.12(3411) |
| 18 | 039 | 57899.05 | 57901.32 | 0.54 | 1.77 | 73 | - | - | 1.17 | - | 1.17 | 1.11(287) |
| 19 | 040 | 57902.27 | 57913.89 | 0.59 | 1.76 | 75 | - | - | 1.64 | - | 1.64 | 0.93(321) |
| 20 | 043 | 57914.01 | 57932.96 | 0.54 | 1.75 | 80 | - | - | 1.47 | - | 1.47 | 0.96(380) |
| 21∗ | 045 | 57933.01 | 57938.95 | 0.59 | 1.81 | >70 | 0.34 | 21.6 | 1.24 | 0.16 | 1.08 | 1.12(3411) |
| 22∗ | 047 | 57939.05 | 57951.97 | 0.59 | 1.78 | 90 | 0.37 | 16.9 | 1.13 | 0.14 | 0.99 | 1.12(3411) |
| 23∗ | 050 | 57952.09 | 57963.00 | 0.59 | 1.88 | 74 | 0.50 | 15.2 | 1.11 | 0.38 | 0.73 | 1.12(3411) |
| 24∗ | 052 | 57963.09 | 57966.98 | 0.59 | 1.92 | >120 | 0.45 | 14.7 | 0.92 | 0.22 | 0.70 | 1.12(3411) |
| 25∗ | 056 | 57967.02 | 57977.99 | 0.59 | 1.80 | >150 | 0.21 | 42.7 | 0.60 | 0.08 | 0.52 | 1.12(3411) |
| 26 | 057 | 57978.08 | 57982.99 | 0.51 | 1.74 | >122 | - | - | 0.46 | - | 0.46 | 0.95(278) |
| 27 | - | 57983.06 | 58001.97 | - | 1.65 | >56 | - | - | 0.24 | - | 0.24 | 0.90(25) |
| 28 | 061 | 58002.03 | 58022.0 | 0.72 | 1.66 | >58 | - | - | 0.12 | - | 0.12 | 1.08(71) |
| 29 | 066 | 58022.0 | 58075.38 | 0.70 | 1.68 | 35 | - | - | 0.08 | - | 0.08 | 1.23(101) |
5 discussion
GRS 1716–249 increases the sample of X-ray binaries that have shown “failed" state transitions outburst, in which the source does not complete the full q-track pattern in the HID. In spite of the three softening events that occurred during the outburst, GRS 1716–249 did not make the transition to the canonical soft state (neither to the SIMS). This is supported by two findings: the disc luminosity never dominates the emission of the source and the fractional rms never decreases below 10.
Tetarenko et al. (2016) reported on an all-sky database of galactic BHTs. They found that 40% of sources are “hard only", including also sources showing “failed" state transition outbursts (i.e., HS-HIMS only).
These authors suggest that the mass transfer rate () over the all outburst could be insufficient to allow the source to perform the transition to the soft states. Indeed, they found that all “hard only" sources show outburst peak luminosities lower than 0.11 LEdd.
The peak bolometric luminosity of GRS 1716–249 (L0.03 LEdd) is in agreement with their limit.
On the other hand, the “failed" state transition source Swift J1745–26 (Del Santo
et al., 2016) showed L0.37 LEdd (d 7 kpc; Muñoz-Darias
et al., 2013), which is more than a factor of three higher than the upper limit reported in Tetarenko et al. (2016).
This would suggest that the overall mass-transfer rate during the outburst is not the only parameter involved in the “failed" state transition behavior or that the limit is higher than what Tetarenko et al. (2016) thought.
However, even though the most widely accepted distance of Swift J1745–26 is 7 kpc (Curran
et al., 2014; Kalemci
et al., 2014), this value is poorly constrained (Muñoz-Darias
et al., 2013).
Thus, if we assume a distance lower than 4 kpc, even the BHT Swift J1745–26 would fall within the proposed upper limit of 0.11 LEdd.
In the truncated disc model scenario, the inner radius of the accretion disc is smaller when we observe softer spectra. In GRS 1716–249 this occurs up to a certain point when kTin starts to increase at constant inner disc radius. Thus, we argue that GRS 1716–249 might have reached the ISCO in the HIMS. We folded the XRT light curves at the binary system period (14.7 hr), covering about 80% of this, and we did not find any evidence for dips and/or eclipses. In addition, we also folded the INTEGRAL/JEM-X light curve (3-6 keV) collected during the 96 ks of INTEGRAL ToO triggered by our team during a multi-wavelength campaign in the HS (results on this will be presented in a further paper). This light curve covered 100% of the binary period and even in this case we did not find any evidence of features indicative of a high inclination system for GRS 1716–249, which is likely to be ruled out. Assuming an inclination angle the upper limit < 60∘ (Frank et al., 1987) and using the inner disc radius R15 km, we obtain an upper limit RISCO < 21 km. The lower limit on the BH mass (MBH > 4.9 M⊙, Masetti et al., 1996) allows us to estimate a lower limit on the gravitational radius as Rg > 7.3 km which results in a RISCO < 3 Rg. In the Schwarzschild metric RISCO = 6 Rg, therefore the black hole in GRS 1716–249 would be rotating with a spin lower limit of (with the dimensionless spin). We are aware that this is only a rough estimation, due to the extreme simplicity of the disc model used in this paper.
The radio emission of GRS 1716–249 is consistent with coming from a compact jet, despite Rin being at the ISCO. However, we do not have an adequate radio coverage (e.g. a regular radio sample or VLBI observations) during the outburst and in particular during the soft episodes. It is worth noting that, it does not appear that GRS 1716–249 got soft enough to quench the compact jet and to create transient ejecta (Fender et al., 2004). The radio observations were performed when GRS 1716–249 was in HS-HIMS (see Sec. 3). We can not exclude that the jet changed its properties when the X-ray emission became softer and that there were rapid ejection events, quenching or steepening episodes we did not observe. This imply that the jet could be recovered in short times, between one radio observation and the next one.
An important tool to investigate the emission properties of BHTs is the radio/X-ray correlation.
Coriat
et al. (2011) suggested that the radio/X-ray correlation of the “outliers" (or radio-quiet BHTs with L L) is produced by a radiatively efficient accretion flow. It means that L, while the radio-loud branch (L L) would result from inefficient accretion where L.
Both GRS 1716–249 and Swift J1745–26 are located on the steeper branch and they increase the number of radio-quiet BHTs.
Recently, the accretion efficiency picture proposed to explain the two different branches is challenged by the recent finding that radio-quiet tend to have a negative spectral index (S) while for the radio-loud sources a positive was observed. This suggests different core jet properties (rather than accretion flow) for the two classes of sources (Espinasse &
Fender, 2018).
Furthermore, we observe that the source never left the radio-quiet branch, again arguing against a quenching by the jet.
The power-law slopes of the GRS 1716–249 radio spectra, as also the Swift J1745–26 radio slope ( 0; Curran
et al., 2014), are within the statistical distribution of the radio-quiet slope reported by Espinasse &
Fender (2018).
Recently Motta
et al. (2018) proposed that the origin of different radio loudness of BHTs is due to the geometric effects due to the inclination of the sources: i.e the radio-quiet sources would be at high inclination. However, GRS 1716–249 is a radio-quiet system most likely at low inclination. Nevertheless dips can be transient as observed in H 1743–322 (Motta
et al. 2015 and references therein), so the low inclination of GRS 1716–249 has to be confirmed.
The radio-quiet/X-ray-bright behaviour of the source might be related to the very small inner disc radius that we infer from our disc modeling. Indeed, the small inner disc radius does not necessarily imply the disc extends uninterrupted from its outer parts and down to the ISCO. Coupled disc/corona condensation evaporation models, developed in the framework of the truncated disc model, predict that when the sources are close to intermediate states, the inner hot-flow may re-condensate into an inner cool ring which would present observational signatures that are very similar to that of a full disc (Meyer-Hofmeister et al., 2009). Then, the contribution from the soft photons of the disc would make the accretion flow brighter in X-rays with respect to an accretion flow at the same accretion rate (and therefore radio luminosity) in which this mini inner-disc would be absent. Meyer-Hofmeister & Meyer (2014) argue that this could drive the different slope of the radio X-ray correlation of radio-quiet sources. Our results appear to be consistent with their picture.
6 Conclusions
In this work we have presented the X-ray spectral and timing analysis of the BHT GRS 1716–249 during its 2016-2017 outburst. We analyzed the XRT and BAT observations collected during the whole outburst occurred from December 2016 to October 2017. In addition, we have reported on five radio observations and their correlation with X-ray data. Our main results can be summarized as follows:
-
1)
GRS 1716–249 can be added at the sample of the known BHTs that show a “failed" state transition outburst. During the outburst the source showed three softer episodes without making the transition to the soft state. Timing results and spectral parameters evolution are consistent with the source being in the HS at the beginning and at the end of the outburst, and in the HIMS during the spectral softening.
-
2)
Our data suggest that the inner disc might have reached the ISCO during the three softening episodes, even-though the source was in the HIMS. However, disc/corona condensation-evaporation models predict that in the intermediate state the hot accretion flow may re-condensate into an inner mini-disc, mimicking the emission of the full disc.
-
3)
The source might host a rapidly rotating BH with a rough spin lower limit of 0.8.
-
4)
In the radio/X-ray luminosity plane GRS 1716–249 is located on the radio-quiet branch, which is in agreement with the X-ray brightness due to the condensed inner accretion flow.
Acknowledgements
We acknowledge financial contribution from the agreement ASI-INAF n.2017-14-H.0. MDS acknowledges funding from the European Unions Horizon 2020 Programme under the AHEAD project (grant agreement nr. 654215). TB thanks M. Capalbi for useful XRT data analysis support. TB, MDS and AD thank A. Marino for the INTEGRAL/JEM-X data analysis. TB and MDS thank M. Coriat for interesting scientific discussion on the X-ray/radio correlation. This work made use of data supplied by the UK Swift Science Data Centre at the University of Leicester. The Australia Telescope Compact Array and the Long Baseline Array are both part of the Australia Telescope National Facility which is funded by the Australian Government for operation as a National Facility managed by CSIRO. This work made use of the Swinburne University of Technology software correlator, developed as part of the Australian Major National Research Facilities Programme. This work was supported by resources provided by the Pawsey Supercomputing Centre with funding from the Australian Government and the Government of Western Australia. The National Radio Astronomy Observatory is a facility of the National Science Foundation operated under cooperative agreement by Associated Universities, Inc. JCAM-J is the recipient of an Australian Research Council Future Fellowship (FT140101082). JM acknowledges support from PNHE in France, from the OCEVU Labex (ANR-11-LABX-0060) and the AMIDEX project (ANR-11-IDEX-0001-02) funded by the “Investment d’Avenir" French government program managed by ANR.
References
- Bahramian et al. (2018) Bahramian A., et al., 2018, Radio/X-ray correlation database for X-ray binaries, doi:10.5281/zenodo.1252036, https://doi.org/10.5281/zenodo.1252036
- Ballet et al. (1993) Ballet J., Denis M., Gilfanov M., Sunyaev R., Harmon B. A., Zhang S. N., Paciesas W. S., Fishman G. J., 1993, IAU Circ., 5874
- Barthelmy et al. (2005) Barthelmy S. D., et al., 2005, Space Sci. Rev., 120, 143
- Belloni & Motta (2016) Belloni T. M., Motta S. E., 2016, in Bambi C., ed., Astrophysics and Space Science Library Vol. 440, Astrophysics of Black Holes: From Fundamental Aspects to Latest Developments. p. 61 (arXiv:1603.07872), doi:10.1007/978-3-662-52859-4_2
- Belloni et al. (2006) Belloni T., et al., 2006, MNRAS, 367, 1113
- Belloni et al. (2011) Belloni T. M., Motta S. E., Muñoz-Darias T., 2011, Bulletin of the Astronomical Society of India, 39, 409
- Blandford & Königl (1979) Blandford R. D., Königl A., 1979, ApJ, 232, 34
- Burrows et al. (2005) Burrows D. N., et al., 2005, Space Sci. Rev., 120, 165
- Capitanio et al. (2009) Capitanio F., Belloni T., Del Santo M., Ubertini P., 2009, MNRAS, 398, 1194
- Corbel & Fender (2002) Corbel S., Fender R. P., 2002, ApJ, 573, L35
- Corbel et al. (2000) Corbel S., Fender R. P., Tzioumis A. K., Nowak M., McIntyre V., Durouchoux P., Sood R., 2000, A&A, 359, 251
- Corbel et al. (2003) Corbel S., Nowak M. A., Fender R. P., Tzioumis A. K., Markoff S., 2003, A&A, 400, 1007
- Corbel et al. (2013) Corbel S., Coriat M., Brocksopp C., Tzioumis A. K., Fender R. P., Tomsick J. A., Buxton M. M., Bailyn C. D., 2013, MNRAS, 428, 2500
- Coriat et al. (2011) Coriat M., et al., 2011, MNRAS, 414, 677
- Curran et al. (2014) Curran P. A., et al., 2014, MNRAS, 437, 3265
- Del Santo et al. (2009) Del Santo M., et al., 2009, MNRAS, 392, 992
- Del Santo et al. (2016) Del Santo M., et al., 2016, MNRAS, 456, 3585
- Del Santo et al. (2017a) Del Santo M., D’Ai’ A., Bassi T., Segreto A., Belloni T., Cusumano G., La Parola V., 2017a, The Astronomer’s Telegram, 10036
- Del Santo et al. (2017b) Del Santo M., et al., 2017b, The Astronomer’s Telegram, 10069
- Deller et al. (2011) Deller A. T., et al., 2011, PASP, 123, 275
- Done et al. (2007) Done C., Gierliński M., Kubota A., 2007, A&ARv, 15, 1
- Dunn et al. (2010) Dunn R. J. H., Fender R. P., Körding E. G., Belloni T., Cabanac C., 2010, MNRAS, 403, 61
- Espinasse & Fender (2018) Espinasse M., Fender R., 2018, MNRAS, 473, 4122
- Evans et al. (2007) Evans P. A., et al., 2007, A&A, 469, 379
- Evans et al. (2009) Evans P. A., et al., 2009, MNRAS, 397, 1177
- Fender et al. (1999) Fender R., et al., 1999, ApJ, 519, L165
- Fender et al. (2001) Fender R. P., Hjellming R. M., Tilanus R. P. J., Pooley G. G., Deane J. R., Ogley R. N., Spencer R. E., 2001, MNRAS, 322, L23
- Fender et al. (2004) Fender R. P., Belloni T. M., Gallo E., 2004, MNRAS, 355, 1105
- Fender et al. (2006) Fender R. P., Stirling A. M., Spencer R. E., Brown I., Pooley G. G., Muxlow T. W. B., Miller-Jones J. C. A., 2006, MNRAS, 369, 603
- Ferrigno et al. (2012) Ferrigno C., Bozzo E., Del Santo M., Capitanio F., 2012, A&A, 537, L7
- Frank et al. (1987) Frank J., King A. R., Lasota J.-P., 1987, A&A, 178, 137
- Gallo et al. (2003) Gallo E., Fender R. P., Pooley G. G., 2003, MNRAS, 344, 60
- Gehrels et al. (2004) Gehrels N., et al., 2004, ApJ, 611, 1005
- Greisen (2003) Greisen E. W., 2003, in Heck A., ed., Astrophysics and Space Science Library Vol. 285, Information Handling in Astronomy - Historical Vistas. p. 109, doi:10.1007/0-306-48080-8_7
- Harmon et al. (1993) Harmon B. A., Fishman G. J., Paciesas W. S., Zhang S. N., 1993, IAU Circ., 5900
- Hjellming et al. (1996) Hjellming R. M., Rupen M. P., Shrader C. R., Campbell-Wilson D., Hunstead R. W., McKay D. J., 1996, ApJ, 470, L105
- Homan & Belloni (2005) Homan J., Belloni T., 2005, Ap&SS, 300, 107
- Kalemci et al. (2014) Kalemci E., et al., 2014, MNRAS, 445, 1288
- Kubota et al. (1998) Kubota A., Tanaka Y., Makishima K., Ueda Y., Dotani T., Inoue H., Yamaoka K., 1998, PASJ, 50, 667
- Laurent & Titarchuk (1999) Laurent P., Titarchuk L., 1999, ApJ, 511, 289
- Leahy et al. (1983) Leahy D. A., Elsner R. F., Weisskopf M. C., 1983, ApJ, 272, 256
- Masetti et al. (1996) Masetti N., Bianchini A., Bonibaker J., della Valle M., Vio R., 1996, A&A, 314, 123
- Masumitsu et al. (2016) Masumitsu T., et al., 2016, The Astronomer’s Telegram, 9895
- McMullin et al. (2007) McMullin J. P., Waters B., Schiebel D., Young W., Golap K., 2007, in Shaw R. A., Hill F., Bell D. J., eds, Astronomical Society of the Pacific Conference Series Vol. 376, Astronomical Data Analysis Software and Systems XVI. p. 127
- Meyer-Hofmeister & Meyer (2014) Meyer-Hofmeister E., Meyer F., 2014, A&A, 562, A142
- Meyer-Hofmeister et al. (2009) Meyer-Hofmeister E., Liu B. F., Meyer F., 2009, A&A, 508, 329
- Mirabel (1994) Mirabel I. F., 1994, ApJS, 92, 369
- Motta et al. (2009) Motta S., Belloni T., Homan J., 2009, MNRAS, 400, 1603
- Motta et al. (2015) Motta S. E., Casella P., Henze M., Muñoz-Darias T., Sanna A., Fender R., Belloni T., 2015, MNRAS, 447, 2059
- Motta et al. (2018) Motta S. E., Casella P., Fender R. P., 2018, MNRAS, 478, 5159
- Muñoz-Darias et al. (2011) Muñoz-Darias T., Motta S., Belloni T. M., 2011, MNRAS, 410, 679
- Muñoz-Darias et al. (2013) Muñoz-Darias T., et al., 2013, MNRAS, 432, 1133
- Negoro et al. (2016) Negoro H., et al., 2016, The Astronomer’s Telegram, 9876
- Niedźwiecki & Zdziarski (2006) Niedźwiecki A., Zdziarski A. A., 2006, MNRAS, 365, 606
- Poutanen & Coppi (1998) Poutanen J., Coppi P. S., 1998, Physica Scripta Volume T, 77, 57
- Remillard & McClintock (2006) Remillard R. A., McClintock J. E., 2006, ARA&A, 44, 49
- Romano et al. (2006) Romano P., et al., 2006, A&A, 456, 917
- Sault et al. (1995) Sault R. J., Teuben P. J., Wright M. C. H., 1995, in Shaw R. A., Payne H. E., Hayes J. J. E., eds, Astronomical Society of the Pacific Conference Series Vol. 77, Astronomical Data Analysis Software and Systems IV. p. 433 (arXiv:astro-ph/0612759)
- Segreto et al. (2010) Segreto A., Cusumano G., Ferrigno C., La Parola V., Mangano V., Mineo T., Romano P., 2010, A&A, 510, A47
- Shakura & Sunyaev (1973) Shakura N. I., Sunyaev R. A., 1973, A&A, 24, 337
- Shimura & Takahara (1995) Shimura T., Takahara F., 1995, ApJ, 445, 780
- Soleri et al. (2013) Soleri P., et al., 2013, MNRAS, 429, 1244
- Tanaka (1993) Tanaka Y., 1993, IAU Circ., 5877
- Tetarenko et al. (2016) Tetarenko B. E., Sivakoff G. R., Heinke C. O., Gladstone J. C., 2016, ApJS, 222, 15
- Verner et al. (1996) Verner D. A., Ferland G. J., Korista K. T., Yakovlev D. G., 1996, ApJ, 465, 487
- Wilms et al. (2000) Wilms J., Allen A., McCray R., 2000, ApJ, 542, 914
- Zdziarski (2000) Zdziarski A. A., 2000, in Martens P. C. H., Tsuruta S., Weber M. A., eds, IAU Symposium Vol. 195, Highly Energetic Physical Processes and Mechanisms for Emission from Astrophysical Plasmas. p. 153 (arXiv:astro-ph/0001078)
- Zdziarski & Gierliński (2004) Zdziarski A. A., Gierliński M., 2004, Progress of Theoretical Physics Supplement, 155, 99
- della Valle et al. (1993) della Valle M., Mirabel I. F., Cordier B., Bonibaker J., Stirpe G., Rodriguez L. F., 1993, IAU Circ., 5876
- della Valle et al. (1994) della Valle M., Mirabel I. F., Rodriguez L. F., 1994, A&A, 290, 803