Cluster spin-glass behaviour and memory effect in Cr0.5Fe0.5Ga
Abstract
We report the structural, static, and dynamic properties of Cr0.5Fe0.5Ga by means of powder x-ray diffraction, DC magnetization, heat capacity, AC susceptibility, magnetic relaxation, and magnetic memory effect measurements. DC magnetization and AC susceptibility studies reveal a spin-glass transition at around K. An intermediate value of the relative shift in freezing temperature , obtained from the AC susceptibility data reflects the formation of cluster spin-glass states. The frequency dependence of is also analyzed within the framework of dynamic scaling laws such as power law and Vogel-Fulcher law. The analysis using power law yields a characteristic time constant for a single spin flip s and critical exponent . On the other hand, the Vogel-Fulcher law yields the characteristic time constant for a single spin flip s, Vogel-Fulcher temperature K, and an activation energy K. The value of and along with a non-zero value of provide further evidence for the cluster spin-glass behaviour. The magnetic field dependent follows the de Almeida-Thouless (AT) line with a non-mean-field type instability, reflecting either a different universality class or strong anisotropy in the spin system. A detailed non-equilibrium dynamics study via relaxation and memory effect experiments demonstrates the evolution of the system through a number of intermediate metastable states and striking memory effects. All the above observations render a cluster spin-glass behaviour in Cr0.5Fe0.5Ga which is triggered by magnetic frustration due to competing antiferromagnetic and ferromagnetic interactions and magnetic site disorder. Moreover, the asymmetric response of magnetic relaxation with respect to the change in temperature, below the freezing temperature can be explained by the hierarchical model.
pacs:
75.47.Np, 75.50.Lk, 75.10.NrI Introduction
In the past years, alloys showing spin-glass (SG) behaviour have been widely pursued in order to study exchange bias effect, slow dynamics, memory effect, aging effect etc.Fisher and Hertz (1991); Mydosh (1993); Binder and Young (1986); Weissman (1993); Jonason et al. (1998); Fisher and Huse (1988); Karmakar et al. (2008); Chatterjee et al. (2009) SG is basically a disordered ground state where the spins are frozen along arbitrary direction, below a critical temperature. It is commonly believed that SG appears in systems where magnetic long-range-ordering (LRO) is disturbed by site disorder and magnetic frustration.Binder and Young (1986); Mydosh (1993) Examples of such systems include metallic SGs where magnetic impurities are randomly diluted in a nobel metal, geometrically frustrated lattices where lattice topology precludes the minimization of energy, systems frustrated due to competing antiferromagnetic (AFM) and ferromagnetic (FM) interactions or competing nearest neighbour and next nearest neighbour interactions etc.Souletie (1978); Gardner et al. (2010) SG-like non-equilibrium dynamics has been observed in several systems where the basic building blocks responsible for the glassy behaviour are bigger spin entities, rather than individual spins, referred as ”spin-clusters”. Such systems are often characterized by slow dynamics, similar to the classical SGs. Despite an extensive study on SGs, a consensus about the ground state and dynamics in these systems is still lacking. Here, we report the magnetic studies on the diluted alloy Cr0.5Fe0.5Ga which exhibits features that are reminiscent of cluster SG.
The iso-structural alloys CrGa and FeGa crystallize in a Cr5Al8-type rhombohedral structure (space group ) with lattice constants [ Å and Å] and [ Å and Å], respectively.Gourdon et al. (2004) In the unit cell, both Ga and Cr/Fe occupy three inequivalent sites each. They form two types of icosahedra: one is Ga-centered and the other one is Cr/Fe-centered which are alternating along the crystallographic -direction forming chains. Magnetic susceptibility of CrGa is almost temperature independent while for FeGa, it shows a peak at K and a broad maximum at 135 K. Band structure calculations predict weak AFM and dominant FM exchange couplings for CrGa and FeGa, respectively.Gourdon et al. (2004) Therefore, substitution of Fe at the Cr site in CrGa can alter the AFM interaction among the Cr atoms and induce different magnetic states. Ko tried to synthesize Cr1-xFexGa for different values of but they succeeded to synthesize phase pure sample only for .Ko et al. (2010) Neutron powder diffraction on Cr0.5Fe0.5Ga revealed average composition of the powder sample to be Cr0.515Fe0.485Ga with lattice constants Å and Å at room temperature and partial ordering of Cr and Fe atoms among three crystallographic sites. In particular, the Cr and Fe atoms occupy three inequivalent sites: M1(3b), M2(18h), and M3(18h). The refined site occupancies for Cr/Fe are 0.587/0.413, 0.636/0.364, and 0.383/0.617, respectively. Preliminary magnetization measurements suggest the onset of a magnetic ordering at K. Subsequent theoretical calculations indicated that the Fe-Fe and Cr-Fe interactions are FM and AFM, respectively with an overall ferrimagnetic ordering at low temperature.Ko et al. (2010) However, a clear understanding of the ground state properties of this alloy requires a detailed experimental investigation which is not yet done.
In this work, we carried out a comprehensive study of the structural and magnetic properties of Cr0.5Fe0.5Ga. The 50 % Fe substitution at the Cr site induces atomic disorder in the lattice, preserving the original crystal structure. It is found to be a magnetically frustrated system which undergoes a SG transition at low temperatures. The DC magnetization along with the AC susceptibility data render the system a cluster SG-type. Finally, the magnetic memory effect in the system has been demonstrated by the magnetic relaxation and memory effect measurements.
II Experimental details
Polycrystalline Cr0.5Fe0.5Ga sample was synthesized by the conventional solid state reaction technique, taking the constituent elements in the desired stoichiometry. The elements (Fe, Cr, and Ga) used here are of high pure (99.99%) obtained from Sigma Aldrich. The stoichiometric amounts were sealed in a quartz tube in Ar atmosphere. The ampoule was first heated at C for 3 days and then at C for 5 days. The powder x-ray diffraction (XRD) measurements were carried out (PANalytical powder diffractometer with Cu radiation) as a function of temperature using a low temperature attachment (Oxford Phenix). DC and AC magnetization () measurements were performed using a vibrating sample magnetometer (VSM) attachment to the physical property measurement system (PPMS, Quantum Design). Heat capacity () was measured using the heat capacity option in the PPMS, adopting the relaxation technique.
III Results and discussion
III.1 X-ray Diffraction
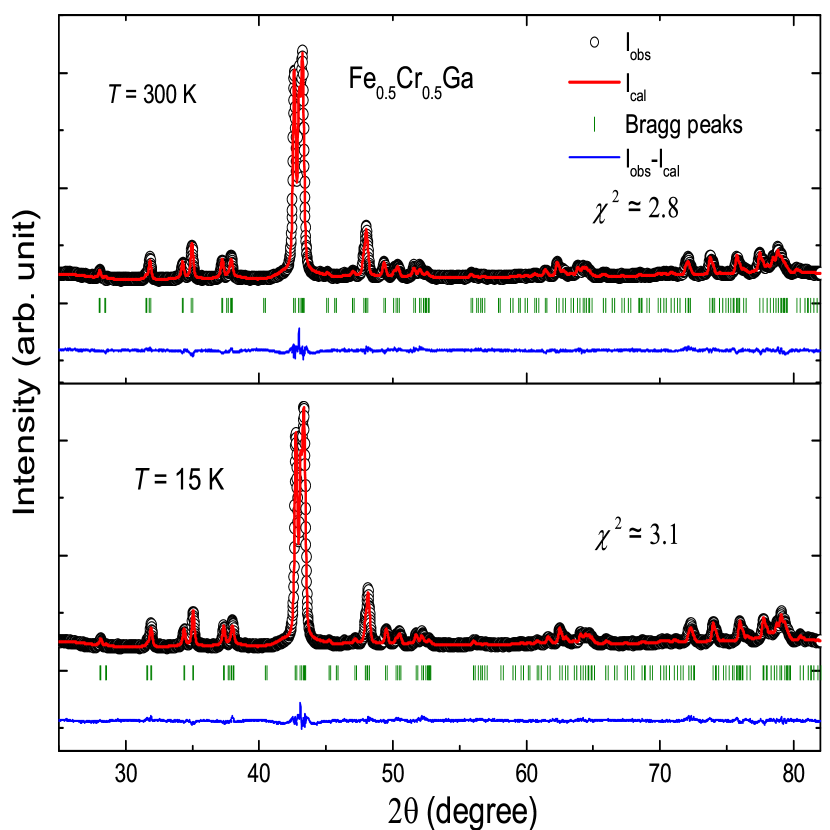
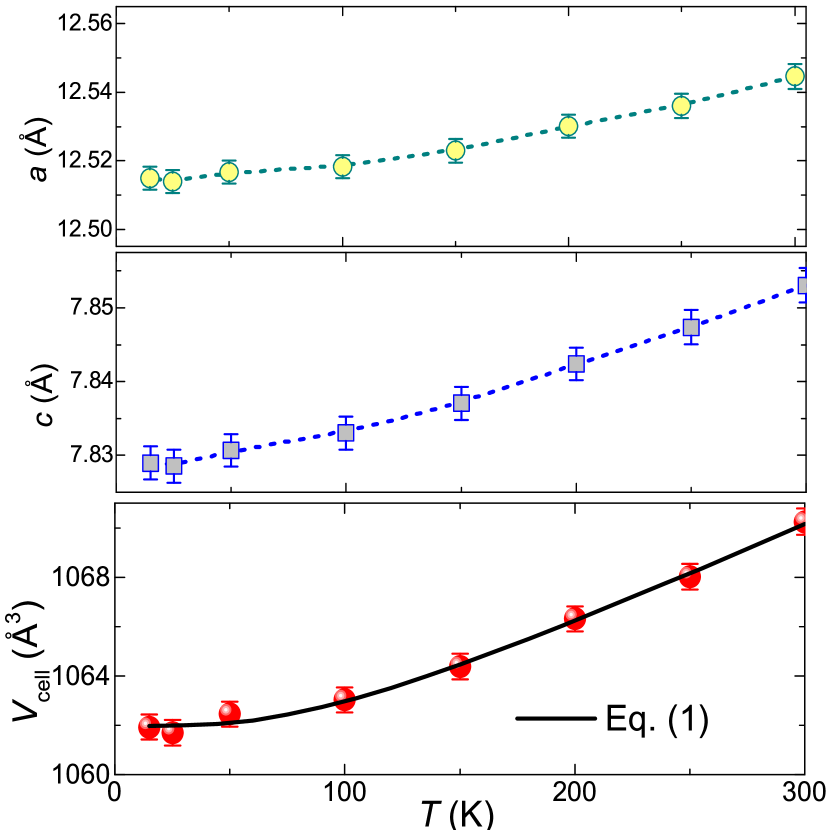
In order to confirm the phase purity and to detect the structural transition, if any, powder XRD was measured at different temperatures. Rietveld refinement of the XRD pattern was carried out using the FULLPROF package.Rodríguez-Carvajal (1993) The initial structural parameters for this purpose were taken from Ref. [Gourdon et al., 2004]. Figure 1 shows the Rietveld refinement of the powder XRD pattern at 300 K and 15 K. A good fitting of the room temperature data with a reduced value of goodness-of-fit () suggests that the sample is phase pure. The obtained lattice constants at room temperature are Å and Å which are consistent with the previous report.Ko et al. (2010) Figure 2 displays the temperature variation of lattice constants and unit cell volume (). No structural transition was observed down to 15 K and the lattice constants and were found to decrease systematically with decreasing temperature. The temperature variation of was fitted by the equationPakhira et al. (2016)
| (1) |
where is the cell volume at K, is the bulk modulus, and is the Grneisen parameter. is the internal energy which can be expressed in terms of the Debye approximation as,
| (2) |
Here, is the number of atoms in the specimen and is the Boltzmann constant. Using this approximation (see the fit in the lower panel of Fig. 2), the Debye temperature () for Cr0.5Fe0.5Ga was estimated to be K.
III.2 DC Magnetization
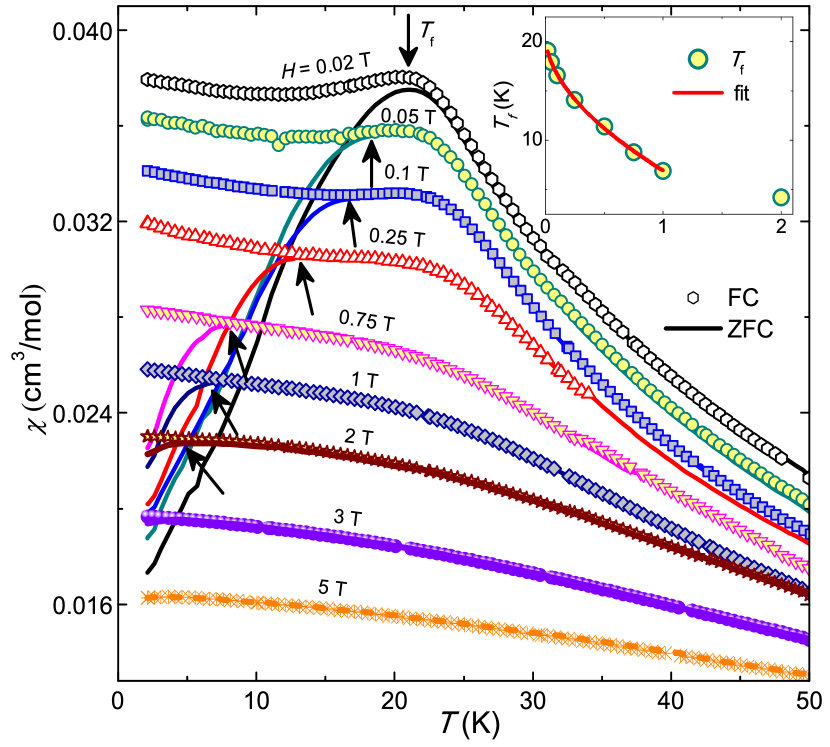
Figure 3 presents the temperature dependent DC susceptibility, measured in different applied fields, during heating after zero-field-cooled (ZFC) and field-cooled (FC) conditions. For T, both ZFC and FC data show a broad peak and a bifurcation at the same temperature possibly suggesting a glass transition around 22 K. The temperature at which the bifurcation occurs is called the freezing temperature, denoted as . In order to elucidate the nature of the transition, we measured at different applied fields for ZFC and FC protocols. As the field increases, the absolute value of decreases systematically and the ZFC data develop a plateau with two broad edges on either side. The low temperature edge corresponding to shifts towards lower temperatures while the edge at the high temperature side shifts towards higher temperatures. Furthermore, the difference between ZFC and FC curves () at low temperatures decreases with increasing magnetic field. The shifting of towards lower temperatures and the reduction in indicate the frozen spin-glass (SG) state below .Binder and Young (1986) For the field above 3 T, is suppressed below 2 K and hence not detectable. The shifting of high temperature edge towards high temperatures with field appears to be due to the onset of a magnetic LRO. However, our heat capacity measurement (discussed later) rules out any magnetic ordering at this temperature. The overall behaviour of is nearly similar to that reported for SG compound U2PdSi3.Li et al. (1998)
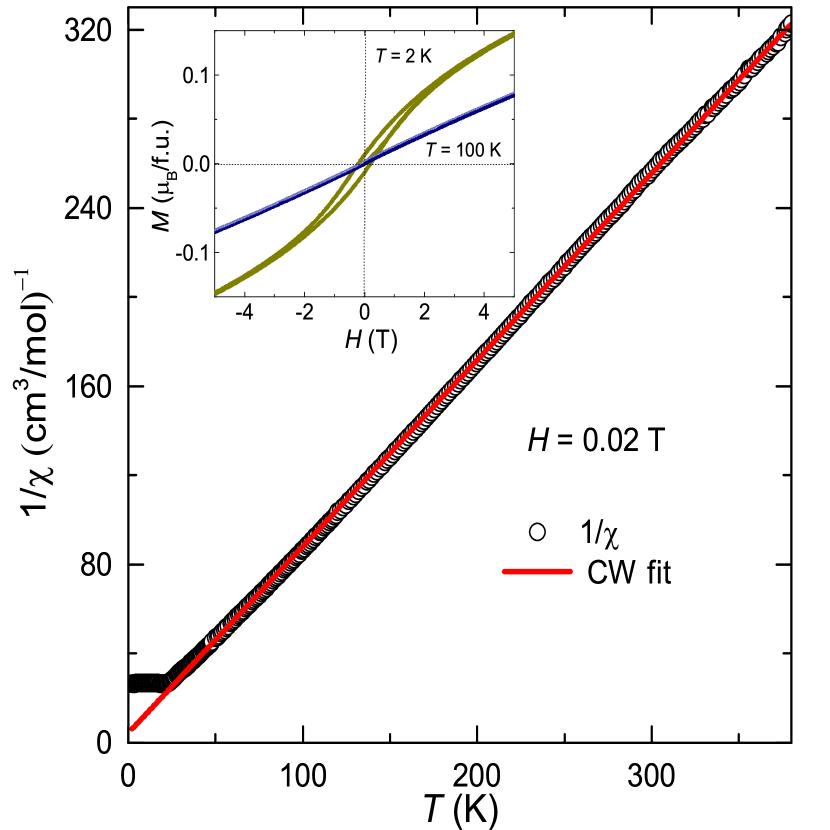
Magnetic isotherm [] measurements were also performed at different temperatures (inset of Fig. 4). At high temperatures, is nearly straight line, as expected in the paramagnetic (PM) region. With decreasing temperature, it develops a curvature which is more pronounced at low temperatures. At the lowest measured temperature of K, it shows a small hysteresis with a coercive field of Oe. However, the value of magnetization even at 9 T (not shown) is much less than the saturation value expected for this alloy. A weak hysteresis and the reduced value of magnetization at 9 T exclude the possibility of a FM/ferrimagnetic transition and establishes low temperature SG behaviour of the compound.Binder and Young (1986); Malinowski et al. (2011)
As shown in Fig. 4, the inverse susceptibility (measured at T) in the high temperature regime ( K) is fitted by the Curie-Wiess (CW) law
| (3) |
where and represent the Curie constant and CW temperature, respectively. The obtained values are cm3K/mol and K. The negative value of signifies the presence of dominant AFM interaction in the system. From the value of , the effective magnetic moment (= , where is the Avogadro’s number) was calculated to be . In spin systems, according to the mean-field theory represents the sum of all the exchange couplings. Our estimated value of is much smaller compared to , which possibly reflects that the system is frustrated due to competing AFM and FM interactions,Nath et al. (2008) as anticipated from the previous theoretical calculations.Ko et al. (2010) In addition to the magnetic site disorder, this competing interactions is also responsible for the low temperature SG behaviour of the system.
The variation of with in the low field region is presented in the inset of Fig. 3. It decreases systematically with increasing field, consistent with the SG transition. In the phase diagram for SG systems, typically, two irreversible lines are observed: Gabay-Toulouse (GT) line () and de Almeida-Thouless (AT) line.Gabay and Toulouse (1981); De Almeida and Thouless (1978) The AT line marks the PM to SG transition which is usually observed for Ising spin systems. On the other hand, in the case of Heisenberg spin systems, both the lines are expected. In the strong anisotropy (strong irreversibility) regime, the system is Ising-type and the line follows AT character whereas in the weak anisotropy regime, the line corresponds to GT line. A quantitative difference is expected in the behavior of AT line in the mean-field and non-mean-field scenarios. According to the non-mean-field scaling theory, the variation of with in the low field region followsMalozemoff et al. (1983)
| (4) |
where is the amplitude, is the value of in the absence of a magnetic field, and is the crossover exponent. In the mean-field model it has a value . In our system, only one irreversible line was observed which could be fitted by Eq. (4). As shown in the inset of Fig. 3, the best fit was obtained for T with K and . This value of is larger than the one expected for the AT line with mean-field instability.De Almeida and Thouless (1978) In several cluster SG systems such as Nd2AgIn3(Ref. Li et al., 2001), U2IrSi3 (Ref. Li et al., 2003), Zn3V3O8 (Ref. Chakrabarty et al., 2014), Nd5Ge3 (Ref. Maji et al., 2011), LiMn2O4 (Ref. Zhang et al., 2018) etc, the authors have reported a mean-field type behaviour.111In these experimental papers the authors have force-fitted their data to a mean-field model rather than attempting a more general non-mean-field type model. An analysis (reported in Ref. Barbara et al., 1981; Dieny and Barbara, 1986) in terms of non-mean-field model [Eq. (4)] on a group of SG systems resulted a large variation of from 5 for canonical Heisenberg SG system MnCu to 3.2 for random-anisotropy SG system -DyNi, suggesting that they all donot belong to the same universality class. This model has also been tested on other SG systems which produce a non-mean-field type exponent.Tabata et al. (2017); Shand et al. (2010); Wang et al. (2004) The obtained value of for our system falls in the intermediate range, reflecting either a different universality class or role of dominant anisotropy in the system.
III.3 Heat Capacity
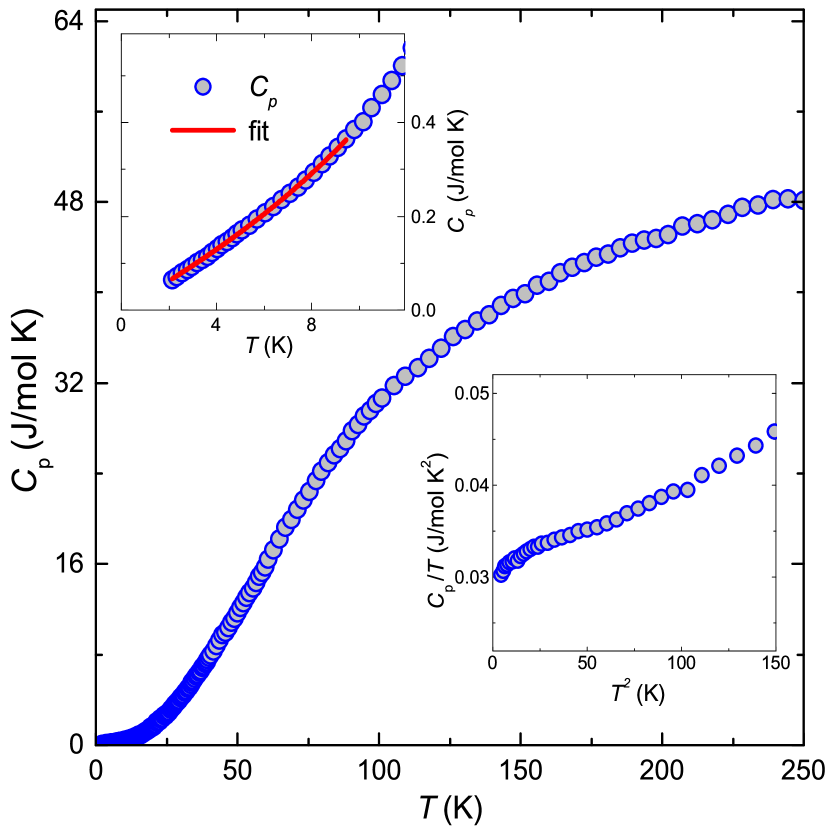
Figure 5 shows the temperature dependent in the absence of magnetic field. No anomaly associated with the magnetic LRO was observed down to 2 K. The value of at K is about 48.2 J/mol-K which is close to the expected Dulong-Petit value J/mol K, where is the gas constant and is the number of atoms per formula unit. In an attempt to check whether one can fit the data in the low temperature region by , vs is plotted in the lower inset of Fig. 5. Here, is the Sommerfeld coefficient which represents the electronic contribution and represents the lattice contribution. It clearly shows a non-linear behaviour. However, the low temperature data could be fitted well by adding a magnetic term in i.e. where is the co-efficient of .Anand et al. (2012) A term in is typical for SG and FM systems.Gopal (2012) The best fit of the data in the temperature range K (upper inset of Fig. 5) yields 29 mJ/mol K2, 0.072 mJ/mol K4, and mJ/mol K5/2. From the values of , one can calculate the Debye temperature () using the standard expression . The value of is calculated to be K which is close to the value obtained from the vs analysis. A large value of is reported for several cluster SG systems but the effect of disorder on the density of states is not yet understood.Anand et al. (2012); Li et al. (1998); Tien et al. (2000)
III.4 AC Susceptibility
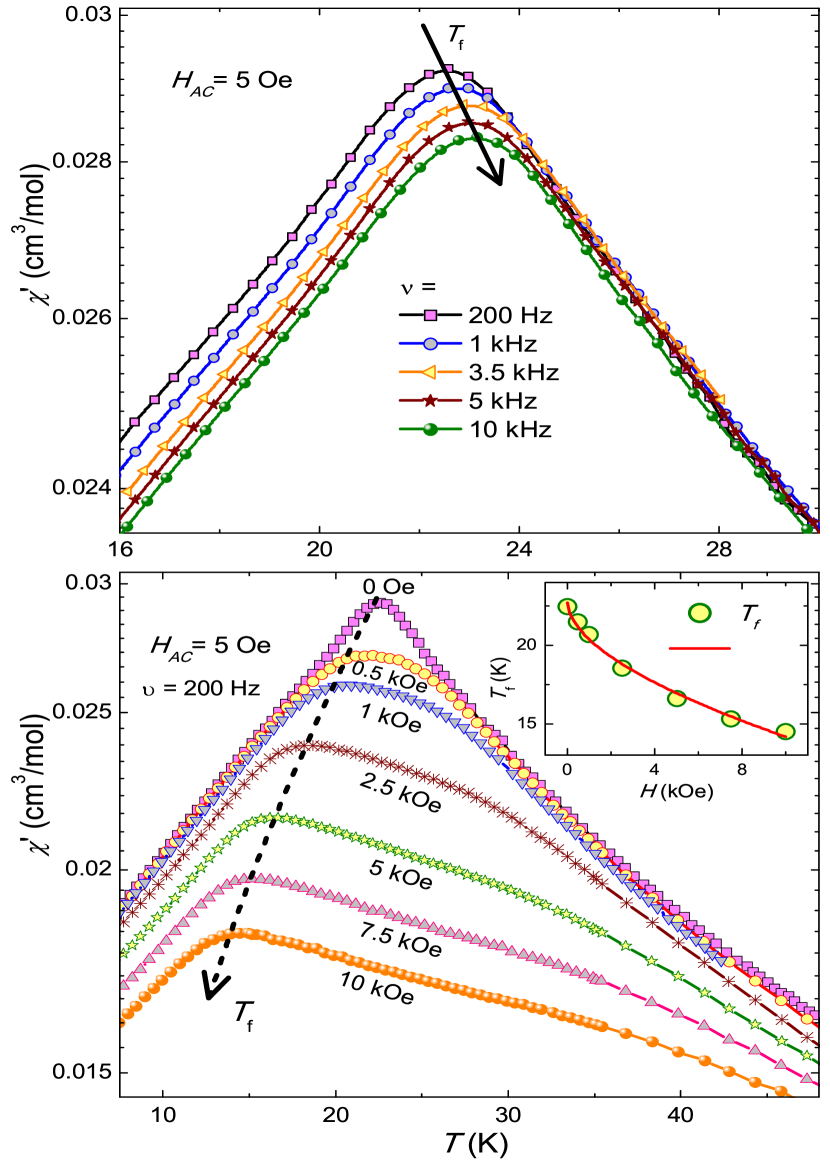
In order to understand the underlying nature of the transition and to study the dynamics of the SG state, AC susceptibility was measured at different frequencies () and at a fixed excitation field of Oe, after cooling the sample in zero field. The real part of the AC susceptibility () as a function of temperature is plotted in the upper panel of Fig. 6. It exhibits a pronounced anomaly at around K (for Hz) which is found to be frequency dependent. The peak position shifts towards higher temperatures and the height of the peak decreases with increasing , consistent with a glassy transition with freezing temperature K. AC susceptibility was also measured under different DC fields () fixing the AC excitation at Oe and Hz. As one can see in the lower panel of Fig. 6, the peak at K in zero-field transforms into a broad shoulder like shape when is applied, similar to the DC susceptibility data. With increasing , the low temperature edge () moves towards low temperatures, further supporting the SG transition. The variation of with could also be fitted well using Eq. (4) (see the inset of Fig. 6) which yields K and . The obtained value of again reflects the de Almeida-Thouless line with non-mean-field instability.
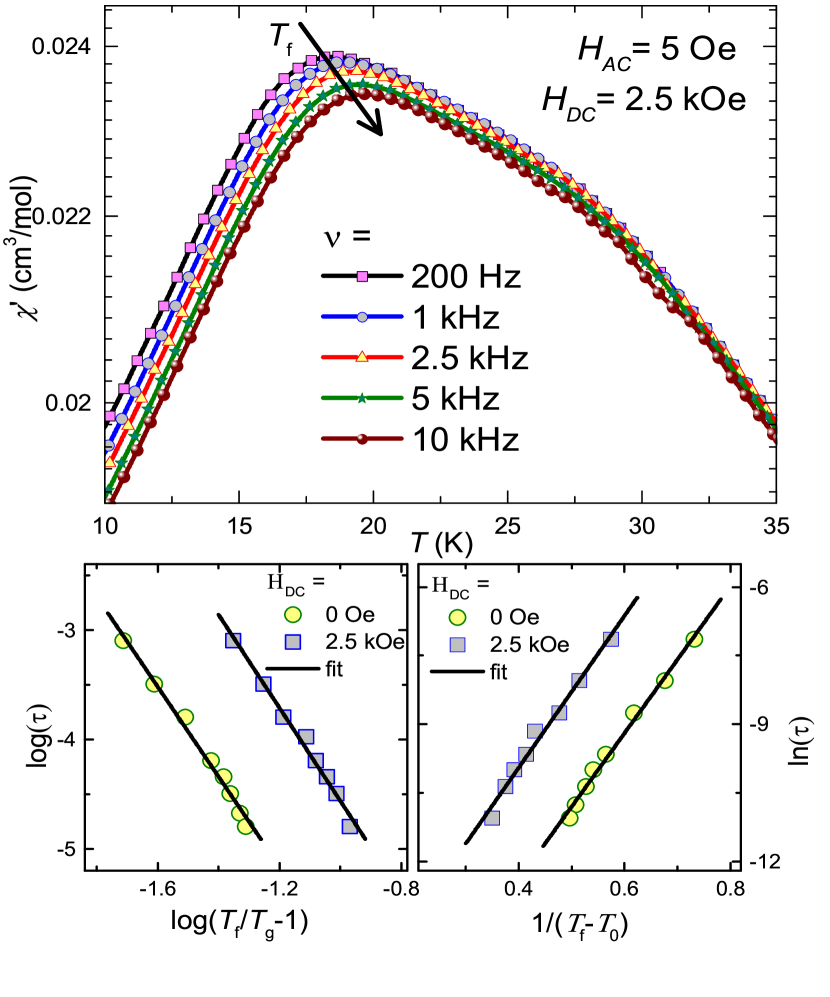
For the sake of completeness, we measured AC susceptibility at different frequencies for a fixed DC field of 0.25 T and a fixed AC field of 5 Oe. As shown in the upper panel of Fig. 7, manifests a peak at which moves towards high temperatures and the magnitude of decreases with increasing frequency. The increase in with again supports the SG behavior of the system.
The relative shift in freezing temperature () per decade of frequency is often used as a parameter to compare different SG systems. We calculated this parameter using the relationMydosh (1993); Mulder et al. (1982)
| (5) |
where and log() = log() - log(). is also known as the Mydosh parameter.Mydosh (2015) For this purpose, two outermost frequencies, Hz and kHz were employed. For our system, this value is calculated to be , using the data shown in the upper panel of Fig. 7. It is about an order of magnitude larger than the values reported for canonical SG systems such as AuMn ()Mulder et al. (1982) and CuMn ()Mydosh (1993) and one order of magnitude smaller than what is expected for superparamagnets (e.g. for the ideal non-interacting superparamagnetic system -[Ho2O3(B2O3)], ).Mydosh (1993) In fact, this value is in the range usually observed for cluster SG, categorizing our system as a cluster-SG type.Mydosh (1993); Li et al. (2001); Chakrabarty et al. (2014); Anand et al. (2012); Maji et al. (2011); Zhang et al. (2018) The value of essentially reflects the response or sensitivity to frequency which strongly depends on the interaction between the underlying entities. In case of magnetic clusters, the interactions between the clusters are weak and hence the sensitivity is stronger. On the other hand, in normal magnets where the interaction between magnetic ions is strong, a very large frequency is required to see any significant shift in AC susceptibility.
| (T) | (K) | (sec) | (sec) | (K) | (K) | |
|---|---|---|---|---|---|---|
| 0 | ( | ( | ||||
| 0.25 | ( | ( |
The frequency dependence of freezing temperature obtained from the real part of the AC susceptibility is presented in the lower panel of Fig. 7. In SG systems, the frequency dependence of can be described by the standard critical slowing down behaviour (power law), given by the dynamic scaling theory,Mydosh (1993); Hohenberg and Halperin (1977)
| (6) |
where the characteristic time describes the dynamical fluctuation time scale and corresponds to the observation time (), is the relaxation time of a single spin flip of the fluctuating entities, is the static freezing temperature as tends to zero, is the dynamic critical exponent, and is the critical exponent of the correlation length . The dynamic scaling hypothesis connects to as .
To fit the data, the power law in Eq. (6) can further be rewritten as
| (7) |
In the lower left panel of Fig. 7, we have plotted log vs log for and 0.25 T fixing K and K, respectively, obtained via the best fit of the data by the power law [Eq. (6)]. Both the curves show a linear behaviour and the obtained parameters, and from a straight line fit [Eq. (7)] are listed in Table I. The dynamic scaling suggests that there is a divergence of the relaxation time at a finite transition temperature, which demonstrates a true phase transition from PM to SG in Cr0.5Fe0.5Ga. The parameters, and are believed to give more reliable insight into the SG dynamics. For conventional SG systems, the value of typically lies between and while the value of ranges from s to s.Nam et al. (2000); Pakhira et al. (2016); Ghara et al. (2014); Lago et al. (2012); Malinowski et al. (2011) Similarly, for the canonical SG and cluster SG, the characteristic range of varies from s to s and to , respectively.Lago et al. (2012); Pakhira et al. (2016); Mori and Mamiya (2003); Anand et al. (2012); Mydosh (1993) Clearly, our obtained values of and fall within the ranges reported for typical cluster SG systems.Pakhira et al. (2016); Lago et al. (2012); Malinowski et al. (2011); Mori and Mamiya (2003); Anand et al. (2012) A high value of also points toward the fact that in Cr0.5Fe0.5Ga, spin dynamics occurs in a slow manner, due to the presence of interacting clusters rather than individual spins.Anand et al. (2012); Ghara et al. (2014) No significant change in was observed while changing the field from 0 to 0.25 T but the value of is changed by an order of magnitude which is still within the range expected for cluster-SG systems.
The presence of interacting clusters is also evident from the failure of Arrhenius law to fit the frequency dependent data. Arrhenius law which is applicable for non-interacting or weakly interacting magnetic entities can be written asBinder and Young (1986)
| (8) |
where has the same physical meaning as and is the average activation energy of the relaxation barrier. The activation energy basically measures the energy barrier in which the metastable states are separated and the Arrhenius law accounts for the time scale to overcome the energy barriers by the activation process. Our attempt to estimate and from the linear fit of the ln() vs data in zero field yields completely unphysical values [ s and K]. This failure adds further support to the argument that the dynamics in our system is not simply due to single spin flips, rather it is a cooperative character due to inter-cluster interactions.
Another dynamical scaling law in spin-glass freezing is the phenomenological Vogel-Fulcher (VF) law which takes into account the interaction among the spins. According to this law, the frequency dependent can be described byMydosh (1993); Souletie and Tholence (1985)
| (9) |
where is the empirical VF temperature, which is often interpreted as the interaction strength among the dynamic entities. For the purpose of fitting, it is convenient to rewrite Eq. (9) as
| (10) |
Here, we show that the variation of in the frequency range, which has been experimentally accessible to us, can be described by this formula. In the lower right panel of Fig. 7, the plot of vs is shown, which can be fitted well by Eq. (10) with K and 16.8 K for and 0.25 T, respectively. The parameters, and obtained from the slope and intercept of the linear fit are summarized in Table I. A nonzero value of and the agreement of VF law with our data suggest a finite interaction among the spins and hence the formation of clusters. The activation energy in the system is expected to be tuned under external magnetic field (). It is predicted that the magnitude of the spin-glass free energy barriers () diminishes as , the coefficient of which is proportional to the number of correlated spins.Guchhait and Orbach (2017); Zhai et al. (2017) However, our measurements at and T donot yield any visible change in which possibly suggests the role of dominant anisotropy in the spin system.
From the above assessment, it is clear that the change of relaxation time in our experimental frequency range can be described equally well by both power law [Eq. (7)] and VF law [Eq. (10)]. The obtained value of from the power law is about an order of magnitude smaller than obtained from the VF law. Such difference in characteristic time constant using two dynamical scaling laws are also reported in many cluster-SG systems e.g. Fe2O3,Mukadam et al. (2005) Ni doped La1.85Sr0.15CuO4,Malinowski et al. (2011) etc. Nevertheless, the characteristic time constants ( and ) obtained from both fits fall in the expected range for typical cluster-SG systems. The value of is found to be larger than only a few percent, in accordance with the general trend found in the cluster-SG systems.Malinowski et al. (2011) Further, in the frame of the VF model, indicates a weak coupling and a strong one.Shtrikman and Wohlfarth (1981) For our case, is about in zero field, which falls in the intermediate regime, suggesting a finite interaction among the magnetic entities. Moreover, the Tholence criterion is also used to compare different SG systems.Tholence (1984) In our case, the value of is calculated to be [taking K and K] at zero field which is comparable to the value reported for cluster-SG system PrRhSn3 ().Anand et al. (2012)
It is worth mentioning that a qualitative difference is expected between power law and VF law when the measured frequency range is large enough.Souletie and Tholence (1985) For instance, the difference is clearly visible for Cu0.954Mn0.046 where the variation of is over 11 orders of magnitude.Souletie and Tholence (1985) Further, closer to (and ), the VF law can be adjusted to match the power law through the relationSouletie and Tholence (1985)
| (11) |
Using K, obtained from the VF law and K for Hz in Eq. (11), the value of was calculated to be , which is slightly larger than 4.2, obtained directly from the power law fit but within the range expected for cluster-SGs.
III.5 Non-equilibrium Dynamics
III.5.1 Magnetic Relaxations

Different types of glassy systems are characterized by their magnetic relaxation behaviour. To investigate such a behaviour, magnetic relaxation measurement was performed at different temperatures ( K, 10 K, and 15 K) in the ZFC condition. The sample was cooled under zero applied field from 50 K (PM state) to the desired temperature, which is below . After a waiting time of s, a magnetic field of 200 Oe was applied and the time evolution of magnetization [] was measured. The results are presented in Fig. 8. The curves follow the standard stretched exponential function
| (12) |
where is an intrinsic magnetization, is related to a glassy component of magnetization, is the characteristic relaxation time constant, and is the stretching exponent, which has values between 0 and 1 and is a function of temperature only. Although the above function has no specific theoretical justification, it has been widely used to fit the magnetic relaxation data of SG systems.Chamberlin et al. (1984) In this relation, implies that is constant, i.e., no relaxation at all, and implies that the system relaxes with a single time constant. Therefore, the value of covers the dynamics of spins with very strong to no relaxation limit. The value of depends on the nature of the energy barriers involved in the relaxation. For systems with a distribution of energy barriers, lies between 0 and 1, whereas for a uniform energy barrier, . The value of obtained from our fit is found to vary from 0.5 to 0.6. These values are within the range (0 to 1) of different glassy systems reported earlier.Chu et al. (1994); Mydosh (1993); Pakhira et al. (2016); Chu et al. (1994); Cardoso et al. (2003); Khan et al. (2014); Ghara et al. (2014); Bhattacharyya et al. (2011) Further, signifies that the system evolves through a number of intermediate metastable states i.e. activation takes place against multiple anisotropic barriers. Moreover, the value of is found to increase with decreasing temperature as expected for the glassy systems, below .Li et al. (1998); Maji et al. (2011) In fact, the values of obtained for Cr0.5Fe0.5Ga are almost comparable to that reported for other glassy systems, such as Nd5Ge3 (Ref. Maji et al., 2011) and U2PdSi3 (Ref. Li et al., 1998).
III.5.2 Magnetic Memory Effect
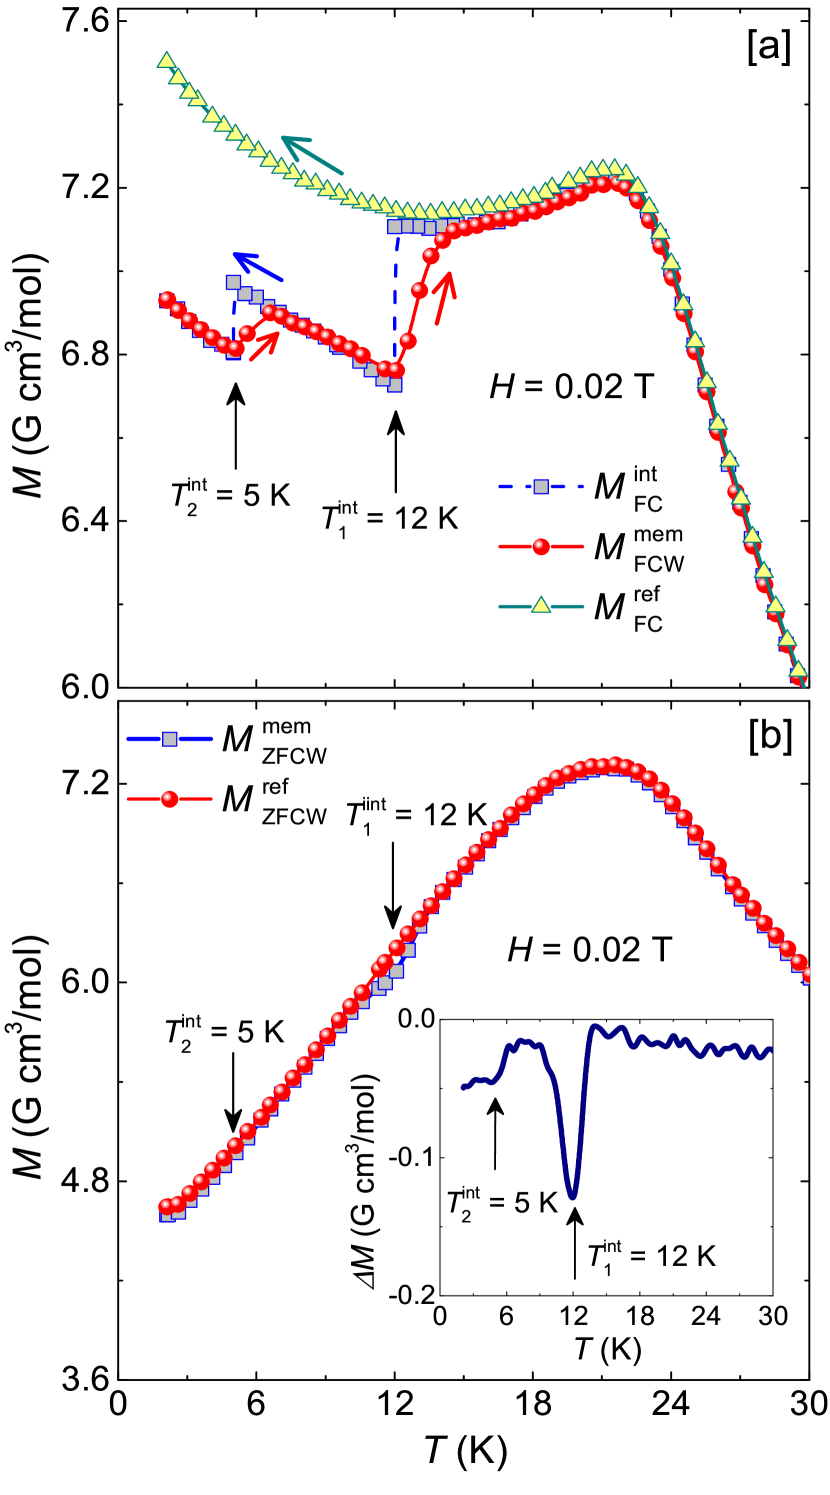
In order to examine the presence of non-ergodicity in the alloy and to gain new information on the low temperature dynamics, magnetic memory measurements were performed following the FC and ZFC protocols. The results are depicted in Fig. 9(a) and 9(b), respectively. In the FC condition, the sample was cooled down from 50 K (PM state) to 2 K at a constant cooling rate (0.5 K/min) in an applied field of 200 Oe. The cooling process was interrupted at K and K for a duration of hours each. During , at each temperature, the magnetic field was switched off and the system was allowed to relax. After each waiting period, the same magnetic field was switched on and the FC process was resumed. The magnetization measured during this process is denoted as which produces steplike features at 12 K and 5 K. After reaching 2 K, the sample was heated under the same field without any interruption and was recorded upto 50 K which is designated as . Interestingly, the obtained also exhibits characteristic features at each interruption performed in , as an attempt to follow the past history of the magnetization. Thus, it is a clear signature of the magnetic memory in the system. A FC curve () in the same field without any interruption is also measured for reference.
Similar memory effect was also measured in ZFC condition in which the sample was cooled from 50 K (PM state) to 2 K at a constant cooling rate (0.5 K/min) in zero applied field. The cooling was interrupted at K and K for hours each. After reaching 2 K, a magnetic field of 200 Oe was applied and was recorded during warming which is designated as . For the sake of completeness, a reference curve was recorded by conventional ZFCW protocol in Oe which is represented as . These two curves were found to overlap with each other except at the interrupted temperature regions. This is brought out very clearly in the inset of Fig. 9(b) where the difference in magnetization - is plotted against temperature. It exhibits memory dips at each interruption points (12 K and 5 K). Thus, the observation of memory effect in both ZFC and FC conditions strengthens our assessment as cluster-SG behaviour of the compound.
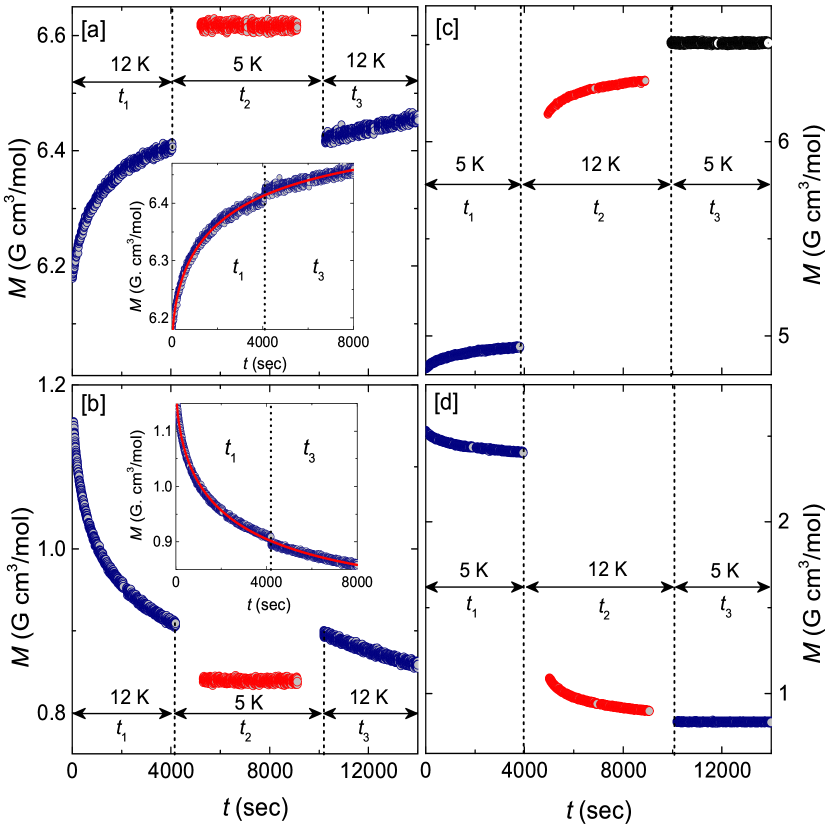
To study the memory effect in further details, we performed the relaxation memory measurements for both negative and positive -cycles as discussed below.
Negative -cycle : The relaxation behaviour was recorded for the negative -cycle for both ZFC and FC conditions and the results are shown in Fig. 10(a) and 10(b), respectively. In the ZFC process, the sample was cooled down from 50 K to 12 K (below ) in zero field. At 12 K, a field of 200 Oe was applied and was measured for a period of hour. It is found to increase exponentially with . The sample was further cooled down to 5 K in the same field and again was measured for hour which is found to be almost constant with . Subsequently, the temperature was restored back to 12 K and was recorded for hour in the same field which again varies exponentially with . In the FC process, the sample was field cooled down to 12 K in a field of 200 Oe. At 12 K, was measured for hour after switching off the field and it was found to decay exponentially with . The sample was further cooled down to 5 K in zero field and was measured for hour which is found to be constant with . Finally, the sample was warmed back to 12 K in zero field and was recorded again for hour which again decays exponentially with .
As shown in the insets of Fig. 10(a) and 10(b), when the data at 12 K measured during and put together, they simply follow a continuous growth and decay curve for the ZFC and FC processes, respectively. It indicates that the state of the sample before cooling is recovered when the sample is cycled back to the initial temperature. This is a straight forward demonstration of the memory effect in a cluster SG system where the sample remembers its previous state even after experiencing a large change in . These curves were fitted by the stretched exponential function [Eq. (12)] with , similar to that observed in the magnetic relaxation measurements.
Positive -cycle: Similar to the negative -cycle, both ZFC and FC relaxation behaviours were also recorded for the positive -cycle and are shown in Fig. 10(c) and 10(d), respectively. In the ZFC process, the sample was cooled down from 50 K to 5 K in zero field. At 5 K, a field of 200 Oe was applied and was recorded for hour which shows a gradual increase with . The sample was then heated upto 12 K in the same field and again was measured for hour which also shows a gradual increase with . Finally, the temperature was restored back to 5 K but the measured for another hour is found to be independent. In the FC process, the sample was cooled down to 5 K in a field of 200 Oe. At 5 K, magnetic field was switched off and the same sequence (as for the ZFC process) was repeated. As shown Fig. 10(d), the obtained results follow the same trend as for the ZFC sequence but in the opposite direction. It is evident that unlike the negative -cycle, there is no continuity in the data measured during and at 5 K suggesting that the nature of the magnetic relaxation during is quite different from that during . Thus, positive -cycling revives the magnetic relaxation process and no magnetic memory effect is observed when the temperature is restored.
The memory effect in SG systems has been widely studied via magnetization measurements. This phenomena is usually discussed in the framework of two theoretical models: the droplet modelFisher and Huse (1988) and the hierarchical model.Lefloch et al. (1992) These are two well established models which are successfully applied in several experimental studies.Pakhira et al. (2016); Sun et al. (2003) At a given temperature, a multi-valley spin structure is organized on the free-energy landscape in the hierarchical model, whereas in the droplet model only one spin configuration is favoured. Basically, in the hierarchical model, these free energy valleys which are metastable states split into new sub-valleys as the temperature is lowered and get merged with increasing temperature. This picture obviously give rise to the observed memory effects. When the temperature of the system is lowered from to , each valley splits into a set of sub-valleys. If is large, the energy barriers separating the main valleys become too high and the system cannot overcome these barriers during the waiting time . Therefore, the relaxation occurs only within the sub-valleys of each set. As the temperature is brought back to , the sub-valleys and barriers merge back to the original free-energy landscape and the relaxation at is not at all disturbed by the intermediate relaxations at . But when the temperature of the system is increased from to , the barriers between the free energy multi valleys are lowered or even get merged. Therefore, the relaxations can occur within different valleys. When the temperature is lowered back to , although the free-energy landscape is restored, the relative occupancy of each valley does not remain the same as before. Thus, the state of the system changes after a temporary heating cycle showing no memory effect.
Experimentally, these two models can be distinguished by studying the influence of -cycling on magnetic relaxation. In the droplet model, the original spin configuration is restored after a cycling one would expect a symmetric behaviour in magnetic relaxation with respect to the positive/negative -cycling. On the other hand, in the hierarchical model, the original spin configuration is destroyed after a positive -cycling and one would expect an asymmetric response (or, no memory effect) in magnetic relaxation. Thus, based on the above criteria, our observed asymmetric response in the positive -cycle during both ZFC and FC processes supports the hierarchical organization of the metastable states in the cluster-SG system. Since the hierarchical organization requires a large number of degrees of freedom to be coupled, it can not be produced simply by the independent behaviour of individual spins and consequently highlights the important role played by inter-particle/intra-cluster interactions.
IV Summary
In summary, we present a detailed and a systematic study of the structural and magnetic properties of Cr0.5Fe0.5Ga. No evidence of any structural disorder was found from the temperature dependent powder XRD measurements down to 15 K. The temperature dependent DC magnetization shows the onset of a SG transition at low temperatures which is caused by magnetic site disorder and magnetic frustration due to competing AFM and FM interactions. The SG transition is further justified by AC susceptibility measurements. The results clearly indicate that the fitted parameters, as obtained from the relative shift in and the dynamical scaling laws, are consistent with that expected for cluster SG systems. The activation energy of the metastable states is estimated to be K. A clear signature of the magnetic memory effect was observed below the freezing temperature in both FC and ZFC processes further demonstrating the cluster-SG behavior of the compound under investigation. In the positive -cycle, a small heating reinitializes the relaxation process and the magnetization is unable to restore its initial value. Such an asymmetric response of magnetic relaxation with respect to positive temperature change favours the hierarchical model. The Debye temperature estimated from the low temperature data is consistent with that obtained from the analysis. Although our experimental results point towards the formation of cluster SG state, the underlying mechanism behind such a formation is not yet understood. Further studies preferably neutron scattering and SR experiments may provide useful insite.
V Acknowledgement
We would like to acknowledge BRNS, India for financial support bearing sanction No.37(3)/14/26/2017-BRNS. We thanks B. R. Sekhar for his valuable suggestions. PB is supported by the IISER-TVM post-doctoral fellowship programme.
References
- Fisher and Hertz (1991) K. Fisher and J. Hertz, Spin Glasses (Cambridge Studies in Magnetism Cambridge University Press, Cambridge, England, 1991).
- Mydosh (1993) J. A. Mydosh, Spin Glasses: An Experimental Introduction (Taylor & Francis, London, 1993).
- Binder and Young (1986) K. Binder and A. P. Young, Rev. Mod. Phys. 58, 801 (1986).
- Weissman (1993) M. Weissman, Rev. Mod. Phys. 65, 829 (1993).
- Jonason et al. (1998) K. Jonason, E. Vincent, J. Hammann, J. Bouchaud, and P. Nordblad, Phys. Rev. Lett. 81, 3243 (1998).
- Fisher and Huse (1988) D. S. Fisher and D. A. Huse, Phys. Rev. B 38, 373 (1988).
- Karmakar et al. (2008) S. Karmakar, S. Taran, E. Bose, B. Chaudhuri, C. Sun, C. Huang, and H. Yang, Phys. Rev. B 77, 144409 (2008).
- Chatterjee et al. (2009) S. Chatterjee, S. Giri, S. De, and S. Majumdar, Phys. Rev. B 79, 092410 (2009).
- Souletie (1978) J. Souletie, J. Phys. (France) 39, 2 (1978).
- Gardner et al. (2010) J. S. Gardner, M. J. P. Gingras, and J. E. Greedan, Rev. Mod. Phys. 82, 53 (2010).
- Gourdon et al. (2004) O. Gourdon, S. L. Bud’ko, D. Williams, and G. J. Miller, Inorg. Chem. 43, 3210 (2004).
- Ko et al. (2010) H. Ko, O. Gourdon, D. Gout, E.-D. Mun, S. Thimmaiah, and G. J. Miller, Inorg. Chem. 49, 11505 (2010).
- Rodríguez-Carvajal (1993) J. Rodríguez-Carvajal, Physica B Condens Matter 192, 55 (1993).
- Pakhira et al. (2016) S. Pakhira, C. Mazumdar, R. Ranganathan, S. Giri, and M. Avdeev, Phys. Rev. B 94, 104414 (2016).
- Li et al. (1998) D. X. Li, Y. Shiokawa, Y. Homma, A. Uesawa, A. Dönni, T. Suzuki, Y. Haga, E. Yamamoto, T. Honma, and Y. Ōnuki, Phys. Rev. B 57, 7434 (1998).
- Malinowski et al. (2011) A. Malinowski, V. Bezusyy, R. Minikayev, P. Dziawa, Y. Syryanyy, and M. Sawicki, Phys. Rev. B 84, 024409 (2011).
- Nath et al. (2008) R. Nath, A. Tsirlin, H. Rosner, and C. Geibel, Phys. Rev. B 78, 064422 (2008).
- Gabay and Toulouse (1981) M. Gabay and G. Toulouse, Phys. Rev. Lett. 47, 201 (1981).
- De Almeida and Thouless (1978) J. De Almeida and D. J. Thouless, J. Phys. A: Math. Gen. 11, 983 (1978).
- Malozemoff et al. (1983) A. P. Malozemoff, S. E. Barnes, and B. Barbara, Phys. Rev. Lett. 51, 1704 (1983).
- Li et al. (2001) D. Li, S. Nimori, Y. Shiokawa, A. Tobo, H. Onodera, Y. Haga, E. Yamamoto, and Y. Ōnuki, Appl. Phys. Lett. 79, 4183 (2001).
- Li et al. (2003) D. X. Li, S. Nimori, Y. Shiokawa, Y. Haga, E. Yamamoto, and Y. Onuki, Phys. Rev. B 68, 172405 (2003).
- Chakrabarty et al. (2014) T. Chakrabarty, A. V. Mahajan, and S. Kundu, J. Phys.: Conden. Matter. 26, 405601 (2014).
- Maji et al. (2011) B. Maji, K. Suresh, and A. Nigam, J. Phys.: Conden. Matter. 23, 506002 (2011).
- Zhang et al. (2018) X. K. Zhang, J. J. Yuan, Y. M. Xie, Y. Yu, F. G. Kuang, H. J. Yu, X. R. Zhu, and H. Shen, Phys. Rev. B 97, 104405 (2018).
- Note (1) In these experimental papers the authors have force-fitted their data to a mean-field model rather than attempting a more general non-mean-field type model.
- Barbara et al. (1981) B. Barbara, A. P. Malozemoff, and Y. Imry, Phys. Rev. Lett. 47, 1852 (1981).
- Dieny and Barbara (1986) B. Dieny and B. Barbara, Phys. Rev. Lett. 57, 1169 (1986).
- Tabata et al. (2017) Y. Tabata, T. Waki, and H. Nakamura, Phys. Rev. B 96, 184406 (2017).
- Shand et al. (2010) P. M. Shand, T. Rash, M. Streicher, T. E. Kidd, K. R. Boyle, and L. H. Strauss, Phys. Rev. B 82, 214413 (2010).
- Wang et al. (2004) F. Wang, J. Zhang, Y.-f. Chen, G.-j. Wang, J.-r. Sun, S.-y. Zhang, and B.-g. Shen, Phys. Rev. B 69, 094424 (2004).
- Anand et al. (2012) V. K. Anand, D. T. Adroja, and A. D. Hillier, Phys. Rev. B 85, 014418 (2012).
- Gopal (2012) E. Gopal, Specific heats at low temperatures (Springer Science & Business Media, 2012).
- Tien et al. (2000) C. Tien, C. H. Feng, C. S. Wur, and J. J. Lu, Phys. Rev. B 61, 12151 (2000).
- Mulder et al. (1982) C. A. M. Mulder, A. J. van Duyneveldt, and J. A. Mydosh, Phys. Rev. B 25, 515 (1982).
- Mydosh (2015) J. A. Mydosh, Reports on Progress in Physics 78, 052501 (2015).
- Hohenberg and Halperin (1977) P. C. Hohenberg and B. I. Halperin, Rev. Mod. Phys. 49, 435 (1977).
- Nam et al. (2000) D. N. H. Nam, R. Mathieu, P. Nordblad, N. V. Khiem, and N. X. Phuc, Phys. Rev. B 62, 8989 (2000).
- Ghara et al. (2014) S. Ghara, B.-G. Jeon, K. Yoo, K. H. Kim, and A. Sundaresan, Phys. Rev. B 90, 024413 (2014).
- Lago et al. (2012) J. Lago, S. Blundell, A. Eguia, M. Jansen, and T. Rojo, Phys. Rev. B 86, 064412 (2012).
- Mori and Mamiya (2003) T. Mori and H. Mamiya, Phys. Rev. B 68, 214422 (2003).
- Souletie and Tholence (1985) J. Souletie and J. Tholence, Phys. Rev. B 32, 516(R) (1985).
- Guchhait and Orbach (2017) S. Guchhait and R. L. Orbach, Phys. Rev. Lett. 118, 157203 (2017).
- Zhai et al. (2017) Q. Zhai, D. C. Harrison, and R. L. Orbach, Phys. Rev. B 96, 054408 (2017).
- Mukadam et al. (2005) M. D. Mukadam, S. M. Yusuf, P. Sharma, S. K. Kulshreshtha, and G. K. Dey, Phys. Rev. B 72, 174408 (2005).
- Shtrikman and Wohlfarth (1981) S. Shtrikman and E. Wohlfarth, Phys. Lett. A 85, 467 (1981).
- Tholence (1984) J.-L. Tholence, Physica B 126, 157 (1984).
- Chamberlin et al. (1984) R. V. Chamberlin, G. Mozurkewich, and R. Orbach, Phys. Rev. Lett. 52, 867 (1984).
- Chu et al. (1994) D. Chu, G. Kenning, and R. Orbach, Phys. Rev. Lett. 72, 3270 (1994).
- Cardoso et al. (2003) C. A. Cardoso, F. M. Araujo-Moreira, V. P. S. Awana, E. Takayama-Muromachi, O. F. de Lima, H. Yamauchi, and M. Karppinen, Phys. Rev. B 67, 020407 (2003).
- Khan et al. (2014) N. Khan, P. Mandal, and D. Prabhakaran, Phys. Rev. B 90, 024421 (2014).
- Bhattacharyya et al. (2011) A. Bhattacharyya, S. Giri, and S. Majumdar, Phys. Rev. B 83, 134427 (2011).
- Lefloch et al. (1992) F. Lefloch, J. Hammann, M. Ocio, and E. Vincent, Europhys. Lett. 18, 647 (1992).
- Sun et al. (2003) Y. Sun, M. Salamon, K. Garnier, and R. Averback, Phys. Rev. Lett. 91, 167206 (2003).