A Pariser-Parr-Pople Model Based Study of Optoelectronic Properties of Phenacenes
Abstract
In this paper we present a computational study of linear optical absorption in phenacene class of polyaromatic hydrocarbons. For the purpose, we have employed a correlated-electron methodology based upon configuration-interaction (CI) approach, and the Pariser-Parr-Pople (PPP) -electron model Hamiltonian. The molecules studied range from the smallest one with three phenyl rings (phenanthrene), to the largest one with nine phenyl rings. These structures can also be seen as finite-sized hydrogen-passivated armchair graphene nanoribbons of increasing lengths. Our CI calculations reveal that the electron-correlation effects have a profound influence not just on the peak locations, but also on the relative intensity profile of the computed spectra. We also compare our phenacene results with isomeric oligo-acenes, and find that in all the cases former have a wider optical gap than the latter. Available experiments based upon optical absorption and electron-energy-loss-spectroscopy (EELS) are in very good agreement with our results.
I Introduction
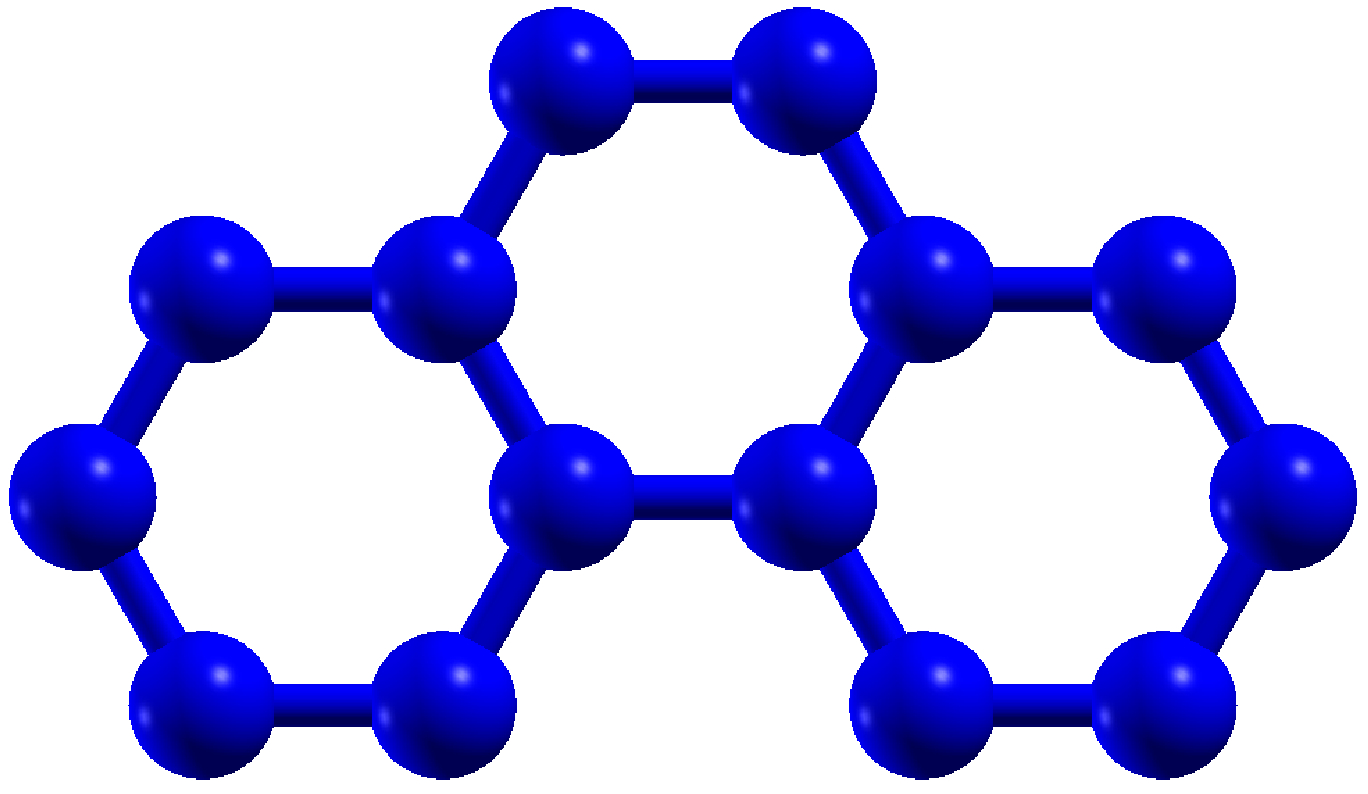
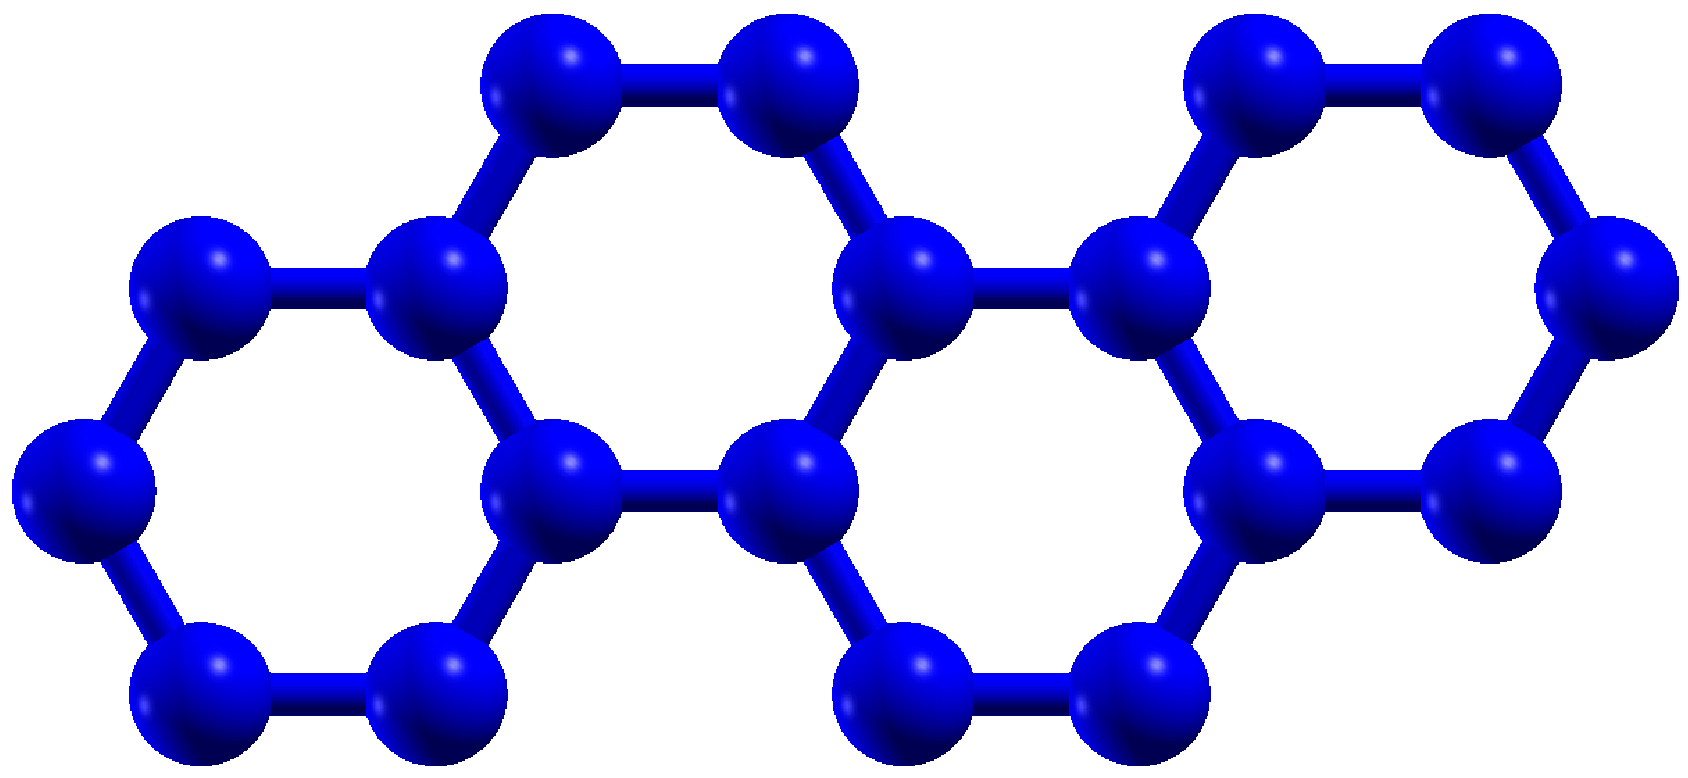
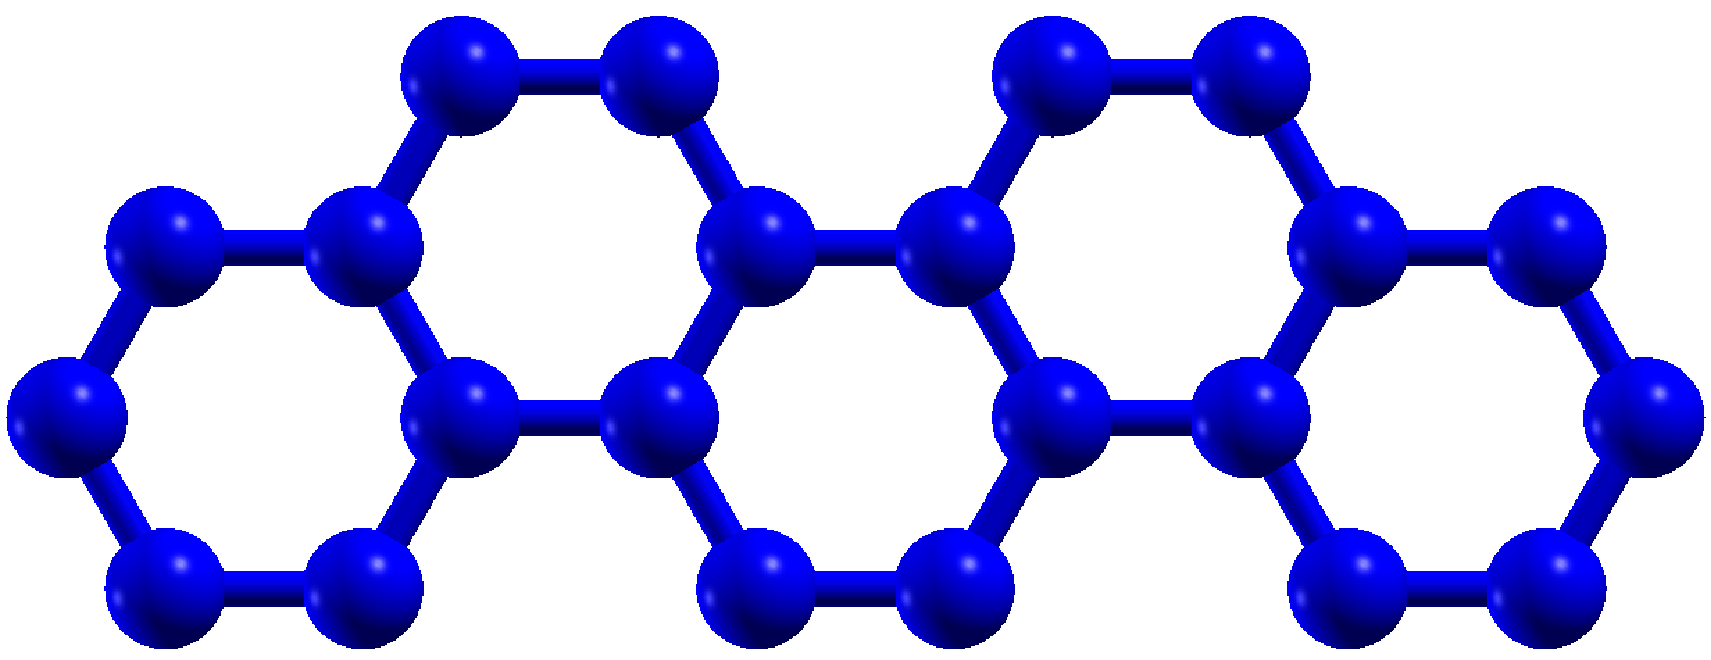
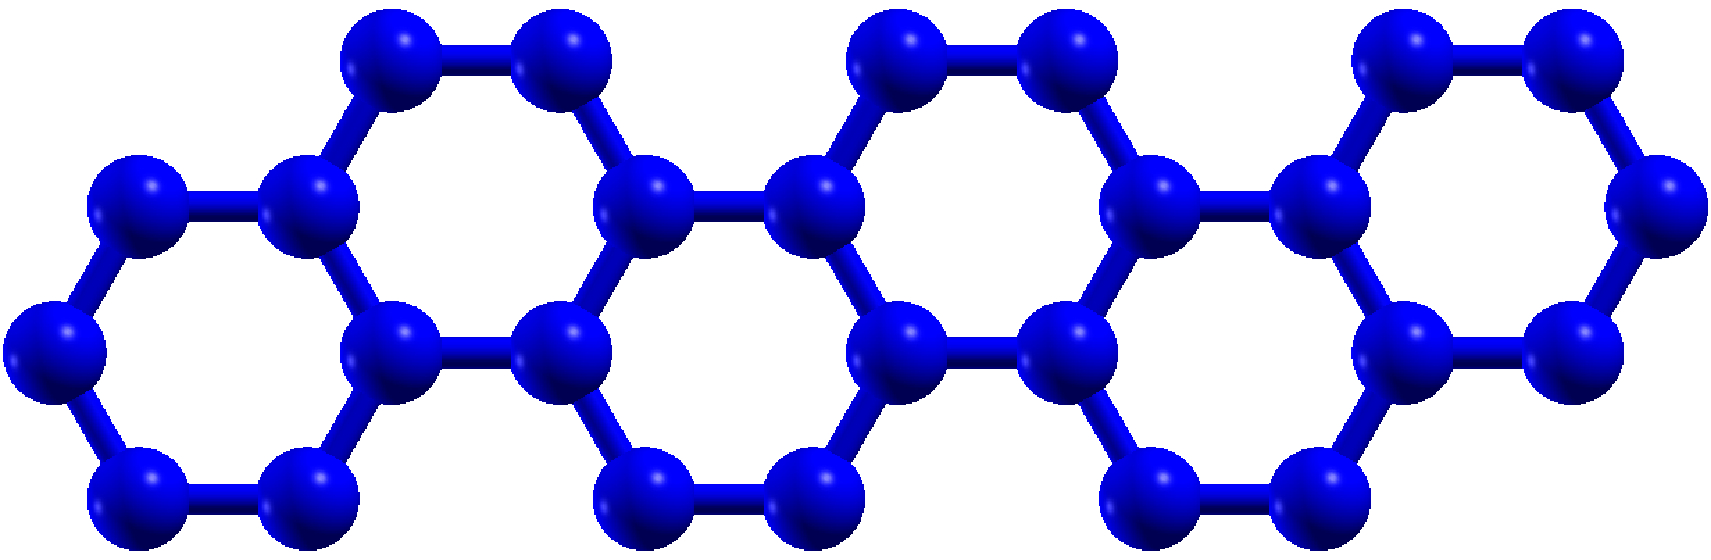
Over last several decades, polycyclic aromatic hydrocarbons (PAHs) have been studied extensively using theoretical and experimental methods, because of their importance in several fields such as physics, chemistry, environmental science, astrophysics and biology.1; 2; 3; 4 PAHs, with a planar structure, are conjugated systems, known for strong response to external fields, thus with potentially numerous device applications.5; 6 Oligoacenes, particularly tetracene and pentacene are among the most studied PAHs because of their possible applications in the field of optoelectronic devices, particularly light-emitting diodes, and photovoltaic cells.7; 8 Phenacene oligomers, which are nothing but the isomers of oligo-acenes of the same length, have also been found to be very useful in the field of the device application, particularly in fabrication of organic field-effect transistors (FETs).9; 10; 11; 12; 5; 13; 14 Furthermore, it was reported that one of the phenacene oligomers, namely picene, exhibits high-temperature superconducting behavior when doped by alkali metals.15 Phenacenes are similar to oligoacenes in that both are composed of fused benzene rings, while differing from each other in the way the fused rings are arranged. In oligoacenes, the fused rings are arranged in a straight manner leading to symmetry, while in phenacenes, they are arranged in a zigzag manner resulting in the point group is if the number of rings is even, and for odd number of rings. A phenacene oligomer with fused rings is called []phenacene, and it is obvious that the minimum possible value for . For , phenacene oligomers are named phenanthrene (), chrysene (), picene (), and fulminene (), while for , they are referred as []phenacene.
Motivated by potential device applications of phenacenes, in this work we undertake a systematic computational study of their electronic structure, low-lying excited states, and linear optical response. Such a study is necessary not just for understanding the optical properties of individual oligomers, but also for obtaining insights into the transport properties of these materials in the crystalline phase, which consists of nothing but individual molecules held together by van-der-Waals binding. Given the fact that the phenancenes are -electron systems, we have employed our Pariser-Parr-Pople model based electron-correlated methodology for this study16. The oligomers studied in this work range from phenanthrene to [9]phenacene, and our results are found to be in excellent agreement with the experimental measurements, wherever available. Because []phenacene is isomeric with acene-, we also compare present results with the ones obtained for polyacenes in an earlier work from our group,17 with the aim of understanding the role of geometry on the optical properties of these materials. We find that for each value of considered in this work, optical absorption of spectra of two classes of materials are qualitatively different, and that the optical gap of []phenacene is significantly larger than that of acene-. This suggests that the optical absorption spectroscopy can be used to distinguish between isomeric phenancenes and acenes.
The remainder of the paper is structured as follows. In Section II we present schematic diagrams of phenacenes, and discuss their point group symmetries, and related consequences. This is followed in Section III by a brief discussion of the theoretical methodology adopted in this work. Next, in Section IV we present and discuss the results of our calculations, followed by conclusions and outlook in Section V.
II Molecular structure and point group symmetry
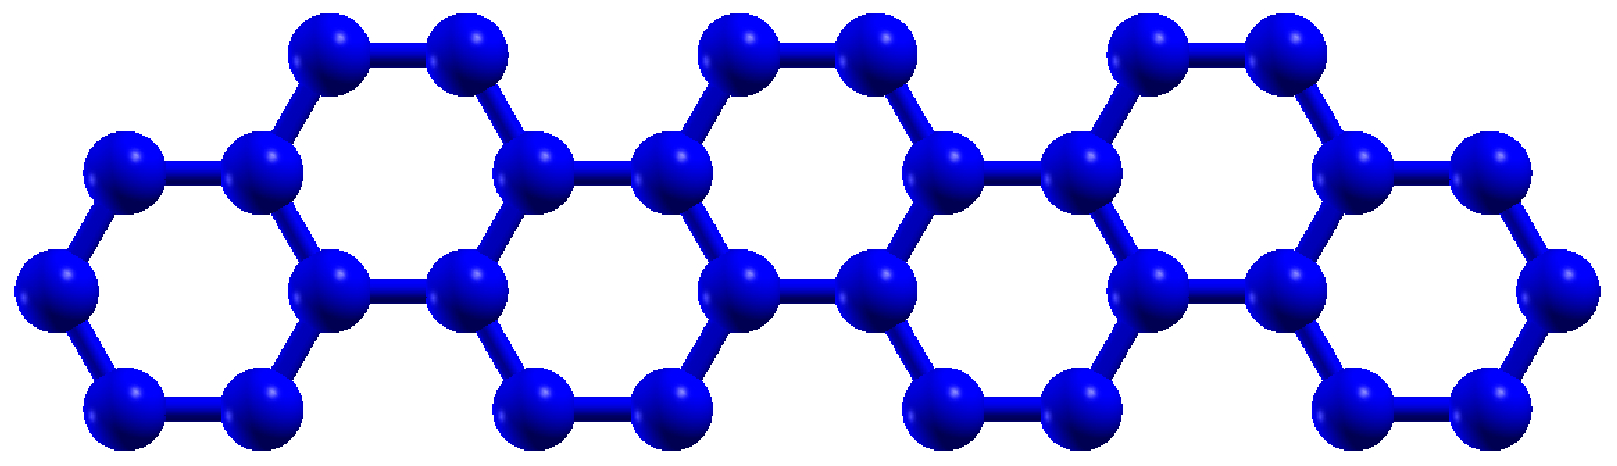
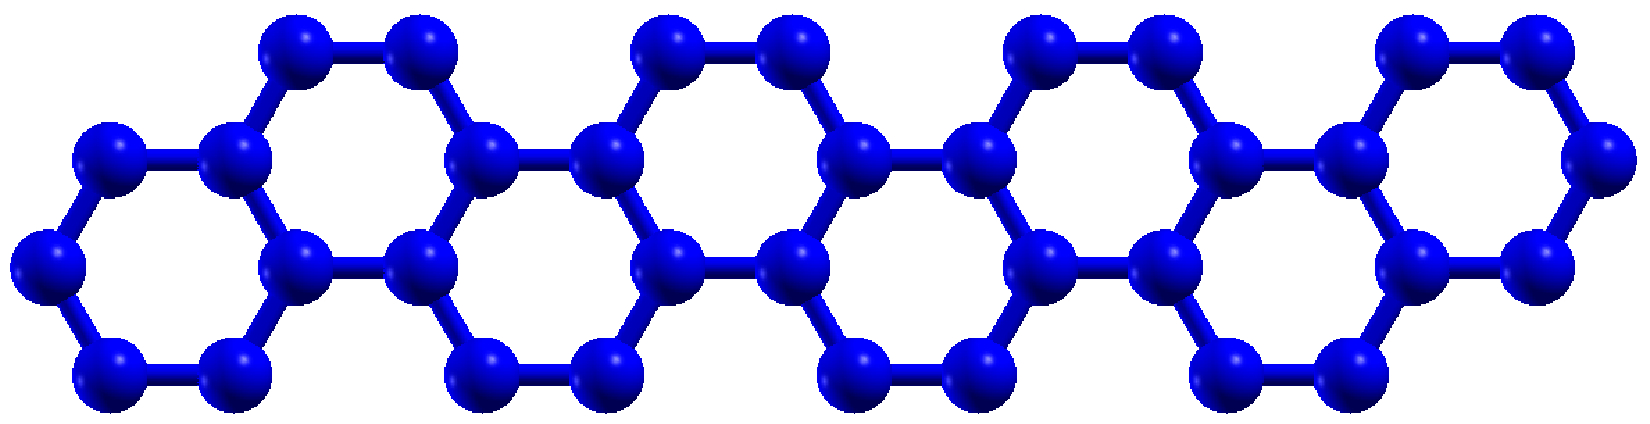
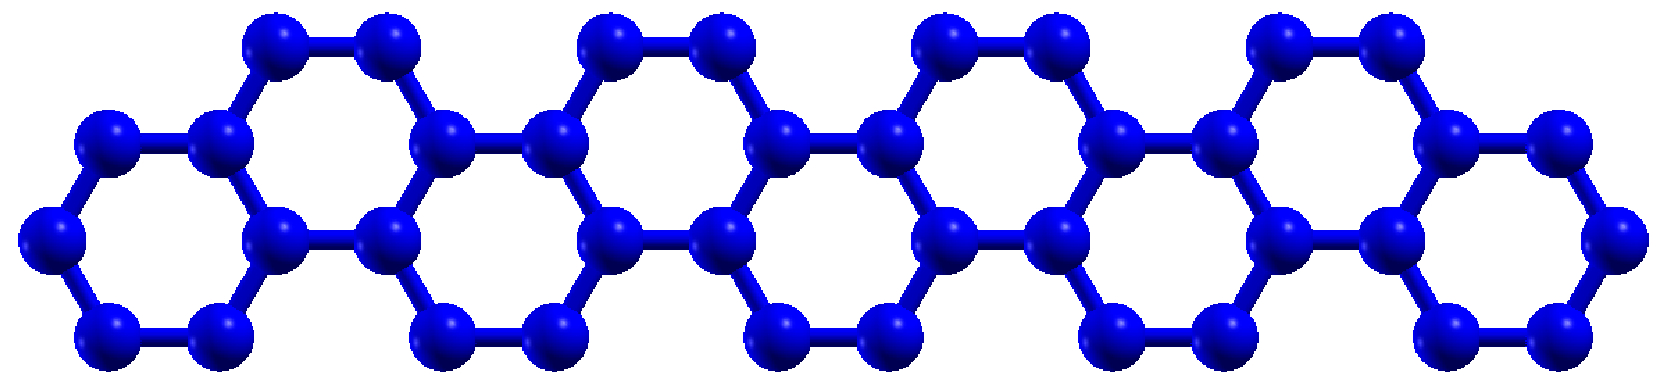
In Fig. 1, we present the schematic diagrams of []phenacenes considered in this work, along with their point group symmetries. We take the conjugation direction (long axis) to be axis, and the perpendicular direction (short axis) to be axis, so that all oligomers lie in the plane, with a uniform C-C bond length of 1.4 Å, and all the edge carbon atoms are assumed to be passivated by hydrogen atoms. []phenacene, just like acene-, has carbon atoms, as also the same number of electrons. The point group symmetry of phenanthrene ( carbon atoms), picene ( carbon atoms), [7]phenacene ( carbon atoms), and [9]phenacene ( carbon atoms) is , with being the ground state. On the other hand, the point group symmetry of chrysene ( carbon atoms) fulminene ( carbon atoms) and [8]phenacene ( carbon atoms) is , with being the ground state. As per electric-dipole selection rules, the symmetries of the one-photon excited states are ( polarized) and ( polarized) for molecules, and (polarized) for molecules.
III THEORETICAL METHODOLOGY
As described in the previous section, the molecules considered here are -conjugated systems, and, therefore, in this work we adopt Pariser-Parr-Pople (PPP) model Hamiltonian,18; 19 reviewed in our earlier work16
| + | (1) |
where c denotes creation (annihilation) operators corresponding to an electron of spin in a orbital, located on the -th carbon atom, while the total number of electrons on the atom is indicated by the number operator . In Eq. 1, the first term denotes the one-electron hoppings connecting -th and -th atoms, quantified by matrix elements . It is assumed that the hopping connects only the nearest-neighbor carbon atoms, with the matrix element eV, consistent with our earlier calculations on conjugated polymers,20; 21; 22; 23; 24; 25; 17 polyaromatic hydrocarbons,26; 27 and graphene quantum dots.28; 29 The remaining two terms in Eq. 1 represent the electron-electron repulsion terms, with the parameters , and , denoting the on-site, and the long-range Coulomb interactions, respectively. The distance-dependent Coulomb parameters are computed according to the Ohno relationship30
| (2) |
where is the dielectric constant of the system, included to take into account the screening effects, and is the distance (in Å) between the th and th carbon atoms. In the present set of calculations we have used two sets of Coulomb parameters: (a) the “screened parameters”31 with eV, , and , and (b) the “standard parameters” with eV and .
The calculations are initiated by performing restricted Hartree-Fock (RHF) calculations for the closed-shell singlet ground states of phenacenes considered here, using a computer program developed in our group.32 The molecular orbitals (MOs) obtained from the RHF calculations form a single-particle basis set used to transform the PPP Hamiltonian from the site representation, to the MO representation. Subsequently, correlated-electron calculations using the configuration interaction (CI) approach are performed. The level of the CI calculations is decided by the size of the molecule under consideration. For smaller molecules, one can use full-CI (FCI) or quadruple-CI (QCI) approaches, however, for the larger systems only the multi-reference singles-doubles configuration interaction (MRSDCI) approach is tractable. In the MRSDCI calculatisons, the CI expansion is generated by exciting up to two electrons, from a chosen list of reference configurations, to the unoccupied MOs.33; 34 The reference configurations included in the MRSDCI method depend upon the states in consideration, which can be the ground state, or optically excited states.20; 21; 22; 23; 24; 25; 17; 28
Once the many-body wave functions and the energies of the ground and the excited states are obtained from the CI calculations, we compute the optical absorption cross-section , according to the formula
| (3) |
In the equation above, represents the polarization direction of the incident light, denotes its frequency, is the electronic position operator, indices and represent, respectively, the ground and excited states, is the frequency difference between those states, denotes the fine structure constant, and is the assumed universal line width. The summation over , in principle, is an infinite sum, which, in practice, is restricted to those dipole-connected excited states, whose excitation energies are within a certain cutoff, taken to be 10 eV in these calculations.
IV Results and Discussions
In this section we present the calculated linear optical absorption spectra and optical gaps of []phenacenes, and compare our results with the experiments, wherever available. Our calculations were performed using both the tight-binding (TB) model, as well as PPP model using the CI approach, and we find that our PPP-CI results are in much better agreement with experiments.
IV.1 Tight-Binding Model Results
Because the tight-binding (TB) model is an independent electron approach, therefore, results obtained using it will help us understand the influence of electron correlation effects, when compared with the results computed using the PPP-model. We first present and discuss the optical absorption spectra obtained using the TB-model, followed by a discussion of the optical gaps.
IV.1.1 Linear Optical absorption spectra
In Fig. 2, we present the optical absorption spectra of []phenacenes obtained using the TB method. An examination of the spectra reveals the following trends: (a) With the increasing lengths of the oligomers, absorption spectra are red shifted, consistent with the phenomenon of the quantum confinement effect. (b) The first peak for all the oligomers corresponds to the excitation of an electron from HOMO () to LUMO (). It corresponds to transition to state via absorption of a photon polarized along the length (-direction) of the symmetric oligomers. For symmetry, the first peak is due to state, reached via absorption of an polarized photon, with the component much stronger than the component. (c) The maximum intensity peak is the first peak for all the oligomers, except for chrysene for which the second peak is the most intense one, and it is due to excitation, where denotes the corresponding charge-conjugated configuration.
IV.1.2 Optical Gap
The locations of the first absorption peaks of []phenancenes, i.e. their optical gaps, computed using various approaches are presented in Table 1, where they are also compared to the experimental results. The following conclusions can be drawn from this table: (a) Independent of the Hamiltonian, gaps decrease with the increasing length of []phenacene, (b) the gaps obtained for []phenacenes using the TB method are much smaller compared to the corresponding experimental, as well as PPP-CI values, (c) the gaps obtained using the PPP-CI method, employing screened parameters, are in very good agreement with the experimental values.
| System | Optical gap (eV) | ||||
| TB Model | PPP-CI | Experimental | Theory (other authors) | ||
| Scr. | Std. | ||||
| Phenanthrene | 2.90 | 4.31 | 4.26 | 4.0935, 4.1712, | 3.9136, 4.19 37, |
| 4.241, 4.2438, | 4.3136, 4.3436, | ||||
| 4.2539, 4.36 40, | 4.36 41, 4.5342, | ||||
| 4.6043, 4.67 37, | |||||
| Chrysene | 2.49 | 3.86 | 3.96 | 3.7435, 3.8412, | 3.40 36, 3.4342, |
| 3.8744, 3.891, | 3.7337, 3.8236, | ||||
| 3.8938; 45, | 3.9046, 3.9236, | ||||
| 4.1341, 4.2137, | |||||
| 4.2243 | |||||
| Picene | 2.40 | 3.75 | 3.88 | 3.7612; 45, 3.771, | 3.3236, 3.70 37, |
| 3.8038, 3.8247, | 3.7236, 3.8336, | ||||
| 4.1343, 4.1937, | |||||
| Fulminene | 2.26 | 3.34 | 3.52 | 3.145, 3.2412, | 3.4737, 437, |
| 3.7645, | |||||
| [7]Phenacene | 2.19 | 3.34 | 3.68 | 3.105, 3.6045, | 3.5037, 437, |
| [8]Phenacene | 2.13 | 3.11 | 3.41 | 3.085 | — |
| [9]Phenacene | 2.08 | 3.09 | 3.46 | 3.0511, | — |
IV.2 PPP Model Based Optical absorption Spectra
In this section we present the results of our calculations of optical absorption spectra of []phenacenes, performed using the PPP-CI approach. Before we discuss our results, we present the dimensions of the CI matrices involved in the calculations, for various irreducible representations of phenancenes.
IV.2.1 Dimensions of the CI matrices
Most accurate results within the CI approach are obtained when the full-CI (FCI) calculations are performed, which involves distributing all electrons, in all available molecule orbitals, in all possible ways, consistent with the symmetries. Therefore, the size of the FCI matrix increases exponentially with the increasing size of the molecule involved, making it feasible only for small molecules. Thus, in this work we were able to perform FCI calculations only on the smallest oligomer, namely phenanthrene. For chrysene and picene we were able to perform QCI calculations. For remaning oligomers, because of their larger sizes, we employed the MRSDCI approach. Even within the truncated CI approaches such as the QCI and the MRSDCI methods, larger-sized CI expansions normally lead to more accurate results. Therefore, in the section, to illustrate the accuracy of our calculations, we present the dimensions of the MRSDCI matrices in Table 2.
| Molecules | ||||
| Phenanthrene | - | - | ||
| Chrysene | - | - | ||
| Picene | - | - | ||
| Fulminene | - | - | ||
| - | - | |||
| [7]Phenacene | - | - | ||
| - | - | |||
| [8]Phenacene | ||||
| [9]Phenacene | ||||
| FCIa method with screened and standard parameters. QCIb method with | ||||
| screened and standard parameters. MRSDCIc method with screened | ||||
| parameters. MRSDCId method with standard parameters. | ||||
It is obvious from the table that in various calculations ranges from to . This implies that our calculations employ large CI expansions, and, therefore, should be fairly accurate, yielding reliable results.
IV.2.2 Optical absorption spectra
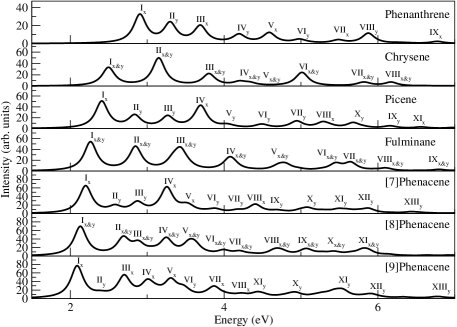
First we discuss the general trends observed in the optical absorption spectra of []phenacenes calculated using the PPP-model, and the MRSDCI approach, presented in Fig. 3.
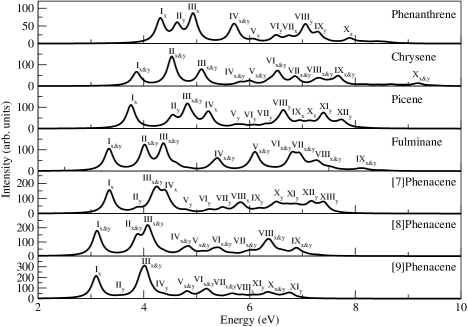
Detailed information related to peaks contributing to the spectra, such as the many-particle wave functions, energies, and transition dipole moment etc. are presented in Tables S1-S14 of Supporting Information. By carefully examining the optical absorption spectra (Fig. 3), we observed the following trends: (a) Similar to the case of TB model, with the increasing length of []phenacene, spectra is red-shifted for the screened parameter calculations. For the standard parameters, again the spectra are red-shifted, except for the case of [7]phenacene. (b) the lowest energy absorption in []phenacenes corresponds to a dipole forbidden state of symmetry for molecules, and for molecules. The wave functions of the corresponding state is dominated by single excitations for oligomers up to [7]phenacene, and , for longer oligomers. (c) In all the calculations, the first dipole-allowed peak corresponding to the optical gap is not the most intense one of the spectrum, in contradiction with the TB model results, and in agreement with the experiments. In the screened parameter calculations, the relative intensity of the first peak, as compared to the most intense peak, is much larger than that in the standard parameter calculations. In agreement with the results of TB model, the first peak for the symmetric molecules corresponds to state, and for symmetric molecules to state, and in all the cases the dominating configuration in the many-particle wave function of this state is , single excitation. (d) The maximum intensity peak occurs at higher energies, and the wave functions of the two excited states contributing to it are dominated by single excitations: (i) or , and (ii) or , which are the same excitations which contribute to the D.F. state. Next we discuss the optical absorption spectra of the individual phenacenes in detail.
Phenanthrene
Phenanthrene has symmetry, and Klevens 35, Okamoto 12, Clar 1, Salama 39 and Halasinski 40 have reported the measurements of its absorption spectrum. In Fig. 3 (a) and (b), we present our calculated spectra using the screened and standard parameters, respectively, within the PPP-CI approach, and in Table 3, we have compared our results on the locations of various peaks with the experiments, and other theoretical results. Several experimentalist have measured the first absorption peak in phenanthrene to be a very weak one, due to a dipole forbidden (D.F.) state35; 12; 1; 39. In particular Klevens 35, Okomoto 12, Clar 1 and Salama 39 measured its locations at 3.50 eV, 3.57 eV, 3.59 eV and 3.61 eV, respectively. Our standard parameter value of the D.F. state at 3.35 eV is closer to the experimental values than the screened parameter value computed to be 2.96 eV. Both our screened and standard parameter calculations predict this D.F. state to be of symmetry, in agreement with the work of Skancke 41. Our PPP-CI calculations predict that the first dipole allowed state is not the most intense one, in contradiction with the TB results. We would like to point out that this PPP-CI result is in perfect agreement with the experimental measurement of Klevens 35, Okamoto 12 and Clar 1. The location of the first dipole allowed peak, which is also the optical gap, was calculated to be 4.31 eV with screened parameters, and eV with standard parameters. These values are in good agreement with the experimental values which are measured in the range 4.09–4.36 eV (see Table 3). In particular, our results are in excellent agreement with the values 4.24 eV, 4.25 eV, and 4.36 eV, reported by Clar 1, Salama 39, and Halasinski 40, respectively.
As far as higher energy peaks are concerned, our screened parameter spectra has a peak at 4.62 eV which is in excellent agreement with the reported value 4.64 eV by Halasinski 40. The next peak is the most intense (MI) peak in our calculated spectrum for both screened as well as standard parameter calculations, and it is located at 4.93 eV and 5.19 eV, respectively. Clar 1 experimentally measured the most intense peak at 4.93 eV which exactly matches with our screened parameter value. The reported value of MI peak by Klevens 35 (4.88 eV) and Salama 39 (4.80 eV) are also very close with our obtained screened parameter value, while the MI peak obtained using standard parameter is little bit on the higher side compared to the experimental results.
After that Halasinski .40 report a peak at 5.78 eV, while Clar 1 report one at 5.65 eV. Our screened parameter peak at 5.71 eV is in excellent agreement with Halasinski .40, while the standard parameter peak at 5.59 eV, is in very good agreement with the peak reported by Clar 1.
Next experimental peak located at 6.62 eV, reported by Klevens 35, is in good agreement with our screened parameter peak computed at 6.74 eV. The highest measured peak located at 6.99 eV, reported by Klevens 35 is in excellent agreement with the peaks obtained both from screened and standard parameter calculations at 7.05 eV and 6.96 eV, respectively. Furthermore, we have computed several higher energy peaks as well, for which no experimental results exist. We hope that in future measurements of the absorption spectrum of phenanthrene, energy range beyond 7 eV will be explored.
Dutta and Mazumdar48; 49 studied the ground state of metal-intercalated crystalline phenanthrene using both ab initio density functional theory (DFT), and PPP model based approaches, with the aim of understanding the nature of superconductivity in these materials. Parac 36 have computed the absorption spectra of phenanthrene using time-dependent DFT (TDDFT) and time-dependent PPP (TDPPP) method, while Malloci 37 have computed the same using DFT and TDDFT method. By using PPP model at the singles-CI level, Skancke and Hedges have also computed the absorption spectra of phenanthrene. We present the results of these authors in Table 3, from where it is obvious that their calculated peak locations lie in a broad spectral range. Given the fact that peaks measured by various experiments also lie in a broad spectral range, the agreement between these theoretical results and experiments is quite reasonable. The detailed wave function analysis of all the excited states contributing to peaks in the computed spectra of phenanthrene, is presented in Tables S1-S2 of Supporting Information.
| Experimental | Theoretical | This Work | |
|---|---|---|---|
| (other authors) | Scr | Std | |
| 3.5035(D.F.), 3.5712(D.F.), | 3.65a/3.82b/3.97c(D.F.)36, | 2.96 () | 3.35 () |
| 3.591(D.F.), 3.6139(D.F.), | 4.0141(D.F.), 4.2243(D.F.) | (D.F.) | (D.F.) |
| 4.0935(OG), 4.1712(OG), | 3.91a/4.21c/4.34b36(OG), | 4.31 () | 4.26 () |
| 4.2438; 1(OG), 4.2539(OG), | 4.19c/4.67d 37; 42(OG), | ||
| 4.36 40(OG), | 4.36 41(OG), 4.6043(OG), | (OG) | (OG) |
| 4.3412, | |||
| 4.4239, 4.4412, | — | () | — |
| 4.5340, 4.5639, | |||
| 4.6440(MI), | |||
| 4.8039(MI) , 4.931(MI), | — | 4.93 () | |
| 4.8835(MI), 5.1040, | () | ||
| 5.2740, | (MI) | (MI) | |
| 5.651, 5.7840 , | 5.4543, 5.4742(MI), | () | |
| 5.8435, | 5.5241,5.8941(MI), | () | |
| — | 6.0142, 6.2541, | 6.07 | 6.10 |
| — | 6.3842, | 6.49 () | 6.40 () |
| 6.6235 | 6.7242, 6.7542, | 6.74 () | — |
| 6.9935 | 6.9041, 7.3942, | 7.05 () | 6.96 () |
| aTDDFT(BP86) method, bTDPPP method, | |||
| cTDDFT(B3LYP) method and dDFT(Kohan-Sham) method | |||
Chrysene
Chrysene has symmetry, and Okamoto 12, Klevens 35, Clar 1 and Becker 44 have reported the measurements of its absorption spectrum. In Fig. 3 (a) and (b), we present our calculated spectra using the screened and standard parameters, respectively, within the PPP-CI approach, and in Table 4, we have compared the experimental peak locations with our results, and those of other theoretical calculations. The first peaks observed experimentally by Klevens 35, Okomoto 12, Becker 44 and Clar 1 are located at 3.40 eV, 3.42 eV, 3.43 eV, and 3.44 eV respectively, and again correspond to a dipole forbidden (D.F.) state. Using the standard parameters, we obtain the D.F. state at 3.33 eV, which agrees well with the measured values. The screened parameter value computed at 3.11 eV, is slightly lower as compared to the experimental values. Both screened and standard parameter calculation predict the D.F. state to be of symmetry, in agreement with the work of Skancke 41.
The intensity of the first dipole allowed peak, corresponding to the optical gap, was not found to be maximum in our calculated spectra. This result is in perfect agreement with the measurements of Klevens 35, Okamoto 12, Becker 44 and Clar 1, and in disagreement with the results of the TB model. Our calculations predict this peak at 3.86 eV using screened parameters, and 3.96 eV using standard parameters. As is obvious from Table 3, the experimental values of the optical gap range from 3.74 eV to 3.89 eV, implying that both the calculated values of optical gap are quite close to the experimental values. In particular, we also note that the Okamoto 12 and Becker 44 reported the values of optical gap at 3.84 eV, and 3.87 eV, respectively, almost in perfect agreement with our screened parameter value 3.86 eV. The standard parameter value of 3.96 eV is slightly higher than the highest measured value 3.89 eV by Mallory 45 and Clar 1.
The second peak is the most intense (MI) peak in our calculated spectrum for both the screened and the standard parameters, and is located at 4.52 eV, and 5.08 eV, respectively. Okamoto 12 experimentally measured the most intense peak at 4.54 eV which almost exactly matches with our screened parameter value. The reported value of MI peak by Klevens 35 (4.61 eV), Becker 44 (4.63 eV), and Clar 1 (4.64 eV) are slightly higher than the screened parameter value, while the standard parameter result is significantly higher than the experimental values.
As far as higher energy peaks are concerned, Klevens 35, and Becker 44 found a peak at 5.13 eV, and, Clar 1 found one at 5.14 eV. In our computed spectra, we have a peak at 5.09 eV using screened parameters, and 5.08 eV using standard parameters, both of which are in good agreement with experiments. After that, in our standard parameter spectrum we have a peak at 5.76 eV, which is in very good agreement with the 5.71 eV peak detected by Becker 44, while the screened parameter peak at 5.81 eV is somewhat higher as compared to the experiments. Next experimental peak located at 6.36 eV, reported by Klevens 35, is in perfect agreement with our standard parameter peak computed at 6.38 eV. We have a screened parameter peak at 6.52 eV which is in reasonable agreement with a peak at 6.43 eV, measured by Becker 44. The highest measured peak located at 6.73 eV reported by Klevens 35 is at a slightly lower energy as compared to the corresponding screened parameter peak at 6.86 eV. Furthermore, we have computed several higher energy peaks as well, for which no experimental results exist. We hope that in future measurements of the absorption spectrum of chrysene, in higher energy range will be probed.
First principles TDDFT method was employed to calculate the absorption spectrum by Parac 36 and Malloci 37. Malloci 37 also computed the absorption spectrum using the first principles DFT. Additionally, PPP model based calculations were performed by Parac 36, Skancke 41, Ham 46 and Hedges 43.
The predictions on the location of D.F. state by other authors are in a broad energy range 3.48-4.13 eV36; 46; 43; 41, while the experimental values are in a very narrow range 3.40-3.44 eV35; 12; 44; 1. This means that most of the calculations of other authors overestimate the experimental results. Regarding the optical gap, calculations of other authors predict it in the range 3.40-4.22 eV, while the experimental values are in the range 3.74-3.89 eV, implying that most other calculations either underestimate or overestimate the experimental values. But we note that the optical gaps computed using the TDDFT approach with B3LYP functional by Parac 36, and Malloci 37, are in good agreement with experiments. As far as the location of MI peak is concerned, results of other authors are either below, or significantly above the experimental value. The wave function of the excited states contributing to peaks in the computed spectra of chrysene, are presented in Tables S3-S4 of Supporting Information.
| Experimental | Theoretical | This Work | |
|---|---|---|---|
| (other authors) | Scr | Std | |
| 3.4035(D.F.), 3.4212(D.F.), | 3.48a/3.62b/3.75c36(D.F.), | 3.11 () | 3.33 () |
| 3.4344(D.F.), 3.441(D.F.) | 3.4746(D.F.), 4.1043(D.F.) | ||
| 4.1341(D.F.), | (D.F.) | (D.F.) | |
| 3.7435(OG), 3.8412(OG), | 3.40a/3.92b/3.82c36(OG), | 3.86 () | 3.96 () |
| 3.8744(OG), | 3.73c/4.21d 37; 42(OG) | ||
| 3.8945; 1(OG), | 3.9046(OG), 4.1341(OG), | ||
| 4.2243(OG) | (OG) | (OG) | |
| 4.0012, 4.1712 | — | — | — |
| 4.5412(MI),4.6135 (MI), | 4.2642; 41 | 4.52 () | — |
| 4.6344(MI), 4.641(MI), | |||
| 4.71 12 | (MI) | ||
| 5.1335; 44, 5.141, | 4.8442(MI), 4.9346, | 5.09 () | 5.08 () |
| 5.3546, 5.3943, | |||
| 5.4743 | (MI) | ||
| 5.5944, 5.6535, | 5.4342, 5.4841, | 5.81 () | 5.76 () |
| 5.7144 | 5.7541 (MI), | ||
| — | 6.1342 | 6.00 () | — |
| 6.3635, 6.4344 | 6.3641 | 6.52 () | 6.38 () |
| 6.7335 | 6.9942 | 6.86 () | 7.17 () |
| — | 7.3241, | 7.32 () | 7.37 () |
| aTDDFT(BP86) method, bTDPPP method, | |||
| cTDDFT(B3LYP) method and dDFT(Kohan-Sham) method | |||
Picene
Picene has symmetry, and Okamoto 12, Clar 1 and Fanetti 47 have reported the measurements of its absorption spectrum. In Fig. 3 (a) and (b), we present our calculated spectra using the screened and standard parameters, respectively, within the PPP-CI approach, and in Table 5, we have compared the locations of various peaks obtained in our calculations with the experimental results, and other theoretical results. The first peak corresponding to the dipole forbidden (D.F.) state was measured to be at 3.30 eV by Okomoto ,12 and Clar 1, while Fanetti 47 measured it at 3.31 eV. Our standard parameter calculation predicts the D.F. state at 3.33 eV, in excellent agreement with the experiments, while the screened parameter value at 3.20 eV is slightly lower than the experiments. Both sets of calculations predict the D.F. state to be of symmetry.
The first dipole allowed state is computed to be of symmetry, and leads to fairly intense absorption peaks located at 3.75 eV in the screened parameter spectrum, and 3.88 eV in the standard parameter spectrum. As it is obvious from Table 3, the experimental values of the optical gap range from 3.76 eV to 3.82 eV. Thus, we find that both our screened and standard parameter of optical gap are quite close to the range of experimental values. We also note that the Okamoto 12 and Mallory 45 reported the value of optical gap at 3.76 eV, and the Clar 1 reported it at 3.77 eV, in excellent agreement with our screened parameter value. While our standard parameter value 3.88 eV agrees well with the optical gap value 3.82 eV, measured by Fanetti 47. Furthermore, our calculation predict that this peak is not the most intense one, in disagreement with the TB model results, and in complete agreement with the experiments47; 1; 12.
As far as higher energy peaks are concerned, our screened parameter spectrum has a peak at 4.54 eV which is in very good agreement with a peak at 4.57 eV measured by Fanetti 47. The next peaks which are the most intense (MI) ones in our calculated spectra using both screened and standard parameters, are located at 4.87 eV and 4.79 eV, respectively. Okamoto 12 measured a peak at 4.75 eV, which is in very good agreement with the location of our standard parameter peak. A peak measured at 4.85 eV by Fanetti 47 is in excellent agreement with the energy of our screened parameter peak.
Our calculated peaks at 5.22 eV (screened) and 5.24 eV (standard) are the nearest peaks to the highest measured peak at 5.08 eV reported by Fanetti 47. Additionally, we have computed several higher energy peaks as well, for which no experimental results exist. We hope that in future measurements of the absorption spectrum of picene, energy range beyond 5 eV will be explored.
The measured experimental value of D.F. state are in very tight energy range 3.30-3.31 eV 45; 47; 1; 12, while the D.F. state calculated by other authors lie in a broad spectral range 3.18-4.33 eV36; 43; 37. As far as optical gap is concerned, the computed values of other authors are in the range of 3.32-4.13 eV, while the experimental values are in the range 3.76-3.82 eV. Therefore, both for D.F. state and optical gap several other calculations have either underestimated or overestimated the data. But we note that Parac and Grimme 36 have obtained the optical gap value at 3.72 eV using TDDFT method which is in good agreement with experimental value 3.76 eV. They have also calculated the optical gap value using TDPPP method, which is also in good agreement with the experimental results. The detailed analysis of wave functions of the excited states contributing to peaks in the calculated spectra of picene, is presented in Tables S5-S6 of Supporting Information.
| Experimental | Theoretical | This Work | |
|---|---|---|---|
| (other authors) | Scr | Std | |
| 3.3012; 1(D.F.), | 3.18a/3.49b/3.56c36(D.F.), | 3.20 ()(D.F.) | 3.33 ()(D.F.) |
| 3.3147(D.F.) | 4.3343(D.F.) | ||
| 3.7645; 12(OG), | 3.32a/3.83b/3.72c36(OG), | 3.75 ()(OG) | 3.88 ()(OG) |
| 3.771(OG), 3.8247(OG), | 3.70c/4.19d 37(OG), | ||
| 4.1343(OG), | |||
| 3.9312, 3.9847, | — | — | — |
| 4.0612, 4.1347, | |||
| 4.26(MI)12, 4.321(MI), | — | 4.54 () | — |
| 4.3947(MI), 4.4512, | |||
| 4.5747, | |||
| 4.7247, 4.7512, | — | 4.87(MI) | 4.79(MI) |
| 4.8547 , | () | () | |
| 5.0847 | 5.1343, 5.2243 | 5.22 () | 5.24 () |
| aTDDFT(BP86) method, bTDPPP method, | |||
| cTDDFT(B3LYP) method and dDFT(Kohan-Sham) method | |||
Fulminene
Fulminene has symmetry, and Okamoto 12; 5 and Mallory 45 have measured the absorption in fulminene. In Fig. 3 (a) and (b), we present our calculated spectra using the screened and standard parameters, respectively, within the PPP-CI approach, and in Table 6, we have compared the experimental results, and theoretical results of other authors, with our calculations. The detailed wave functions analysis of all the excited states contributing to peaks in the computed spectra of fulminene, is presented in Tables S7-S8 of Supporting Information.
The first peak observed experimentally by Okomoto 12 is located at 3.24 eV, and it corresponds to a dipole forbidden (D.F.) state. Both our standard parameter and screened parameter calculations predict the symmetry of this state to be , and located at 3.07 eV, and 2.86 eV, respectively. This implies that our calculated locations of the D.F. state are lower than the experimental value, with the screened parameter value being significnatly lower.
The first dipole allowed peak, corresponding to the optical gap, was measured to be at 3.14 eV for the thin film sample by Okamoto 5, and 3.65 eV, and 3.66 eV for the solution sample, by Okamoto 5, and Mallory 45, respectively. Our screened parameter calculations predict the optical gap to be 3.34 eV, which is closer to the measured value of thin film sample, while our standard parameter value at 3.52 eV is closer to the solution based sample. This is understandable on physical grounds because, in thin films, electron correlations may be getting screened due to presence of other molecules, an effect screened parameters may be mimicking. We also note that intensity of the first dipole allowed peak is not maximum when compared to other peaks, in agreement with the measurements of the Okamoto 5.
As far as higher energy features are concerned, our screened parameter spectrum has a peak at 4.01 eV, which is in good agreement with the peaks measured at 3.95 eV12, and 4.08 eV5, in solution, and thin film, based samples, respectively. The next peak is the most intense (MI) one in our calculated spectrum for the both screened and standard parameters, located at 4.37 eV, and 4.54 eV, respectively. In solution based spectrum the most intense peak lies at 4.17 eV12 which is closer to the screened parameter value, than the standard one. Furthermore, we have computed several higher energy peaks as well, for which no experimental results exist. We hope that in future measurements of the absorption spectrum of fulminene, the energy range beyond 5 eV will be explored.
The only other calculation on fulminene is by Malloci 37, who reported the values of optical gap at 3.47 eV (TDDFT approach), and 4.00 eV (Kohn-Sham). The former value is within the range of experimental measurements, while the latter is well above it.
| Experimental | Theoretical | This Work | |
|---|---|---|---|
| (other authors) | Scr | Std | |
| 3.24 12(D.F.) | — | 2.86 ()(D.F.) | 3.07 ()(D.F.) |
| 3.145(OG), 3.6512(OG), | 3.47c/ 4.00d37(OG) | 3.34 ()(OG) | 3.52 ()(OG) |
| 3.6645 (OG), | |||
| 3.295, 3.445, | |||
| 3.905, 3.8012, | — | 4.01 () | — |
| 3.9512, 4.085 | |||
| 4.1712(MI), 4.3612, 4.6612 | — | 4.37 ()(MI) | 4.54 ()(MI) |
| cTDDFT(B3LYP) method and dDFT(Kohan-Sham) method | |||
[7]Phenacene
[7]phenacene has symmetry, and Okamoto 5, and Mallory 45 have reported the measurements of its absorption spectrum. In Fig. 3 (a) and (b), we present our calculated spectra using the screened and standard parameters, respectively, within the PPP-CI approach, and in Table 7, we have compared the experimental results, and theoretical results of other authors, with our calculations. Analysis of the calculated CI wave functions of the excited states contributing to the absorption spectra, is presented in Tables S9-S10 of Supporting Information.
Our calculations predict the dipole forbidden state to be of symmetry, located at 2.96 eV(screened parameters) and 3.31 eV (standard parameters). Because no prior experimental measurements of D.F. state are available for [7]phenacene, our results could be tested in future experiments.
On comparing the relative intensity of first dipole allowed peak, corresponding to the optical gap, we find that it is not of maximum intensity, in agreement with the measurements5; 45. Our calculations predicts this peak at 3.34 eV (screened parameters), and at 3.68 eV (standard parameters). We note that the Okamoto 5 reported the value of optical gap at 3.10 eV, which is closer to our screened parameter value, while our standard parameter value is in very good agreement with 3.60 eV, measured by Mallory 45.
As far as higher energy peaks are concerned, our screened parameter spectra has a peak at 3.88 eV which is in excellent agreement with the measured values 3.87 eV45, and 3.90 eV5. The next peak is the most intense (MI) peak in our calculated spectrum located at 4.20 eV (screened parameters) and 4.68 eV (standard parameters). Okamoto 5 and Mallory 45 experimentally measured the most intense peak at 4.08 eV which is a little lower than our screened parameter value. Furthermore, we have computed several higher energy peaks as well, for which no experimental results exist. We hope that in future measurements of the absorption spectrum of [7]phenacene, the energy range beyond 5 eV will be probed.
The only other calculation on [7]phenacene is by Malloci 37, who reported the values of optical gap at 3.50 eV (TDDFT approach), and 4.00 eV (Kohn-Sham). The former value is within the range of experimental measurements, while the latter is well above it.
| Experimental | Theoretical | This Work | |
|---|---|---|---|
| (other authors) | Scr | Std | |
| — | — | 2.96 ()(D.F.) | 3.31 ()(D.F.) |
| 3.105(OG), 3.295, | 3.50c/4.00d,37(OG), | 3.34 () | 3.68 () |
| 3.445, 3.6045(OG), | (OG) | (OG) | |
| 3.8745, 3.905 | — | 3.88 () | — |
| 4.085; 45 (MI) | — | 4.20 (/) (MI) | 4.68 () (MI) |
| cTDDFT(B3LYP) method; dDFT(Kohan-Sham) method | |||
[8]Phenacene
[8]phenacene has symmetry, and Okamoto 5 have reported the measurement its absorption spectrum. In Fig. 3 (a) and (b), we present our calculated spectra using the screened and standard parameters, respectively, within the PPP-CI approach, and in Table 8, we have compared the experimental results, with our calculations. In this molecule we have calculated a dipole forbidden (D.F.) state of symmetry, located at 2.84 eV with screened parameters, and 3.13 eV with standard parameters. However, we are unable to compare our results with the experiments, because no measurements of this state have been performed so far.
In our calculated spectra, the first dipole allowed peak corresponding to the optical gap is not the most intense peak of the spectrum, in full agreement with the experimental measurements5. The calculated locations of this peak is 3.11 eV using screened parameters, and 3.41 eV using standard parameters. We find that our screened parameter results are in excellent agreement with the experimentally measured value of 3.08 eV5.
As far as higher energy peaks are concerned, our screened parameter spectrum has a peak at 3.87 eV which is a bit higher than the measured peak at 3.64 eV5. The next peak is the most intense (MI) peak in our calculated spectrum for the both screened as well as standard parameters, and is located at 4.08 eV, and 4.48 eV, respectively. Okamoto 5 experimentally measured the most intense peak at 4.00 eV which is in very good agreement with our screened parameter value. Furthermore, we have computed several higher energy peaks as well, for which no experimental results exist. We hope that in future measurements of the absorption spectrum of [8]phenacene, energy range beyond 4 eV will be explored. Detailed information about the wave functions of the excited states contributing to peaks in the computed spectra, can be obtained in Tables S11-S12 of Supporting Information.
| Experimental | This Work | |
|---|---|---|
| Scr | Std | |
| — | 2.84 ()(D.F.) | 3.13 ()(D.F.) |
| 3.085(OG), 3.265, 3.445 | 3.11()(OG) | 3.41 ()(OG) |
| 3.645 | 3.87 () | — |
| 4.005 (MI) | 4.08 ()(MI) | 4.48 ()(MI) |
[9]Phenacene
[9]phenacene has symmetry, and Shimo 11 have reported the measurement of its absorption spectrum. In Fig. 3 (a) and (b), we present our calculated spectra using the screened and standard parameters, respectively, within the PPP-CI approach, and in Table 9, we have compared the experimental results, with our calculations. Additionally, detailed information about the excited states contributing to peaks in the computed spectra is presented in Tables S13-S14 of Supporting Information.
Our calculations locate a dipole forbidden (D.F.) state of symmetry, at 2.92 eV, with screened parameters, and at 3.29 eV with standard parameters. However, we are unable to compare our results with the experiments, because no measurements of this state have been performed so far.
In this molecule as well, our calculations predict that the first dipole-allowed peak corresponding to the optical gap, is not the most intense peak of the spectrum, in full agreement with the experiment,11 and in disagreement with the results of the TB model calculations. As far as the value of optical gap is concerned, our calculations predict it to be 3.09 eV obtained using the screened parameters, and 3.46 eV using the standard parameters. We note that our screened parameter value is in very good agreement with the value 3.05 measured by Shimo 11.
As far as higher energy peaks are concerned, our screened parameter spectrum has a peak at 3.54 eV, which is somewhat higher than 3.33 eV measured by Shimo 11. The most intense (MI) peaks in our calculated spectra for screened as well as standard parameters are located at 3.98 eV, and 5.0 eV, respectively. In the experimental spectrum of Shimo 11, the intensity appears to increase monotonically in the region 3.60-4.00 eV, beyond which no measurements exist. This implies that the maximum intensity peak is at an energy higher than 4.00 eV, which we hope will be confirmed in future measurements. Furthermore, we have computed several higher energy peaks as well, which we hope will also be verified in future measurements beyond 4 eV. We are unable to compare our results with calculations of other authors, because our calculations appear to be the first ones on this molecule.
| Experimental | This Work | |
|---|---|---|
| Scr | Std | |
| — | 2.92 ()(D.F.) | 3.29 ()(D.F.) |
| 3.0511(OG), 3.2211 | 3.09 ()(OG) | 3.46 ()(OG) |
| 3.3311 | 3.54 () | — |
| — | 3.98(/) (MI) | — |
| — | 4.38 () | 4.21 (/) |
| — | 4.8 (/) | — |
| — | 5.13 (/) | 5.0 ()(MI) |
IV.3 Comparison between Phenacenes and Polyacenes
As mentioned in the Introduction section, phenacenes and polyacenes are isomers, they have same chemical formula but different structural arrangement. In polyacenes, benzene rings are fused in a straight line and they belong to point group. While, in phenacenes, benzene rings are fused in a zig-zag manner, leading either to or symmetry. In an earlier work in our group, Sony .17 computed the absorption spectra of oligoacenes ranging from naphthalene to heptacene, and, later on Chakraborty 24 extended the work till decacene. In Table 10 we compare our calculated optical gaps for isomers containing 3 to 9 benzene rings, and we find that irrespective of parameters used, the optical gaps of []phenacenes are always larger than those of acene-. We also note the relative difference in the optical gaps of two set of compounds increases with the increasing conjugation length. These facts are also verified in the optical absorption experiments on phenacenes cited in the present work, as well those on acenes reviewed in our earlier work.17 Additionally, Roth et al.50 performed a comparative study of singlet states in two of the smallest phenacenes (phenanthrene and chrysene), and acenes (anthracene and tetracene) in the crystalline phase, using the electron-energy-loss spectroscopy (EELS), and concluded that absorptions occur in acenes at much lower energies as compared to corresponding phenacenes. This, combined with our theoretical calculations, suggests that the lowest singlet excitations in both acene and phenacene molecular crystals are intramolecular in nature. Thus, experimental and theoretical evidence suggests that as far as optoelectronic device applications are concerned, phenacenes will be useful in higher frequency range, as compared to oligoacenes.
| Phenacenes | Optical | Oligoacenes | Optical | ||
|---|---|---|---|---|---|
| (This work) | gap (eV) | (Sony .17 and Chakraborty 24) | gap (eV) | ||
| Scr. | Std. | Scr. | Std. | ||
| Phenanthrene | 4.31 | 4.26 | Anthracene17 | 3.55 | 3.66 |
| Chrysene | 3.86 | 3.96 | Tetracene17 | 2.97 | 3.16 |
| Picene | 3.75 | 3.88 | Pentacene17 | 2.65 | 2.86 |
| Fulminene | 3.34 | 3.52 | Hexacene17 | 2.38 | 2.71 |
| [7]Phenacene | 3.34 | 3.68 | Heptacene17 | 2.24 | 2.63 |
| [8]Phenacene | 3.11 | 3.41 | Octacene24 | 1.49 | 2.24 |
| [9]Phenacene | 3.09 | 3.46 | Nonacene24 | 1.46 | 1.82 |
V Summary and Conclusions
In this paper, we presented the results of our calculations of optical absorption spectra of []phenacenes, with 3-9. The calculation were performed using both the tight-binding, and PPP models, and for the case of PPP model, electron correlation effects were taken into account within the configuration-interaction approach. Our calculations reveal that the inclusion of electron correlation effect is very important for the correct qualitative and quantitative description of optical properties of these materials. For example, optical gaps predicted by TB model are much smaller than their experimental values, and the predictions of our PPP-CI calculations. We find our PPP-CI values of the optical gaps are generally in very good agreement with the experimentally values. Furthermore, the TB model predicts for all the molecules that the first dipole allowed peak corresponding the optical gap is the most intense peak of the spectrum, in complete disagreement with the experiments, as well as results of our PPP-CI calculations. Moreover, predictions of our PPP-CI calculations on absorption peaks higher than the optical gap are also in very good agreement with the experiments.
We also compared the calculated optical gaps of []phenacene with their isomeric oligoacenes, and noted that gaps of []phenacenes are significantly larger. This is in agreement not only with numerous optical absorption experiments performed on these molecules, but also with a comparative EELS study of crystalline phenanthrene, chryesene, anthracene, and tetracene.50 This further validates our theory, and also confirms that the lowest optical excitations in these materials are intramolecular excitons. Furthermore, this suggests that []phenacenes can have optoelectronic applications in the higher energy range.
In this paper, we have confined ourselves to the study of the optical properties of []phenacenes for their ground states, i.e., in the singlet manifold. However, in these materials, triplet states, and their optics, are also very interesting, from the point of view of light harvesting through the route of singlet fission, which we aim to study in future. We also plan to explore the non-linear optical processes in phenacenes such as two-photon absorption, and third-harmonic generation, in future works.
Acknowledgements.
This research was supported in part by Department of Science and Technology, Government of India, under project no. SB/S2/CMP-066/2013.References
- Clar and Schoental (1964) E. Clar and R. Schoental, Polycyclic hydrocarbons, Vol. 1 (Springer, 1964).
- Dwek et al. (1997) E. Dwek, R. Arendt, D. Fixsen, T. Sodroski, N. Odegard, J. Weiland, W. Reach, M. Hauser, T. Kelsall, S. Moseley, et al., The Astrophysical Journal 475, 565 (1997).
- Boström et al. (2002) C.-E. Boström, P. Gerde, A. Hanberg, B. Jernström, C. Johansson, T. Kyrklund, A. Rannug, M. Törnqvist, K. Victorin, and R. Westerholm, Environmental health perspectives 110, 451 (2002).
- Lawal (2017) A. T. Lawal, Cogent Environmental Science 3, 1339841 (2017), https://www.tandfonline.com/doi/pdf/10.1080/23311843.2017.1339841 .
- Okamoto et al. (2014) H. Okamoto, R. Eguchi, S. Hamao, H. Goto, K. Gotoh, Y. Sakai, M. Izumi, Y. Takaguchi, S. Gohda, and Y. Kubozono, Scientific reports 4, 5330 (2014).
- Witte and Wöll (2004) G. Witte and C. Wöll, Journal of Materials Research 19, 1889 (2004).
- Cicoira and Santato (2007) F. Cicoira and C. Santato, Advanced Functional Materials 17, 3421 (2007).
- Raghunath et al. (2006) P. Raghunath, M. A. Reddy, C. Gouri, K. Bhanuprakash, and V. J. Rao, The Journal of Physical Chemistry A 110, 1152 (2006).
- Yamashita (2009) Y. Yamashita, Science and Technology of Advanced Materials 10, 024313 (2009), https://doi.org/10.1088/1468-6996/10/2/024313 .
- Kubozono et al. (2014) Y. Kubozono, X. He, S. Hamao, K. Teranishi, H. Goto, R. Eguchi, T. Kambe, S. Gohda, and Y. Nishihara, European Journal of Inorganic Chemistry 2014, 3806 (2014).
- Shimo et al. (2016a) Y. Shimo, T. Mikami, S. Hamao, H. Goto, H. Okamoto, R. Eguchi, S. Gohda, Y. Hayashi, and Y. Kubozono, Scientific reports 6, 21008 (2016a).
- Okamoto et al. (2013) H. Okamoto, M. Yamaji, S. Gohda, K. Sato, H. Sugino, and K. Satake, Research on Chemical Intermediates 39, 147 (2013).
- Komura et al. (2012) N. Komura, H. Goto, X. He, H. Mitamura, R. Eguchi, Y. Kaji, H. Okamoto, Y. Sugawara, S. Gohda, K. Sato, et al., Applied Physics Letters 101, 083301 (2012).
- Shimo et al. (2016b) Y. Shimo, T. Mikami, S. Hamao, H. Goto, H. Okamoto, R. Eguchi, S. Gohda, Y. Hayashi, and Y. Kubozono, Scientific Reports 6, 21008 (2016b), https://doi.org/10.1038/srep21008 .
- Mitsuhashi et al. (2010) R. Mitsuhashi, Y. Suzuki, Y. Yamanari, H. Mitamura, N. I. Takashi Kambe, H. Okamoto, A. Fujiwara, M. Yamaji, N. Kawasaki, Y. Maniwa, and Y. Kubozono, Nature 464, 76 (2010), https://www.nature.com/articles/nature08859 .
- Gundra and Shukla (2013) K. Gundra and A. Shukla, “A pariser–parr–pople model hamiltonian-based approach to the electronic structure and optical properties of graphene nanostructures,” in Topological Modelling of Nanostructures and Extended Systems, edited by A. R. Ashrafi, F. Cataldo, A. Iranmanesh, and O. Ori (Springer Netherlands, Dordrecht, 2013) pp. 199–227.
- Sony and Shukla (2007) P. Sony and A. Shukla, Phys. Rev. B 75, 155208 (2007).
- Pople (1953) J. A. Pople, Trans. Faraday Soc. 49, 1375 (1953).
- Pariser and Parr (1953) R. Pariser and R. G. Parr, J. Chem. Phys. 21, 767 (1953).
- Shukla (2002) A. Shukla, Phys. Rev. B 65, 125204 (2002).
- Shukla (2004) A. Shukla, Phys. Rev. B 69, 165218 (2004).
- Sony and Shukla (2005) P. Sony and A. Shukla, Phys. Rev. B 71, 165204 (2005).
- Sony and Shukla (2009) P. Sony and A. Shukla, The Journal of Chemical Physics 131, 014302 (2009).
- Chakraborty and Shukla (2013) H. Chakraborty and A. Shukla, The Journal of Physical Chemistry A 117, 14220 (2013).
- Chakraborty and Shukla (2014) H. Chakraborty and A. Shukla, The Journal of Chemical Physics 141, 164301 (2014).
- Aryanpour et al. (2014a) K. Aryanpour, A. Roberts, A. Sandhu, R. Rathore, A. Shukla, and S. Mazumdar, The Journal of Physical Chemistry C 118, 3331 (2014a).
- Aryanpour et al. (2014b) K. Aryanpour, A. Shukla, and S. Mazumdar, The Journal of Chemical Physics 140, 104301 (2014b).
- Basak et al. (2015) T. Basak, H. Chakraborty, and A. Shukla, Phys. Rev. B 92, 205404 (2015).
- Basak and Shukla (2016) T. Basak and A. Shukla, Phys. Rev. B 93, 235432 (2016).
- Ohno (1964) K. Ohno, Theoretica chimica acta 2, 219 (1964).
- Chandross and Mazumdar (1997) M. Chandross and S. Mazumdar, Phys. Rev. B 55, 1497 (1997).
- Sony and Shukla (2010) P. Sony and A. Shukla, Computer Physics Communications 181, 821 (2010).
- Buenker and Peyerimhoff (1974) R. Buenker and S. Peyerimhoff, Theor. Chim. Acta 35, 33 (1974).
- Buenker et al. (1978) R. J. Buenker, S. D. Peyerimhoff, and W. Butscher, Molecular Physics 35, 771 (1978).
- Klevens and Platt (1949) H. Klevens and J. Platt, The Journal of Chemical Physics 17, 470 (1949).
- Parac and Grimme (2003) M. Parac and S. Grimme, Chemical physics 292, 11 (2003).
- Malloci et al. (2011) G. Malloci, G. Cappellini, G. Mulas, and A. Mattoni, Chemical Physics 384, 19 (2011).
- Birks (1970) J. B. Birks, Photophysics of aromatic molecules (1970).
- Salama and Allamandola (1993) F. Salama and L. J. Allamandola, Journal of the Chemical lectronic absorption spectra of PAHsSociety, Faraday Transactions 89, 2277 (1993).
- Halasinski et al. (2005) T. Halasinski, F. Salama, and L. Allamandola, The Astrophysical Journal 628, 555 (2005).
- Skancke (1965) P. Skancke, ACTA CHEMICA SCANDINAVICA 19, 401 (1965).
- Malloci et al. (2004) G. Malloci, G. Mulas, and C. Joblin, Astronomy & Astrophysics 426, 105 (2004).
- Hedges and Phillips (1968) R. Hedges and L. Phillips, Theoretical Chemistry Accounts: Theory, Computation, and Modeling (Theoretica Chimica Acta) 10, 73 (1968).
- Becker et al. (1963) R. S. Becker, I. S. Singh, and E. A. Jackson, The Journal of Chemical Physics 38, 2144 (1963).
- Mallory et al. (1997) F. B. Mallory, K. E. Butler, A. C. Evans, E. J. Brondyke, C. W. Mallory, C. Yang, and A. Ellenstein, Journal of the American Chemical Society 119, 2119 (1997).
- Ham and Ruedenberg (1956) N. S. Ham and K. Ruedenberg, The Journal of Chemical Physics 25, 13 (1956).
- Fanetti et al. (2012) S. Fanetti, M. Citroni, R. Bini, L. Malavasi, G. A. Artioli, and P. Postorino, The Journal of chemical physics 137, 224506 (2012).
- Dutta and Mazumdar (2014) T. Dutta and S. Mazumdar, Phys. Rev. B 89, 245129 (2014).
- Dutta and Mazumdar (2016) T. Dutta and S. Mazumdar, arXiv:1607.03198 (2016).
- Roth et al. (2013) F. Roth, B. Mahns, S. Hampel, M. Nohr, H. Berger, B. Büchner, and M. Knupfer, The European Physical Journal B 86, 66 (2013).