22institutetext: ICREA, Pg. Lluís Companys 23, 08010 Barcelona, Spain 33institutetext: Núcleo de Astronomía de la Facultad de Ingeniería y Ciencias, Universidad Diego Portales, Av. Ejército Libertador 441, Santiago, Chile 44institutetext: Institute for Astronomy, Astrophysics, Space Applications & Remote Sensing, National Observatory of Athens, GR-15236, Penteli, Greece 55institutetext: University of Crete, Department of Physics, GR-71003, Heraklion, Greece 66institutetext: Kavli Institute for Astronomy and Astrophysics, Peking University, Beijing 100871, China 77institutetext: Chinese Academy of Sciences South America Center for Astronomy, Camino El Observatorio 1515, Las Condes, Santiago, Chile 88institutetext: Gemini North Observatory, 670 N. A‘ohoku Place, Hilo, HI 96720 99institutetext: Institute for Astronomy, University of Hawaii, 2680 Woodlawn Drive, Honolulu, HI 96822, USA 1010institutetext: Infrared Processing and Analysis Center, MC 314-6, Caltech, 1200 E. California Blvd., Pasadena, CA 91125, USA 1111institutetext: National Radio Astronomy Observatory, 520 Edgemont Road, Charlottesville, VA 22903, USA 1212institutetext: Joint ALMA Observatory, Alonso de Córdova 3107, Vitacura, Santiago, Chile 1313institutetext: Department of Astronomy, University of Virginia, P.O. Box 400325, Charlottesville, VA 22904, USA 1414institutetext: Univ Lyon, Univ Lyon1, Ens de Lyon, CNRS, Centre de Recherche Astrophysique de Lyon (CRAL) UMR5574, F-69230, SaintGenis-Laval, France 1515institutetext: Cahill Center for Astronomy and Astrophysics, California Institute of Technology, MS 249-17, Pasadena, CA 91125, USA 1616institutetext: Research School of Astronomy & Astrophysics, Australian National University, Canberra, ACT 2611, Australia 1717institutetext: Department of Astronomy, University of Florida, 211 Bryant Space Sciences Center, Gainesville, 32611 FL, USA 1818institutetext: Department of Physics and Astronomy, 4129 Frederick Reines Hall, University of California, Irvine, CA 92697, USA
C-GOALS II. Chandra Observations of the Lower Luminosity Sample of Nearby Luminous Infrared Galaxies in GOALS
We analyze Chandra X-ray observatory data for a sample of 63 luminous infrared galaxies (LIRGs), sampling the lower-infrared luminosity range of the Great Observatories All-Sky LIRG survey (GOALS), which includes the most luminous infrared selected galaxies in the local universe. X-rays are detected for 84 individual galaxies within the 63 systems, for which arcsecond resolution X-ray images, fluxes, infrared and X-ray luminosities, spectra and radial profiles are presented. Using X-ray and MIR selection criteria, we find AGN in (315)% of the galaxy sample, compared to the (386)% previously found for GOALS galaxies with higher infrared luminosities (C-GOALS I). Using mid-infrared data, we find that (599)% of the X-ray selected AGN in the full C-GOALS sample do not contribute significantly to the bolometric luminosity of the host galaxy. Dual AGN are detected in two systems, implying a dual AGN fraction in systems that contain at least one AGN of (2914)%, compared to the (1110)% found for the C-GOALS I sample. Through analysis of radial profiles, we derive that most sources, and almost all AGN, in the sample are compact, with half of the soft X-ray emission generated within the inner kpc. For most galaxies, the soft X-ray sizes of the sources are comparable to those of the MIR emission. We also find that the hard X-ray faintness previously reported for the bright C-GOALS I sources is also observed in the brightest LIRGs within the sample, with L⊙.
1 Introduction
Luminous and Ultra-luminous Infrared Galaxies (LIRGs and ULIRGs) are galaxies with infrared (IR) luminosities exceeding and respectively. U/LIRGs are normally found to be gas-rich galaxy mergers, as tidal torques can funnel material from kpc-scales to the innermost regions of the galaxy and trigger intense star formation and/or AGN activity (e.g. Hernquist, 1989; Sanders, 1999; Di Matteo et al., 2005), the latter more significant with increasing infrared luminosity (e.g. Valiante et al., 2009; Petric et al., 2011; Alonso-Herrero et al., 2012).
These objects, common at redshifts where the peak of star formation in the universe is observed, represent a very important stage in galaxy evolution (e.g. Casey et al., 2014). The scenario proposed by e.g. Sanders et al., 1988; Hopkins et al., 2005, indicates that after a complete obscuration phase of the merger, ULIRGs in a late stage of the interaction would later disperse or consume the gas and probably evolve into an obscured, type II quasar (QSO), and eventually into an exposed QSO. This process will ultimately lead to the formation of an elliptical galaxy, and accounts for the growth of the central supermassive black hole (e.g. Sanders et al., 1988, Hopkins et al., 2009).
In agreement with this scenario, recent studies of pairs of galaxies have found that the fraction of dual AGN grows with decreasing separation between companions (e.g. Ellison et al., 2011; Satyapal et al., 2014, 2017; Silverman et al., 2011; Koss et al., 2012). More specifically, in a sample of U/LIRGs, Stierwalt et al. (2013) find an increase in the fraction of composite systems with merger stage. Satyapal et al. (2014) find larger fractions of IR-selected AGN with respect to optically-selected AGN in mergers, which is likely due to the increase of obscuration. Evidences of and excess of AGN with large obscuring column densities in mergers are also found in recents works (e.g. Díaz-Santos et al., 2010; Kocevski et al., 2015; Del Moro et al., 2016; Lanzuisi et al., 2015; Ricci et al., 2017).
X-ray observations are an ideal tool to analyze properties of the inner regions of such obscured objects, due to the higher transparency of the gas and dust with respect to larger wavelengths. Previous studies of small (e.g. Franceschini et al., 2003; Ptak et al., 2003; Teng et al., 2005) and larger (e.g. Teng & Veilleux, 2010; Iwasawa et al., 2011; Ricci et al., 2017) samples of ULIRGs highlight the potential of X-rays in disentangling the AGN and starburst contribution and ability to detect enshrouded AGN.
Amongst the recent works, C-GOALS I (Chandra-GOALS I, Iwasawa et al., 2011), is an X-ray study performed with the Chandra X-ray Observatory (Chandra, hereafter, Weisskopf et al., 2000) of a complete sample of luminous infrared galaxies within the Great Observatories All-Sky LIRG Survey (GOALS, Armus et al., 2009). GOALS is a multi-wavelength study of the brightest infrared galaxies in the local Universe, a low-redshift subsample of the 60 m flux selected IRAS Revised Bright Galaxy Sample (RBGS, Sanders et al., 2003). The GOALS galaxies, all at z0.088, are perfect laboratories for multi-wavelength studies of luminous infrared galaxies with a level of detail that only the observation of local galaxies allows. The arcsecond resolution provided by Chandra can offer information of individual galaxies within mergers, and help disentangle previously undetected or unresolved AGN, in particular complementing studies of U/LIRGs at harder X-rays (e.g. Ricci et al., 2017).
The C-GOALS I paper presents data obtained by us and others with Chandra and represents the X-ray component of the multi-wavelength survey for the most luminous infrared GOALS sources. This work, C-GOALS II, extends the X-ray study to a subsample of the lower luminosity range of GOALS galaxies. These data were obtained during Chandra cycle 13 (PI: Sanders), combined with available archival data. The extension of the X-ray sample is motivated by the interest in reaching completeness in all wavelengths for the GOALS sample, and by the opportunity of comparing results derived at different infrared luminosity ranges. The sample contains galaxies at earlier merger stages, contributing to the expansion of previous studies into the domain of the less luminous LIRGS. In particular, Iwasawa et al. (2011) observed a deviation in the correlation between infrared and X-ray luminosities in nearby star-forming galaxies (e.g. Ranalli et al., 2003; Grimm et al., 2003; Mineo et al., 2014) for the galaxies in the C-GOALS I sample. Galaxies in the C-GOALS II sample have infrared luminosities that fall into the range where this change of behavior should occur, and are ideal to further study the reasons and possible implications of such deviation.
The C-GOALS II sample is described and compared to the C-GOALS I sample in Sect. 2. The observations and data reduction are described in Sect. 3. Results, including all X-ray images, fluxes, spectra and radial surface brightness profiles, are presented in Sect. 4, while derived properties and discussion of the X-ray and infrared luminosity correlation are presented in Sect. 5. Finally, we summarize our conclusions in Sect. 6. Notes on individual objects can be found in Appendix A, and X-ray contours, detailed images in the and keV bands, along with radial surface brightness profiles for each source, can be found in Appendix B.
2 The Sample
|
|
|
|
|
|
|
|
||||||||||||||||||||
| 45 | F13182+3424 | UGC 08387 | 13h 20m 35.34s | +34d 08m 22.2s | 0.0233 | 110.0 | 11.73 | ||||||||||||||||||||
| 47 | F01173+1405 | CGCG 436030 | 01h 20m 02.72s | +14d 21m 42.9s | 0.0312 | 134.0 | 11.69 | ||||||||||||||||||||
| 49 | F01484+2220 | NGC 0695 | 01h 51m 14.24s | 22d 34m 56.5s | 0.0325 | 139.0 | 11.69 | ||||||||||||||||||||
| 50 | F12592+0436 | CGCG 043099 | 13h 01m 50.80s | +04d 20m 00.0s | 0.0375 | 175.0 | 11.68 | ||||||||||||||||||||
| 51 | F11011+4107 | MCG+0723019 | 11h 03m 53.20s | +40d 50m 57.0s | 0.0345 | 158.0 | 11.62 | ||||||||||||||||||||
| 52 | F18329+5950 | NGC 6670 | 18h 33m 35.91s | +59d 53m 20.2s | 0.0289 | 129.5 | 11.65 | ||||||||||||||||||||
| 53 | F02512+1446 | UGC 02369 | 02h 54m 01.78s | +14d 58m 24.9s | 0.0312 | 136.0 | 11.67 | ||||||||||||||||||||
| 54 | F043150840 | NGC 1614 | 04h 33m 59.85s | 08d 34m 44.0s | 0.0159 | 67.8 | 11.65 | ||||||||||||||||||||
| 56 | F13497+0220 | NGC 5331 | 13h 52m 16.29s | +02d 06m 17.0s | 0.0330 | 155.0 | 11.66 | ||||||||||||||||||||
| 57 | F060762139 | IRAS F060762139 | 06h 09m 45.81s | 21d 40m 23.7s | 0.0374 | 165.0 | 11.65 | ||||||||||||||||||||
| 60 | F11231+1456 | IC 2810 | 11h 25m 47.30s | +14d 40m 21.1s | 0.0342 | 157.0 | 11.64 | ||||||||||||||||||||
| 63 | 18090+0130 | IRAS 18090+0130 | 18h 11m 35.91s | +01d 31m 41.3s | 0.0342 | 134.0 | 11.65 | ||||||||||||||||||||
| 64 | F01417+1651 | III Zw 035 | 01h 44m 30.45s | +17d 06m 05.0s | 0.0274 | 119.0 | 11.64 | ||||||||||||||||||||
| 65 | F102574339 | NGC 3256 | 10h 27m 51.27s | 43d 54m 13.8s | 0.0094 | 38.9 | 11.64 | ||||||||||||||||||||
| 67 | F163990937 | IRAS F163990937 | 16h 42m 40.21s | 09d 43m 14.4s | 0.0270 | 128.0 | 11.63 | ||||||||||||||||||||
| 68 | F161640746 | IRAS F161640746 | 16h 19m 11.79s | 07d 54m 02.8s | 0.0272 | 128.0 | 11.62 | ||||||||||||||||||||
| 69 | F180935744 | IC 4686/7 | 18h 13m 39.63s | 57d 43m 31.3s | 0.0173 | 81.9 | 11.62 | ||||||||||||||||||||
| 71 | F08354+2555 | NGC 2623 | 08h 38m 24.08s | +25d 45m 16.6s | 0.0185 | 84.1 | 11.60 | ||||||||||||||||||||
| 72 | F23135+2517 | IC 5298 | 23h 16m 00.70s | +25d 33m 24.1s | 0.0274 | 119.0 | 11.60 | ||||||||||||||||||||
| 73 | 20351+2521 | IRAS 20351+2521 | 20h 37m 17.72s | +25d 31m 37.7s | 0.0337 | 151.0 | 11.61 | ||||||||||||||||||||
| 75 | F16104+5235 | NGC 6090 | 16h 11m 40.70s | +52d 27m 24.0s | 0.0293 | 137.0 | 11.58 | ||||||||||||||||||||
| 79 | F13362+4831 | NGC 5256 | 13h 38m 17.52s | +48d 16m 36.7s | 0.0279 | 129.0 | 11.56 | ||||||||||||||||||||
| 80 | F03359+1523 | IRAS F03359+1523 | 03h 38m 46.70s | +15d 32m 55.0s | 0.0354 | 152.0 | 11.55 | ||||||||||||||||||||
| 81 | F041911855 | ESO 550IG025 | 04h 21m 20.02s | 18d 48m 47.6s | 0.0322 | 135.8 | 11.51 | ||||||||||||||||||||
| 82 | F000851223 | NGC 0034 | 00h 11m 06.55s | 12d 06m 26.3s | 0.0196 | 84.1 | 11.49 | ||||||||||||||||||||
| 83 | F00506+7248 | MCG+1202001 | 00h 54m 03.61s | +73d 05m 11.8s | 0.0157 | 69.8 | 11.50 | ||||||||||||||||||||
| 85 | F171381017 | IRAS F171381017 | 17h 16m 35.79s | 10d 20m 39.4s | 0.0173 | 84.0 | 11.49 | ||||||||||||||||||||
| 95 | F120433140 | ESO 440IG058 | 12h 06m 51.82s | 31d 56m 53.1s | 0.0232 | 112.0 | 11.43 | ||||||||||||||||||||
| 100 | F214533511 | NGC 7130 | 21h 48m 19.50s | 34d 57m 04.7s | 0.0162 | 72.7 | 11.42 | ||||||||||||||||||||
| 104 | F23488+1949 | NGC 7771 | 23h 51m 24.88s | +20d 06m 42.6s | 0.0143 | 61.2 | 11.40 | ||||||||||||||||||||
| 105 | F231570441 | NGC 7592 | 23h 18m 22.20s | 04d 24m 57.6s | 0.0244 | 106.0 | 11.40 | ||||||||||||||||||||
| 106 | F16577+5900 | NGC 6286 | 16h 58m 31.38s | +58d 56m 10.5s | 0.0183 | 85.7 | 11.37 | ||||||||||||||||||||
| 107 | F12590+2934 | NGC 4922 | 13h 01m 24.89s | +29d 18m 40.0s | 0.0236 | 111.0 | 11.38 | ||||||||||||||||||||
| 110 | F100150614 | NGC 3110 | 10h 04m 02.11s | 06d 28m 29.2s | 0.0169 | 79.5 | 11.37 | ||||||||||||||||||||
| 114 | F004022349 | NGC 0232 | 00h 42m 45.82s | 23d 33m 40.9s | 0.0227 | 95.2 | 11.44 | ||||||||||||||||||||
| 117 | F09333+4841 | MCG+0818013 | 09h 36m 37.19s | +48d 28m 27.7s | 0.0259 | 117.0 | 11.34 | ||||||||||||||||||||
| 120 | F15107+0724 | CGCG 049057 | 15h 13m 13.09s | +07d 13m 31.8s | 0.0130 | 65.4 | 11.35 | ||||||||||||||||||||
| 121 | F024010013 | NGC 1068 | 02h 42m 40.71s | 00d 00m 47.8s | 0.0038 | 15.9 | 11.40 | ||||||||||||||||||||
| 123 | F02435+1253 | UGC 02238 | 02h 46m 17.49s | +13d 05m 44.4s | 0.0219 | 92.4 | 11.33 | ||||||||||||||||||||
| 127 | F131971627 | MCG0334064 | 13h 22m 24.46s | 16d 43m 42.9s | 0.0165 | 82.2 | 11.28 | ||||||||||||||||||||
| 134 | F003443349 | ESO 350IG038 | 00h 36m 52.25s | 33d 33m 18.1s | 0.0206 | 89.0 | 11.28 | ||||||||||||||||||||
| 136 | F233940353 | MCG0160022 | 23h 42m 00.85s | 03d 36m 54.6s | 0.0232 | 100.0 | 11.27 | ||||||||||||||||||||
| 141 | F09437+0317 | IC 0563/4 | 09h 46m 20.71s | +03d 03m 30.5s | 0.0200 | 92.9 | 11.23 | ||||||||||||||||||||
| 142 | F132292934 | NGC 5135 | 13h 25m 44.06s | 29d 50m 01.2s | 0.0137 | 60.9 | 11.30 | ||||||||||||||||||||
| 144 | F13126+2453 | IC 0860 | 13h 15m 03.53s | +24d 37m 07.9s | 0.0112 | 56.8 | 11.14 | ||||||||||||||||||||
| 147 | F221323705 | IC 5179 | 22h 16m 09.10s | 36d 50m 37.4s | 0.0114 | 51.4 | 11.24 | ||||||||||||||||||||
| 148 | F03514+1546 | CGCG 465012 | 03h 54m 16.08s | +15d 55m 43.4s | 0.0222 | 94.3 | 11.20 | ||||||||||||||||||||
| 157 | F125961529 | MCG0233098/9 | 13h 02m 19.70s | 15d 46m 03.0s | 0.0159 | 78.7 | 11.17 | ||||||||||||||||||||
| 163 | F122430036 | NGC 4418 | 12h 26m 54.62s | 00d 52m 39.2s | 0.0073 | 36.5 | 11.19 | ||||||||||||||||||||
| 169 | F213303846 | ESO 343IG013 | 21h 36m 10.83s | 38d 32m 37.9s | 0.0191 | 85.8 | 11.14 | ||||||||||||||||||||
| 170 | F06107+7822 | NGC 2146 | 06h 18m 37.71s | +78d 21m 25.3s | 0.0030 | 17.5 | 11.12 | ||||||||||||||||||||
| 174 | F14280+3126 | NGC 5653 | 14h 30m 10.42s | +31d 12m 55.8s | 0.0119 | 60.2 | 11.13 | ||||||||||||||||||||
| 178 | F12116+5448 | NGC 4194 | 12h 14m 09.47s | +54d 31m 36.6s | 0.0083 | 43.0 | 11.10 | ||||||||||||||||||||
| 179 | F23157+0618 | NGC 7591 | 23h 18m 16.28s | +06d 35m 08.9s | 0.0165 | 71.4 | 11.12 | ||||||||||||||||||||
| 182 | F00073+2538 | NGC 0023 | 00h 09m 53.41s | +25d 55m 25.6s | 0.0152 | 65.2 | 11.12 | ||||||||||||||||||||
| 188 | F231334251 | NGC 7552 | 23h 16m 10.77s | 42d 35m 05.4s | 0.0054 | 23.5 | 11.11 | ||||||||||||||||||||
| 191 | F041183207 | ESO 420G013 | 04h 13m 49.69s | 32d 00m 25.1s | 0.0119 | 51.0 | 11.07 | ||||||||||||||||||||
| 194 | 084243130 | ESO 432IG006 | 08h 44m 28.07s | 31d 41m 40.6s | 0.0162 | 74.4 | 11.08 | ||||||||||||||||||||
| 195 | F05365+6921 | NGC 1961 | 05h 42m 04.65s | +69d 22m 42.4s | 0.0131 | 59.0 | 11.06 | ||||||||||||||||||||
| 196 | F23444+2911 | NGC 7752/3 | 23h 47m 01.70s | +29d 28m 16.3s | 0.0162 | 73.6 | 11.07 | ||||||||||||||||||||
| 198 | F033163618 | NGC 1365 | 03h 33m 36.37s | 36d 08m 25.4s | 0.0055 | 17.9 | 11.00 | ||||||||||||||||||||
| 199 | F10196+2149 | NGC 3221 | 10h 22m 19.98s | +21d 34m 10.5s | 0.0137 | 65.7 | 11.09 | ||||||||||||||||||||
| 201 | F020711023 | NGC 0838 | 02h 09m 38.58s | 10d 08m 46.3s | 0.0128 | 53.8 | 11.05 |
-
•
Notes: Column(1): object number, also used in other tables. Column (2): original IRAS source, where an “F” prefix indicates the Faint Source Catalog and no prefix indicates the Point Source Catalog. Column (3): optical cross-identification, when available from NED. Columns (4), (5) and (6): the best available right ascension (J2000), declination and heliocentric redshift from NED as of October 2008. Column (7): the luminosity distance derived by correcting the heliocentric velocity for the 3-attractor flow model of Mould et al. (2000) and adopting cosmological parameters = 73 km s-1 Mpc-2, = 0.73, and = 0.27, as provided by NED. Column (8): the total (8-1000) m luminosity in log10 Solar units as in (Armus et al., 2009).
GOALS (Armus et al., 2009) is a comprehensive study of 201 of the most luminous infrared-selected galaxies in the local Universe. The sample consists of 179 LIRGs and 22 ULIRGs, 85 of which are systems that contain multiple galaxies. GOALS is drawn from the IRAS Revised Bright Galaxy Sample (RBGS, Sanders et al., 2003), with a luminosity threshold of . The RBGS is a complete sample of galaxies, covering the whole sky, that have IRAS 60 m flux densities above 5.24 Jy and Galactic latitude º.
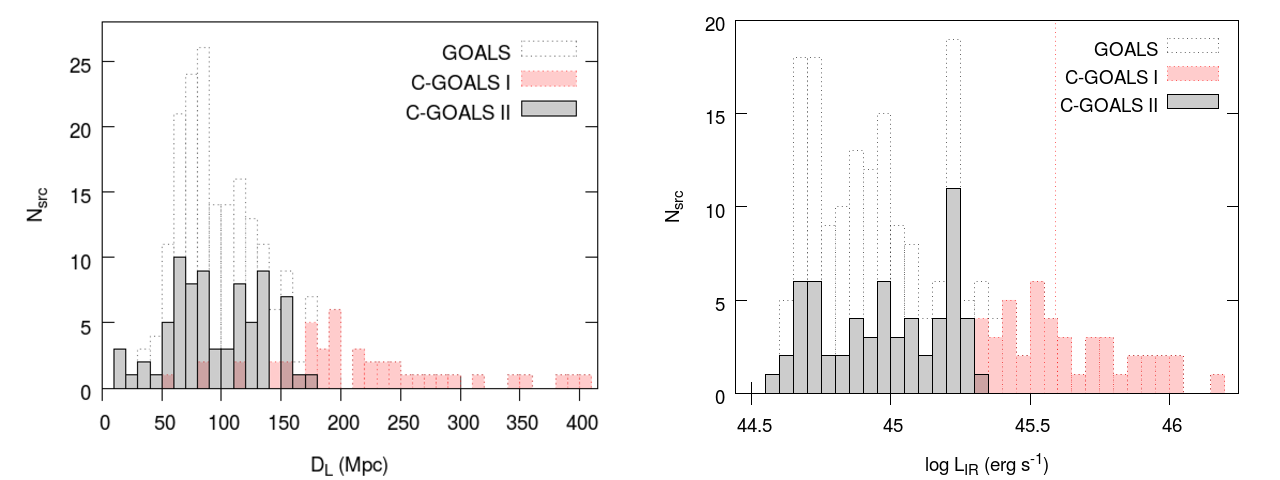
Iwasawa et al. (2011) studied a subsample of GOALS, C-GOALS I (hereafter, also CGI), which is complete in the higher infrared luminosity end of the GOALS sample (). It contains 44 systems in the redshift range . The new sample, C-GOALS II (hereafter, also CGII), is an incomplete subsample of the lower luminosity section of GOALS, and includes all sources in the range with available Chandra data, as of January 2016. It is comprised of 63 systems, 30 of which contain multiple galaxies. The redshift range of the new sample is . The distribution of infrared luminosities and distances of the two samples is shown in Fig. 1. Table 1 gives basic parameters for all the objects in the C-GOALS II sample. Note that names and positions refer to the infrared detected systems. Decomposition into individual galaxies is taken into account in Sect. 4.
Figure 1 also evidences the incompleteness of CGII, comparing it with the full GOALS distribution of distances and luminosities. Of the 63 systems within CGII, 31 were observed through the same proposal, which was drawn to be representative of all possible merger stages. For the remaining 32 systems, data were taken from the archive according to availability. The proposal for which observing time was awarded varies in each case, and all targeting different scientific goals (e.g. study of AGN, SFR, X-ray binaries). For this reason, we do not expect our subsample to be biased toward a certain type of object, merger stage nor luminosity within the parent GOALS sample.
3 Observations and Data reduction
Thirty-one systems were observed with Chandra in cycle-13 (PI: Sanders) with a 15ks exposure on each target, carried out in imaging mode with the ACIS-S detector in VFAINT mode (Garmire et al., 2003). For the remaining 32 objects studied in this work, Chandra data were obtained from the Archive. Exposure times for these targets vary from 4.88 to 58.34 ks, all taken with the ACIS-S detector in either FAINT or VFAINT mode. Table 2 shows the observation log for the whole CGII sample, as well as the total source counts in the keV band for each object, obtained from the data analysis. The counts are derived for individual galaxies, and summed together when an object within the CGII sample contains more than one galaxy.
The data reduction was performed using the Chandra data analysis package CIAO version 4.7 (Fruscione et al., 2006), and HEASARC’s FTOOLS (Blackburn, 1995). The cosmology adopted here is consistent with that adopted by Armus et al. (2009) and Iwasawa et al. (2011). Cosmological distances were computed by fist correcting for the 3-attractor flow model of Mould et al. (2000) and adopting km s-1 Mpc-1, , and based on the 5-year WMAP results (Hinshaw et al., 2009), as provided by the NASA/IPAC Extragalactic Database (NED).
|
|
|
|
|
|
|
|
||||||||||||||||
| 45 | UGC 08387 | 7811 | 20070219 | VFAINT | 14.07 | 277.9 17.1 | 1.0 | ||||||||||||||||
| 47 | CGCG 436030 | 15047 | 20121124 | VFAINT | 13.82 | 168.6 13.8 | 3.4 | ||||||||||||||||
| 49 | NGC 0695 | 15046 | 20130101 | VFAINT | 14.78 | 312.9 18.5 | 6.9 | ||||||||||||||||
| 50 | CGCG 043099 | 15048 | 20121123 | VFAINT | 14.78 | 71.9 8.1 | 1.9 | ||||||||||||||||
| 51 | MCG+0723019 | 12977 | 20110207 | VFAINT | 52.34 | 506.9 26.8 | 1.0 | ||||||||||||||||
| 52 | NGC 6670 | 15049 | 20130208 | VFAINT | 14.77 | 252.7 16.8 | 3.9 | ||||||||||||||||
| 53 | UGC 02369 | 4058 | 20021214 | FAINT | 9.68 | 120.6 12.0 | 7.9 | ||||||||||||||||
| 54 | NGC 1614 | 15050 | 20121121 | VFAINT | 15.76 | 800.0 28.9 | 6.3 | ||||||||||||||||
| 56 | NGC 5331 | 15051 | 20130512 | VFAINT | 14.78 | 121.9 12.4 | 2.0 | ||||||||||||||||
| 57 | IRAS F060762139 | 15052 | 20121212 | VFAINT | 14.78 | 52.4 8.2 | 7.6 | ||||||||||||||||
| 60 | IC 2810 | 15053 | 20131027 | VFAINT | 14.78 | 93.2 11.7 | 2.5 | ||||||||||||||||
| 63 | IRAS 18090+0130 | 15054 | 20130210 | VFAINT | 14.77 | 98.9 11.3 | 20.2 | ||||||||||||||||
| 64 | III Zw 035 | 6855 | 20060224 | FAINT | 14.98 | 81.4 9.0 | 4.8 | ||||||||||||||||
| 65 | NGC 3256 | 835 | 20000105 | FAINT | 27.80 | 8117.2 102.3 | 9.1 | ||||||||||||||||
| 67 | IRAS F163990937 | 15055 | 20130630 | VFAINT | 14.87 | 161.9 14.4 | 13.0 | ||||||||||||||||
| 68 | IRAS F161640746 | 15057 | 20130119 | VFAINT | 14.78 | 99.2 11.3 | 11.3 | ||||||||||||||||
| 69 | IC 4686/7 | 15056 | 20121119 | VFAINT | 14.48 | 519.7 23.8 | 11.5 | ||||||||||||||||
| 71 | NGC 2623 | 4059 | 20030103 | FAINT | 19.79 | 171.0 14.1 | 3.1 | ||||||||||||||||
| 72 | IC 5298 | 15059 | 20130204 | VFAINT | 14.78 | 222.8 16.0 | 5.7 | ||||||||||||||||
| 73 | IRAS 20351+2521 | 15058 | 20121213 | VFAINT | 13.56 | 146.8 14.0 | 13.1 | ||||||||||||||||
| 75 | NGC 6090 | 6859 | 20060514 | FAINT | 14.79 | 347.5 19.3 | 1.6 | ||||||||||||||||
| 79 | NGC 5256 | 2044 | 20011102 | FAINT | 19.69 | 1451.2 43.5 | 1.7 | ||||||||||||||||
| 80 | IRAS F03359+1523 | 6856 | 20051217 | FAINT | 14.76 | 108.2 11.4 | 13.8 | ||||||||||||||||
| 81 | ESO 550IG025 | 15060 | 20121124 | VFAINT | 14.78 | 72.2 10.6 | 3.2 | ||||||||||||||||
| 82 | NGC 0034 | 15061 | 20130605 | VFAINT | 14.78 | 329.0 19.5 | 2.1 | ||||||||||||||||
| 83 | MCG+1202001 | 15062 | 20121122 | VFAINT | 14.31 | 311.0 19.3 | 22.0 | ||||||||||||||||
| 85 | IRAS F171381017 | 15063 | 20130712 | VFAINT | 14.78 | 2073 15.4 | 17.0 | ||||||||||||||||
| 95 | ESO 440IG058 | 15064 | 20130320 | VFAINT | 14.78 | 187.0 16.1 | 5.6 | ||||||||||||||||
| 100 | NGC 7130 | 2188 | 20011023 | FAINT | 38.64 | 3327.1 59.3 | 1.9 | ||||||||||||||||
| 104 | NGC 7771 | 10397 | 20090522 | VFAINT | 16.71 | 904.6 34.6 | 4.0 | ||||||||||||||||
| 105 | NGC 7592 | 6860 | 20061015 | FAINT | 14.99 | 388.7 21.9 | 3.8 | ||||||||||||||||
| 106 | NGC 6286 | 10566 | 20090918 | FAINT | 14.00 | 544.8 27.9 | 1.8 | ||||||||||||||||
| 107 | NGC 4922 | 15065 | 20131102 | VFAINT | 14.86 | 202.9 17.2 | 0.9 | ||||||||||||||||
| 110 | NGC 3110 | 15069 | 20130202 | VFAINT | 14.87 | 396.3 22.3 | 3.5 | ||||||||||||||||
| 114 | NGC 0232 | 15066 | 20130104 | VFAINT | 14.78 | 193.5 15.7 | 1.4 | ||||||||||||||||
| 117 | MCG+0818013 | 15067 | 20130603 | VFAINT | 13.79 | 101.7 11.1 | 1.7 | ||||||||||||||||
| 120 | CGCG 049057 | 10399 | 20090417 | VFAINT | 19.06 | 30.2 7.6 | 2.6 | ||||||||||||||||
| 121 | NGC 1068 | 344 | 20000221 | FAINT | 47.44 | 100828.1 326.7 | 2.9 | ||||||||||||||||
| 123 | UGC 02238 | 15068 | 20121202 | VFAINT | 14.87 | 132.1 13.5 | 8.9 | ||||||||||||||||
| 127 | MCG0334064 | 7373 | 20060731 | FAINT | 7.09 | 1029.3 32.9 | 5.0 | ||||||||||||||||
| 134 | ESO 350IG038 | 8175 | 20061028 | VFAINT | 54.00 | 1794.5 45.8 | 2.4 | ||||||||||||||||
| 136 | MCG0160022 | 10570 | 20090813 | FAINT | 18.90 | 325.4 21.7 | 3.6 | ||||||||||||||||
| 141 | IC 0563/4 | 15070 | 20130119 | VFAINT | 14.96 | 252.5 18.9 | 3.8 | ||||||||||||||||
| 142 | NGC 5135 | 2187 | 20010904 | FAINT | 29.30 | 3975.9 68.0 | 4.9 | ||||||||||||||||
| 144 | IC 0860 | 10400 | 20090324 | VFAINT | 19.15 | 25.9 7.2 | 1.0 | ||||||||||||||||
| 147 | IC 5179 | 10392 | 20090621 | VFAINT | 11.96 | 555.5 32.2 | 1.4 | ||||||||||||||||
| 148 | CGCG 465012 | 15071 | 20121217 | VFAINT | 14.87 | 134.0 13.4 | 14.8 | ||||||||||||||||
| 157 | MCG0233098/9 | 15072 | 20130508 | VFAINT | 14.87 | 141.0 12.4 | 3.7 | ||||||||||||||||
| 163 | NGC 4418 | 4060 | 20030310 | FAINT | 19.81 | 59.6 15.3 | 1.9 | ||||||||||||||||
| 169 | ESO 343IG013 | 15073 | 20130613 | VFAINT | 14.78 | 139.6 13.9 | 2.8 | ||||||||||||||||
| 170 | NGC 2146 | 3135 | 20021116 | FAINT | 10.02 | 2144.2 50.4 | 7.1 | ||||||||||||||||
| 174 | NGC 5653 | 10396 | 20090411 | VFAINT | 16.52 | 387.1 22.8 | 1.3 | ||||||||||||||||
| 178 | NGC 4194 | 7071 | 20060909 | FAINT | 35.50 | 2410.3 51.4 | 1.5 | ||||||||||||||||
| 179 | NGC 7591 | 10264 | 20090705 | FAINT | 4.88 | 26.3 6.1 | 5.6 | ||||||||||||||||
| 182 | NGC 0023 | 10401 | 20081027 | VFAINT | 19.45 | 753.1 31.9 | 3.4 | ||||||||||||||||
| 188 | NGC 7552 | 7848 | 20070331 | FAINT | 5.08 | 832.8 30.2 | 1.2 | ||||||||||||||||
| 191 | ESO 420G013 | 10393 | 20090513 | VFAINT | 12.42 | 759.0 29.2 | 2.1 | ||||||||||||||||
| 194 | ESO 432IG006 | 15074 | 20130624 | VFAINT | 16.05 | 280.7 20.0 | 19.3 | ||||||||||||||||
| 195 | NGC 1961 | 10531 | 20090508 | VFAINT | 32.83 | 723.3 40.0 | 8.1 | ||||||||||||||||
| 196 | NGC 7752/3 | 10569 | 20090830 | FAINT | 11.99 | 96.0 12.7 | 5.4 | ||||||||||||||||
| 198 | NGC 1365 | 6869 | 20060420 | FAINT | 15.54 | 4644.2 72.7 | 1.3 | ||||||||||||||||
| 199 | NGC 3221 | 10398 | 20090319 | VFAINT | 19.03 | 323.5 28.3 | 1.9 | ||||||||||||||||
| 201 | NGC 0838 | 15667 | 20130721 | VFAINT | 58.34 | 1996.0 49.6 | 2.6 |
-
•
Notes: (a) The source counts are background corrected and measured in the 0.57.0 keV band. The counts from separate components in a single system are obtained separately and then summed together. (b) The Galactic absorption column density is taken from the LAB HI map by Kalberla et al. (2005).
4 Results
| No. |
|
|
|
||||||
| 47 | CGCG 436030 (W) | 100 | 5 | ||||||
| 52 | NGC 6670 (W) | 62 | 1 | ||||||
| 53 | UGC 02369 (S) | 98 | 2 | ||||||
| 56 | NGC 5331 (S) | 81 | 1 | ||||||
| 57 | IRAS F060762139 (N) | 88 | 2 | ||||||
| 60 | IC 2810 (NW) | 68 | 1 | ||||||
| 63 | IRAS 18090+0130 (E) | 81 | 1 | ||||||
| 64 | III Zw 035 (N) | 100 | 5 | ||||||
| 67 | IRAS F163990937 (N) | 90 | 3 | ||||||
| 69 | IC 4687 (N,S)* | 66,22 | 1 | ||||||
| 75 | NGC 6090 (NE) | 90 | 4 | ||||||
| 79 | NGC 5256 (SW) | 63 | 2 | ||||||
| 80 | IRAS F03359+1523 (E) | 100 | 5 | ||||||
| 81 | ESO 550IG025 (N) | 59 | 1 | ||||||
| 83 | MCG+1202001 (E,W)* | 90,10 | 2 | ||||||
| 95 | ESO 440IG058 (S) | 89 | 1 | ||||||
| 104 | NGC 7771 | 90 | 1 | ||||||
| 105 | NGC 7592 (E,S)* | 63,0 | 2 | ||||||
| 106 | NGC 6286 | 87 | 1 | ||||||
| 107 | NGC 4922 (N) | 99 | 2 | ||||||
| 110 | NGC 3110 (NE) | 91 | 1 | ||||||
| 117 | MCG+0818013 (E) | 97 | 1 | ||||||
| 127 | MCG0334064 | 75 | 1 | ||||||
| 141 | IC 0564 | 54 | 1 | ||||||
| 157 | MCG0233098/9 (W) | 69 | 2 | ||||||
| 163 | NGC 4418 | 99 | 1 | ||||||
| 169 | ESO 343IG013 (N) | 78 | 2 | ||||||
| 179 | NGC 7591 | 94 | 1 | ||||||
| 194 | ESO 432IG006 (SW) | 63 | 1 | ||||||
| 196 | NGC 7753 | 64 | 1 |
-
•
Notes: Column (1): name of the galaxy (galaxies) which emits most of the IR luminosity in a double (triple) system. Column (2): percentage of IR emission originating in the dominant component. Column (3): Reference from which the contribution to the IR luminosity is derived.
1: Derived from Herschel data (as in Chu et al., 2017).
2: Derived from MIPS 24 data (as in Díaz-Santos et al., 2010).
3: MIR determination from Haan et al. (2011).
4: Predicted IR emission from radio continuum in Hattori et al. (2004).
5: Refer to Notes on individual objects in Appendix A.
(*) Triple component galaxy.
Results of the X-ray analysis of the Chandra data are presented in Table 3. For each galaxy we present the background-corrected ACIS-S X-ray soft band ( keV) count rate and X-ray hard band ( keV) count rate, the hardness ratio or X-ray color, estimated X-ray fluxes and luminosities in both soft and hard band, and the logarithmic ratio of each X-ray band to the infrared luminosity listed in Table 1, -. X-ray color, or hardness ratio, is computed as , using the bands previously defined.
Individual galaxies belonging to the same GOALS system (i.e. contributing to one single IRAS source) are identified by using the same GOALS Number. in the first column. Source names shown in the second column are used throughout this work; see Appendix A for clarification on the identification of each component.
Note that the hard X-ray flux () listed in Table 3 is in the keV band, where Chandra is more sensitive; and the listed hard X-ray luminosities () refer to the the keV band. Spectral fitting to derive the fluxes is performed in the keV range as described in Sect. 4.4, and the fitted models are posteriorly used to estimate the luminosity up to 10 keV, in order to compare the derived results to those of previous works, in which the keV band is used.
Although significant intrinsic absorption in dusty objects such as LIRGs is likely present, X-ray luminosities are estimated by correcting for galactic absorption only. The X-ray spectra of our galaxies are complex, containing multiple components, with different degrees of obscuration, as explained in Sect. 4.4. As the estimated absorbing column density values are heavily model dependent, we do not use them to correct the luminosities listed in Table 3.
As mentioned in Sect. 2, many of the LIRGs in the CGII sample are composed of multiple galaxies, which are associated to a single GOALS object, as IRAS is unable to resolve them. All spatially resolved components in the Chandra data are presented separately, their count rates, fluxes and luminosities computed individually. In order to obtain the X-ray to infrared ratios listed in Table 3, the IRAS flux associated to each object must be appropriately separated into the corresponding contribution of each component. This separation is carried out according to the best possible estimate available for each source, as listed in Table 4. The most accurate estimation would be derived by obtaining the separate contribution of each component from the FIR emission. Whenever possible, this is done using Herschel photometric data (Chu et al., 2017). However, 14 of the multiple systems in the sample are unresolved by Herschel, and thus the mid-infrared Spitzer MIPS 24 data are used for this purpose.
For four systems in the sample the individual components remain unresolved at mid-infrared wavelengths, and other determinations are used, as specified in Table 4 and Appendix A.
Only objects that are detected in X-rays and contribute to at least 10% of the infrared luminosity of the IRAS source are analyzed and presented in this work. This cut means that out of the 63 GOALS systems in the sample, 84 individual galaxies are studied in CGII. No galaxy contributing to the IR has a strong X-ray emission, but in cases in which the source is detected in the Chandra data, it is specified in Appendix A. For all galaxies in pairs that are not included in the analysis, their contribution to the IR luminosity of the bright component is taken into account.
4.1 X-ray images
We show how the X-ray radiation is related to the optical and IR emission, by comparing the keV brightness contours with HST, SDSS or IRAC images according to availability, in this order of preference. Appendix B shows X-ray contours overlaid on HST-ACS F814W (I-band) images (Evans et al. in prep.) for 27 objects, overlaid on SDSS DR-12 i-band images (Alam et al., 2015) for 18 objects and overlaid on IRAC channel 1 images (Armus et al., 2009, Mazzarella et al. in prep.) for the remaining 18 objects.
The contours are taken from a keV image, smoothed using a Gaussian filter with a dispersion of 1 arcsec, with the exception of NGC 5135, shown in Appendix B, for which a smoothing of 0.5 arcsec was used in order to preserve the two X-ray central peaks.
Eleven contour levels were defined, divided into ten equal logarithmic intervals, in the four different surface brightness ranges shown in Table 5. “Interval 1” is used for the majority of the sample. In order to outline lower surface brightness features in some sources, eleven contour levels starting at a lower surface brightness values were taken, as “Interval 2” or “Interval 3”. For a few systems, a higher lower surface brightness limit was taken in order to eliminate noisy features in the contours, defined as “Interval 4”. For bright objects NGC 1068 and NGC 1365, 21 contour levels were used instead, in order to reflect the X-ray morphology appropriately. Appendix B contains information on both which optical or IR image was used to overlay the X-ray contours on, and the Interval used for X-ray contour ranges.
| Interval |
|
|
|
||||||
| 1 | 11 | ||||||||
| 2 | 11 | ||||||||
| 3 | 11 | ||||||||
| 4 | 11 | ||||||||
| Galaxy |
|
|
|
||||||
| CGCG 465-012 | 11 | ||||||||
| NGC 1068 | 21 | ||||||||
| NGC 5135 | 11 | ||||||||
| NGC 1365 | 21 | ||||||||
| NGC 0838 | 11 |
-
•
Notes: Column (1) and (2): lower and higher contour in [counts s-1 arcsec-1] for the given interval, respectively. (4): number of logarithmic contour levels.
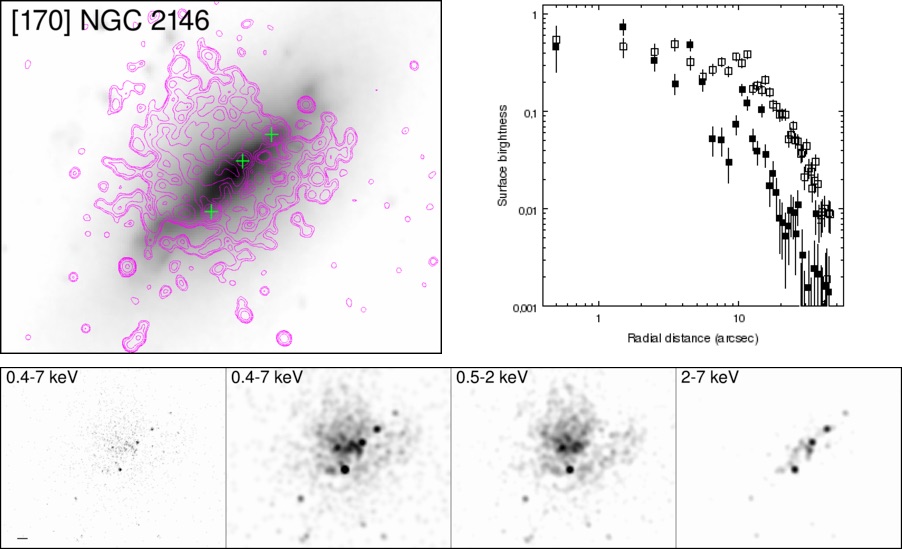
As the hard-band emission from all objects is generally more peaked and less intense than the soft-band emission, the contours mostly trace soft X-ray emission from the sources. For this reason, in sources for which one or more clear hard X-ray peaks are seen, these are marked with a green cross. We define a hard X-ray peak as point-source emission that clearly stands out from the rest of the photon distribution in the unsmoothed images. In cases where many point-like sources that are clearly not associated with any central source in the galaxy are present in an image, we opt not to mark them all individually. For a more detailed description of the X-ray emission in both bands, Appendix B also presents the smoothed and unsmoothed images in the keV band, and smoothed images in the soft ( keV) and hard ( keV) bands, for all objects. An example of one of these images is shown in Fig. 2.
4.2 X-ray spectra
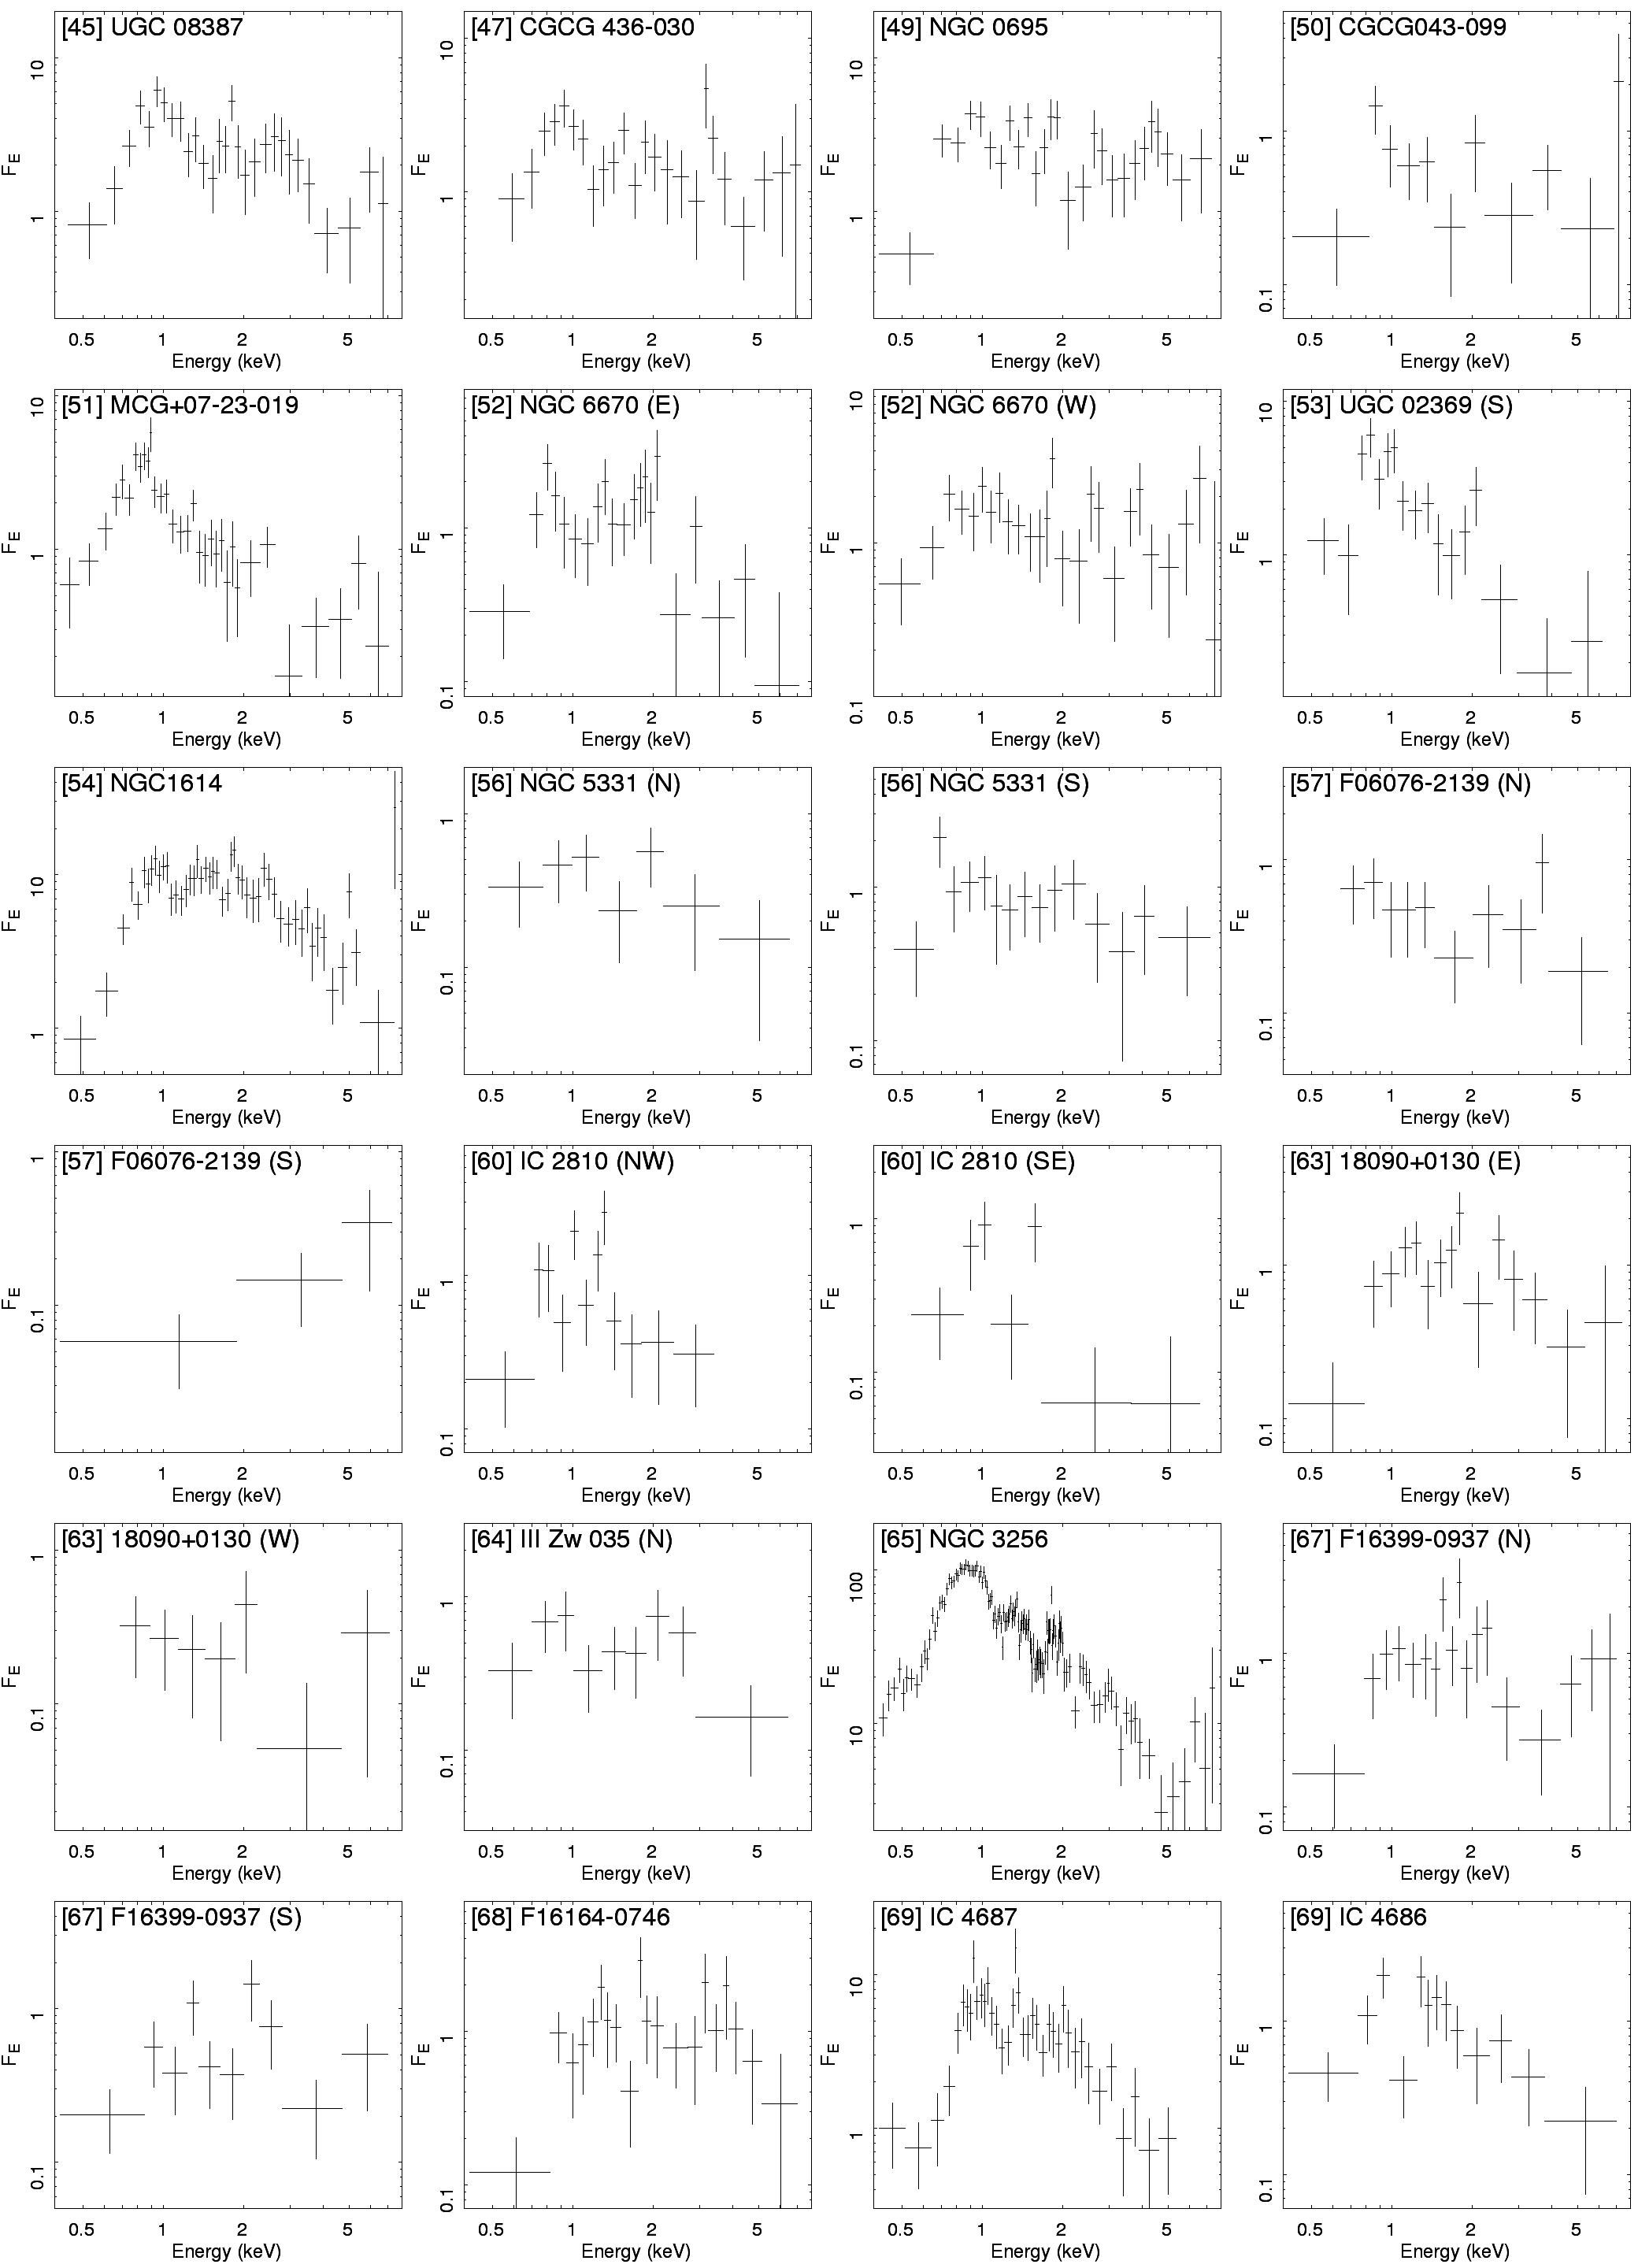
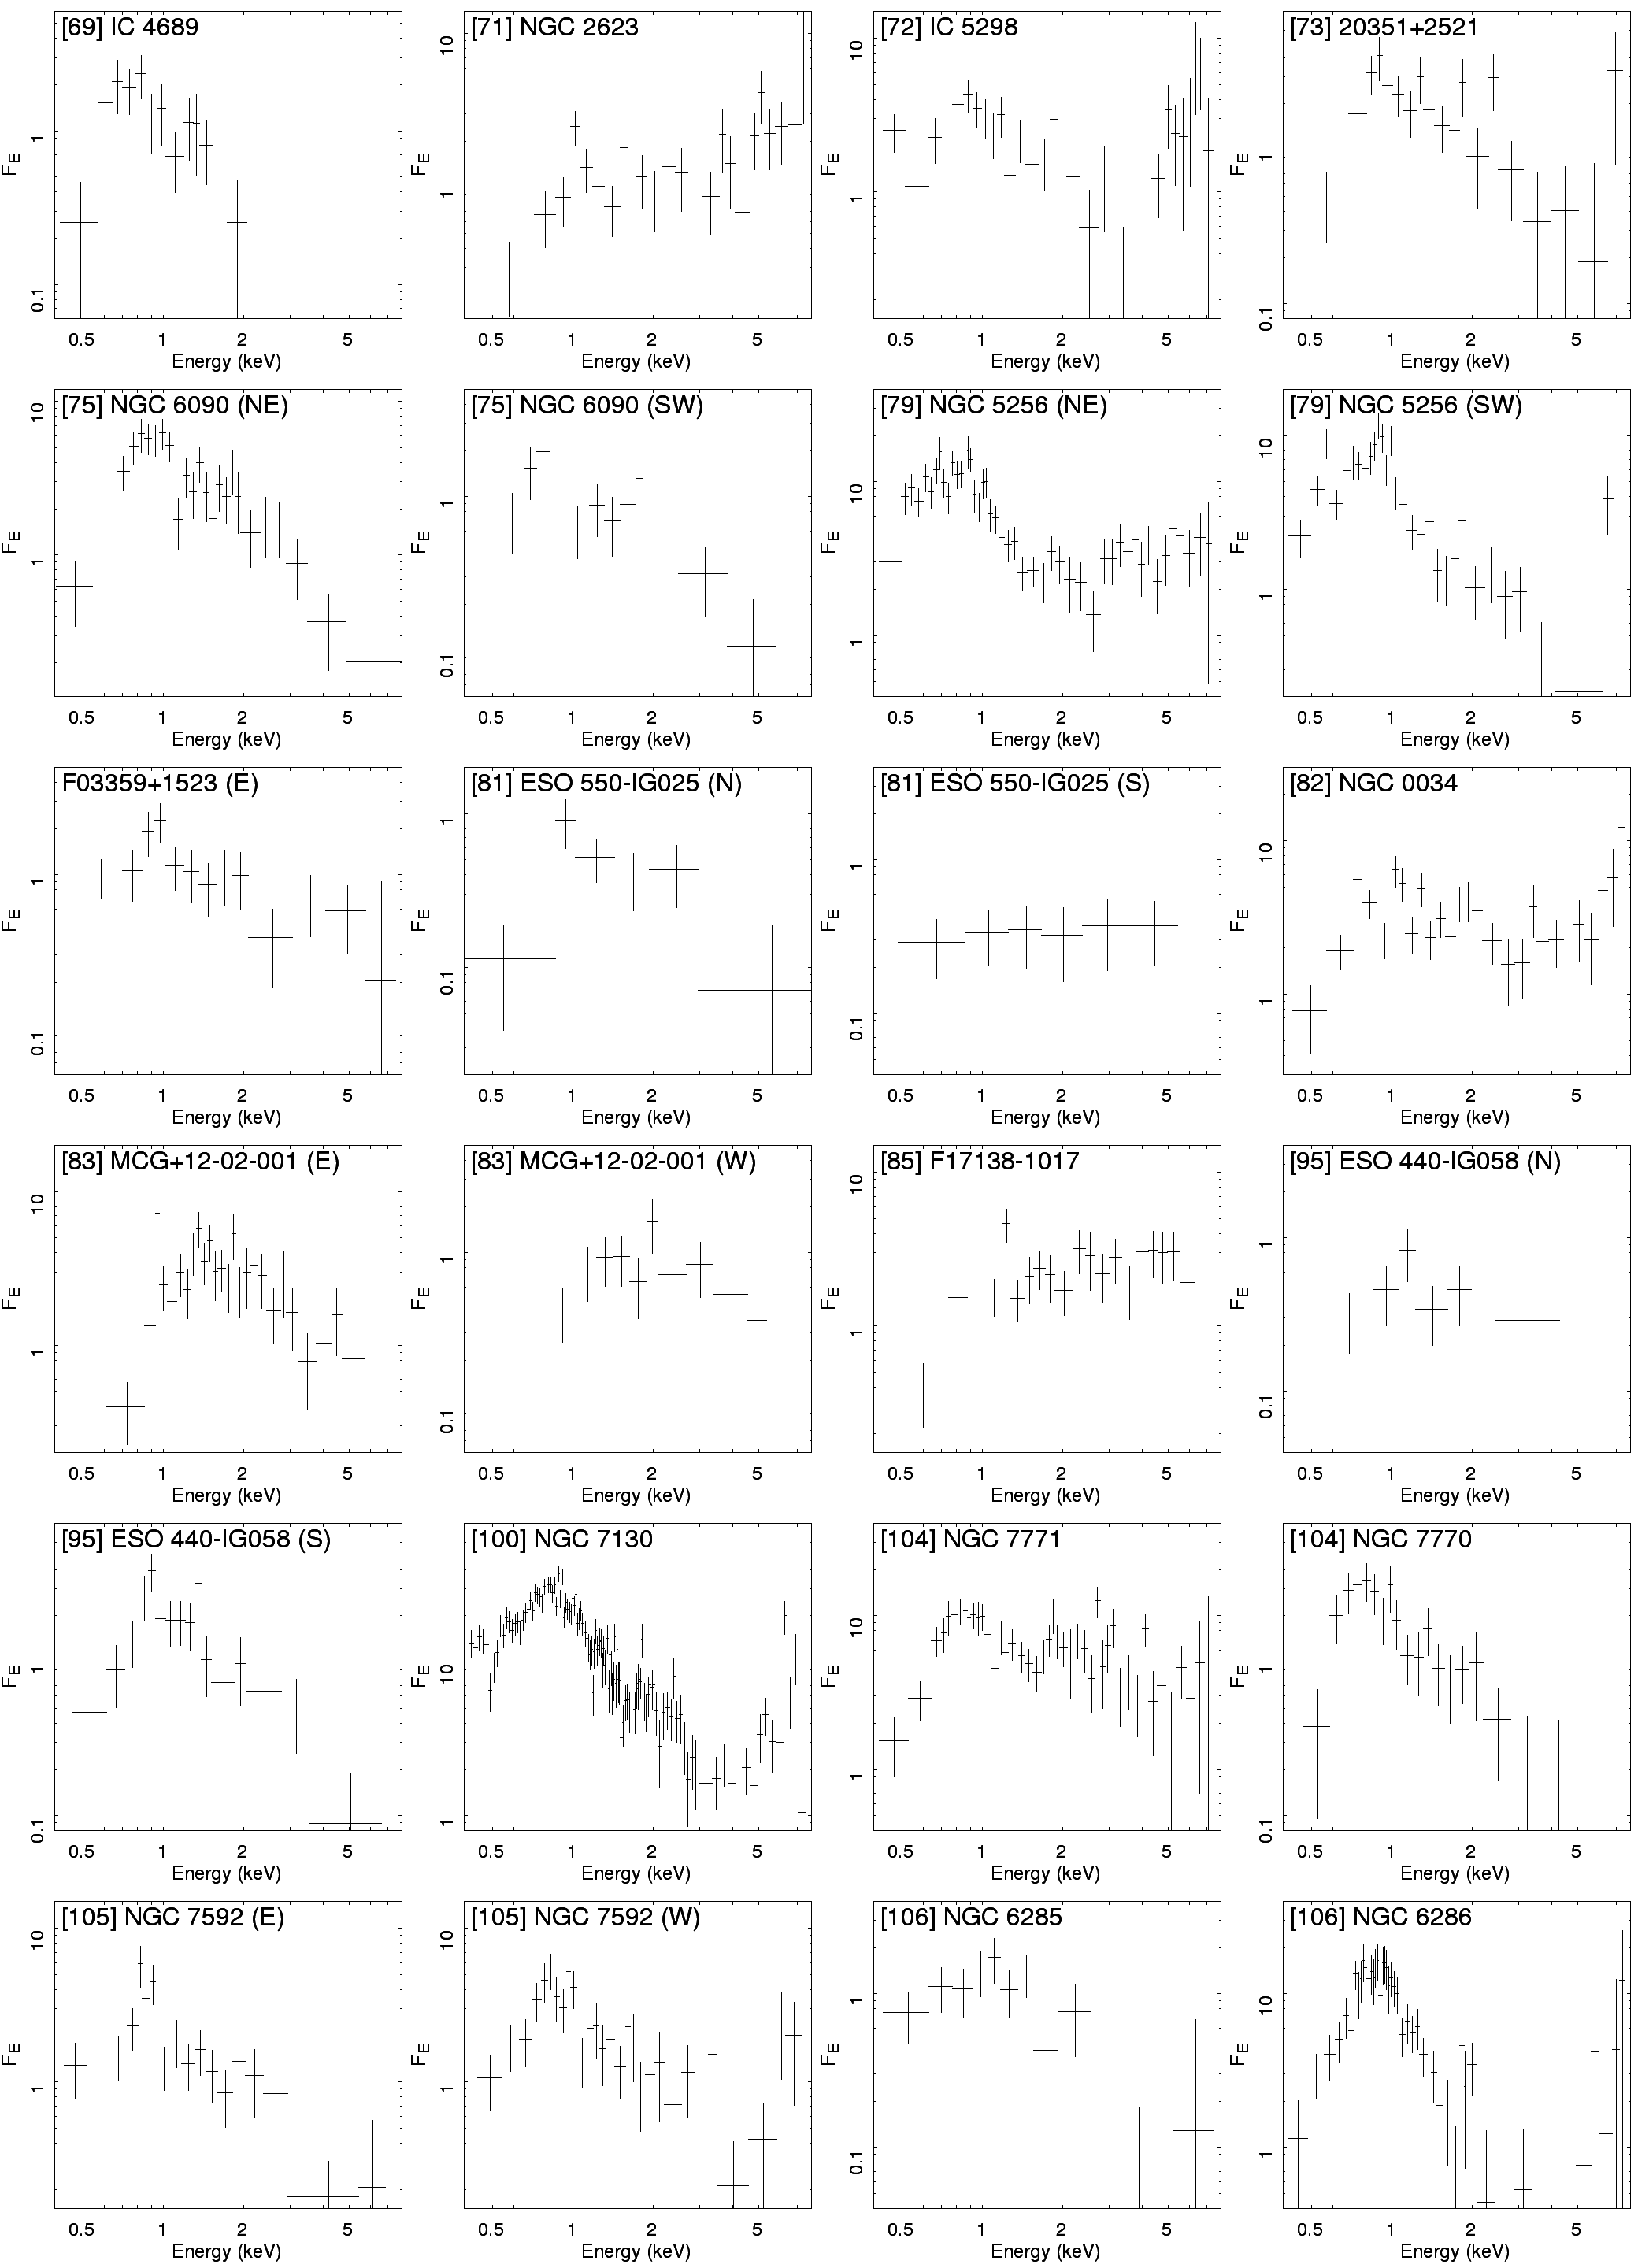
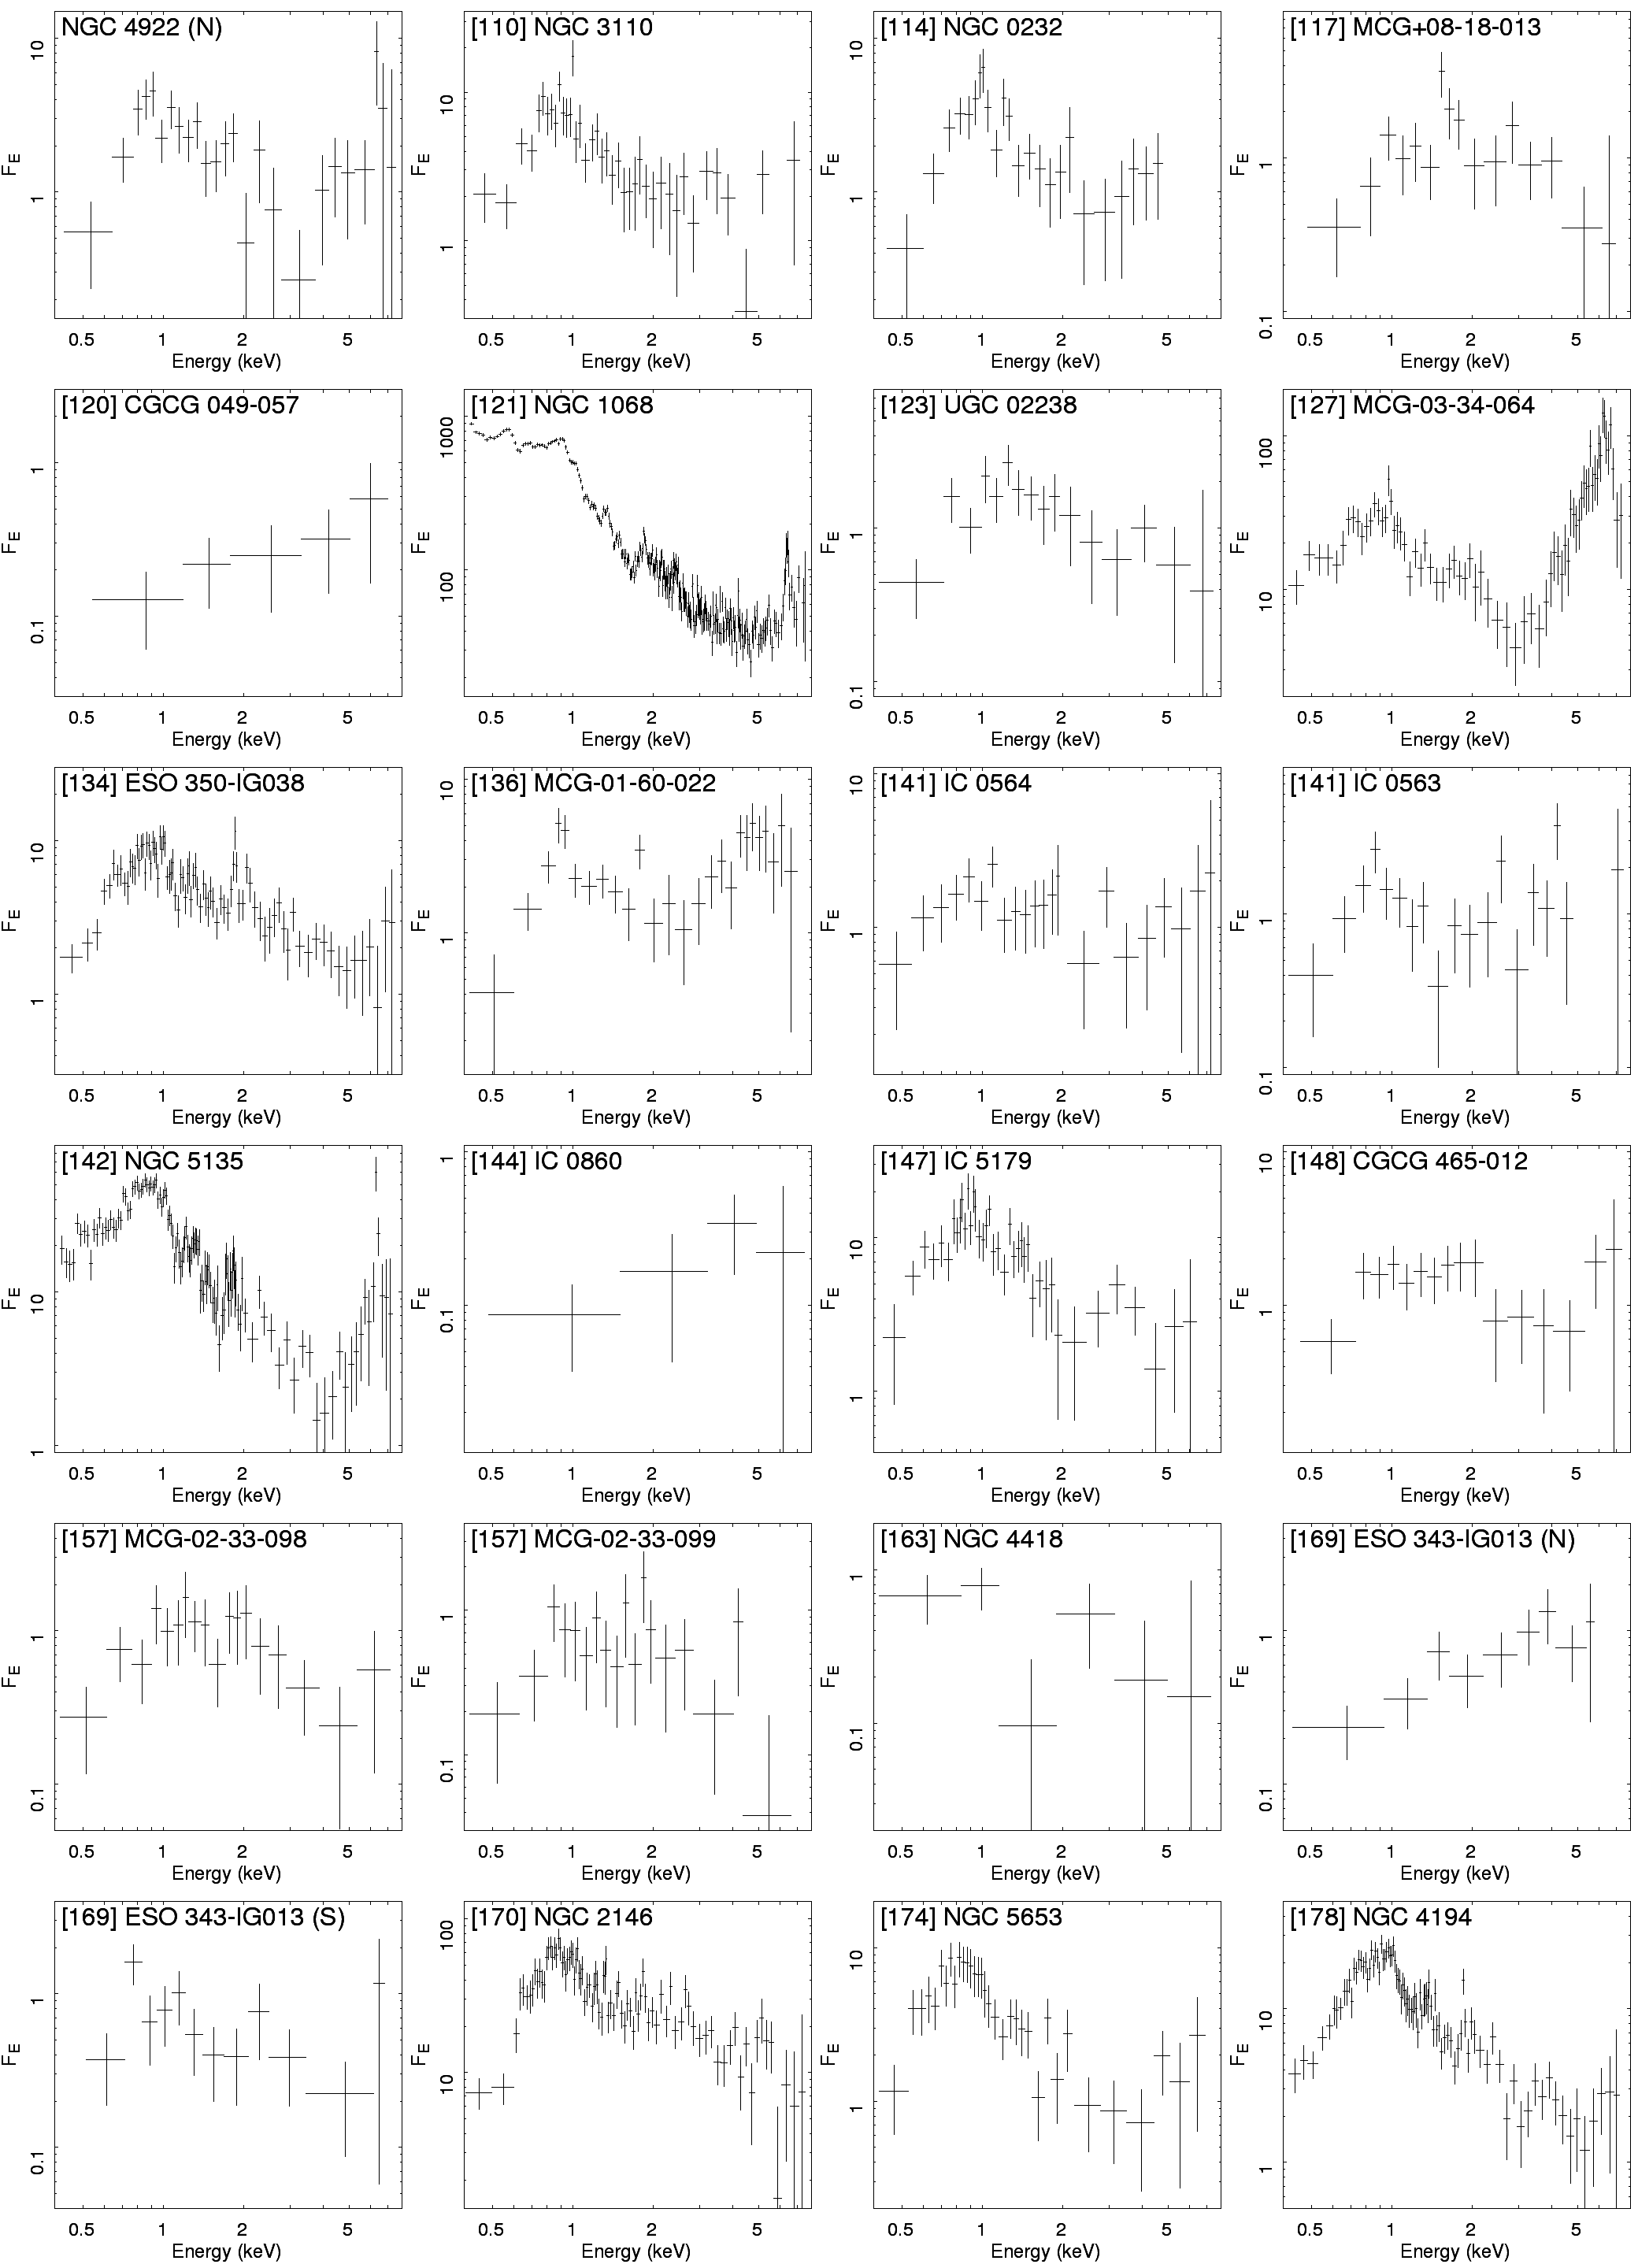
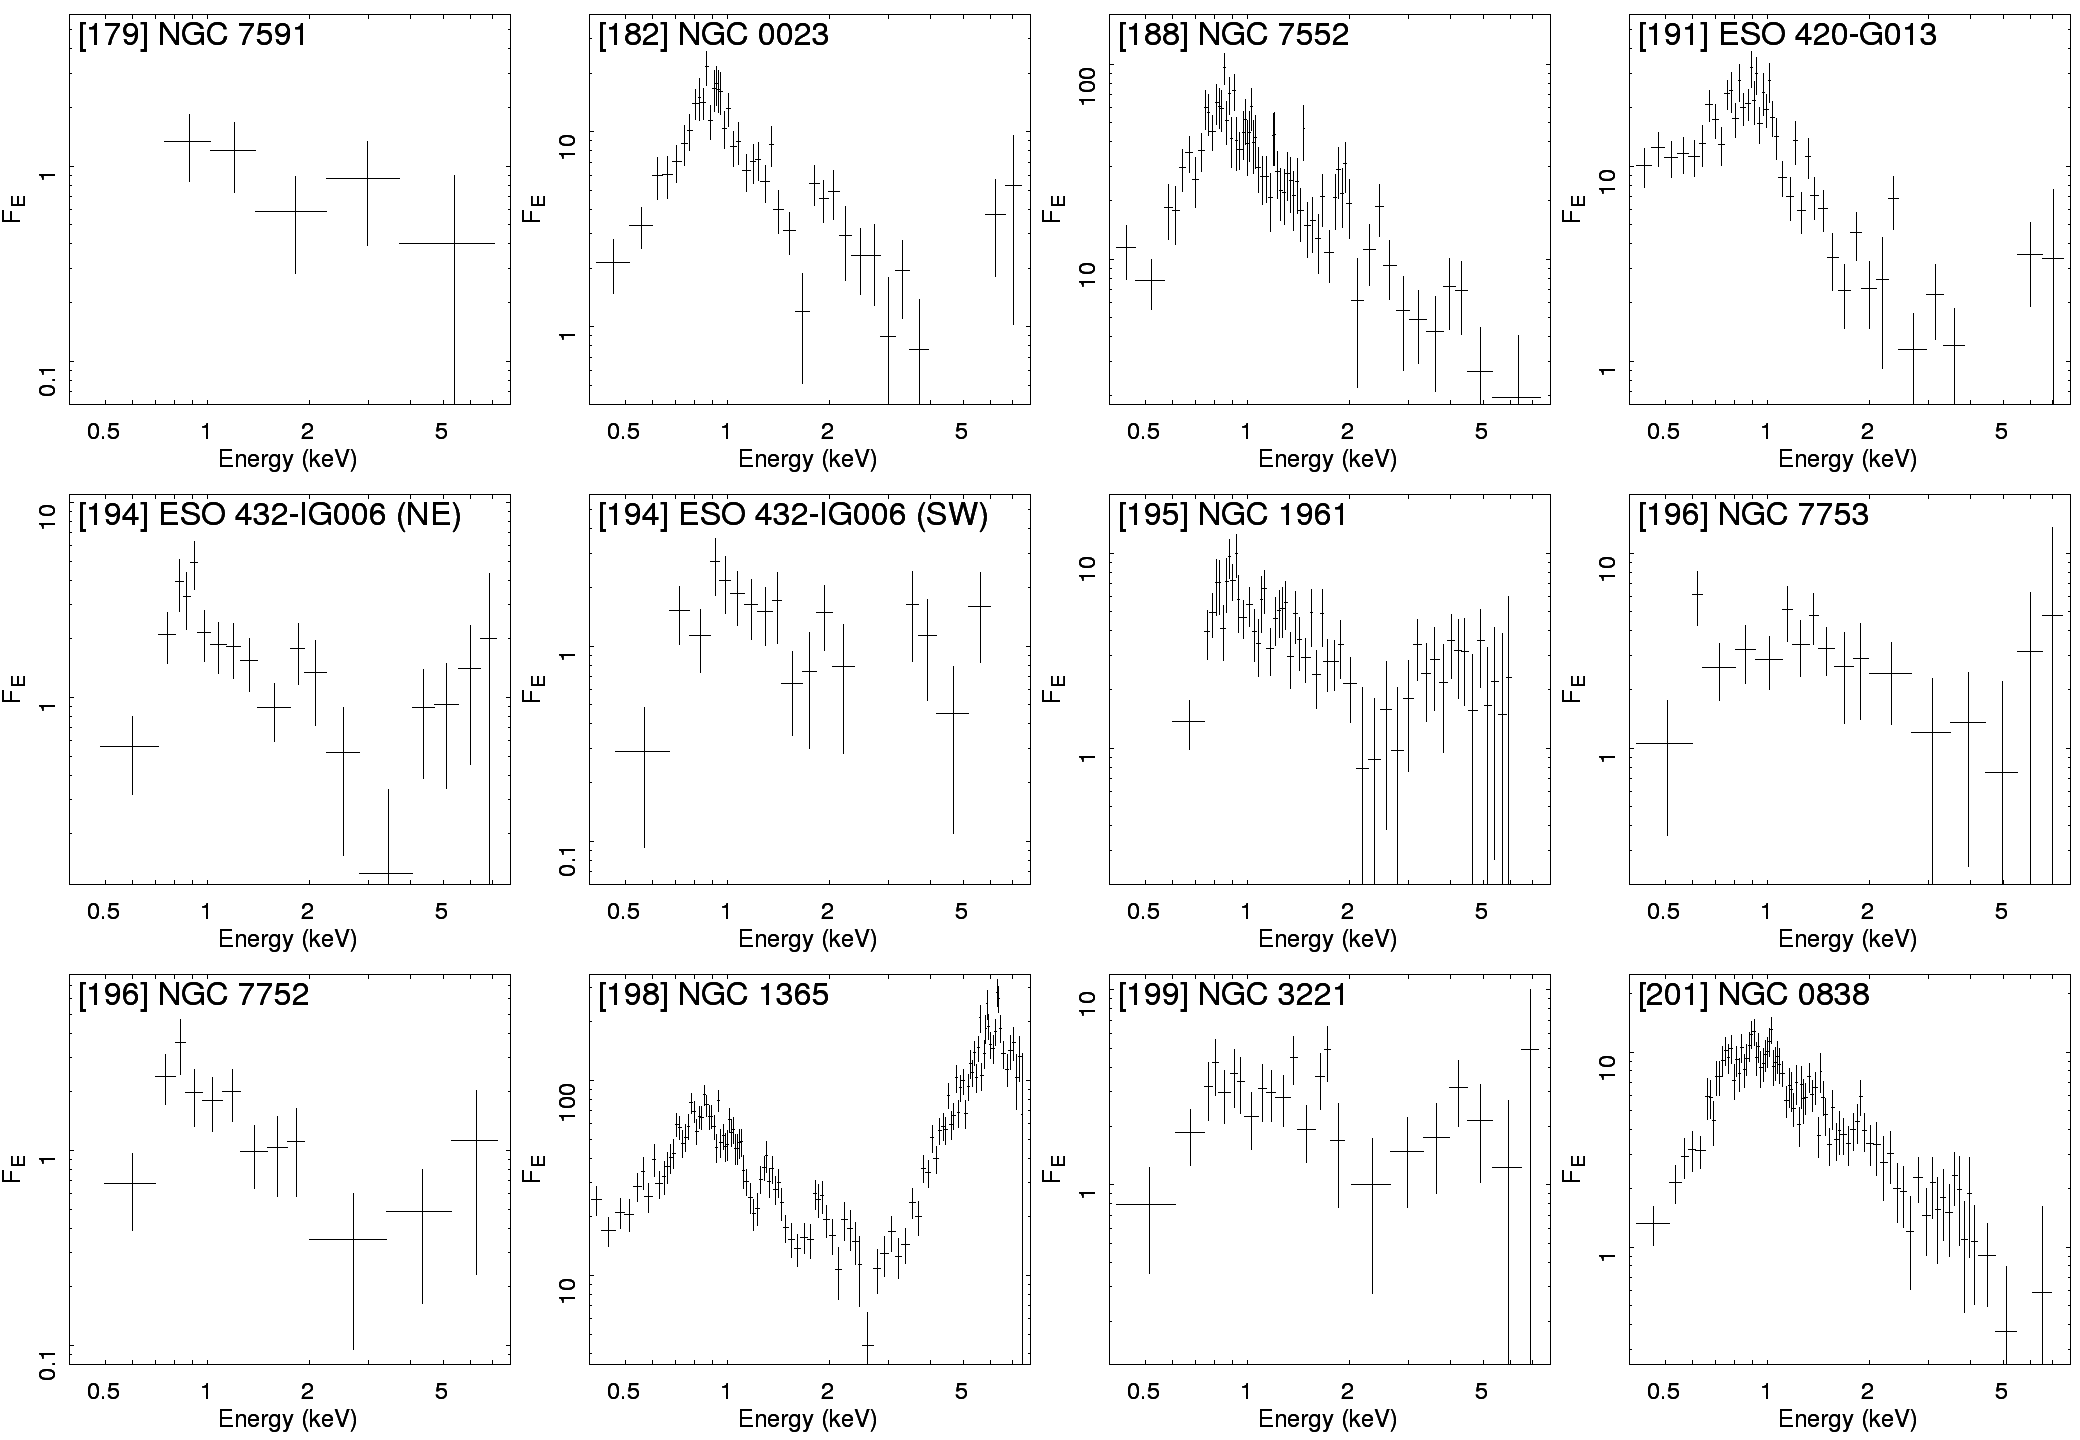
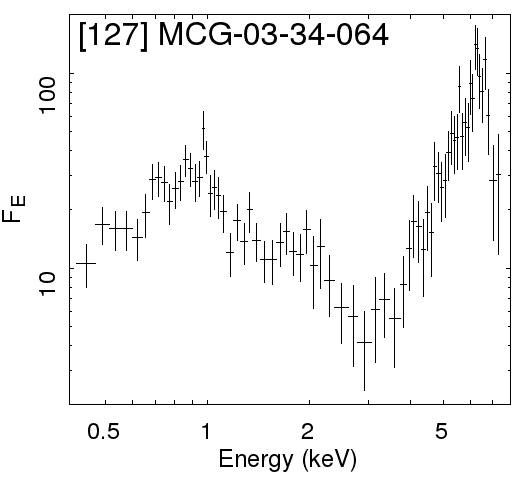
Fig. 80 in Appendix C presents the X-ray spectra for all sources. Spectral data is shown separately for each object with more than one resolved component. Instead of showing the usual count rate spectra, which are data folded through the detector response, we present the Chandra ACIS spectra corrected for the detector response and converted into flux density units. This has the advantage of presenting the spectral properties without the need of spectral fitting, and facilitates comparison with other multi-wavelength data from GOALS. The flux density range for all spectra is set to be the same, 2 orders of magnitude, for consistent comparison. An example of one such spectra can be seen in Fig. 3.
Note that this presentation has the caveat of introducing some uncertainty, particularly when a spectral bin is large enough, within which the detector response varies rapidly; e.g. for galaxies with a low number of counts. It should also be taken into account that, even though these have been corrected for the detector effective area, the energy resolution of the detector is preserved, and therefore they are independent of any spectral model fitting; i.e. they are not unfolded spectra.
It should also be noted that the spectra in Fig. 80 are for display purposes only, and all physical quantities determined were obtained through spectral fitting of the count rate spectra, with the appropriate detector responses.
4.3 AGN selection
| No. | Galaxy |
|
|
|
|
||||||||
| 45 | UGC 08387 | Y | N | N | |||||||||
| 57 | IRAS F060762139 (S) | N | N | C | |||||||||
| 68 | IRAS F161640746 | Y | N | C | |||||||||
| 71 | NGC 2623 | Y | N | C | |||||||||
| 72 | IC 5298 | Y | N | A | |||||||||
| 79 | NGC 5256 (NE) | (u) | Y(u) | N | A | ||||||||
| 79 | NGC 5256 (SW) | (u) | Y(u) | N | L | ||||||||
| 82 | NGC 0034 | N | N | A | |||||||||
| 85 | IRAS F171381017 | N | N | C | |||||||||
| 100 | NGC 7130 | Y | N | LA | |||||||||
| 105 | NGC 7592 (W) | Y(u) | N | N | |||||||||
| 106 | NGC 6286 | N | N | A* | |||||||||
| 107 | NGC 4922 (N) | Y | N | A | |||||||||
| 114 | NGC 0232 | Y | N | N | |||||||||
| 120 | CGCG 049057 | N | N | C | |||||||||
| 121 | NGC 1068 | Y | L | ||||||||||
| 127 | MCG0334064 | Y | Y | LA | |||||||||
| 136 | MCG 0160022 | N | CA | ||||||||||
| 142 | NGC 5135 | Y | N | L | |||||||||
| 144 | IC 0860 | N | N | C | |||||||||
| 163 | NGC 4418 | N | Y | N | |||||||||
| 169 | ESO 343IG013 (N) | N | N | C | |||||||||
| 191 | ESO 420G013 | Y | N | N | |||||||||
| 194 | ESO 432IG006 (NE) | N | N | A | |||||||||
| 194 | ESO 432IG006 (SW) | N | N | A | |||||||||
| 198 | NGC 1365 | N | N | CLA |
-
•
Notes: Column (1): Contribution of the AGN into the bolometric luminosity of the galaxy (Díaz-Santos et al., 2017). Column (2): Detection of the [Ne v] line (Petric et al., 2011). Column (3): EW of the 6.2 m PAH feature ¡ 0.1 m (Stierwalt et al., 2013). Column (4): X-ray AGN selection criteria. C: X-ray color (); L: detection of 6.4 KeV line. A: absorbed AGN feature. Y: Source meets the criterion. N: Source does not meet the criterion. (u) unresolved detection in a multiple systems. (*) Only in the NuSTAR data (Ricci et al., 2016). See Appendix A for details on particular sources.
AGN classification in the sample is performed using different criteria in both X-rays and infrared. Any galaxy that meets any of our selection criteria, described below, is classified as an AGN and listed in Table 6.
The X-ray selection is performed using two different methods: X-ray color selection and detection of AGN spectral features.
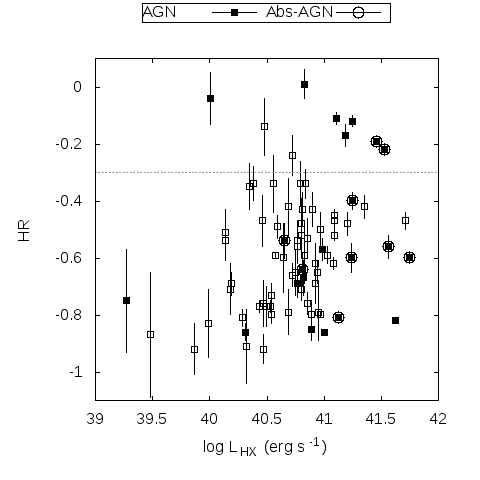
The X-ray color, or hardness ratio, gives the relative intensity of emission in hard and soft bands (in counts). A high indicates strong emission above 2 keV, which is often associated with the presence of an obscured AGN, i.e. column density, in the range of cm-2. The threshold for AGN selection is chosen as , as was for the CGI sample (see Iwasawa et al., 2011).
Figure 4 shows the hardness ratio of all sources in the sample as a function of their hard X-ray luminosity. AGN selected through all criteria described in this section are plotted with filled squares, while all absorbed AGN are marked with open circles. Most AGN in the sample have a below the threshold, as many are absorbed or not selected through X-rays.
Some AGN are missed by this selection because absorption in the nucleus is significant and soft X-ray emission coming from external starburst regions is strong. Such galaxies can still show a hard-band excess in their spectra, and if fitting them with an absorbed power-law with a fixed 1.8 photon index yields a high enough absorbing column density, we classify them as absorbed AGN (see Sect. 4.4.2). Each of these cases is listed in table 6 and discussed individually in Appendix A.
When absorption is even stronger, only reflected radiation can be observed in the hard band, and therefore sources appear weak, their being even smaller. A clear signature of a highly obscured AGN is a the detection of a strong Fe K line at 6.4 keV, which is also used as a criterion for AGN selection. We set a threshold of for the detection of the iron line in order to classify a source as an AGN. Sources selected through this criterion are listed in Table 6, and details on the iron line fits can be found in Sect. 4.4, Table 8.
The infrared selection is performed by means of the detection of the [Ne v] 14.32 m line over kpc scales, which traces high-ionization gas. The ionization potential of [Ne v] is 96 eV, which is too high to be produced by OB stars. Therefore, detection of this line in the integrated spectra of galaxies is a good AGN indicator (see Petric et al., 2011, and references therein).
Another possible indicator is the equivalent width of the 6.2 m PAH feature being lower than 0.1 m. Polycyclic Aromatic Hydro-carbons (PAHs) are either destroyed by the radiation originating from the AGN, or their features diluted in the spectra by the strong MIR continuum it creates; resulting in a low value of the EW (see Stierwalt et al., 2013, and references therein).
Using only the X-ray criteria, 21 galaxies have been found to host an AGN, which represents (255)% of our sample. With the addition of IR criteria, 5 other galaxies are classified as AGN, resulting in a total AGN fraction of (315)% for the 84 individually analyzed galaxies in CGII. Galaxies selected as AGN are presented in Table 6, along with optical classifications and whether or not they meet our X-ray and IR selection criteria.
Two sources in the sample meet the selection criteria and yet we opt not to classify as AGN, for reasons explained in Appendix A: IRAS F171381017 and IRAS F163990937 (S), which meet the criterion.
Table 6 also lists the contribution of the AGN to the bolometric luminosity for all sources classified as AGN. The contribution of the AGN to the MIR luminosity is derived by Díaz-Santos et al. (2017), for all GOALS galaxies, employing up to five Spitzer/IRS diagnostics. Applying corrections based on SED templates of pure starbursts and AGN sources, they derive the fractional contribution of the AGN to the overall bolometric luminosity (as in Veilleux et al., 2009).
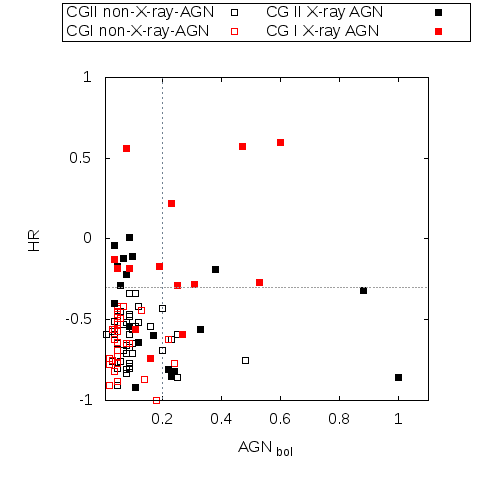
Figure 5 shows the of all sources in the sample as a function of the fractional contribution of the AGN to the bolometric luminosity, . Sources with a fraction larger than 0.2 can be considered to have an energetically significant AGN. X-ray selected AGN, through any of the three criteria mentioned above, are highlighted as filled symbols. All marked AGN below the threshold show signs of obscuration, as they have been selected through any of the other two X-ray criteria. In the full C-GOALS sample, 19/32 X-ray selected AGN lay below . Therefore, more than half of the AGN detected through X-rays are not easily selected through the mentioned combination of MIR diagnostics.
4.4 X-ray spectral fitting
The keV Chandra spectra of the CGII galaxies present similar properties to those of the CGI sample, analysed by Iwasawa et al. (2011); a mostly emission-line dominated soft X-ray band, and a hard X-ray power-law. As was already discussed in the mentioned work, both the spectral shape and the morphology of the emission (see images in Appendix B) suggest a different origin for the soft and hard X-rays, and therefore the two are analyzed separately.
A few objects present in the sample (IRAS 18090+0130 (W), IRAS F060762139 (S), IC 0860 and NGC 7591) have not been fitted due to an excessively low count number, of the order of cts, in the full keV band. For these sources, only the count rates and have been computed, and results on fluxes and luminosities are not presented in Table 3.
For the majority of our sources, which have few counts, fitting is done through C statistic minimization instead of minimization.
4.4.1 Soft band ( keV) fitting
Starburst galaxies, when not dominated by a luminous AGN, have soft X-ray emission originating in hot interstellar gas (keV), which is shock-heated by supernovae explosions and stellar winds from massive stars. Emission from hot gas can generally be fitted with a standard thermal emission model, with a solar abundance pattern, e.g. mekal (Mewe et al., 1985; Kaastra, 1992; Liedahl et al., 1995). However, in our data, such a simple model does not agree with many of the observed emission line strengths and provides an unsatisfactory fit in most cases. A better fit can be obtained either with a modified abundance pattern, richer in elements; or through the overlap of more than one mekal at different temperatures.
The hot gas within a starburst region is expected to be enriched by elements, produced in core-collapse supernovae. Metal abundances should deviate from a solar pattern, as has been found for star-forming knots in nearby galaxies, e.g. The Antennae (Fabbiano et al., 2004). At the same time, the extended soft X-ray emitting gas is expected to be multi-phase: the shocked gas swept away by a starburst wind seen at outer radii is free from absorption while the hotter gas at inner radii may have some absorption of the interstellar medium (e.g. Strickland & Stevens, 2000). A temperature gradient can be approximated at first order as two mekal models with different temperatures. One would model the most external, colder gas component (at ) which is located far away from the nucleus, and therefore is less absorbed by the interstellar material. The other would model the inner, hotter gas (at ), obscured by the denser material present in the central region of the galaxy.
Ideally, the data should be modeled using more than one mekal component, with different temperatures and absorbing column densities, and with non-solar metal abundances. However, given the quality of the data, this would imply severely overfitting. As we are interested in probing the level of obscuration in the C-GOALS sources, we opt to model the data using two mekal models as defined above, which both have solar abundance patterns.
The results obtained through this fitting, the parameters of which can be seen in Table 7, show that it is possible to satisfactorily fit the sources with a high enough number counts using this model, which is to be expected if part of the emission truly originates in a denser, inner region. However, we note that this model is not clearly superior to a single mekal component with non-solar abundances, as was used by Iwasawa et al. (2011) on the CGI sample; and that most of the analyzed sources do not have good enough data quality to determine a clear best fit between the two models.
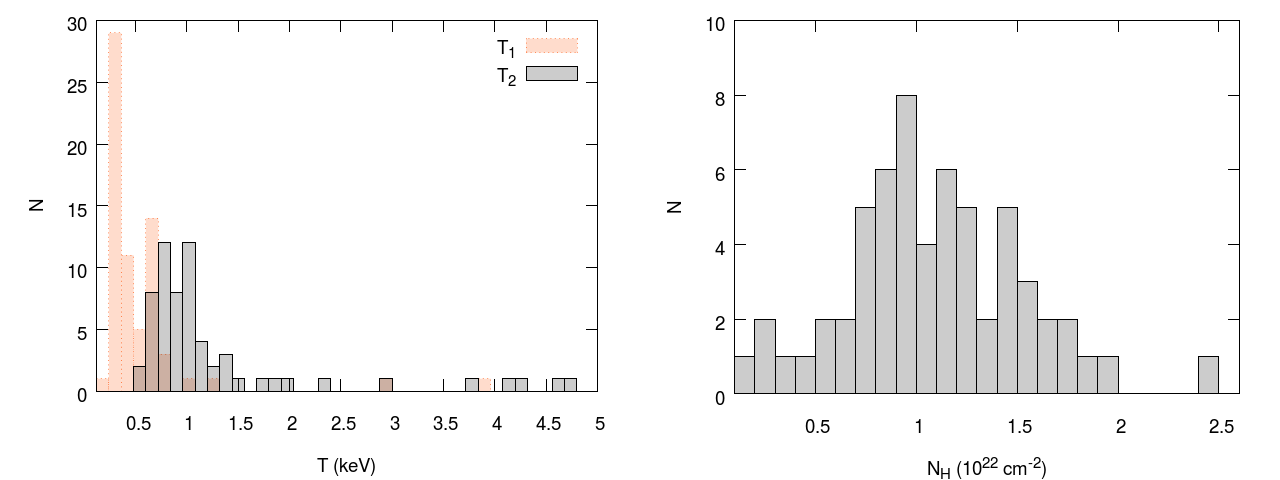
The distribution of the obtained parameters for the full CGII sample can be seen in the histograms presented in Fig. 6. The temperature associated to the colder mekal component () used to model the keV emission of each source presents a more narrow distribution than that associated to the hotter component (). The distribution of has a median value of keV, and an interquartile range of keV. The distribution of has, as expected, a higher median value, of . The interquartile range is keV range, with a long tail extending up to keV. Note that even though the two distributions overlap (i.e. some values are larger than some values), for each single source .
Figure 6 also shows the distribution of column densities, , absorbing the hottest mekal component. The median of the distribution is cm-2, with an interquartile range of cm-2.
A few sources, named in Sect. 4.4.2, have been modeled in the full keV band with a single power-law; and therefore no values for , and have been derived for them. Also, NGC 6285 and IC 2810 (SE) have been fitted with a single mekal component in the keV range, and NGC 7752/3 (NE) and ESO 440-IG058 (N) have been fitted with a single mekal component in the full keV range. These sources have not been included in the histograms shown in Fig. 6, or the averages previously mentioned.
4.4.2 Hard band ( keV) fitting
In the hard X-ray band, where the emission from hot interstellar gas and young stars significantly decreases, X-ray binaries dominate the emission in the absence of an AGN. Their emission can be fitted by a simple power-law. The photon index, , is the slope of a power-law model that describes a photon spectrum, defined as photons cm-2 s-1 keV-1. Derived values for for all sources in the CGII sample can be found in Table 7.
This fit is only performed for galaxies that have a minimum of 20 cts in the keV range. Galaxies with a lower count number have been fitted while imposing a fixed power-law photon index of 2 (average spectral slope found for a sample of local starburst galaxies, Ranalli et al., 2003), leaving only the model normalization as a free parameter. This limit is set in order to obtain meaningful constraints for the spectral slope. It is lower than the one fixed for the CGI sample (50 cts) since many of the sources in the current sample are much fainter, as expected given their lower infrared luminosities.
A few objects within the sample show a clear, steep increase of flux at energies keV (see e.g. MCG0334064 in Fig. 80), which is a sign of the presence of an absorbed AGN (see e.g. Turner & Miller, 2009). In such cases, which all have a count number higher than 20 cts, we fit an absorbed power-law imposing a fixed photon index of 1.8 (a typically expected value for the photon index of an AGN, see e.g. Nandra & Pounds, 1994). This leaves the absorbing column density, , as a free parameter. This model is preferred if the fit yields values cm-2, and is statistically better than a simple power-law fit. In such cases, we classify the source as an absorbed AGN.
A few sources in the sample (NGC 5331 (N), IRAS F163990937 (S), ESO 550IG025 (S), MCG+1202001 (W), CGCG 049057, UGC 02238, NGC 4418 and ESO 343IG013 (N) and (S)) are clearly best-fitted with a single power-law in the full keV band, and the parameter shown in Table 7 corresponds to that fit.
4.4.3 Iron K lines
The Fe K line is a frequently used, reliable diagnostic of heavily obscured AGN. As already mentioned in Sect. 4.3, we use it as one of our X-ray AGN selection criteria. The cold iron line seen in some of the CGII sources is fitted with a Gaussian model centered at 6.4 keV. Six sources in the CGII sample have such a line fitted with a significance above , which is the threshold we set to consider a detection.
A more conservative and frequently used threshold to consider a line as detected in the data is a 3 significance. Imposing this more restrictive criterion, only NGC 1068 and MCG0134064 would have detected Fe K lines in the sample. The threshold is lowered because of the low signal-to-noise ratio for all sources in the CGII sample. However, note that lowering it to does not change the fraction of selected AGN within the sample, as all sources with a line detection also meet other selection criteria. We still consider the presence of this line at to be relevant information, which can give support to other AGN determinations, and therefore include it in the analysis.
Parameters of the fit for these six sources are shown in Table 8, including the line energy, intensity and equivalent width with respect to the continuum. The detection of these lines has been previously reported based on other X-ray observations (Koyama et al., 1989; Band et al., 1990; Mazzarella et al., 2012; Gilli et al., 1999; Levenson et al., 2002; Ricci et al., 2014; Risaliti et al., 2009).
| No. | Galaxy |
|
|
|
||||||
| 79 | NGC 5256 (SW) | 6.44 | 1.4 | 4.0 | ||||||
| 100 | NGC 7130 | 6.42 | 3.3 | 0.8 | ||||||
| 121 | NGC 1068 | 6.43 | 32.2 | 0.9 | ||||||
| 127 | MCG0334064 | 6.43 | 77.1 | 0.7 | ||||||
| 142 | NGC 5135 | 6.41 | 7.2 | 1.1 | ||||||
| 198 | NGC 1365 | 6.35 | 40.3 | 0.14 |
-
•
Notes: Iron K Line detections with a significance of or higher. The line centroid energy is measured in the rest frame. Errors reported correspond to for one parameter of interest, leaving 5 parameters free.
4.5 X-ray luminosities and correlation with
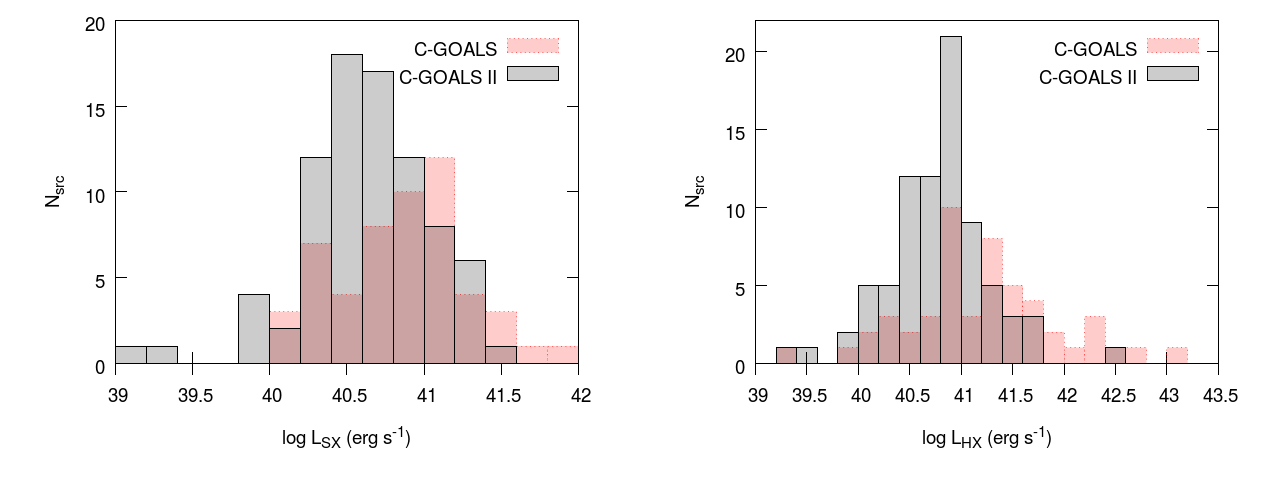
Figure 7 shows the distribution of derived luminosities in soft and hard band, presented in Table 3, compared with that of those obtained for the CGI sample of Iwasawa et al. (2011). For CGII, the distributions peak at erg s-1 and erg s-1, which is slightly lower than the peak of both bands for CGI sample, at erg s-1. The median logarithmic values for the soft and hard band luminosities are listed in Table 9. CGII has lower X-ray luminosity values than CGI, as expected, reflecting a correlation between Infrared and X-ray luminosity, seen in both the CGI and CGII samples (see Figs. 8 and 9).
| CGI | CGII | C-GOALS | |
| log | |||
| log | |||
| log | |||
| log | |||
| log | |||
| log | |||
| log | |||
| log |
-
•
Notes: Median values of the distribution of soft band and hard X-ray luminosities; and the distributions of the ratios of X-ray to IR luminosities for the C-GOALS I, C-GOALS II and full C-GOALS sample. (*) AGN removed from the sample.
The origin of this correlation is in the presence of star formation in the galaxies. Far-infrared luminosity measurements detect the energy absorbed by the dust of the interstellar medium from young, bright stars; and thus are a good estimator of the total Star Formation Rate (SFR) (e.g. Kennicutt, 1998). In galaxies with a considerable amount of star formation, such as starburst galaxies, emission in other wavelengths can also be related to young and massive stars, such as X-ray luminosity (e.g. X-ray binaries emission, supernova remnants (SNRs)). Therefore, it has been suggested that if a good correlation between X-ray luminosity and IR luminosity exists in galaxies, the SFR can be directly inferred from the X-ray luminosity. Compatible correlations have been found in previous works for local star-forming galaxies with infrared luminosities lower than those of LIRGS (e.g. Ranalli et al., 2003; Grimm et al., 2003; Mineo et al., 2014).
Figure 8 shows the X-ray luminosity as a function of the IRAS infrared luminosity. The data show a moderate correlation, with a typical spread of more than one order of magnitude when only considering sources without detected X-ray AGN presence (open squares). Sources which contain X-ray AGN typically lay above the trend, adding scatter to the correlation. Sources with multiple components are separated into their respective contributions, and plotted separately, as it has been shown that when they are plotted summed into one single source, the correlation becomes less clear (Iwasawa et al., 2009). Their total () m IRAS luminosity, as in Table 1, is separated into the different contributions using the percentages indicated in Table 4.
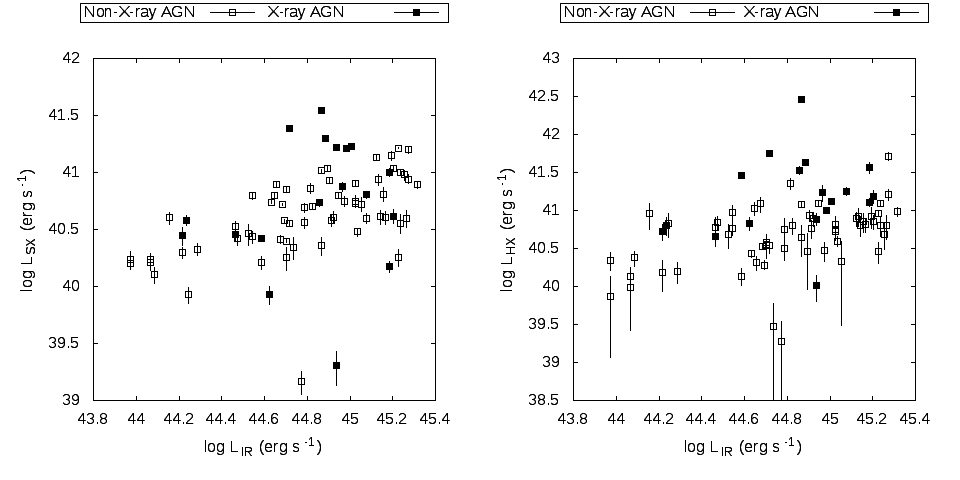
As was already seen in the CGI galaxies, X-ray selected AGN tend to be more luminous in X-rays than the rest of the sample, especially in the hard band. However, the values for are higher for the CGII sample than for CGI, as listed in Table 9. This result means that while our sample is less bright both in X-ray and in infrared when compared to the CGI sample, we find a higher relative X-ray to infrared luminosity. Removing X-ray selected AGN from both samples gives lower ratios, which we also list.
Comparing this average values to the found by (Ranalli et al., 2003) for local, star-forming galaxies with lower SFR, we find a large discrepancy. However, their IR luminosity does not include the 140m range, which may contribute a non-negligible amount of power, in particular for IR warm, AGN dominated systems. Therefore direct comparison needs to introduce a correction. Furthermore, only at radio and FIR wavelengths are the most intense starbursts transparent (e.g. Condon, 1992), so that from their detected flux SFR can be accurately estimated.
Infrared luminosities derived by Ranalli et al. (2003), hereafter , follow the expression
| (1) |
from Helou et al. (1985).
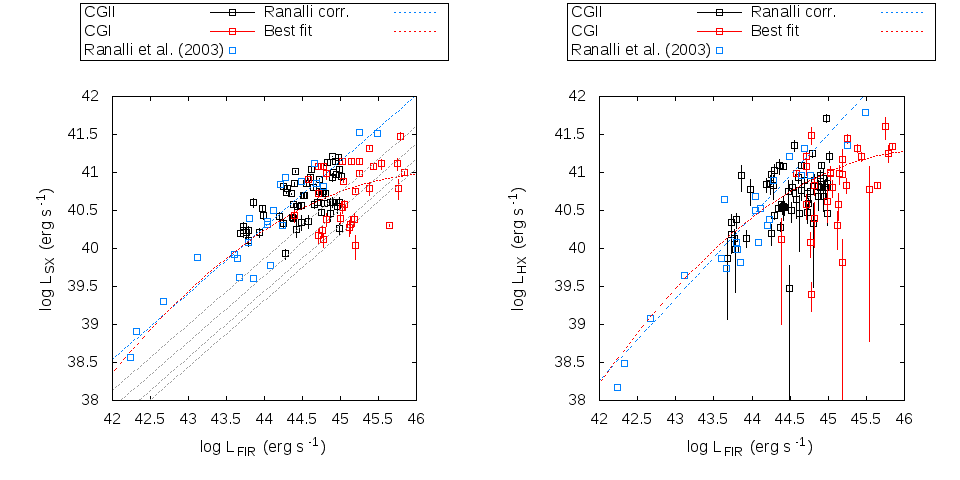
We use this expression to derive for all non-AGN objects in the CGI and CGII samples, again accounting for the contribution of multiple components following Table 4. As listed in Table 9, is similar to -3.7 for the CGII objects, but not for the galaxies in CGI. A direct comparison between the distribution followed by objects analyzed by Ranalli et al. (2003), as well as their derived correlation, and GOALS objects is shown in Fig. 9.
The best fit correlations derived by Ranalli et al. (2003) are:
| (2) |
| (3) |
which correspond to the blue dotted lines plotted in Fig. 9.
Galaxies in the GOALS sample with follow Eqs. 2 and 3, but those with higher have systematically lower X-ray luminosity than predicted.
This behavior suggests that a better fit would be obtained with a quadratic relation in log scale. Using the least-squares method, we obtain a best fit for the C-GOALS + Ranalli et al. (2003) data:
| (4) |
| (5) |
where . This fit is plotted as a red dashed line in Fig. 9. Below FIR luminosities of erg s-1 (i.e. L⊙) the quadratic fit overlaps with the linear correlation. Above this value, X-ray luminosity increases far more slowly with far-infrared luminosity. This effect is larger in soft X-rays. Note that fitting a single power-law to the full data sample we do not recover a relation that is compatible, within the errors, with Eq. 2. A power-law fit also yields a larger value than the fits given by Eqs. 4 and 5.
As soft X-rays are easily absorbed by moderate column densities, we show the effect that obscuration could have on the Ranalli et al. (2003) correlation. In order to do so, we take an average spectrum that is characteristic of the galaxies within our sample: a double component mekal model with temperatures and , the median values derived from our soft X-ray analysis. According to our model, the inner component of can have considerable absorption, and fitting yields values in the range cm-2. We assume different column densities, cm22, and absorb the hotter component. We use the model to calculate the decrease in flux caused by the different column densities, and considering that the linear correlation derived by Ranalli et al. (2003) has no intrinsic absorption, we plot the “absorbed” equivalent correlations in Fig. 9. cm-2 actually absorbs more than 99% of the emission of the inner component in the keV range, meaning larger column densities would result in no change in the emission i.e. only the emission of the outer, unabsorbed component remains.
4.6 Radial profiles
| No. | Galaxy | R (”) | R (kpc) | No. | Galaxy | R (”) | R (kpc) |
| 45 | UGC 08387 | 2.4 | 1.3 | 104 | NGC 7771 | 3.0 | 0.9 |
| 47 | CGCG 436030 | 2.6 | 1.7 | 104 | NGC 7770 | 3.7 | 1.1 |
| 49 | NGC 0695 | 3.7 | 2.5 | 105 | NGC 7592 (E) | 3.1 | 1.6 |
| 50 | CGCG 043099 | 1.2 | 1.0 | 105 | NGC 7592 (W) | 0.9 | 0.5 |
| 51 | MCG+0723019 | 4.3 | 3.3 | 106 | NGC 6286 | 7.2 | 3.0 |
| 52 | NGC 6670 (E) | 3.0 | 1.9 | 106 | NGC 6285 | 1.7 | 0.7 |
| 52 | NGC 6670 (W) | 4.0 | 2.5 | 107 | NGC 4922 (N) | ¡0.5 | ¡0.3 |
| 53 | UGC 02369 (S) | 1.5 | 1.0 | 110 | NGC 3110 | 9.0 | 3.5 |
| 54 | NGC 1614 | 1.4 | 0.5 | 114 | NGC 0232 | 1.5 | 0.7 |
| 56 | NGC 5331 (N) | 2.1 | 1.6 | 117 | MCG+0818013(E) | 2.3 | 1.3 |
| 56 | NGC 5331 (S) | 3.0 | 2.3 | 120 | CGCG 049057 | 1.1 | 0.3 |
| 57 | IRAS F060762139(N) | 0.7 | 0.6 | 121 | NGC 1068 | 7.8 | 0.6 |
| 57 | IRAS F060762139(S) | 123 | UGC 02238 | 4.0 | 1.8 | ||
| 60 | IC 2810(NW) | 1.2 | 0.9 | 127 | MCG0334064 | ¡0.5 | ¡0.2 |
| 60 | IC 2810 (SE) | 0.7 | 0.5 | 134 | ESO 350IG038 | 2.4 | 1.0 |
| 63 | IRAS 18090+0130 (E) | 2.4 | 1.6 | 136 | MCG 0160022 | 4.6 | 2.2 |
| 63 | IRAS 18090+0130(W) | ¡0.5 | ¡0.3 | 141 | IC 0564 | 8.0 | 3.6 |
| 64 | III Zw 035 (S) | 1.2 | 0.7 | 141 | IC 0563 | 8.1 | 3.6 |
| 65 | NGC 3256 | 7.7 | 1.5 | 142 | NGC 5135 | 2.1 | 0.6 |
| 67 | IRAS F163990937(N) | 3.5 | 2.2 | 144 | IC 0860 | 6.0 | 1.7 |
| 67 | IRAS F163990937(S) | 5.3 | 3.3 | 147 | IC 5179 | 14.6 | 3.6 |
| 68 | IRAS F161640746 | 1.5 | 0.9 | 148 | CGCG 465012 | 4.6 | 2.1 |
| 69 | IC 4687 | 3.5 | 1.4 | 157 | MCG0233099 | 1.3 | 0.5 |
| 69 | IC 4686 | ¡0.5 | ¡0.2 | 157 | MCG0233098 | 1.2 | 0.5 |
| 69 | IC 4689 | 3.5 | 1.4 | 163 | NGC 4418 | 2.7 | 0.5 |
| 71 | NGC 2623 | 1.0 | 0.4 | 169 | ESO 343IG013 (N) | 1.2 | 0.5 |
| 72 | IC 5298 | ¡0.5 | ¡0.3 | 169 | ESO 343IG013 (S) | 5.7 | 2.4 |
| 73 | IRAS 20351+2521 | 4.0 | 2.9 | 170 | NGC 2146 | 15.5 | 1.3 |
| 75 | NGC 6090 (NE) | 1.6 | 1.1 | 174 | NGC 5653 | 9.0 | 2.6 |
| 75 | NGC6090 (SW) | 1.4 | 0.9 | 178 | NGC 4194 | 4.2 | 0.9 |
| 79 | NGC 5256 (NE) | 0.8 | 0.5 | 179 | NGC 7591 | 0.8 | 0.3 |
| 79 | NGC 5256 (SW) | 2.2 | 1.4 | 182 | NGC 0023 | 3.2 | 1.0 |
| 80 | IRAS F03359+1523(E) | 1.9 | 1.4 | 188 | NGC 7552 | 3.2 | 0.4 |
| 81 | ESO 550IG025 (N) | 2.2 | 1.4 | 191 | ESO 420G013 | 1.0 | 0.2 |
| 81 | ESO 550IG025 (S) | 1.0 | 0.7 | 194 | ESO 432IG006 (NE) | 2.3 | 0.8 |
| 82 | NGC 0034 | 1.3 | 0.5 | 194 | ESO 432IG006 (SW) | 2.5 | 0.9 |
| 83 | MCG+1202001 (E) | 2.1 | 0.7 | 195 | NGC 1961 | 8.4 | 2.4 |
| 83 | MCG+1202001 (W) | 2.3 | 0.8 | 196 | NGC 7752/3 (NE) | 0.8 | 0.3 |
| 85 | IRAS F171381017 | 2.8 | 1.1 | 196 | NGC 7752/3 (SW) | 5.6 | 2.0 |
| 95 | ESO 440IG058 (N) | 0.6 | 0.3 | 198 | NGC 1365 | 7.0 | 0.6 |
| 95 | ESO 440IG058 (S) | 3.8 | 2.1 | 199 | NGC 3221 | 13.2 | 4.2 |
| 100 | NGC 7130 | ¡0.5 | ¡0.2 | 201 | NGC 0838 | 5.1 | 1.3 |
-
•
Notes: Radius up to which half of the source counts in the keV band are emitted, for the 84 galaxies analyzed within the CGII sample.
Radial profiles for all sources (except IRAS F060762139 (S), for which not enough counts are detected in the Chandra data) are characterized in two different ways. In the first method, we compute the soft X-ray half-light radius (R) for the keV band as the radius within which half of the total number of counts is emitted. In the second method, surface brightness profiles are computed and provided in Appendix B, also shown in Fig. 2 for NGC 2146. These profiles are computed in the soft keV band, shown in open squares, and the hard keV band, in filled squares.
Profiles are centered using the hard X-ray peak that corresponds to the nucleus of the galaxy, which typically corresponds to the near-infrared nucleus. In cases in which there is no clear central emission in the () keV band, the profiles are centered using infrared images. For all galaxies that have radial profiles centered using infrared images, a comment has been added in Appendix A.
The values for R, both in arcsec and in kpc, are provided in Table 10. While this value can give an idea of the size of the central, more intensely emitting region of a galaxy, note that for sources without an extensive diffuse emission (e.g. NGC 3221, which is mostly composed of point-sources), it might not have a physical meaning. Other sources show non-axisymmetric morphology, most likely associated to extended starburst winds (e.g. UGC 08387, NGC 6286 (SE), NGC 2146, NGC 4194, NGC 1365 and NGC 0838). See Appendix B for detailed images of the morphology of the X-ray emission in all sources
Due to the pixel size of the Chandra CCD, the smallest radius within which counts can be computed is limited to ”. Very compact sources can have more than half of their detected counts within this region, making the estimation of R impossible. This is the case for six of our sources, for which an upper-limit is provided. It would also be the case for the vast majority of sources when considering the hard band emission, which is the reason we do not provide values of R.
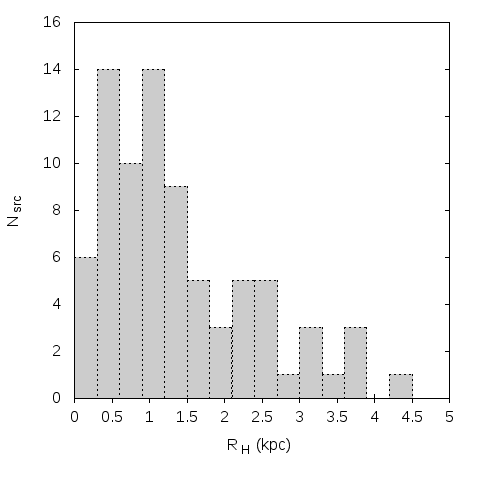
Figure 10 shows a histogram of all half-light radii presented in Table 10. Note that sources with only upper limits derived are included, as they all fall below R kpc, which is the bin size. The distribution of R has a median of kpc, with an interquartile range of kpc. This shows that most sources within CGII have a compact X-ray distribution, with half of the emission being generated within the inner kpc. VLA 33 GHz studies of the 22 brightest U/LIRGs in the C-GOALS sample find half-light radii below kpc for all sources, meaning that the emission is also compact in other wavelengths (Barcos-Muñoz et al., 2017).
Note that all values of R are actually upper limits, as any amount of obscuration in the sources (likely important in most, as seen in Fig. 9), which is concentrated in the inner regions, will result in an apparent decrease of compactness.
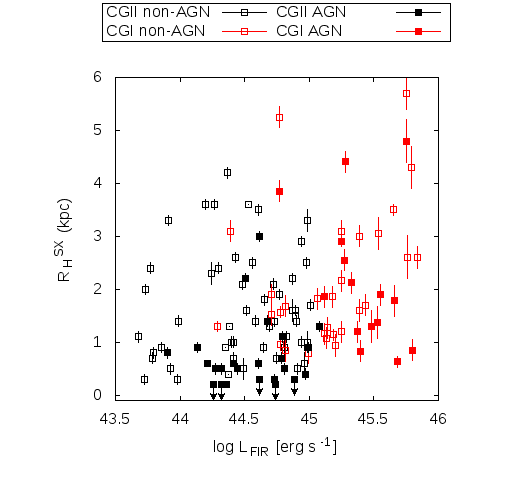
Figure 11 shows the distribution of half-light radii as a function of the far-infrared luminosity. The size of the most intensely X-ray emitting region shows no clear correlation with the overall infrared luminosity, though CGI sources tend to have higher X-ray radii. Within the CGII sample, sources that contain an AGN, as listed in Table 6, plotted in filled squares, tend to be compact. (837)% of them have R kpc. This is in agreement with previous results from a study of the extended MIR emission in GOALS using Spitzer/IRS spectroscopy, where it was found that progressively more AGN-dominated galaxies tend to show more compact MIR emission (Díaz-Santos et al., 2010).
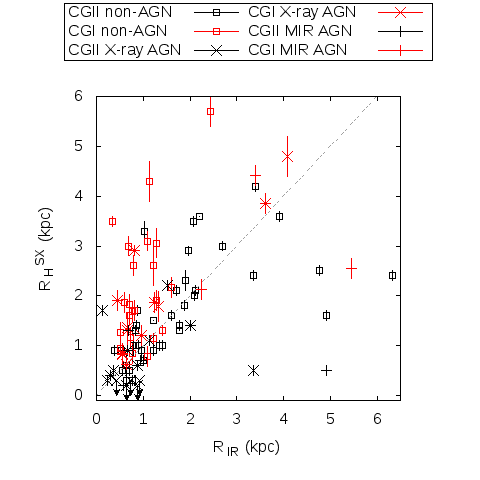
Figure 12 shows a comparison between R and the IR radius at 70 m taken from Díaz-Santos et al. (2017), for all C-GOALS sources. Most sources in the sample are placed close to the line. CGI sources tend to have larger X-ray half-light radius for a given characteristic IR radius, when compared to CGII sources.
Outliers with very compact soft X-ray emission and yet a large IR radius are X-ray selected AGN ESO 343IG013 (N) and IR selected AGN NGC 7592 (W). Both sources show clear strong hard X-ray peaks in the nucleus (see images in Appendix B). Another extreme outlier is IRAS F12112+0305, with R kpc and yet much more compact IR emission.
4.7 Luminosity Surface Density
Using the luminosities listed in Table 3 and the R in Table 10 we derive luminosity surface densities for all sources in the C-GOALS sample, as . is derived using 70 m radii from Díaz-Santos et al. (2017).
Figure 13 shows as a function of . X-ray surface density tends to increase with infrared surface density, though the correlation is broader than the one existing between luminosities. The left plot highlights AGN in filled symbols and separates the CGI and CGII samples. CGI sources, brighter in infrared, tend to have lower for a given . Within a given sample, sources with AGN tend to have a larger , which is to be expected given how they are both brighter in X-rays and also more compact.
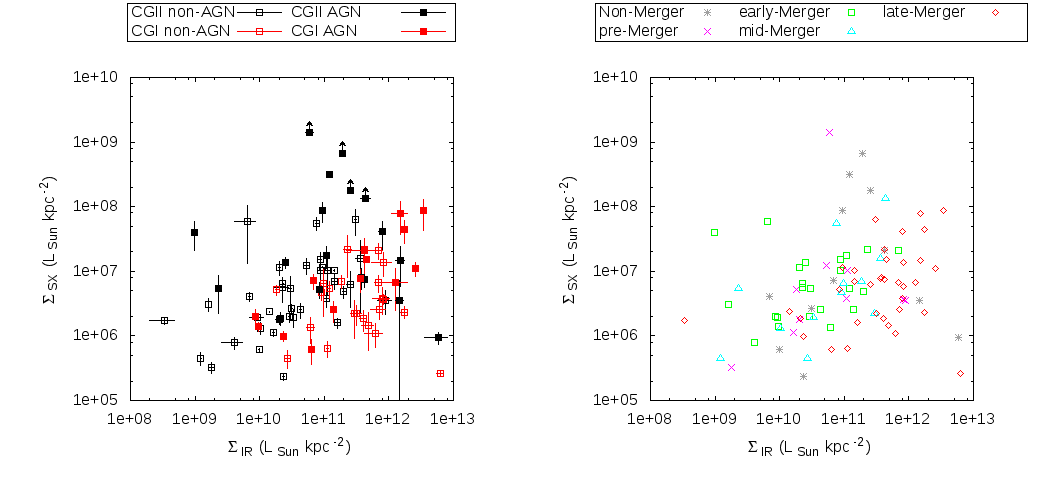
Figure 13 also shows, on the right, the same figure but highlighting merger stage of the sources in the sample. Information on merger stage is taken from Stierwalt et al. (2013), derived from visual inspection of IRAC 3.6 m (Channel 1) images. Classification is Non-merger, pre-merger (galaxy pairs prior to a first encounter), early-stage merger (post-first-encounter with galaxy disks still symmetric and in tact but with signs of tidal tails), mid-stage merger (showing amorphous disks, tidal tails, and other signs of merger activity) and late-stage merger (two nuclei in a common envelope). Sources in late-stage mergers tend to have higher , but lower for the same .
| CGI | CGII | C-GOALS | |
| Non-merger | 4% | 18% | 12% |
| Pre-merger | 4% | 14% | 10% |
| early-stage merger | 30% | 31% | 30% |
| mid-stage merger | 17% | 18% | 18% |
| late-stage merger | 44% | 18% | 27% |
-
•
Notes: Percentage of sources classified as different merger stages by Stierwalt et al. (2013) for the C-GOALS I, C-GOALS II and full C-GOALS sample.
5 Discussion
5.1 X-ray to infrared luminosity relation
The X-ray to infrared luminosity (or SFR) correlation has been studied in numerous previous works (e.g. Fabbiano & Trinchieri, 1985; Fabbiano et al., 1988; Fabbiano, 1989; Bauer et al., 2002; Grimm et al., 2003; Ranalli et al., 2003; Gilfanov et al., 2004; Persic & Rephaeli, 2007; Mineo et al., 2014). For soft X-rays, it originates in starburst-wind shock-heated gas. For hard X-rays ( keV) the relation is thought to be originated in High Mass X-ray Binaries (HMXB), end products of star formation. At low star forming rates, i.e. for local starburst galaxies with L, low-mass X-ray binaries (LMXBs) can significantly contribute to the X-ray luminosity. Luminosity from LMXBs correlates with galaxy stellar mass (), and this dependence must be considered, along with the contribution of SFR (e.g. Colbert et al., 2004; Gilfanov, 2004; Lehmer et al., 2008, 2010).
Figure 9 shows a comparison between C-GOALS data and the correlation derived by Ranalli et al. (2003) for a sample of nearby starbursting galaxies. Works which include the LMXB contribution at low luminosities, show a slight decrease of the slope at the high luminosity end. Therefore, their correlation can be used as a point-of-reference against which to plot the U/LIRG data, though a rigorous comparison would require inclusion of all previously mentioned works, and is beyond the scope of this work.
It is clear that at higher infrared luminosities the correlation breaks down in an apparent deficit of X-ray flux, more extreme in the keV band. This has been observed since the inclusion of the C-GOALS ULIRGs and high-luminosity LIRGs into the mentioned correlations (e.g. Iwasawa et al., 2009; Lehmer et al., 2010; Iwasawa et al., 2011). The inclusion of our CGII data provides more information on the transition between low-IR-luminosity galaxies and ULIRGs.
This underluminosity, or X-ray quietness, is explained in many works as an effect of obscuration. U/LIRGs have extremely high concentrations of gas and dust in their inner regions, resulting in compact starbursts. High gas column densities can easily absorb soft X-rays, and in the most extreme cases, even hard X-rays.
Galaxies in the CGII sample, which are less IR-luminous than those in the CGI sample, are generally found in less-advanced mergers (see Table 11). The concentrations of gas and dust in the inner regions of the galaxies is larger in the more advanced mergers (e.g. Ricci et al., 2017), implying that the contribution of obscuration is more important at higher IR luminosities. From an IR point of view, Díaz-Santos et al. (2010) observe that late-stage mergers are much more compact, hinting also at larger column densities.
5.1.1 Soft X-ray faintness
As shown in Fig. 9, the obscuring column densities necessary to dim the soft X-ray emission in most of the sources are compatible with those derived from the two-component model, plotted in Fig. 6 and listed in Table 7. The derived values of are lower limits, as any gas phase with higher obscuration contributes less significantly to the X-ray emission, or is even completely absorbed, and therefore cannot be fitted.
We note, that our spectral model is based on the existence of two distinct phases in the galaxy ISM. Emission is likely to come from a complex phase-continuum of gas, and thus individual estimates of properties based on the spectral fitting should be taken with caution (see e.g. Strickland & Stevens, 2000, for a discussion). However, the simple two-phase model is the most complex we can fit given our data, and it shows that the column densities can at least explain the data.
Figure 13 shows lower for CGI galaxies, which reflects both their X-ray faintness and larger soft X-ray sizes (Fig. 12). We define the size of the emission as the half-light radius, meaning that larger sizes indicate a less compact source. This implies that the faintness is most likely originating in the center of the source. As CGI galaxies are in more advanced merger stages, and should have higher column densities, this is likely to be an effect of obscuration. Another likely contribution to the larger soft X-ray sizes is the strongest starbursts in CGI galaxies, which generate larger soft X-ray nebulae.
We note that the Chandra resolution is much better than that of Spitzer, which should be taken into account in any direct comparison between characteristics sizes or luminosity surface densities. Higher resolution should imply a tendency toward deriving higher compactness, while Fig. 12 shows the opposite: X-ray sizes are generally similar, or even larger than IR sizes. However, we do not know what the IR emission would look like at similar resolutions. This difference between the datasets could explain the presence of outliers below the line, and add to the dispersion of the data. Future JWST observations would allow for better comparison.
In conclusion, the soft X-ray faintness, and therefore the quadratic best fit curve given by Eq. 4, can be explained through obscuration, as the necessary column densities are present in the galaxies within the C-GOALS sample.
5.1.2 Hard X-ray faintness
Attributing to extinction the observed faintness in hard X-rays, requires much higher gas column densities. While it is clear that more IR-luminous sources (i.e. late-stage mergers) are generally more heavily obscured (e.g. Ricci et al., 2017, for a GOALS subsample), the most extreme sources are dex below the correlation shown in Fig. 9. This implies that between % of the central starburst region must be covered in medium dense enough to suppress even hard X-rays. To obscure the emission in the keV band in which Chandra is sensitive, the necessary column densities would be of the order of cm-2. Sources in the sample that are undetected by NuSTAR (Ricci et al., 2017) would require even higher column densities, of the order of cm-2.
In order to explain the observed faintness, regions of sizes of the order of the R listed in Table 10 would need to be covered in the mentioned high . A column density of cm-2 could imply masses of the order of for a nuclear star-forming region of 500 pc of radius. It is unclear if such large gas masses are truly concentrated in the inner regions of ULIRGs in the GOALS sample, and thus if this “self-absorbed starburst” scenario is feasible.
To disentangle the origin of the faintness, Iwasawa et al. (2009) stack spectra of non-AGN sources in CGI, recovering a high-ionization Fe K feature. This feature can be explained by the presence of an internally shocked, hot bubble produced by thermalizing the energy of supernovae and stellar winds (e.g. Chevalier & Clegg, 1985), which, contrary to the SNe and HMXB emission, could be visible through the obscuring material. With high star formation rates, the luminosity and spectrum with strong Fe XXV line can be reproduced (e.g. Iwasawa et al., 2005, for Arp 220). This high ionization line could also originate from low density gas, photoionized by a hidden AGN, (e.g. Antonucci & Miller, 1985; Krolik & Kallman, 1987) and has been observed as the dominant Fe K feature in some Compton-thick AGNs (e.g. Nandra & Iwasawa, 2007; Braito et al., 2009).
Therefore, another explanation for the X-ray faintness could be the presence of a completely obscured AGN in the nucleus of these galaxies. This AGN would contribute to the infrared emission, while escaping X-ray detection. While the column densities needed to cover the AGN are as high as those needed to self-absorb a starburst, the obscured region would be much smaller. This would imply much smaller masses, easily found in the nuclei of GOALS galaxies. The hidden AGN versus extremely compact starburst scenario has been previously discussed for some of the C-GOALS sources that show the higher X-ray faintness. Cases like Arp 220 (e.g. Scoville et al., 2017; Barcos-Muñoz et al., 2018) or NGC 4418 (e.g. Costagliola et al., 2013, 2015) are compatible with both scenarios. However, it is worth noting that the hidden AGN scenario requires the presence of an AGN with significant IR emission in order to explain the X-ray faintness, which means it is probably unlikely that MIR determinations would systematically fail to pick their signature.
Díaz-Santos et al. (2017) suggest, from interpretation of Herschel Far Infrared data on the full GOALS sample, that the fraction of young, massive stars per star-forming region in ULIRGs might be higher than expected. This does not imply a change in the initial mass function, but the presence of very young star-forming regions, in which most massive stars still have not disappeared (age less than a few Myr Inami et al., 2013). In such a case, the massive stars can contribute to the infrared emission, but the number of HMXB and SNe associated to the region will be low, as those are end-products of the star formation. This would result in a lower-than-expected X-ray luminosity for a given infrared luminosity. Furthermore, in such a scenario, the winds of very massive stars could generate the hot gas that explains the Fe XXV line, without the need to invoke extreme obscuration over a large population of HMXB.
In order to truly understand the origin of the X-ray faintness, further observations are needed that provide information on the obscuration within the sources (e.g. ALMA or NuSTAR observations), or on the unobscured star formation rates (e.g. through radio observations).
5.2 AGN and double AGN fraction
In Sect. 4.3 we have shown that (386)% of systems (24/63) within CGII contain an AGN, (315)% (26/84) of individual galaxies being classified as AGN, according to mid-IR and/or X-ray criteria. This fraction can be compared to the (507)% of systems, or (387)% (21/55) analyzed individual galaxies classified by Iwasawa et al. (2011) when analyzing the more IR-luminous objects in the CGI sample. This result may hint toward a slight increase of AGN presence with IR luminosity, though the fractions in the two samples are compatible within the statistical errors. Although the increase of AGN fraction as a function of luminosity found here is not statistically significant, it is consistent with previous findings in optical and infrared spectroscopy (e.g. Veilleux et al., 1995; Kim et al., 1995; Yuan et al., 2010; Stierwalt et al., 2013).
Double AGN are detected in two interacting systems, NGC 5256 and ESO 432-IG006, of the 30 multiple systems analyzed here (74)%. In the C-GOALS sample one double AGN system, NGC 6240, was detected, out of 24 multiple systems analyzed (44)%.
Theoretical estimates derived from merger simulations performed by Capelo et al. (2017), which take into account observational effects (e.g. observation angle, distance dimming of X-ray luminosity, obscuration of gas surrounding central BH), conclude that in a sample of major mergers hosting at least one AGN, the fraction of dual AGN should be %. Koss et al. (2012) study a sample of 167 nearby () X-ray selected AGN, finding a fraction of dual AGN in multiple systems of 19.5%. When separated into major pairs (mass ratio 0.25) and minor pairs, they find 37.1% and 4.8% respectively. Other studies (e.g. Ellison et al., 2011; Satyapal et al., 2017) find a statistical excess of dual AGN that decreases with galaxy separation. Therefore, dual AGN activation is more likely in advanced merger stages.
Within CGI and CGII, the fraction of double AGN in systems that host at least one AGN is (1110)% (1/9) and (2914)% (2/7) respectively. The fraction found in CGII falls well within the ranges found in the two previously mentioned works, while the dual AGN fraction is CGI is just barely compatible within the errors. Also, CGI galaxies are generally found in more advanced merger stages (see Table 11), meaning that according to predictions their dual AGN fraction should be closer to the mentioned 37.1%, and not the lower 20%.
The lack of dual AGN in the CGI sample could be explained with heavy obscuration, which is expected to be important for these sources, as discussed in the previous section. Compton-thick ( cm-1) AGN may be completely obscured in our Chandra data (e.g. Mrk 273, Iwasawa et al., 2018), and their scattered continuum or Fe Kα lines too faint to be detected . Mid-IR criteria can be effective in such cases, even though they may also miss the most heavily buried AGN (e.g. Snyder et al., 2013). Recent simulations by Blecha et al. (2017) find that much of the AGN lifetime is still undetected with common mid-IR selection criteria, even in the late stages of gas-rich major mergers. This effect is incremented for AGN which don’t contribute significantly to the bolometric luminosity, especially when considering that the presence of strong a starburst can help dilute the AGN signature. Fig. 5 shows up to 19/32 X-ray selected AGN in C-GOALS that contribute less than 20% to the bolometric luminosity, most of which are missed by mid-IR selection criteria (see Table 6).
Another likely contribution into the low fraction of dual AGN found in CGI is the inability to resolve individual nuclei in a late-stage merger. Many CGI galaxies are found in such a stage. While Chandra has a high spatial resolution (0.5”), very closely interacting nuclei, with separations of the order of pc, would remain unresolved in our sample. Spitzer data, also used in this work for the mid-IR AGN selection, has a much lower resolution, and would not resolve double AGN with even further separations.
However, as our sample sizes are small and therefore the statistical errors large, we cannot make any strong statements regarding a decreasing trend of double AGN presence with infrared luminosity.
6 Conclusions
We analyze Chandra-ACIS data for a sample of 63 U/LIRGs, composed by 84 individual galaxies (CGII). These galaxies are a low-IR-luminosity subsample of GOALS, a complete flux-limited sample of the 60 m selected, bright galaxies in the local universe (z0.08). Arcsec-resolution images, spectra and radial surface brightness profiles are presented. We compare the observations with Spitzer and Herschel data to contrast their X-ray and infrared properties. We also compare our results to those found by Iwasawa et al. (2011) for the high-IR-luminosity subsample of GOALS (CGI). We summarize our main findings.
-
•
Objects with AGN signature represent a (315)% of the CGII sample, compared to the (387)% reported for the CGI sample. Double AGN are detected in two interacting systems, implying that the fraction of of double AGN in systems that host at least one AGN is (2914)%, in contrast to the (1110)% found for the CGI sample.
-
•
19/32 of the X-ray selected AGN in the full C-GOALS sample (CGI+CGII) are not energetically significant, contributing less than to the bolometric luminosity of the galaxy, according to MIR determinations.
-
•
The brightest LIRGs, at L⊙, show hard X-ray faintness with respect to the luminosities predicted by correlations found for nearby star-forming galaxies. This behavior is accentuated for the CGI ULIRGs. Possible explanations for the sources with most extreme deviations include a self-absorbed starburst, an obscured AGN or the presence of extremely young star-forming regions.
-
•
The extended soft X-ray emission shows a spectrum consistent with thermal emission from a two-phase gas, with an inner, hotter and more heavily obscured component, and an outer, colder and unobscured component.
-
•
According to our modeling, an obscuration of the inner component in the range of cm-2 can explain the soft X-ray faintness for the vast majority of the sources.
-
•
Most sources within CGII have a compact soft X-ray morphology. (508)% of the sources generate half of the emission within the inner kpc. This behavior is accentuated for AGN, with (837)% of the sources with half-light radius below kpc.
-
•
CGI sources are, in comparison, less compact, which is most likely an effect of obscuration in the inner regions.
-
•
Most sources in CGII have similar soft X-ray and MIR sizes, though there is important dispersion in this relation.
Acknowledgments
We thank the anonymous referee for helpful comments and suggestions. We acknowledge support by the Spanish Ministerio de Economía y Competitividad (MINECO/FEDER, UE) under grants AYA2013-47447-C3-1-P and MDM-2014-0369 of ICCUB (Unidad de Excelencia ‘María de Maeztu’). N.T-A. acknowledges support from MINECO through FPU14/04887 grant. T.D.-S. acknowledges support from ALMA-CONICYT project 31130005 and FONDECYT regular project 1151239. G.C.P. acknowledges support from the University of Florida. This work was conducted in part at the Aspen Center for Physics, which is supported by NSF grant PHY-1607611; V.U., G.C.P, D.B.S., A.M.M., T.D-S. and A.S.E. thank the Center for its hospitality during the Astrophysics of Massive Black Holes Mergers workshop in June and July 2018. The scientific results reported in this article are based on observations made by Chandra X-ray Observatory, and has made use of the NASA/IPAC Extragalactic Database (NED) which is operated by the Jet Propulsion Laboratory, California Institute of Technology under contract with NASA. We acknowledge the use of the software packages CIAO and HEASoft.
References
- Alam et al. (2015) Alam, S., Albareti, F. D., Allende Prieto, C., et al. 2015, ApJS, 219, 12
- Alonso-Herrero et al. (2012) Alonso-Herrero, A., Pereira-Santaella, M., Rieke, G. H., & Rigopoulou, D. 2012, ApJ, 744, 2
- Antonucci & Miller (1985) Antonucci, R. R. J. & Miller, J. S. 1985, ApJ, 297, 621
- Armus et al. (2009) Armus, L., Mazzarella, J. M., Evans, A. S., et al. 2009, PASP, 121, 559
- Atek et al. (2008) Atek, H., Kunth, D., Hayes, M., Östlin, G., & Mas-Hesse, J. M. 2008, A&A, 488, 491
- Baan & Klöckner (2006) Baan, W. A. & Klöckner, H.-R. 2006, A&A, 449, 559
- Band et al. (1990) Band, D. L., Klein, R. I., Castor, J. I., & Nash, J. K. 1990, ApJ, 362, 90
- Barcos-Muñoz et al. (2018) Barcos-Muñoz, L., Aalto, S., Thompson, T. A., et al. 2018, ApJ, 853, L28
- Barcos-Muñoz et al. (2017) Barcos-Muñoz, L., Leroy, A. K., Evans, A. S., et al. 2017, ApJ, 843, 117
- Bauer et al. (2002) Bauer, F. E., Alexander, D. M., Brandt, W. N., et al. 2002, AJ, 124, 2351
- Blackburn (1995) Blackburn, J. K. 1995, in Astronomical Society of the Pacific Conference Series, Vol. 77, Astronomical Data Analysis Software and Systems IV, ed. R. A. Shaw, H. E. Payne, & J. J. E. Hayes, 367
- Blecha et al. (2017) Blecha, L., Snyder, G. F., Satyapal, S., & Ellison, S. L. 2017, ArXiv e-prints [arXiv:1711.02094]
- Braito et al. (2009) Braito, V., Reeves, J. N., Della Ceca, R., et al. 2009, A&A, 504, 53
- Brightman & Nandra (2011) Brightman, M. & Nandra, K. 2011, MNRAS, 413, 1206
- Capelo et al. (2017) Capelo, P. R., Dotti, M., Volonteri, M., et al. 2017, MNRAS, 469, 4437
- Casey et al. (2014) Casey, C. M., Narayanan, D., & Cooray, A. 2014, Phys. Rep, 541, 45
- Chapman et al. (1990) Chapman, J. M., Staveley-Smith, L., Axon, D. J., et al. 1990, MNRAS, 244, 281
- Chevalier & Clegg (1985) Chevalier, R. A. & Clegg, A. W. 1985, Nature, 317, 44
- Chu et al. (2017) Chu, J. K., Sanders, D. B., Larson, K. L., et al. 2017, ApJS, 229, 25
- Clemens et al. (2008) Clemens, M. S., Vega, O., Bressan, A., et al. 2008, A&A, 477, 95
- Colbert et al. (2004) Colbert, E. J. M., Heckman, T. M., Ptak, A. F., Strickland, D. K., & Weaver, K. A. 2004, ApJ, 602, 231
- Condon (1992) Condon, J. J. 1992, ARA&A, 30, 575
- Corbett et al. (2002) Corbett, E. A., Norris, R. P., Heisler, C. A., et al. 2002, ApJ, 564, 650
- Costagliola et al. (2013) Costagliola, F., Aalto, S., Sakamoto, K., et al. 2013, A&A, 556, A66
- Costagliola et al. (2015) Costagliola, F., Sakamoto, K., Muller, S., et al. 2015, A&A, 582, A91
- Del Moro et al. (2016) Del Moro, A., Alexander, D. M., Bauer, F. E., et al. 2016, MNRAS, 456, 2105
- Di Matteo et al. (2005) Di Matteo, T., Springel, V., & Hernquist, L. 2005, Nature, 433, 604
- Díaz-Santos et al. (2017) Díaz-Santos, T., Armus, L., Charmandaris, V., et al. 2017, ApJ, 846, 32
- Díaz-Santos et al. (2010) Díaz-Santos, T., Charmandaris, V., Armus, L., et al. 2010, ApJ, 723, 993
- Dopita et al. (2002) Dopita, M. A., Pereira, M., Kewley, L. J., & Capaccioli, M. 2002, ApJS, 143, 47
- Dudik et al. (2009) Dudik, R. P., Satyapal, S., & Marcu, D. 2009, ApJ, 691, 1501
- Ellison et al. (2011) Ellison, S. L., Patton, D. R., Mendel, J. T., & Scudder, J. M. 2011, MNRAS, 418, 2043
- Evans et al. (2008) Evans, A. S., Vavilkin, T., Pizagno, J., et al. 2008, ApJ, 675, L69
- Fabbiano (1989) Fabbiano, G. 1989, ARA&A, 27, 87
- Fabbiano et al. (2004) Fabbiano, G., Baldi, A., King, A. R., et al. 2004, ApJ, 605, L21
- Fabbiano et al. (1988) Fabbiano, G., Gioia, I. M., & Trinchieri, G. 1988, ApJ, 324, 749
- Fabbiano & Trinchieri (1985) Fabbiano, G. & Trinchieri, G. 1985, ApJ, 296, 430
- Falstad et al. (2015) Falstad, N., González-Alfonso, E., Aalto, S., et al. 2015, A&A, 580, A52
- Franceschini et al. (2003) Franceschini, A., Braito, V., Persic, M., et al. 2003, MNRAS, 343, 1181
- Fruscione et al. (2006) Fruscione, A., McDowell, J. C., Allen, G. E., et al. 2006, in Proc. SPIE, Vol. 6270, Society of Photo-Optical Instrumentation Engineers (SPIE) Conference Series, 62701V
- Garmire et al. (2003) Garmire, G. P., Bautz, M. W., Ford, P. G., Nousek, J. A., & Ricker, Jr., G. R. 2003, in Proc. SPIE, Vol. 4851, X-Ray and Gamma-Ray Telescopes and Instruments for Astronomy., ed. J. E. Truemper & H. D. Tananbaum, 28–44
- Gilfanov (2004) Gilfanov, M. 2004, MNRAS, 349, 146
- Gilfanov et al. (2004) Gilfanov, M., Grimm, H.-J., & Sunyaev, R. 2004, Nuclear Physics B Proceedings Supplements, 132, 369
- Gilli et al. (1999) Gilli, R., Comastri, A., Brunetti, G., & Setti, G. 1999, New A, 4, 45
- Goldader et al. (1997) Goldader, J. D., Joseph, R. D., Doyon, R., & Sanders, D. B. 1997, ApJS, 108, 449
- Grimm et al. (2003) Grimm, H.-J., Gilfanov, M., & Sunyaev, R. 2003, MNRAS, 339, 793
- Haan et al. (2011) Haan, S., Surace, J. A., Armus, L., et al. 2011, AJ, 141, 100
- Hattori et al. (2004) Hattori, T., Yoshida, M., Ohtani, H., et al. 2004, AJ, 127, 736
- Helou et al. (1985) Helou, G., Soifer, B. T., & Rowan-Robinson, M. 1985, ApJ, 298, L7
- Hernquist (1989) Hernquist, L. 1989, Nature, 340, 687
- Hill et al. (2001) Hill, T. L., Heisler, C. A., Norris, R. P., Reynolds, J. E., & Hunstead, R. W. 2001, AJ, 121, 128
- Hinshaw et al. (2009) Hinshaw, G., Weiland, J. L., Hill, R. S., et al. 2009, ApJS, 180, 225
- Hopkins et al. (2009) Hopkins, P. F., Bundy, K., Murray, N., et al. 2009, MNRAS, 398, 898
- Hopkins et al. (2005) Hopkins, P. F., Hernquist, L., Cox, T. J., et al. 2005, Astrophysical Journal, 630, 705
- Howell et al. (2007) Howell, J. H., Mazzarella, J. M., Chan, B. H. P., et al. 2007, AJ, 134, 2086
- Hutchings et al. (1990) Hutchings, J. B., Lo, E., Neff, S. G., Stanford, S. A., & Unger, S. W. 1990, AJ, 100, 60
- Inami et al. (2013) Inami, H., Armus, L., Charmandaris, V., et al. 2013, ApJ, 777, 156
- Inui et al. (2005) Inui, T., Matsumoto, H., Tsuru, T. G., et al. 2005, PASJ, 57, 135
- Iwasawa et al. (2009) Iwasawa, K., Sanders, D. B., Evans, A. S., et al. 2009, ApJ, 695, L103
- Iwasawa et al. (2005) Iwasawa, K., Sanders, D. B., Evans, A. S., et al. 2005, MNRAS, 357, 565
- Iwasawa et al. (2011) Iwasawa, K., Sanders, D. B., Teng, S. H., et al. 2011, A&A, 529, A106
- Iwasawa et al. (2018) Iwasawa, K., U, V., Mazzarella, J. M., et al. 2018, A&A, 611, A71
- Joy & Harvey (1987) Joy, M. & Harvey, P. M. 1987, ApJ, 315, 480
- Kaaret & Alonso-Herrero (2008) Kaaret, P. & Alonso-Herrero, A. 2008, ApJ, 682, 1020
- Kaastra (1992) Kaastra, J. 1992, An X-Ray Spectral Code for Optically Thin Plasmas (Internal SRON-Leiden Report, updated version 2.0)
- Kalberla et al. (2005) Kalberla, P. M. W., Burton, W. B., Hartmann, D., et al. 2005, A&A, 440, 775
- Kennicutt (1998) Kennicutt, Jr., R. C. 1998, ApJ, 498, 541
- Kewley et al. (2001) Kewley, L. J., Dopita, M. A., Sutherland, R. S., Heisler, C. A., & Trevena, J. 2001, ApJ, 556, 121
- Kewley et al. (2006) Kewley, L. J., Groves, B., Kauffmann, G., & Heckman, T. 2006, MNRAS, 372, 961
- Kim et al. (1995) Kim, D.-C., Sanders, D. B., Veilleux, S., Mazzarella, J. M., & Soifer, B. T. 1995, ApJS, 98, 129
- Kocevski et al. (2015) Kocevski, D. D., Brightman, M., Nandra, K., et al. 2015, ApJ, 814, 104
- Koss et al. (2012) Koss, M., Mushotzky, R., Treister, E., et al. 2012, ApJ, 746, L22
- Koyama et al. (1989) Koyama, K., Inoue, H., Tanaka, Y., et al. 1989, PASJ, 41, 731
- Kreckel et al. (2014) Kreckel, K., Armus, L., Groves, B., et al. 2014, ApJ, 790, 26
- Krolik & Kallman (1987) Krolik, J. H. & Kallman, T. R. 1987, ApJ, 320, L5
- Kunth et al. (2003) Kunth, D., Leitherer, C., Mas-Hesse, J. M., Östlin, G., & Petrosian, A. 2003, ApJ, 597, 263
- Kuo et al. (2008) Kuo, C.-Y., Lim, J., Tang, Y.-W., & Ho, P. T. P. 2008, ApJ, 679, 1047
- Lahuis et al. (2007) Lahuis, F., Spoon, H. W. W., Tielens, A. G. G. M., et al. 2007, ApJ, 659, 296
- Lanzuisi et al. (2015) Lanzuisi, G., Ranalli, P., Georgantopoulos, I., et al. 2015, A&A, 573, A137
- Larson et al. (2016) Larson, K. L., Sanders, D. B., Barnes, J. E., et al. 2016, ApJ, 825, 128
- Lehmer et al. (2010) Lehmer, B. D., Alexander, D. M., Bauer, F. E., et al. 2010, ApJ, 724, 559
- Lehmer et al. (2008) Lehmer, B. D., Brandt, W. N., Alexander, D. M., et al. 2008, ApJ, 681, 1163
- Levenson et al. (2002) Levenson, N. A., Krolik, J. H., Życki, P. T., et al. 2002, ApJ, 573, L81
- Levenson et al. (2005) Levenson, N. A., Weaver, K. A., Heckman, T. M., Awaki, H., & Terashima, Y. 2005, ApJ, 618, 167
- Liedahl et al. (1995) Liedahl, D. A., Osterheld, A. L., & Goldstein, W. H. 1995, ApJ, 438, L115
- Lipovetsky et al. (1988) Lipovetsky, V. A., Neizvestny, S. I., & Neizvestnaya, O. M. 1988, Soobshcheniya Spetsial’noj Astrofizicheskoj Observatorii, 55, 5
- Lira et al. (2002) Lira, P., Ward, M., Zezas, A., Alonso-Herrero, A., & Ueno, S. 2002, MNRAS, 330, 259
- Lonsdale et al. (1993) Lonsdale, C. J., Smith, H. J., & Lonsdale, C. J. 1993, ApJ, 405, L9
- Luangtip et al. (2015) Luangtip, W., Roberts, T. P., Mineo, S., et al. 2015, MNRAS, 446, 470
- Magdziarz & Zdziarski (1995) Magdziarz, P. & Zdziarski, A. A. 1995, MNRAS, 273, 837
- Maia et al. (1996) Maia, M. A. G., Suzuki, J. A., da Costa, L. N., Willmer, C. N. A., & Rite, C. 1996, A&AS, 117, 487
- Maiolino et al. (2003) Maiolino, R., Comastri, A., Gilli, R., et al. 2003, MNRAS, 344, L59
- Mazzarella et al. (2012) Mazzarella, J. M., Iwasawa, K., Vavilkin, T., et al. 2012, AJ, 144, 125
- Meléndez et al. (2014) Meléndez, M., Heckman, T. M., Martínez-Paredes, M., Kraemer, S. B., & Mendoza, C. 2014, MNRAS, 443, 1358
- Mewe et al. (1985) Mewe, R., Gronenschild, E. H. B. M., & van den Oord, G. H. J. 1985, A&AS, 62, 197
- Mineo et al. (2014) Mineo, S., Gilfanov, M., Lehmer, B. D., Morrison, G. E., & Sunyaev, R. 2014, Monthly Notices of the RAS, 437, 1698
- Mirabel & Sanders (1988) Mirabel, I. F. & Sanders, D. B. 1988, ApJ, 335, 104
- Moorwood & Oliva (1994) Moorwood, A. F. M. & Oliva, E. 1994, ApJ, 429, 602
- Mould et al. (2000) Mould, J. R., Huchra, J. P., Freedman, W. L., et al. 2000, ApJ, 529, 786
- Mudd et al. (2014) Mudd, D., Mathur, S., Guainazzi, M., et al. 2014, ApJ, 787, 40
- Nandra & Iwasawa (2007) Nandra, K. & Iwasawa, K. 2007, MNRAS, 382, L1
- Nandra & Pounds (1994) Nandra, K. & Pounds, K. A. 1994, MNRAS, 268, 405
- Norris & Forbes (1995) Norris, R. P. & Forbes, D. A. 1995, ApJ, 446, 594
- Oda et al. (2018) Oda, S., Ueda, Y., Tanimoto, A., & Ricci, C. 2018, ApJ, 855, 79
- O’Sullivan et al. (2014) O’Sullivan, E., Zezas, A., Vrtilek, J. M., et al. 2014, ApJ, 793, 73
- Parra et al. (2010) Parra, R., Conway, J. E., Aalto, S., et al. 2010, ApJ, 720, 555
- Pereira-Santaella et al. (2015a) Pereira-Santaella, M., Alonso-Herrero, A., Colina, L., et al. 2015a, A&A, 577, A78
- Pereira-Santaella et al. (2015b) Pereira-Santaella, M., Colina, L., Alonso-Herrero, A., et al. 2015b, MNRAS, 454, 3679
- Persic & Rephaeli (2007) Persic, M. & Rephaeli, Y. 2007, A&A, 463, 481
- Petric et al. (2011) Petric, A. O., Armus, L., Howell, J., et al. 2011, ApJ, 730, 28
- Ptak et al. (2003) Ptak, A., Heckman, T., Levenson, N. A., Weaver, K., & Strickland, D. 2003, ApJ, 592, 782
- Ranalli et al. (2003) Ranalli, P., Comastri, A., & Setti, G. 2003, A&A, 399, 39
- Ricci et al. (2016) Ricci, C., Bauer, F. E., Treister, E., et al. 2016, ApJ, 819, 4
- Ricci et al. (2017) Ricci, C., Bauer, F. E., Treister, E., et al. 2017, MNRAS, 468, 1273
- Ricci et al. (2014) Ricci, C., Ueda, Y., Paltani, S., et al. 2014, MNRAS, 441, 3622
- Risaliti et al. (2005) Risaliti, G., Elvis, M., Fabbiano, G., Baldi, A., & Zezas, A. 2005, ApJ, 623, L93
- Risaliti et al. (2007) Risaliti, G., Elvis, M., Fabbiano, G., et al. 2007, ApJ, 659, L111
- Risaliti et al. (2000) Risaliti, G., Gilli, R., Maiolino, R., & Salvati, M. 2000, A&A, 357, 13
- Risaliti et al. (2009) Risaliti, G., Miniutti, G., Elvis, M., et al. 2009, ApJ, 696, 160
- Romero-Cañizales et al. (2017) Romero-Cañizales, C., Alberdi, A., Ricci, C., et al. 2017, MNRAS, 467, 2504
- Romero-Cañizales et al. (2012) Romero-Cañizales, C., Pérez-Torres, M. A., Alberdi, A., et al. 2012, A&A, 543, A72
- Roussel et al. (2003) Roussel, H., Helou, G., Beck, R., et al. 2003, ApJ, 593, 733
- Rudnick et al. (2000) Rudnick, G., Rix, H.-W., & Kennicutt, Jr., R. C. 2000, ApJ, 538, 569
- Sales et al. (2015) Sales, D. A., Robinson, A., Axon, D. J., et al. 2015, ApJ, 799, 25
- Sanders (1999) Sanders, D. B. 1999, Astrophysics and Space Science, 266, 331
- Sanders et al. (2003) Sanders, D. B., Mazzarella, J. M., Kim, D.-C., Surace, J. A., & Soifer, B. T. 2003, AJ, 126, 1607
- Sanders et al. (1988) Sanders, D. B., Soifer, B. T., Elias, J. H., et al. 1988, ApJ, 325, 74
- Satyapal et al. (2014) Satyapal, S., Ellison, S. L., McAlpine, W., et al. 2014, MNRAS, 441, 1297
- Satyapal et al. (2017) Satyapal, S., Secrest, N. J., Ricci, C., et al. 2017, ApJ, 848, 126
- Scoville et al. (2017) Scoville, N., Murchikova, L., Walter, F., et al. 2017, ApJ, 836, 66
- Shalyapina et al. (2004) Shalyapina, L. V., Moiseev, A. V., Yakovleva, V. A., Hagen-Thorn, V. A., & Burenkov, A. N. 2004, Astronomy Letters, 30, 1
- Shu et al. (2007) Shu, X. W., Wang, J. X., Jiang, P., Fan, L. L., & Wang, T. G. 2007, ApJ, 657, 167
- Silverman et al. (2011) Silverman, J. D., Kampczyk, P., Jahnke, K., et al. 2011, ApJ, 743, 2
- Singh et al. (2012) Singh, V., Risaliti, G., Braito, V., & Shastri, P. 2012, MNRAS, 419, 2089
- Smith et al. (1996) Smith, D. A., Herter, T., Haynes, M. P., Beichman, C. A., & Gautier, III, T. N. 1996, ApJS, 104, 217
- Snyder et al. (2013) Snyder, G. F., Hayward, C. C., Sajina, A., et al. 2013, ApJ, 768, 168
- Stierwalt et al. (2013) Stierwalt, S., Armus, L., Surace, J. A., et al. 2013, ApJS, 206, 1
- Strickland & Stevens (2000) Strickland, D. K. & Stevens, I. R. 2000, MNRAS, 314, 511
- Surace et al. (2004) Surace, J. A., Sanders, D. B., & Mazzarella, J. M. 2004, AJ, 127, 3235
- Teng & Veilleux (2010) Teng, S. H. & Veilleux, S. 2010, ApJ, 725, 1848
- Teng et al. (2005) Teng, S. H., Wilson, A. S., Veilleux, S., et al. 2005, ApJ, 633, 664
- Terashima et al. (2015) Terashima, Y., Hirata, Y., Awaki, H., et al. 2015, ApJ, 814, 11
- Turner et al. (2001) Turner, M. J. L., Reeves, J. N., Ponman, T. J., et al. 2001, A&A, 365, L110
- Turner & Miller (2009) Turner, T. J. & Miller, L. 2009, A&A Rev., 17, 47
- Valiante et al. (2009) Valiante, E., Lutz, D., Sturm, E., Genzel, R., & Chapin, E. L. 2009, ApJ, 701, 1814
- Vega et al. (2008) Vega, O., Clemens, M. S., Bressan, A., et al. 2008, A&A, 484, 631
- Veilleux et al. (1999) Veilleux, S., Kim, D.-C., & Sanders, D. B. 1999, ApJ, 522, 113
- Veilleux et al. (1995) Veilleux, S., Kim, D.-C., Sanders, D. B., Mazzarella, J. M., & Soifer, B. T. 1995, ApJS, 98, 171
- Veilleux et al. (2009) Veilleux, S., Rupke, D. S. N., Kim, D.-C., et al. 2009, ApJS, 182, 628
- Wang et al. (2009) Wang, J., Fabbiano, G., Elvis, M., et al. 2009, ApJ, 694, 718
- Weisskopf et al. (2000) Weisskopf, M. C., Tananbaum, H. D., Van Speybroeck, L. P., & O’Dell, S. L. 2000, in Proc. SPIE, Vol. 4012, X-Ray Optics, Instruments, and Missions III, ed. J. E. Truemper & B. Aschenbach, 2–16
- West (1976) West, R. M. 1976, A&A, 46, 327
- Xu et al. (2015) Xu, C. K., Cao, C., Lu, N., et al. 2015, ApJ, 799, 11
- Yeghiazaryan et al. (2016) Yeghiazaryan, A. A., Nazaryan, T. A., & Hakobyan, A. A. 2016, Journal of Astrophysics and Astronomy, 37, 1
- Yuan et al. (2010) Yuan, T.-T., Kewley, L. J., & Sanders, D. B. 2010, ApJ, 709, 884
- Zhou et al. (2014) Zhou, Z.-M., Wu, H., Huang, L., et al. 2014, Research in Astronomy and Astrophysics, 14, 1393
- Zink et al. (2000) Zink, E. C., Lester, D. F., Doppmann, G., & Harvey, P. M. 2000, ApJS, 131, 413
Appendix A Notes on individual objects
[45] UGC 08387: This sources meets our [Ne v] 14.32 m line selection criterion, and is thus classified as an AGN, though there is no hint of its presence in the X-ray Chandra data. As already seen in Iwasawa et al. (2011), a soft X-ray nebulae extends perpendicular to the plane of the galaxy; most likely associated with a galactic-scale outflow.
Previous evidence of the AGN presence has come from detection of compact radio sources at mili-arcsec resolution (e.g. Lonsdale et al. 1993; Parra et al. 2010), which Romero-Cañizales et al. (2012) attributed to the presence of various supernovae in coexistence with a low-luminosity AGN. Using VLBI data, Romero-Cañizales et al. (2017) provide evidence for the presence of a pc-scale radio jet.
[47] CGCG 436030: This galaxy shows three bright X-ray peaks in the soft band, with only the central one corresponding to a hard-band peak. The other two, placed following the spiral arm structure in the optical images, most likely correspond to star-forming regions.
In the DSS image there is a hint of a bridge of material between the galaxy and a fainter galaxy ’ to the east, with which it seem to be interacting (Mirabel & Sanders 1988; Zink et al. 2000). This other galaxy is not detected in the Chandra X-ray data nor the MIPS data, and is only visible in near-infrared observations such as the largest-wavelength IRAC channels. Therefore, we have not considered any contribution to the IRAS flux originating from this nearby companion.
[49] NGC 0695: This source has a rather flat spectrum in the keV range. There is considerable extended emission in soft band, and both bands present a very intense emission from the central region.
[51] MCG+0723019: This ring galaxy is composed of an elongated main body with double components separated by ” ( kpc) and an oval ring with a diameter of 16” to the west of the main body (Hattori et al. 2004). As already suggested by JHKL-band mapping, the nucleus of the galaxy lies between the two optical components and is heavily obscured in optical images (Joy & Harvey 1987). Chandra data show clear emission coming from the elongated disk of the galaxy. The X-ray emission is more intense in the centre, and unobscured both in hard and soft bands. There is extended soft X-ray emission around the nucleus, which partly follows the oval ring, most likely tracing star formation.
[52] NGC 6670: This closely interacting merger is composed of two sources, NGC 6670A (or East) and NGC 6670B (or West), separated ’. Both galaxies contribute to the IRAS flux (Chu et al. 2017), with the western component being slightly brighter.
X-ray emission from the eastern component is mostly observed in soft band, and concentrated around the nucleus. The western source, however, shows extended diffuse emission, particularly along the plane of the galaxy. The emission near the centre is more intense, both in hard and soft band, at both sides of the nucleus. This morphology suggests high absorption in the innermost region. The spectrum is also suggestive of a hard excess, and a simple power-law fit results in a photon index of . Fitting an absorbed power-law of fixed photon index results in a moderate absorbing column density of cm-2, and no significant improvement on the fit. The X-ray luminosity of the source is cm-2. The excess at keV, if interpreted as a possible Fe K line, is not significant to the 1 level.
XMM-Newton data for both sources, resolved, in this double system was analyzed by Mudd et al. (2014), with no hint of AGN presence detected. However, their short exposure implied a detection of cts per source, lower than the counts detected in our Chandra data.
We consider that, even though we cannot rule out the possibility of the western source containing an AGN, we have no strong evidence to claim its presence.
[53] UGC 02369: This double system, separated by ’, is clearly dominated in X-rays by the southern component which, as shown in Table 4, is also responsible for % of the infrared emission. Due to the negligible contribution to the IRAS flux originating in the northern galaxy, we do not present any results for this component. An X-ray analysis would also not be possible, as only cts are detected for this source.
The southern source is compact in X-rays, with emission coming both from the nucleus and from a star forming region in the spiral arm, at south, both in soft and hard bands.
[54] NGC 1614: This source has been classified as a possible obscured AGN through X-ray spectroscopy (Risaliti et al. 2000), though VLBI studies with a sensitivity limit of 0.9 mJy do not detect a compact radio core in it (Hill et al. 2001). Recent studies in sub-arcsec mid-IR observations do not completely rule out a possible (weak) AGN scenario, but they constrain that the nuclear luminosity is % of the overall bolometric luminosity of the galaxy (Pereira-Santaella et al. 2015b). ALMA observations do not detect the nucleus in either the CO (6-5) line emission and the 435 m continuum, ruling out with relatively high confidence a Compton-thick AGN (Xu et al. 2015) .
In any case, this source also does not meet any of our AGN selection criteria, and we do not see any signs of AGN presence in the Chandra spectrum.
Emission both in hard and soft band is peaked in the nucleus, and the soft band emission also shows elongated extension in the E-W direction, as opposed to the optical edge-on disk, which is elongated toward the N-S direction. Intense star formation, very compact in the nucleus, is the most likely origin of the X-ray emission.
[56] NGC 5331: Both galaxies in this system, separated by ’, contribute to the IRAS flux, though the southern component is responsible for % of the emission, as shown in Table 4. However, since their X-ray luminosity is comparable, the northern galaxy has a much higher logarithmic ratio (as defined in Table 3). This value is close to the expected given the correlation derived by Ranalli et al. (2003), but high when compared to the characteristic X-ray faintness of the GOALS sample.
[57] IRAS F060762139: This closely interacting merger is clearly dominated by the northern source both in infrared and X-rays. However, with only cts, the southern source meets our HR criterion for AGN selection (). The spectrum also shows an increase in flux toward higher energies, despite the significant error bars. Only the hardness ratio is computed as part of the analysis of this source, due to the low number of counts. For the same reason, a radial profile is not provided for this component.
The northern source comes close to meeting the same AGN selection criteria, with . The spectrum might hint toward an excess in hard band, though an absorbed power-law fit with a fixed photon index of 1.8 yields a column density of only cm-2. With a full-band X-ray luminosity of erg s-1, and fitting statistics also favoring a non-absorbed power-law, we opt not to consider this source an AGN.
[60] IC 2810: Both galaxies in this system, separated by ’, contribute to the IRAS flux as shown in Table 4, with the north-western source contributing % of the infrared luminosity.
[63] IRAS 18090+0130: Both galaxies in this system, separated by ’, contribute to the IRAS flux, with the eastern component being responsible for % of the emission. The western component has a low X-ray flux, and not enough counts to provide reliable data for any analysis further than computing a hardness ratio.
[64] III Zw 035: This closely interacting double system is completely unresolved in both Herschel and MIPS images used to derive the contribution of each galaxy into the IRAS source, as shown in Table 4. However, Chapman et al. (1990) mention that the majority of the radio continuum (and also probably FIR) emission originates in the northern galaxy. High angular resolution radio continuum observations from (Barcos-Muñoz et al. 2017) indicate the northern component is the most compact source of the brightest and closest ULIRGs from the GOALS sample, while they don’t detect the southern component at 33 GHz. Also, when considering IRAC channel 1 to 4 images (at 3.6, 4.5 ,5.8 and 8.0 ), it is possible to see that the northern source clearly dominates and the southern source fades with increasing wavelength. Thus, we assign a contribution to the IRAS flux of 100% to the northern source.
Due to the lack of IRAS flux originating in the southern component, we do not present results for its X-ray analysis in this work, and we do not consider it a source within our sample. The total X-ray counts for this galaxy are cts in the full keV range, which also does not allow for a detailed X-ray analysis either, though a simple power-law fit gives an estimated erg s-1. However, while the soft band X-ray flux is dominated by the northern source, the hard band X-ray flux is very similar for both, and the southern source is optically classified as a Seyfert 2 (Yuan et al. 2010). It is then possible that the northern source is responsible for the high IRAS flux, most likely having a burst of star formation, while the NIR and MIR contribution from the southern source might be due to the presence of an AGN.
[65] NGC 3256: This source is assumed to be in an advanced merger stage, with a northern brighter component (the central peak) and a southern component at about ”, elongated in the EW direction. The possibility of this being a merging, obscured, companion galaxy was first suggested by Moorwood & Oliva (1994), and radio observations by Norris & Forbes (1995) supported this theory by detecting two equally bright knots. However, high-resolution MIR imaging shows that the northern peak is actually times brighter than the southern region, suggesting that most of the star formation in the galaxy is originated there (Lira et al. 2002). They also find the northern peak to be brighter in X-rays, using Chandra data. The images shown in this work mark the two hard-band peaks mentioned by them, the southern clearly falling in an obscured region, with dimmer soft band emission.
The very advanced merger stage of this source makes it hard to determine how much of the surrounding extended emission was initially associated to any of the cores. Therefore, we analyze it as a single source in order to avoid introducing errors into the determination of its Infrared and X-ray emission.
[67] IRAS F163990937: This closely interacting pair is unresolved both in Herschel and MIPS data, though Haan et al. (2011) derive that most of the MIR emission (90%) is coming from the northern source. We use this value to correct for the fraction contributed to the IRAS flux by each galaxy.
The northern source shows two intense hard X-ray peaks, both corresponding to soft X-ray emitting regions, the more southern of which is the nucleus. The other, as well as the less-intense knots seen in both sources, probably correspond to star forming regions. The spectrum of this source shows an excess at keV, with a few hard counts coming from the nuclear region. Fitting an absorbed power-law with a photon index of 1.8 yields an absorbing column density of cm-2, though an unabsorbed power-law of photon index is an equally good fit. With a net count number of cts, we do not believe we can confidently classify this source as an AGN.
Sales et al. (2015) also consider the possibility of the northern source containing an embedded AGN, fitting the m SED with a model that includes an AGN torus component. The fit suggests the presence of an AGN with bolometric luminosity erg s-1, though the spectrum is also consistent with shocks ( km s-1). This bolometric luminosity would imply a fraction erg s-1, much larger than the erg s-1 detected in the Chandra data.
The southern source does not have a clear centre in X-rays or MIR and FIR, and so the centre for the radial profile is determined using the brightest region in the optical HST image. Because the source is clearly elongated, annuli centered on the eastern edge will obviously end up including photons from the northern source, and so to avoid interference, it is removed in the computation of radial profiles. This component meets our AGN selection criterion, though the Appendix B image shows that no strong hard X-ray peak is coming from the nucleus of the source; and the origin of the hard counts is concentrated in two point-sources at the west of the nucleus. Therefore, we do not classify this source as an AGN.
[68] IRAS F161640746: This source meets two of our AGN selection criteria, the and the [Ne v] line, and is also classified as an optical Seyfert 2 in Yuan et al. (2010). The X-ray source is elongated in the soft band, in the direction perpendicular to the disk of the galaxy, which could be interpreted as an outflow. There is also a secondary point source ” from the nucleus, both in soft and hard band, without any obvious overlap with a star-forming knot. With an associated X-ray luminosity in the keV range of erg s-1, it could be classified as a ULX.
[69] IC 4686/7: This source is part of a triple merger system, formed by IC 4687 at north, closely interacting with the central galaxy, IC 4686, at ’, and IC 4689 ’ south of IC 4686 (West 1976). All three of these galaxies contribute in more than 10% to the IRAS flux (Chu et al. 2017), and are therefore analyzed in this work.
[71] NGC 2623: With a spectrum clearly raising toward higher energies, giving a hardness ratio of , and also meeting the [Ne v] line criterion, this source is classified as an AGN. This source has been classified as an AGN previously in radio (Lonsdale et al. 1993) and X-rays (Maiolino et al. 2003).
Optical HST images show extended tidal tails, approximately kpc in length, with a southern region rich in bright star clusters (Evans et al. 2008), though no X-ray emission is detected with Chandra in the region.
[72] IC 5298: This source is a clear absorbed AGN, seen both in the Chandra spectrum presented in this work, and through XMM-Newton data analysis. Using data from both telescopes, when a photon index of 1.8 is assumed, a column density of is obtained. There is a hint of a line at 6.4 keV in the Chandra data, with significance lower than 1. The presence of the line can be confirmed with a significance of when checking XMM-Newton EPIC data, with a fit that is also consistent with the derived absorbing column density. The AGN diagnostics is also confirmed through the presence of the [Ne v] line, and the optical S2 classification (Veilleux et al. 1995).
[73] IRAS 20351+2521: This galaxy shows strong central emission in X-rays, originating in the nucleus, with extended emission and point-sources along the spiral arms, tracing star-forming knots.
[75] NGC 6090: This closely interacting system is completely unresolved in both Herschel and MIPS data. Therefore, we resort to the analysis performed by Hattori et al. (2004) to derive the contribution of each component to the IRAS flux, listed in Table 4.
The north-eastern source shows hard-band diffuse emission corresponding to the optical central region of the galaxy, and a peak ” north of the centre. It corresponds to a particularly bright region, both in optical and infrared, on one of the spiral arms.
The sources are interacting so closely that the radial profiles interfere with each other past ” from each nucleus, and have therefore been limited to this radius.
[79] NGC 5256: This closely interacting system is surrounded by diffuse soft-band emission in X-rays, part of which extends toward the northern direction, following a blue tidal stream seen in optical images. Between the two sources, a slightly curved excess is visible, which can be interpreted as a shock between colliding winds from both galaxies (see Mazzarella et al. 2012). This excess is the reason the radial profile in Appendix B for the NE source shows an increase of soft-band surface brightness with distance at 56”.
This source has been detected in the [Ne v] line at kpc scales, meeting our AGN selection criteria. However, due to the close proximity of both nuclei, it is not possible to know which (or if both) is responsible for this emission. Both optical classifications used in this work mark the NE source as a Seyfert 2, while leaving the SW source as LINER or composite. However, Mazzarella et al. (2012) have the opposite optical classification for the sources: NE as LINER and SW as S2.
Looking at the X-ray spectra, the NE source can be best fitted with an absorbed AGN model, fixing a spectral index of 1.8 and obtaining a column density of cm-2, which is interpreted as a mildly absorbed AGN.
The SW source shows an excess that can be fitted as an iron 6.4 keV line with a confidence of , which meets one of our X-ray AGN selection criteria.
As mentioned by Mazzarella et al. (2012), XMM-Newton EPIC data only marginally resolves the two sources, and the spectrum is presented for the whole system. However, given the spectra resolved by Chandra, the iron line seen in the EPIC data is most likely originating in the south-western source. Their combined analysis also results in a Compton-Thick classification of the south-western source.
[80] IRAS F03359+1523: Only one of the two sources present in this system is observed in X-rays, the eastern source, with an elongated morphology that corresponds to the length of the edge-on disk in the optical data. The sources are unresolved in the Herschel data, and only one source is visible in the MIPS data, which is centred at the position of the eastern one. It is not possible to affirm if this is due to lack of resolution, or if the western source has no contribution to the MIPS flux. However, observing the IRAC images from channel 1 through 4 (at 3.6, 4.5 ,5.8 and 8.0 ), it is possible to see that the eastern source clearly dominates and the western source fades with increasing wavelength. Also, Goldader et al. (1997) mention that only one (believed to be the eastern source) is prominent at radio wavelengths. This, together with the complete lack of X-ray emission originated in this companion source, leads us to believe that the western galaxy is not contributing to the IRAS flux.
There is another source, prominent in radio wavelengths, ’ to the south of IRAS F03359+1523. Clemens et al. (2008) use NVSS radio data to extrapolate that this nearby galaxy could be responsible for about % of the IRAS flux. However, images at 8 and 24 microns show a weak source that fades completely at 70 micron, leading us to believe that its contribution to the far-infrared luminosity is most likely negligible.
[81] ESO 550IG025: Both sources in this system, with a separation of ’, contribute to the IRAS flux. The southern source has a rather flat spectrum, partly due to the contribution of the hard X-ray peak placed at about ” west of the nucleus. This source cannot be easily interpreted as the X-ray counterpart to any star-forming regions in the galaxy. If it is associated to this galaxy, its X-ray luminosity in the keV range is of erg s-1, implying it could be classified as a ULX.
[82] NGC 0034: This source, optically classified as a Seyfert 2 (e.g. Veilleux et al. 1999; Yuan et al. 2010), has an X-ray spectrum that shows a hard band excess. Fitting an absorbed AGN with a fixed photon index of 1.8 gives an absorbing column density of cm-2. Previous analyses of XMM-Newton data confirm the presence of an AGN, be it through marginal detection of the Fe K line or modeling of an absorption or reflection component (e.g. Shu et al. 2007; Brightman & Nandra 2011).
Ricci et al. (2017) use joint data from Chandra, XMM-Newton and NuSTAR and find a clear Fe K feature at keV, and their spectral analysis shows a heavily obscured AGN with a column density of cm-2. Their results certainly confirm the presence of the AGN, and their derived column density differs from the one derived with only Chandra, most likely due to the latter’s much lower sensitivity at high energies.
[83] MCG+1202001: We consider this system to be composed of three individual sources: a northern component and a main pair, separated by ’. The western source in the pair is considered an individual galaxy in close interaction with the eastern source, though there is also the possibility of it being an extended star-forming region. Given the fact that we see an X-ray peak at its centre, and its X-ray luminosities of erg s-1 and erg s-1 are comparable to those of the eastern galaxy, we are inclined to treat this whole system as a triple.
The northern source does not contribute to the IRAS flux (Díaz-Santos et al. 2010), as specified in Table 4, and therefore it is not analyzed. It is detected with Chandra, with cts in the full keV range.
[85] IRAS F171381017: This source has a rather flat spectrum in X-rays, with flux slightly increasing towards higher energies. It meets the criterion for AGN selection, though no [Ne v] line is observed. Fitting with an absorbed AGN model, fixing a spectral index of 1.8, a low column density of cm-2 is obtained.
Morphologically, Chandra data shows a soft X-ray deficit at the optical centre of the galaxy, which could be caused by absorption. The hard X-ray image does not show a clear peak of emission, but a rather homogeneous flux around a larger circular region. X-ray contours on the HST image show very prominent dust lanes close to the nucleus of the galaxy, to which the obtained column density could belong. These dust lanes are most likely absorbing an important part of the soft-band X-ray emission, and could be responsible for the hardness of the spectrum. Given all these facts, and the clear lack of observation of a hard-band peak in the nucleus, we opt not to classify this source as an AGN.
Ricci et al. (2017) fit a combined Chandra and NuSTAR spectrum with a simple power-law model, obtaining a photon index of , harder than the typical X-ray emission expected of a star-forming region, but still consistent with this hypothesis.
The hard-band X-ray luminosity of erg s-1 we derive is high, but not incompatible with being originated by a strong starburst, as this source falls within the uncertainties of the correlation derived by Ranalli et al. (2003).
[95] ESO 440IG058: Both galaxies, with an angular separation of ’, contribute to the IRAS flux in this source; though the southern component dominates at almost % (Díaz-Santos et al. 2010). Soft X-ray emission from the southern component is extended, most likely an outflow with its origin in a starburst wind.
[100] NGC 7130: This galaxy shows clear extended emission in soft X-rays around a strong peak that follows the disk of the face-on optical galaxy, tracing the spiral arms. The spectrum shows a hard excess due to absorption and an iron 6.4 keV line at high energies, which could be due to absorption in the soft band, or due to reflection. A reflection component fitting, using a pexrav model (Magdziarz & Zdziarski 1995) results in an iron line with an equivalent width of keV, which is too low for a reflection-originated line. Therefore, our data favors an absorption model; which, when imposing a photon index of 1.8, results in a column density of cm-2 and an iron line equivalent width of 0.8 keV; detected with a significance of .
Based only on the Chandra data, we find it difficult to distinguish between this scenario and a Compton-Thick source with an imposed photon index of , as modeled by Levenson et al. (2005). Ricci et al. (2017) confirm the presence of a Compton-Thick AGN using a combined analysis with NuSTAR data.
[104] NGC 7771: This galaxy is part of an interacting quartet of galaxies, along with close companion NGC 7770 at an angular distance of ’, NGC 7771A at ’ and NGC 7769 at ’ (e.g. Yeghiazaryan et al. 2016).
About 90% of the IRAS flux originates in NGC 7771, with NGC 7770 being responsible for the remaining % and NGC 7769 being resolved as a separate source by IRAS. NGC 7771A is faint in the infrared, remaining undetected at 8 m and above. There is also no detection for this small component in the Chandra data.
Of the many point sources seen along the disk of NGC 7771, Luangtip et al. (2015) classify as ULXs.
[105] NGC 7592: This source is a closely interacting triple system, formed by two main infrared and X-ray sources (East and West) and a smaller, southern source. This third source, seen in the optical SDSS images, is undetected in X-rays, and also does not contribute to the IRAS flux.
There is unresolved detection of the [Ne v] line for this triple source that meets our AGN selection criterion. However, as the western source is classified as an optical Seyfert 2, it is likely that it is the origin of the infrared line. The spectrum of the western source shows an excess between keV, originating in the nucleus, that can be fitted as a Gaussian line with an energy of keV. The significance of this line is at the level, and thus we do not use this hint as any selection criterion; though given the uncertainties, a 6.4 keV line cannot be ruled out completely, specially when combined with the continuum.
The western source presents very compact X-ray emission, as derived from its radial profile, compared to its extended infrared emission (as plotted in Fig. 12).
[106] NGC 6286: This source is interacting with NGC 6285, ’ to the northwest, showing very extended tidal disruption features. Both sources contribute to the IRAS flux (Chu et al. 2017).
The X-ray spectrum of NGC 6286 shows hard excess emission above 5 keV. With less than 20 cts in the keV range, the excess is difficult to fit as an absorbed AGN using only Chandra data. MIR studies find possible hints of an AGN presence (e.g. Vega et al. 2008; Dudik et al. 2009), which are confirmed by hard X-ray NuSTAR observations. Ricci et al. (2016) find compelling evidence of a Compton-thick, low-luminosity AGN ( cm-2). We thus classify this source as an AGN.
This galaxy shows a very extended soft X-ray emission, spreading perpendicular to the optical edge-on disk up to a distance of kpc, depending on direction. Presence of a super-wind outflow generated by a strong starburst was already suggested by Shalyapina et al. (2004) through detection of an increase of ratios; and the presence of an emission nebula extending up to kpc from the galactic plane.
[107] NGC 4922: This system contains two galaxies, separated by distance of ’, with the northern one being brighter in both X-rays and infrared (Díaz-Santos et al. 2010) . The southern source contributes % of the IRAS flux, and therefore its analysis is not included in this work. With only cts, all in the keV range, it is also a weak X-ray source. There is also another source (2MASX J13012200+2920231) ’ to the north, which is undetected at 8 m and above, and most likely does not contribute to the IRAS flux.
The northern source is selected as an AGN through the presence of the [Ne v] line and the pair (unresolved) is also classified as a Seyfert 2 in Yuan et al. (2010). Our X-ray analysis also classifies it as an absorbed AGN, with a column density of cm-2 when fixing the photon index to 1.8. There is a hint of the presence of an iron 6.4 keV line, though only at a significance of about .
Ricci et al. (2017) analyse NuSTAR observations and conclude, based on their similar Chandra results, that the source detected at high energies must correspond to NGC 4922 (N), given the companion’s non-detection in the keV range. They detect a prominent Fe K line at keV, and find that the source is actually Compton-thick, with cm-2; which is more than one order of magnitude higher than our best Chandra fit.
[110] NGC 3110: This source is in interaction with nearby galaxy MCG0126013 at its south-west, separated ’, which is not detected in X-rays in the Chandra data. Both sources are contributing to the IRAS flux, though % of the infrared emission has its origin in NGC 3110 (Díaz-Santos et al. 2010). The companion galaxy is not analyzed due to lack of significant X-ray emission and low infrared luminosity, though the IRAS flux associated to NGC 3110 is corrected for the pair’s contribution.
This source has diffuse soft X-ray emission along the spiral arms, which also contain strong hard X-ray peaks that are most likely associated with star-forming knots. The nucleus of the galaxy, however, does not show peaked emission in the keV band. Due to this particular morphology, HST optical and IRAC channel 1 images are used to centre the derived radial profiles.
[114] NGC 0232: This source is paired with NGC 0235, at a distance of ’, which is a known Seyfert 2 galaxy. Despite having previously been classified as non-interacting, a faint tidal bridge has been observed connecting the two galaxies (Dopita et al. 2002). NGC 0235 has two nuclei, and is classified as a minor interaction (Larson et al. 2016). However, as this companion galaxy is resolved by IRAS (Surace et al. 2004) as an individual source, we do not include it in our analysis.
[117] MCG+0818013: This galaxy is paired with MCG+0818012 at ’ to its west. MCG+0818013 is clearly dominant in the infrared and the origin of the IRAS flux (Chu et al. 2017). This component’s X-ray emission originates from two point sources close to the nucleus of the galaxy, one of which is bright in soft-band X-rays, and could be associated to a star-forming region, and the other in hard-band X-rays. We consider this hard-band peak to originate from the nucleus of the galaxy, and use it to center the radial profiles.
MCG+0818013 is undetected in X-rays and therefore not included in the analysis.
[120] CGCG 049057: This source, despite only having a total of cts in the keV band of the available Chandra observation, has a hardness ratio of , and so meets one of the X-ray AGN selection criteria. The spectrum of the source shows, despite the large error bars, a tendency to rising flux toward higher energies. The X-ray image in the keV band shows about cts originating from the innermost region of the source, and thus we classify it as an AGN.
Baan & Klöckner (2006) also classified it as an AGN based on radio observations. Though optical and MIR observations (e.g. Veilleux et al. 1995; Stierwalt et al. 2013; Meléndez et al. 2014) classify it as a starburst, Herschel spectroscopic data analysed by Falstad et al. (2015) detect very high column densities in the nucleus ( cm-2), meaning that a Compton-thick AGN could be present. This would explain the X-ray weakness we observe, which was already reported by Lehmer et al. (2010).
[121] NGC 1068: This well-known AGN meets our selection criteria in all bands: Seyfert 2 in both of the used optical classifications, presence of the [Ne v] line in infrared and clear detection of the Fe K line at 6.4 keV in X-rays with a significance of . Note that the equivalent width of the 6.2 m PAH feature is not presented in Stierwalt et al. (2013) due to saturation of the spectrograph. Howell et al. (2007) analyze PAH and warm dust emission in NGC 1068 in detail. Their 6.2 m images are saturated within the inner pc, though they measure an equivalent width of the PAH feature right outside the region of saturation of . This is suggestive that the value of of the equivalent width would drop below 0.1 further in.
Diffuse X-ray emission is clearly observed in this source, following the optical spiral arms and star-forming regions. In order to outline all features, X-ray contours to a low enough level were necessary, which result also in the clear contours around the saturated feature that diagonally crosses the image.
Individual point sources can be seen spreading along the disk of the galaxy in both the soft and hard bands, which most likely correspond to X-ray binaries. We note that we have not marked these as hard X-ray peaks in Appendix B images, as they are numerous and clearly not originating from a region near the nucleus of the galaxy. None of these point sources were removed in order to derive radial profiles. Luangtip et al. (2015) classify 3 of them as ULXs.
[123] UGC 02238: This source presents a rather diffuse emission, showing three main X-ray peaks near the nucleus, only one of which (the westernmost) is also peaked in the keV band. However, as shown by the contours over the IRAC channel 1 image, this region is outside of the nucleus of the galaxy. We consider this emission to most likely originate from different intense starburst regions, given how there is no clear hard-band central peak. Optical and infrared imaging data show a highly disturbed disk and tidal tails, and classify this galaxy as a post-merger stage (e.g. Smith et al. 1996; Larson et al. 2016), which is consistent with the described X-ray morphology.
We fit the overall X-ray keV emission of this galaxy with a single power law. Attempts to fit a one or two component mekal model produce unsatisfactory results. Two strong point sources can be seen in the keV band image presented in Appendix B which, if associated with the galaxy, would be classified as ULXs. The point-source at the easternmost edge of the disk of the galaxy would have an estimated luminosity of erg s-1, and the strong point-source right south of the nucleus of the galaxy would be emitting erg s-1; in the keV range. Note, however, that due to the very low number of counts these are very rough estimations.
[127] MCG0334064: This source has a north-eastern companion at ’, MCG0334063, which is responsible for about % of the IRAS flux (Chu et al. 2017). The analysis of this companion source is not included in this work because it is undetected in the Chandra data. A correction to the IR luminosity for the contribution of MCG0234063 has been considered for this source.
MCG-03-34-064 presents a very peaked central emission in all X-ray bands, and is a clear absorbed AGN, as seen from the spectrum. Fitting with a fixed photon index of 1.8 yields an absorbing column density of cm-2. The iron K line at 6.4 keV is detected, with a significance. With a our other X-ray AGN selection criterion is almost also met.
Ricci et al. (2017) perform a NuSTAR analysis of this source, combined with XMM-Newton EPIC data, and derive an absorbing column density of cm-2, which is compatible with our derived result within the errors. They also detect the Fe Kα line, and a Gaussian line at keV with keV, which is not detected in the Chandra data.
This source meets also the [Ne v] line and 6.2 m PAH feature AGN selection criteria, though the same cannot be said about the optical ones. Yuan et al. (2010) classify it as a star-forming galaxy and Veilleux et al. (1995, 1999) do not analyze it, although other works classify it as a Seyfert galaxy (e.g. Lipovetsky et al. 1988; Corbett et al. 2002).
[134] ESO 350IG038: This galaxy presents three main star-forming condensations (Kunth et al. 2003; Atek et al. 2008). Only two of these knots, the eastern and western, are clearly resolved as X-ray sources in the Chandra data, both presenting peaked emission in both the soft and hard bands. The region is surrounded by diffuse, soft X-ray emission. These knots, separated by ”, are analyzed together as the X-ray source corresponding to the IRAS source, and not separated as two individual galaxies, as there is no clear evidence of them being individual galaxy nuclei in a state of closely interacting merger.
[136] MCG0160022: This source is near galaxies MCG0160021 and Mrk 0399, at ’ interacting with the former (e.g. Dopita et al. 2002), connected through thin and long tidal bridges. Both nearby galaxies are undetected in the Chandra data, and are detected together as another IRAS source, resolved from MCG0160022 (Díaz-Santos et al. 2010).
This source presents diffuse soft band emission surrounding the central X-ray peak, which has its origin in an absorbed AGN. This sources meets the X-ray criterion, and spectral fitting of an absorbed power-law with a fixed photon index of 1.8 yields a an absorbing column density of cm-2.
[141] IC 0563/4: This source is a double system, composed of IC 0564 at north and IC 0563 at south, separated by ’. Both contribute similarly to the IRAS flux, and to the overall X-ray luminosity. Morphologically, both galaxies have faint emission originating in the nucleus and various point-sources spreading along the spiral disks.
IC 0563 has a hardness ratio of , which exceeds our AGN selection threshold. However, the origin of the hardness (also seen as an excess at keV in the spectrum shown in Fig. 80) is not the nucleus of the galaxy, but a point-source located north of it. If the source is associated with the galaxy, with a roughly estimated luminosity of erg s-1, it could be classified as a ULX. Interestingly, the point-source spectrum shows a hint of a line at keV, with a significance of . If this source is a ULX within the galaxy, this excess cannot be easily explained as an emission line. If this source is a background quasar, for which we are detecting a redshifted 6.4 keV iron line, a high would be necessary. If it were an object at , the X-ray spectrum would suggest that its origin is in reflected light form a Compton-thick AGN. This scenario, however, leads to an unreasonably luminous quasar.
Similarly, IC 0564 shows a spectrum with a large flux at high energies, though the errorbars are significative, which is also emitted by a northern point-source. Also with a roughly estimated luminosity of erg s-1, it could be classified as a ULX, if it is associated to the galaxy.
Both point-sources are marked with green crosses in the images shown in Appendix B.
[142] NGC 5135: This galaxy is classified as an optical Seyfert 2 (e.g. Yuan et al. 2010), and meets our infrared [Ne v] line criterion for AGN selection (Petric et al. 2011).
It shows an excess in hard X-rays, with a Fe line at 6.4 keV with a significance, which could be the result of either absorption or a reflection component. Fitting an absorbed power-law with fixed photon index of 1.8 yields an absorbing column density of cm-2, which is not large enough to produce the equivalent width of the iron line of keV obtained through the same model. Fitting a pexrav model (Magdziarz & Zdziarski 1995) with a fixed photon index of 2.0 yields a believable keV, which means our data favour a reflection dominated AGN. Suzaku observations extending up to 50 keV allow to better estimate the absorbing column density, of cm-2, classifying this source as Compton-thick and providing a good estimate of the strength of the reflection component (Singh et al. 2012).
Morphologically, this source presents a very extended soft band emission, with two central X-ray peaks, visible only when the smoothing in the image is set to 0.5” or less. The northern peak is responsible for the iron emission line, which indicates it’s associated to the nucleus of the galaxy. The southern peak is brighter in the keV band, and most likely associated with a star-formation region. From the many point-sources seen in the full band image, up to are classified as ULXs (Luangtip et al. 2015).
[144] IC 0860: With only cts, no X-ray analysis beyond the calculation of the HR and the extraction of the radial profile has been performed for this source. However, despite the low count-rate, this galaxy is classified as an AGN with a value of . The spectrum obtained also shows a rising tendency toward higher energies. However, due to the small number of counts detected, classification of this X-ray source remains ambiguous.
[147] IC 5179: This galaxy shows dim soft-band extended emission near the nucleus and many X-ray point-sources spreading along the optical disk, which most likely correspond to X-ray binaries, of which are classified as ULXs (Luangtip et al. 2015). The presence of these sources makes the radial profile seem rather irregular, especially in hard band (see Appendix B).
[148] CGCG 465012: This galaxy is paired with UGC 02894 at its north-west, at a distance of ’, which is resolved as a separate source by IRAS.
CGCG 465012 shows diffuse soft X-ray emission along its optical disk, concentrated in the nucleus and in a north-eastern region ” from it, most likely a star-forming region. The hard-band emission is very dim and non-peaked.
[157] MCG0233098/9: This system is composed of two very closely interacting galaxies (separated by ”), with the western one contributing % of the IRAS flux (Díaz-Santos et al. 2010). Two nearby galaxies, at ’ north-west and ’ south-east, most likely do not contribute to the IRAS flux, as they are not detected in MIR wavelengths.
Terashima et al. (2015), using XMM-Newton EPIC-PN data, report the detection of a hint of an iron line at 6.97 keV. The Chandra spectrum of MCG0233098 shows a slight increase at keV, which is not significant enough to claim the presence of an excess.
[163] NGC 4418: This galaxy is paired with MCG+0032013 at its south-east, at a distance of ’. Using infrared photometry, it can be determined that more than 99% of the IRAS flux originates in NGC 4418 (Chu et al. 2017), therefore this nearby galaxy is not considered in the analysis. It also meets our PAH EW selection criteria (Stierwalt et al. 2013), and thus we classify it as AGN, despite the current debate regarding its nature.
Only two central peaks can be seen in the Chandra data; the eastern one is brighter in the hard band, and thus is used to center the radial profiles. However, this source is known as a possible candidate for containing a heavily obscured AGN, and it is possible that we are resolving the non-absorbed emission at both sides of the nucleus. While some studies in radio and infrared seemed to favor a compact starburst as a central source (e.g. Roussel et al. 2003; Lahuis et al. 2007), it is at least clear that the nucleus is extremely Compton-thick, and could host either an AGN, or a starburst of obscuration as extreme as the one in Arp 220 (see Costagliola et al. 2013, 2015, and references therein).
[169] ESO 343IG013: Both galaxies in this closely interacting merger, separated by only ’, contribute to the IRAS flux, with the northern component dominant in both infrared (Díaz-Santos et al. 2010) and X-rays.
The X-ray emission is diffuse in the southern source and between sources. The northern source shows a bright X-ray peak in both the soft and hard bands, which meets one of our AGN selection criteria, having . The X-ray spectrum of this component also shows an increase of flux toward higher energies.
The radial profile of the southern source has been centered using the brightest peak in optical and infrared images, which corresponds to the dimmer X-ray peak of the keV image shown in Appendix B. The northern source presents very compact X-ray emission, as derived from its radial profile, compared to its extended infrared emission (as plotted in Fig. 12).
[170] NGC 2146: This galaxy, most likely a post-merger object (Hutchings et al. 1990), shows very extended soft-band X-ray emission in the direction perpendicular to the plane of the optical disk, originating in a super-wind driven by the central starburst (see Kreckel et al. 2014). The hard-band emission is limited to the region encompassed by the galaxy disk, which presents a lack of soft-band emission. This lack is most likely a result of absorption in the plane of the galaxy. The radial profiles have been centered using the brightest peak in the NIR IRAC channel 1 image.
A detailed Chandra analysis of point sources in the galaxy, including 7 ULXs, and the extended emission can be found in Inui et al. (2005).
[174] NGC 5653: This source presents a diffuse X-ray emission along the spiral arms seen in the optical images, with a bright X-ray knot at a distance of ” from the nucleus. This knot falls on one of the spiral arms and appears very blue in optical images, also being the strongest X-ray and infrared source in the galaxy (Díaz-Santos et al. 2010). It could be argued that this source is actually a second galaxy, merging with the bigger NGC 5653. This source has been classified as a lopsided galaxy (Rudnick et al. 2000), which is usually assumed to be an indicator of weak tidal interaction. However, as we have no clear evidence of this, and do not see a central point-source in hard X-rays, we opt to consider it a particularly active star-forming region. Luangtip et al. (2015) find ULXs in this source.
The NIR IRAC channel 1 image was used to centre the radial profile, due to the difficulty of finding a clear nucleus in the X-ray data.
[178] NGC 4194: This source, commonly known as the Medusa, is the result of a merger with very particular tidal features, as seen in optical images. The X-ray morphology of the source is also particular, showing a very extended emission in soft X-rays, especially toward the north-west, most likely indicative of a strong starburst-driven wind. Luangtip et al. (2015) find ULXs in this source, while a detailed study of all X-ray point sources was performed by Kaaret & Alonso-Herrero (2008).
[179] NGC 7591: This galaxy is interacting with PGC 214933, at ’ southwest; and a dimmer galaxy lying ’ to the east is detected in HI (Kuo et al. 2008). PGC 214933 contributes % of the IRAS flux (Chu et al. 2017), and is undetected in the Chandra data.
With only cts in the keV band, no X-ray analysis beyond the calculation of the and the extraction of the radial profile has been performed for NGC 7591.
NGC 7591 is the only source in our sample that is optically classified as a Seyfert 2 galaxy (Yuan et al. 2010), while being classified as a LINER by Veilleux et al. (1999), and does not meet any of our AGN selection criteria. The contribution of an AGN component to the the bolometric luminosity of the galaxy, as estimated by (Díaz-Santos et al. 2017), is low: . With a flux estimation using CIAO’s tool srcflux, the obtained luminosity of this source in the keV band is erg s-1. This X-ray luminosity is low for an AGN, and only possible for this type of source if it’s Compton-thick. Even if we cannot rule out this possibility, we consider that a single optical classification as Seyfert 2 is not a strong enough criterion to classify this source as an AGN.
[182] NGC 0023: This source is paired with NGC 0026, at a distance of ’ (Hattori et al. 2004), which is far enough to guarantee no contribution to the IRAS flux.
This source shows central extended emission surrounding the nucleus, which is not a strongly peaked hard X-ray source. The source spectrum shows a lack of emission at keV, and a small excess at higher energies, which is not significant enough to hint toward the presence of an AGN. Luangtip et al. (2015) classify of the galaxy’s point sources as ULXs.
[188] NGC 7552: This source shows extended soft-band X-ray emission in the inner region of the galaxy, surrounded by numerous point-sources, which most likely correspond to X-ray binaries. Of these, are classified as ULXs (Luangtip et al. 2015).
[191] ESO 420G013: This source meets our infrared [Ne v] line criterion for AGN selection, and shows a slight excess at around 6.4 keV, which is not significant enough in the Chandra data to confirm the presence of an X-ray AGN. Though Yuan et al. (2010) classify is as HII dominated, other optical classifications have pointed toward a Seyfert nature previously (e.g. Maia et al. 1996)
[194] ESO 432IG006: Both galaxies in this system, separated by ’, contribute similarly to the IRAS flux, and have significant X-ray emission. Also both galaxies present signs of the presence of an absorbed AGN. Fitting such a model, with a fixed photon index of 1.8, on the north-eastern source yields an absorbing column density of cm-2; and on the south-western source it yields cm-2.
[195] NGC 1961: This source has most of its X-ray emission concentrated on the nucleus, with a few point sources spreading along the spiral arms. Another peak of emission is found in a region about ” west of the nucleus. It is unclear if this source is truly overlapping with emission regions in infrared images (IRAC channels 14, MIPS24/70), or actually has no counterpart.
The spectrum presented in Fig. 80 includes the full region, and the hard X-ray excess actually originates in this outer source. Therefore, we see no spectral traces of the presence of an AGN.
[196] NGC 7752/3: This double system is composed by NGC 7752 at south-west and NGC 7753 ’ to the north-east, the latter being the dominant source in the IRAS flux (Chu et al. 2017).
X-ray emission in the north-eastern source is point-like in the nucleus, with a few other point sources spreading along the galaxy’s spiral arms. The X-ray best spectral fit for this source is performed using a single mekal component for the full spectrum, though no fit is truly satisfactory.
The south-western source presents much more diffuse emission, with no clear central point source. The most concentrated emission, in soft band, is coming from a region just west of the infrared nucleus of the galaxy, which is the one used to centre the radial profile. This region seems to correspond to a slight increase of infrared emission in the IRAC channel 1 image, which means it is most likely a star-forming region. Using optical diagnostic diagrams (Kewley et al. 2001, 2006) this source can be classified either as an AGN or composite of AGN and starburst (Zhou et al. 2014; Pereira-Santaella et al. 2015a), though we see no X-ray signs of activity.
[198] NGC 1365: This very bright source meets all three of our X-ray AGN selection criteria, with , an absorbing column density of cm-2 when fitting an absorbed AGN model with fixed photon index of 1.8, and a 6.4 keV iron line at a significance of . This galaxy hosts a very well-known AGN, with frequent dramatic spectral variability (e.g. Risaliti et al. 2005, 2007), attributable to variations in the column density along the line of sight.
The Chandra data show bright and extended diffuse emission in soft band, spreading along the central region of the galaxy, and a strong central point source (see e.g. Wang et al. 2009). Luangtip et al. (2015) find ULXs in this galaxy. Note that we have chosen to show only the central emission in the galaxy in Appendix B, and not the open spiral arms around it, in order to better distinguish the X-ray morphology of the region of interest.
[199] NGC 3221: This source consists of, mostly, point-like sources scattering along the optical edge-on disk of the galaxy, of which are classified as ULXs (Luangtip et al. 2015). The hard-band spectrum can be fitted with a power-law of index , with the nucleus being a stronger hard X-ray source than the other point sources. Even though such a flat spectrum could be indicative of an obscured AGN, fitting an absorbed power-law with a fixed photon index of 1.8 yields an absorbing column density of only cm-2. We conclude that we cannot confirm the presence of an absorbed AGN, even though we cannot rule out the possibility either.
[201] NGC 0838: This galaxy is in a complex system. NGC 0839 is placed ’ to the south-east, and the centre of the closely interacting system formed by NGC 0833 and NGC 0835 is found at ’ to its west. IRAS resolves three of these four sources, being NGC 0833/0835 too closely interacting to derive their fluxes separately. However, because NGC 0838 is resolved, we do not include the rest of the components of the complex system in this work.
Oda et al. (2018) analyze keV NuSTAR data of this compact group. NGC 0838 is not detected above 8 keV, showing no evidence of an obscured AGN. The conclusion that NGC 0838 is a starburst-dominated galaxy is also reached in the detailed works by O’Sullivan et al. (2014); Turner et al. (2001).
This source is very bright in X-rays, and has a complex morphology of diffuse soft-band emission surrounding the nucleus, a clear example of a strong starburst wind. Among the point sources, are classified as ULXs (Luangtip et al. 2015).
Appendix B Observations
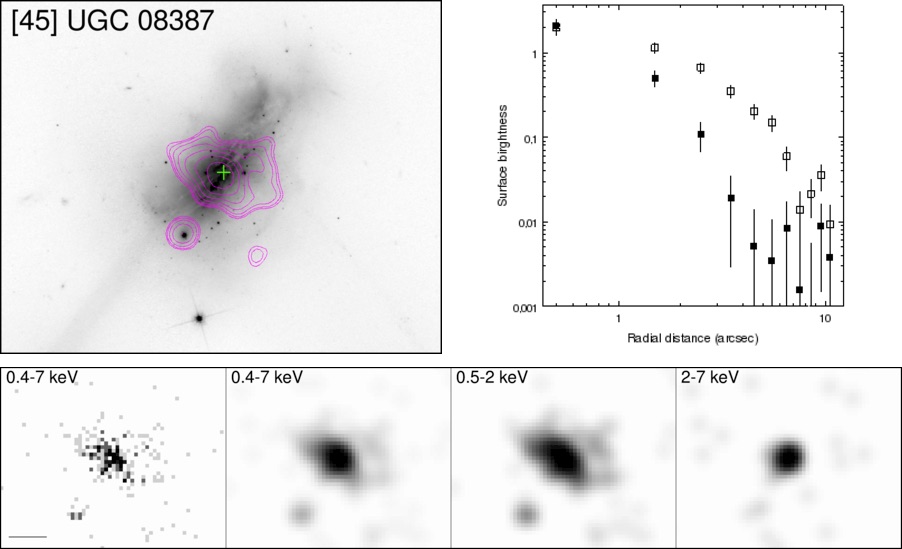
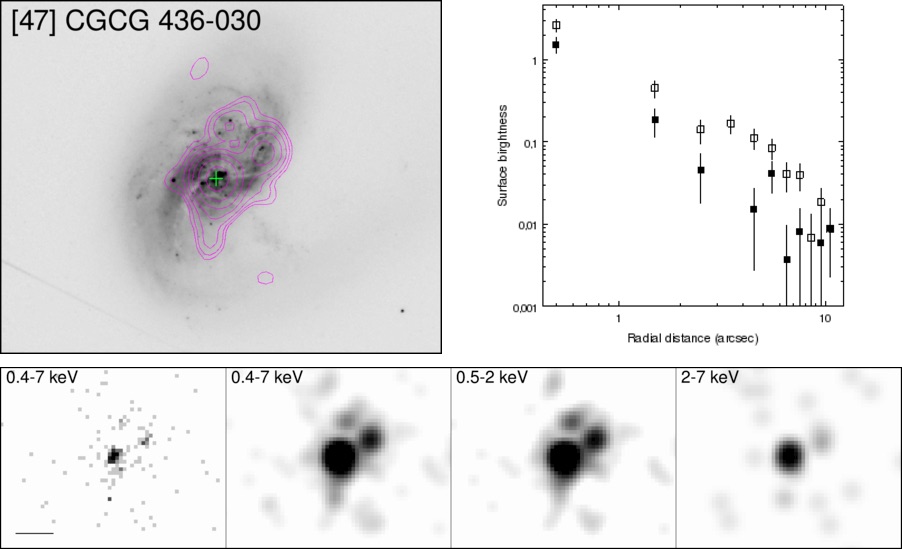
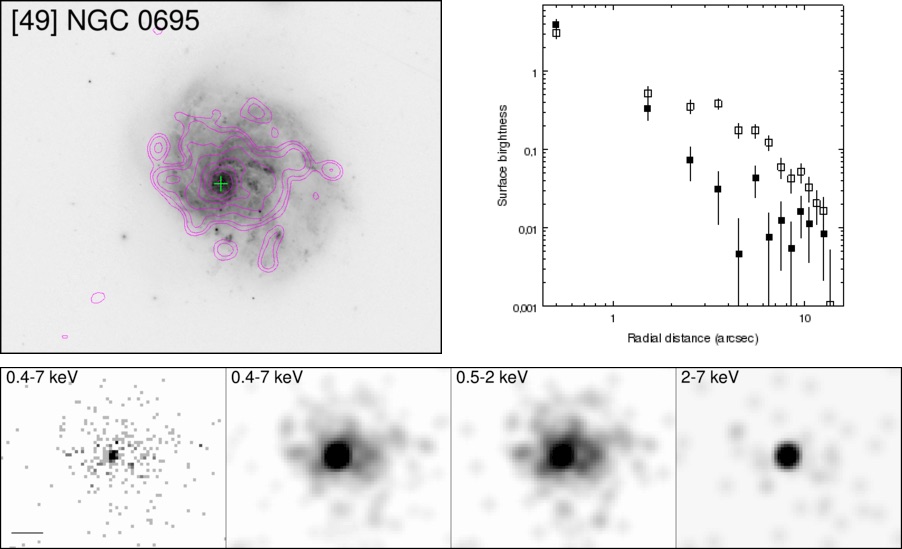
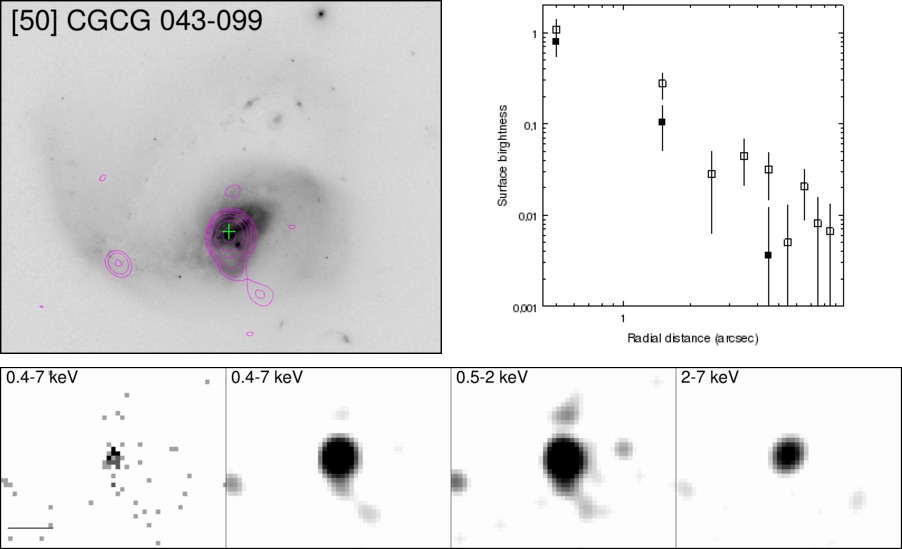
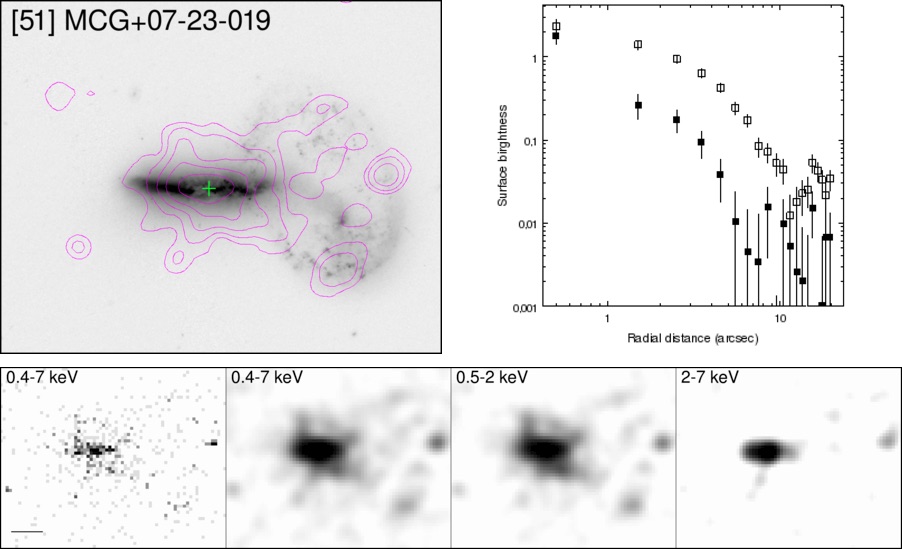
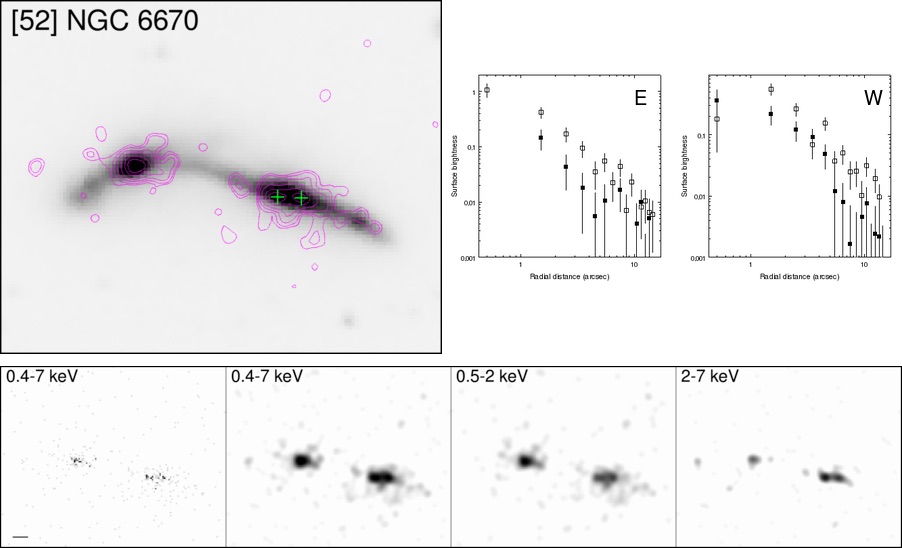
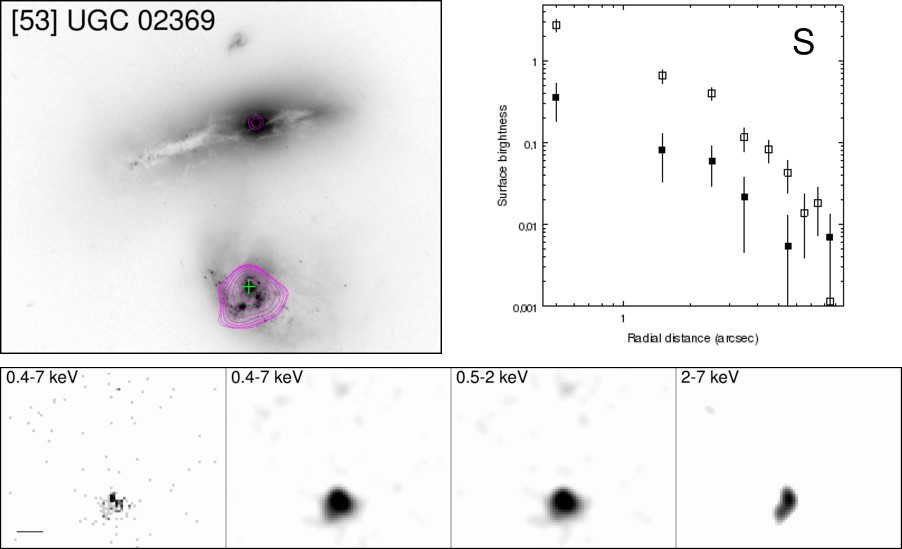
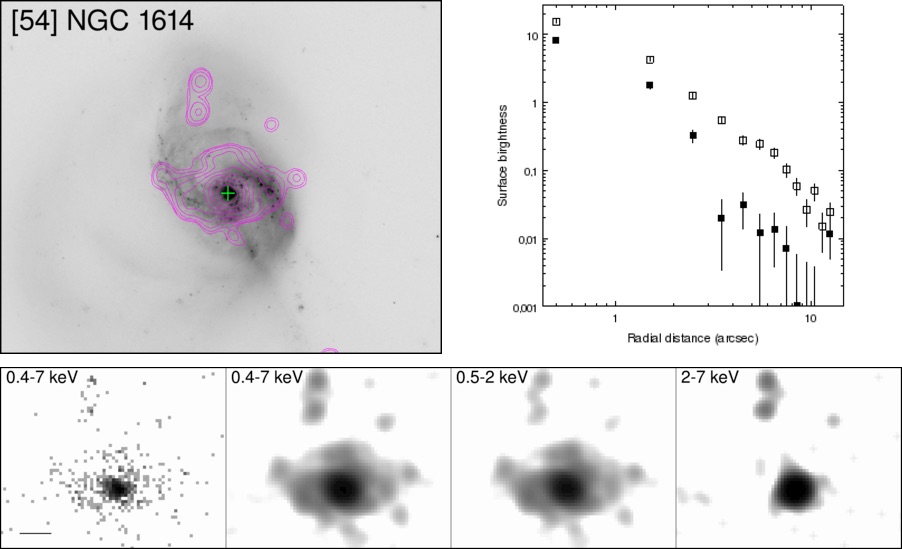
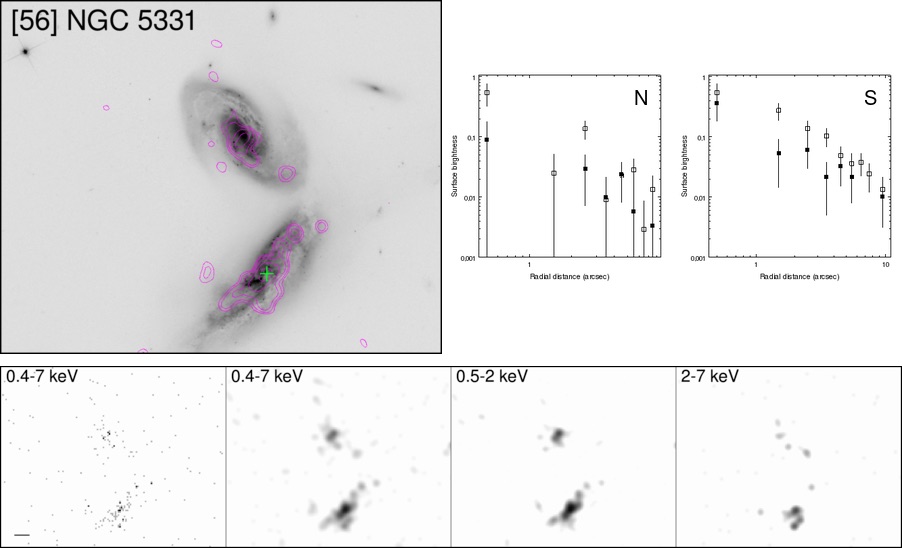
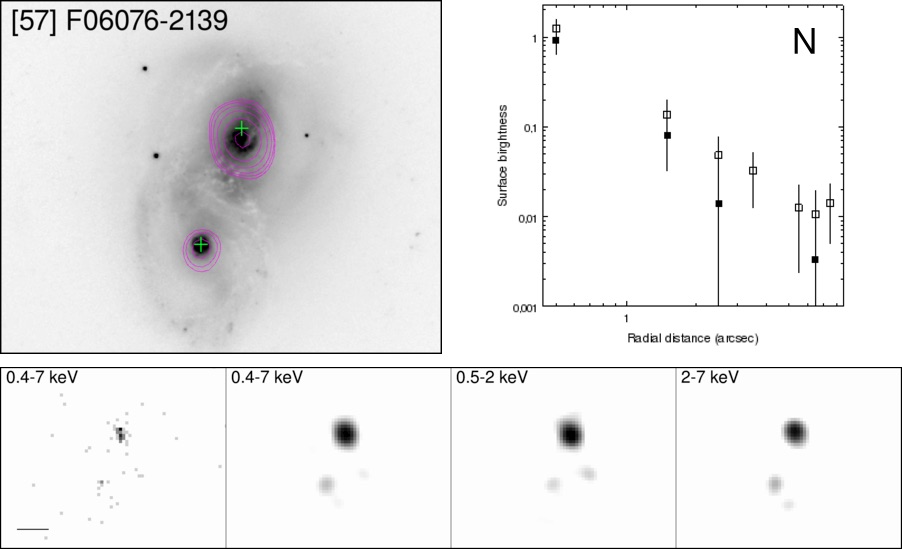
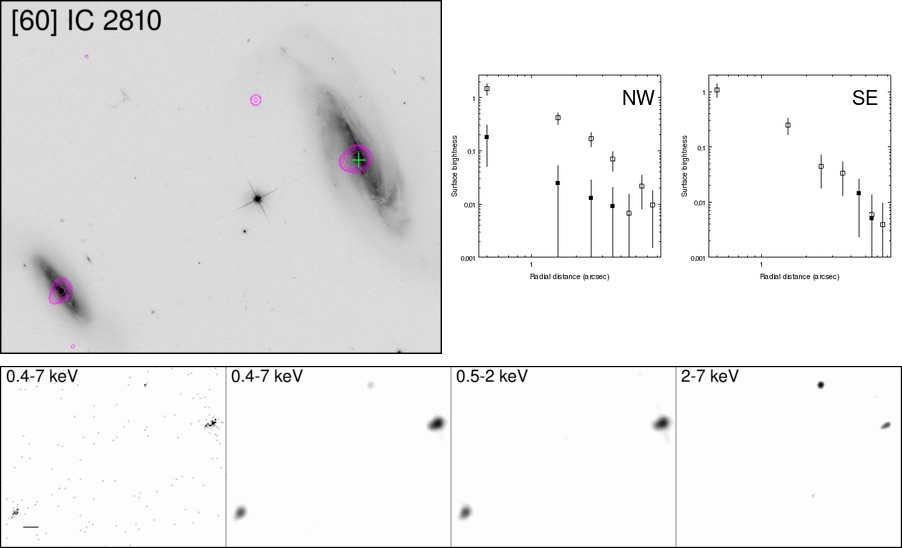
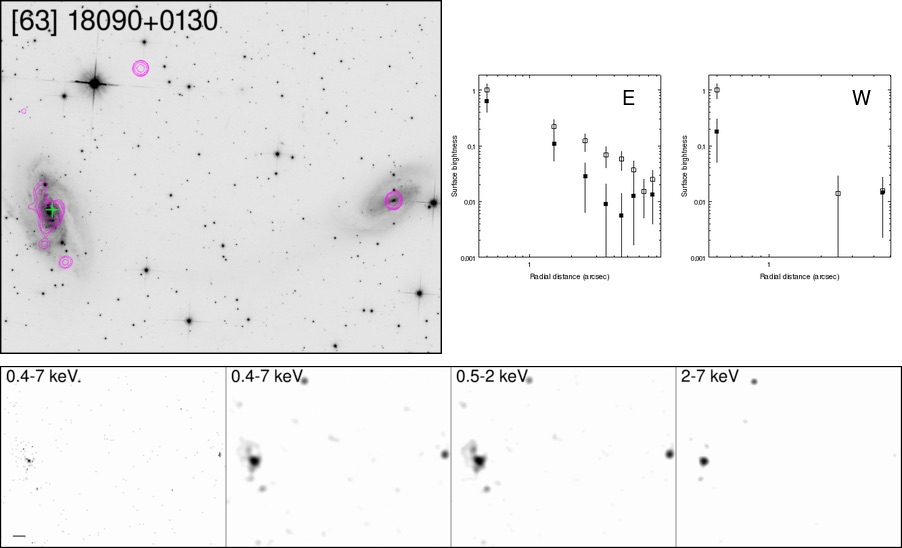
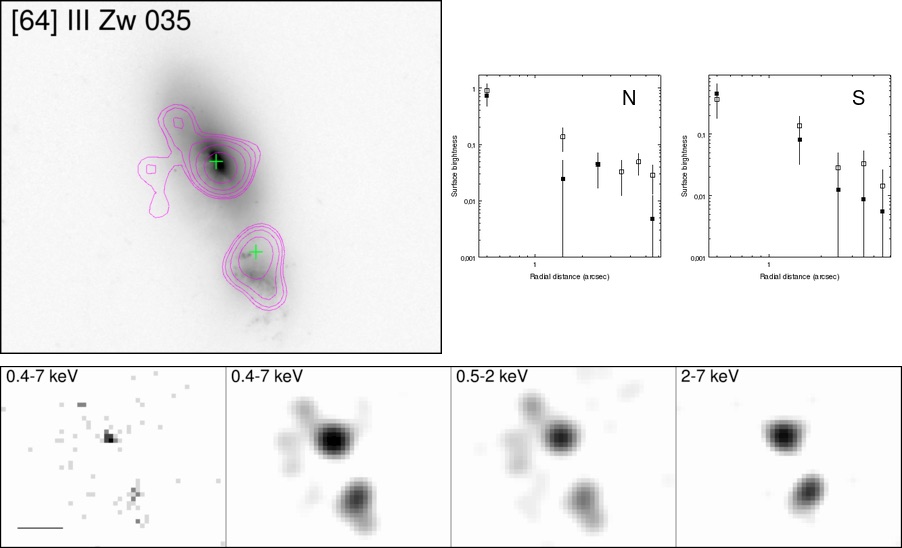
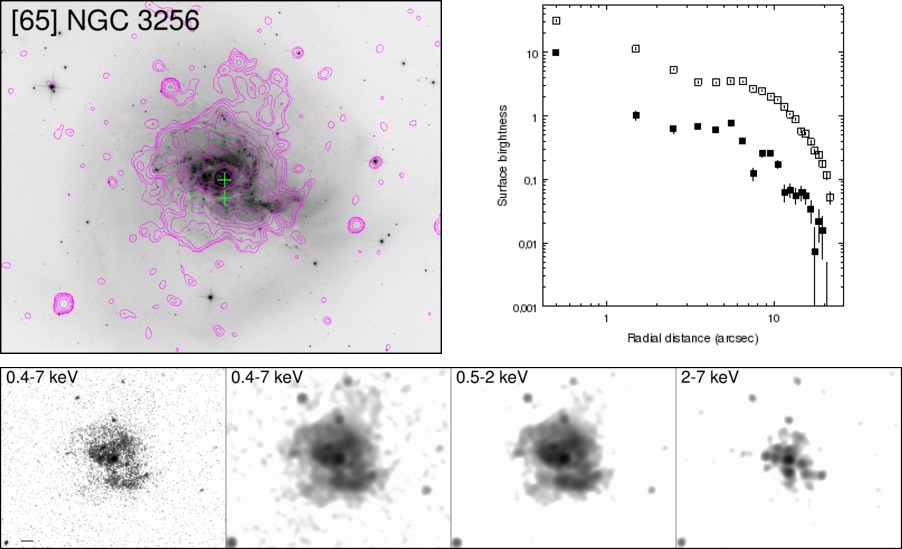
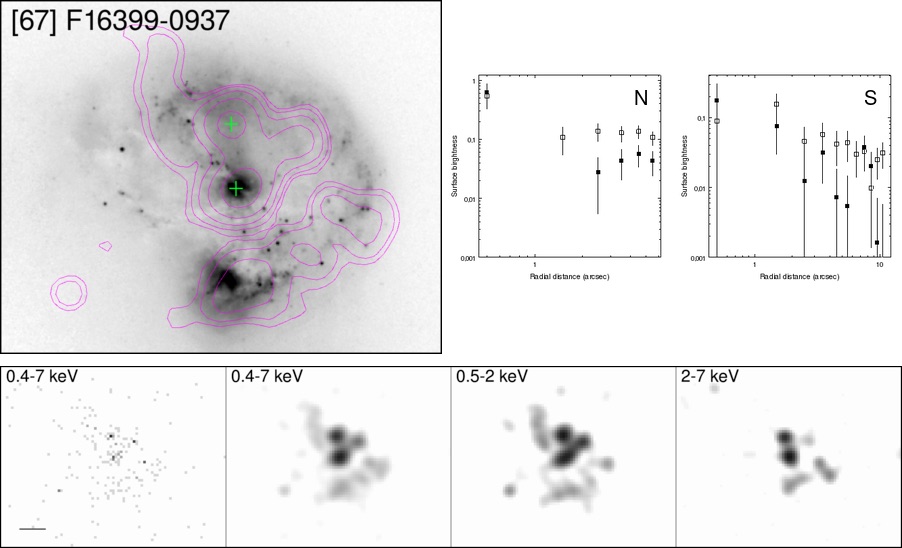
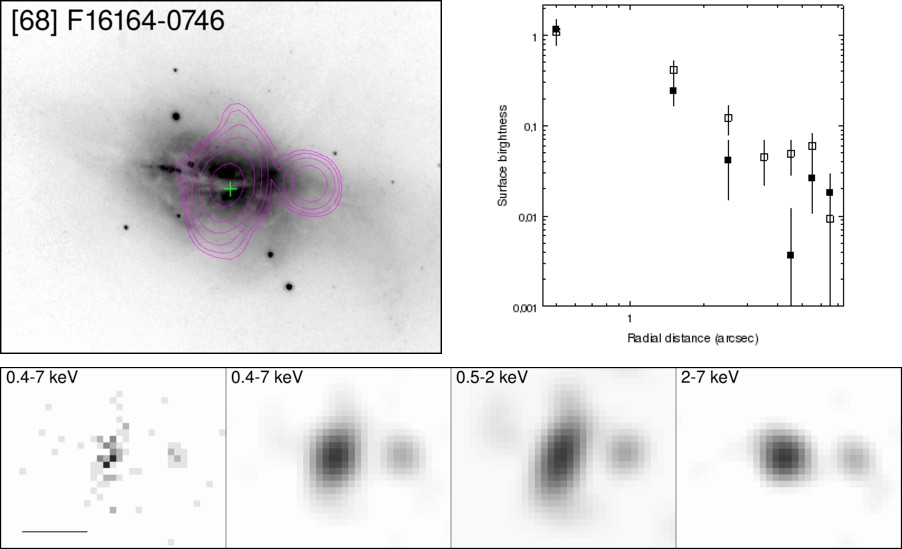
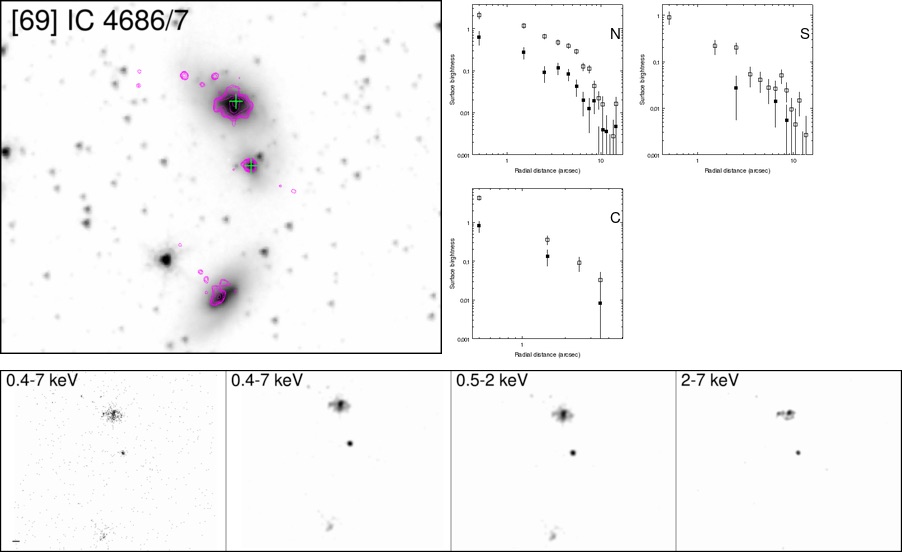
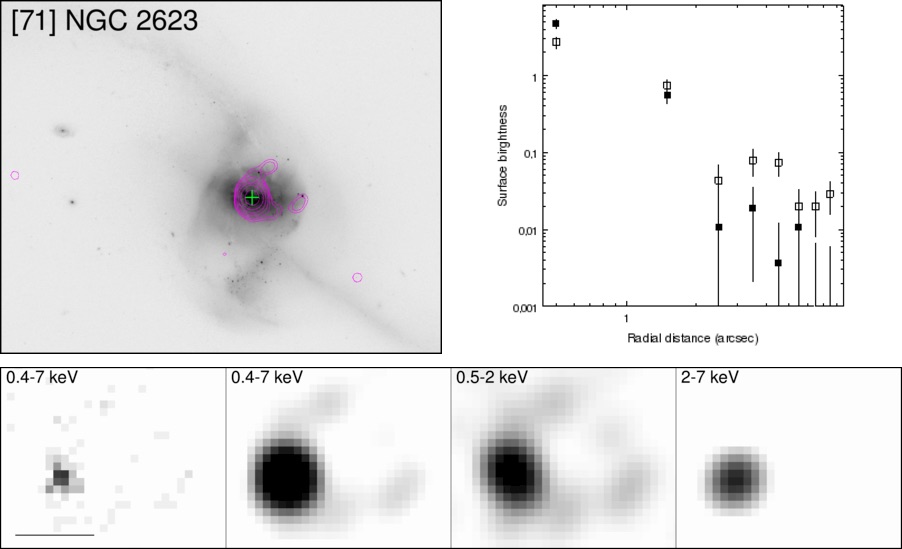
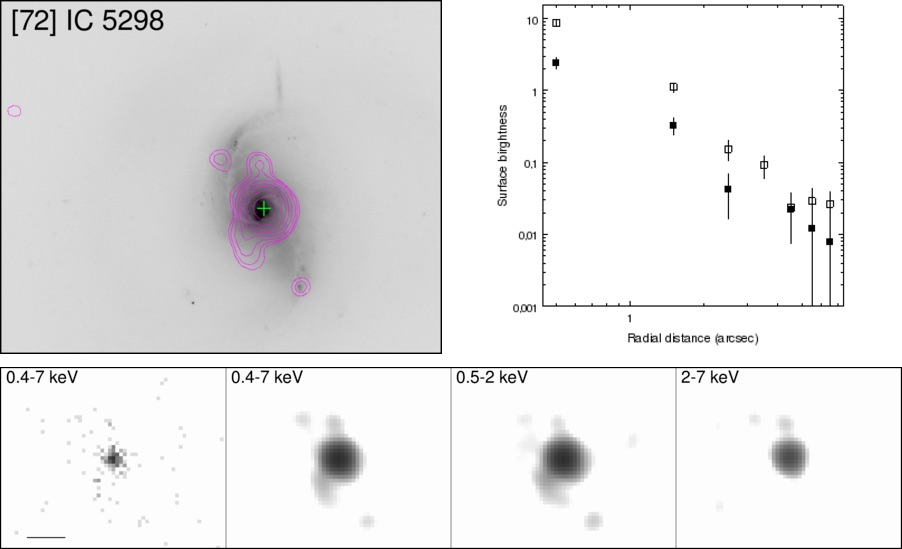
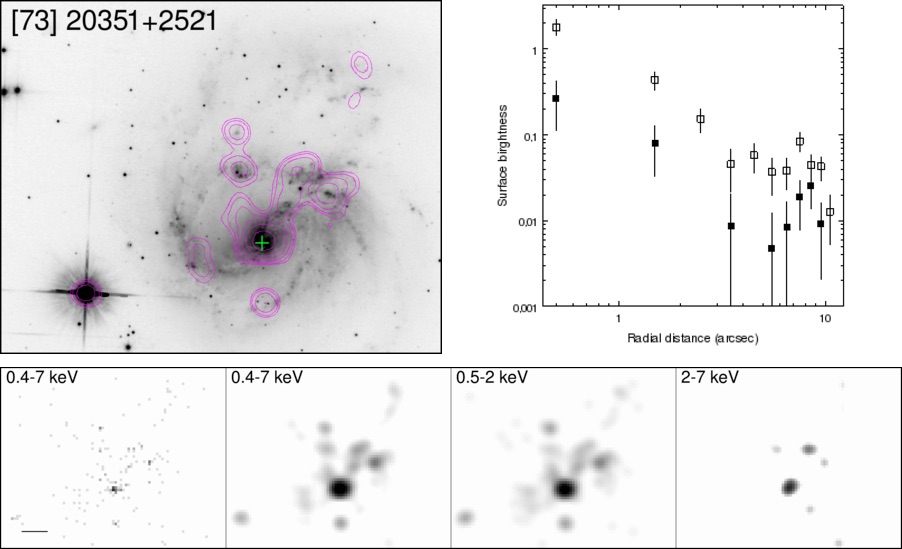
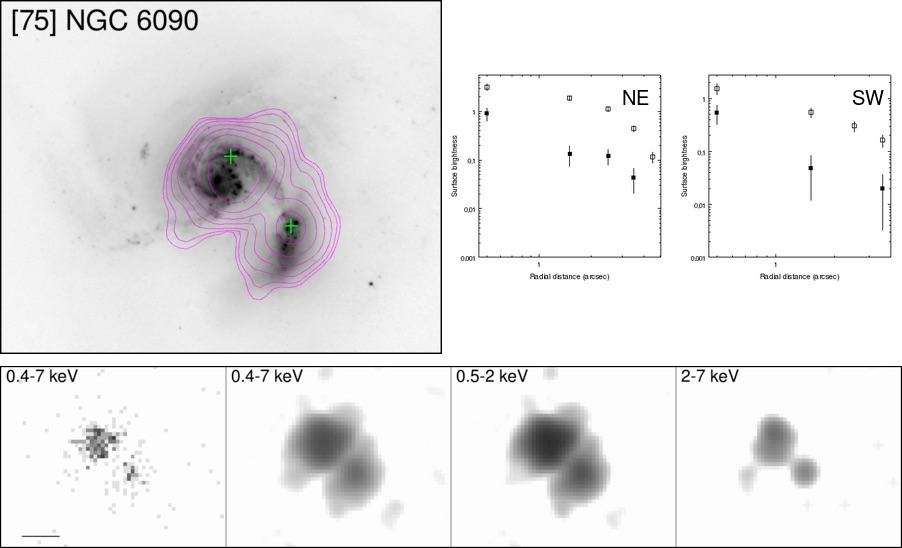
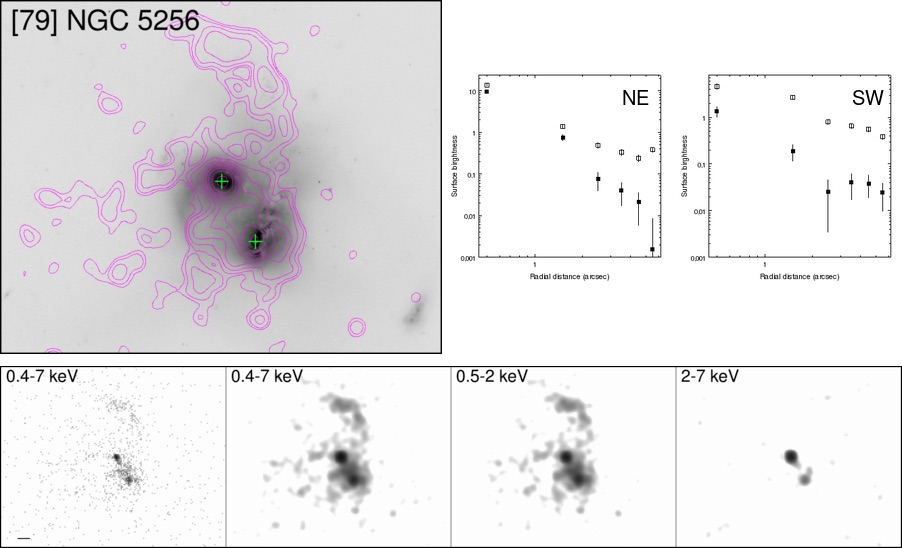
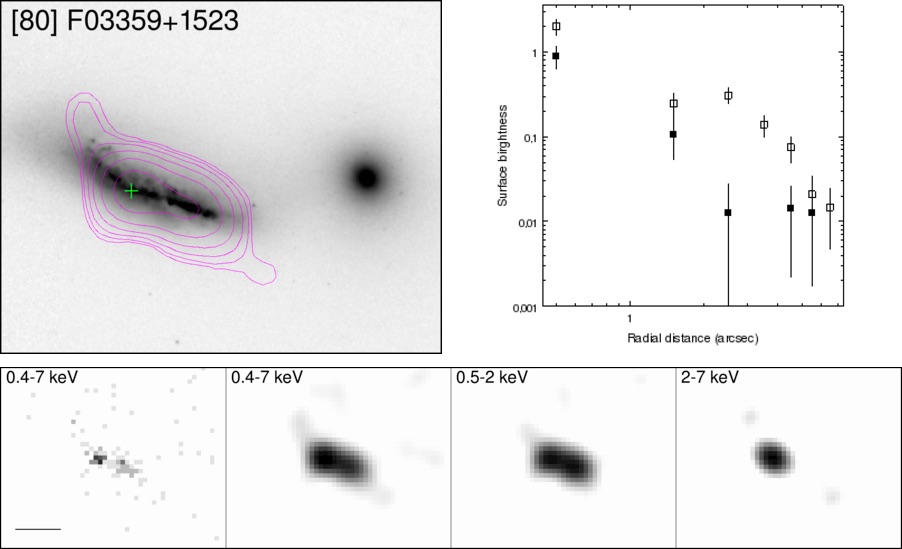
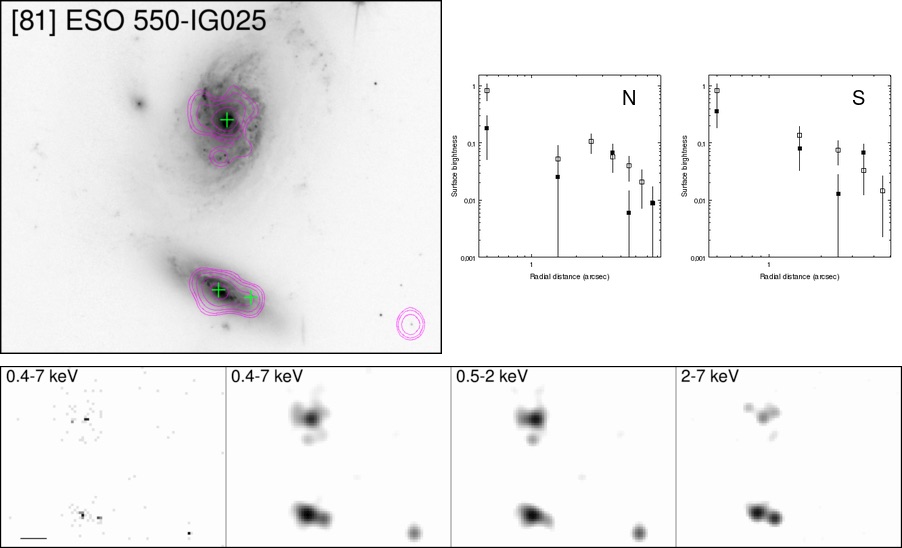
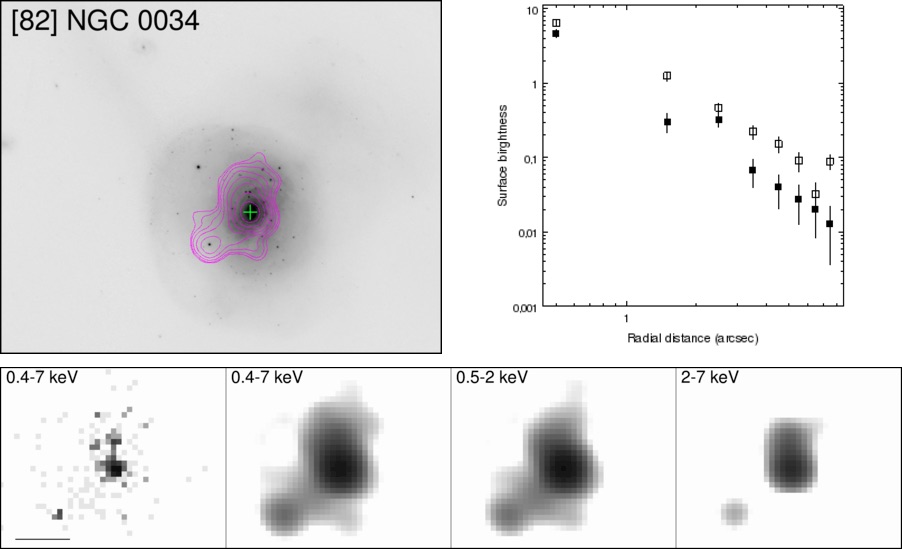
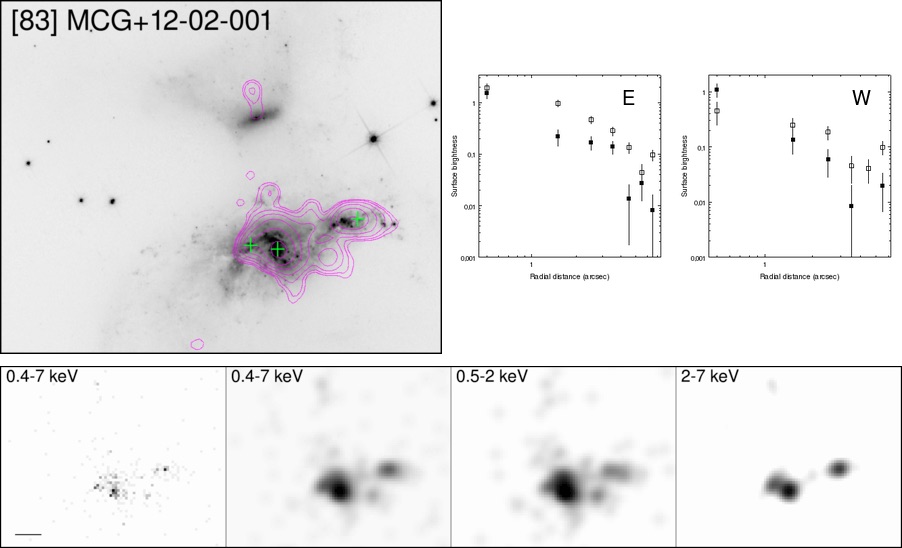
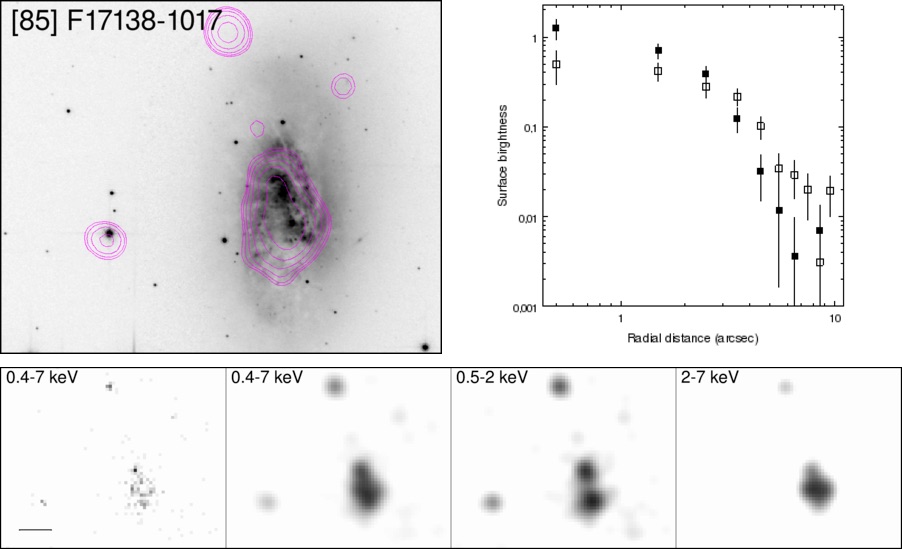
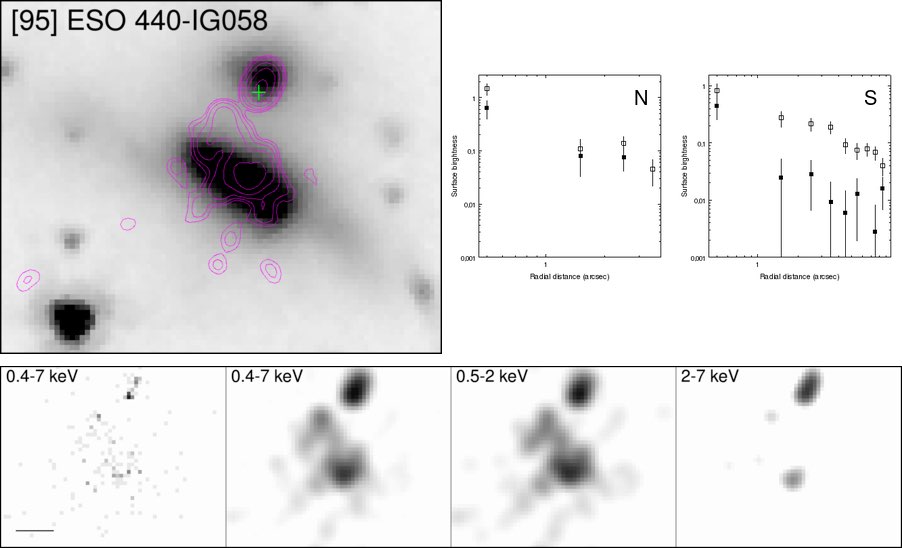
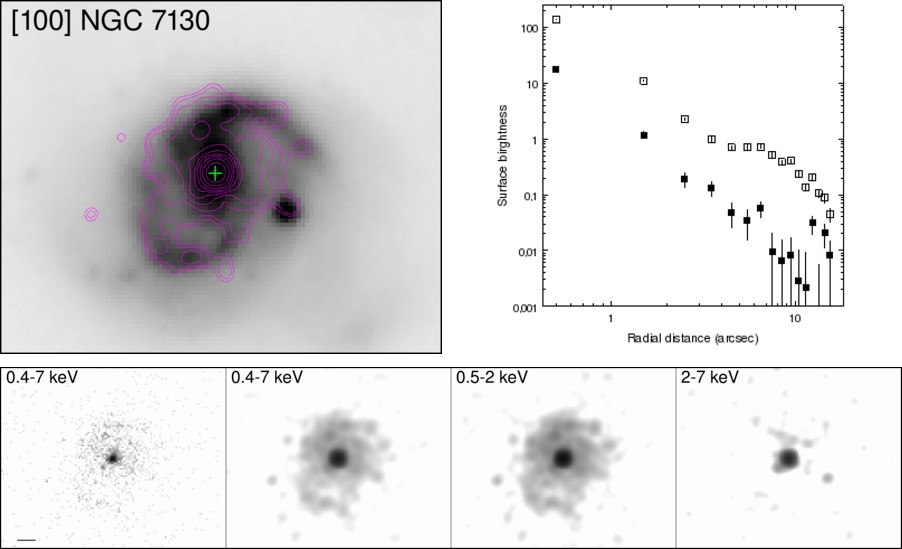
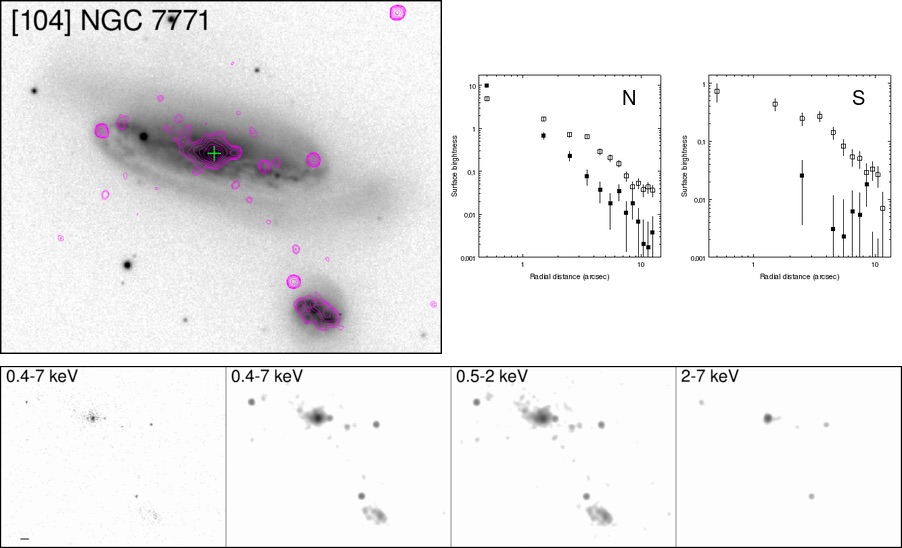
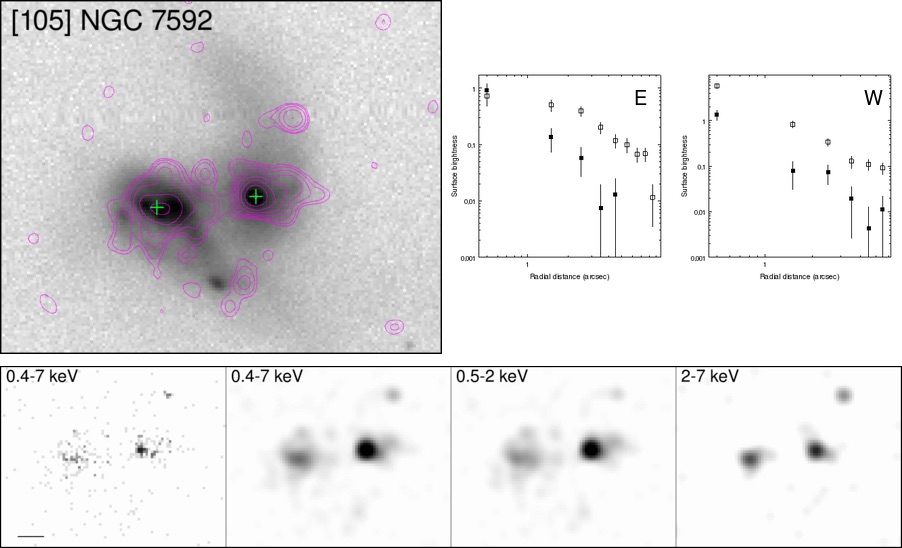
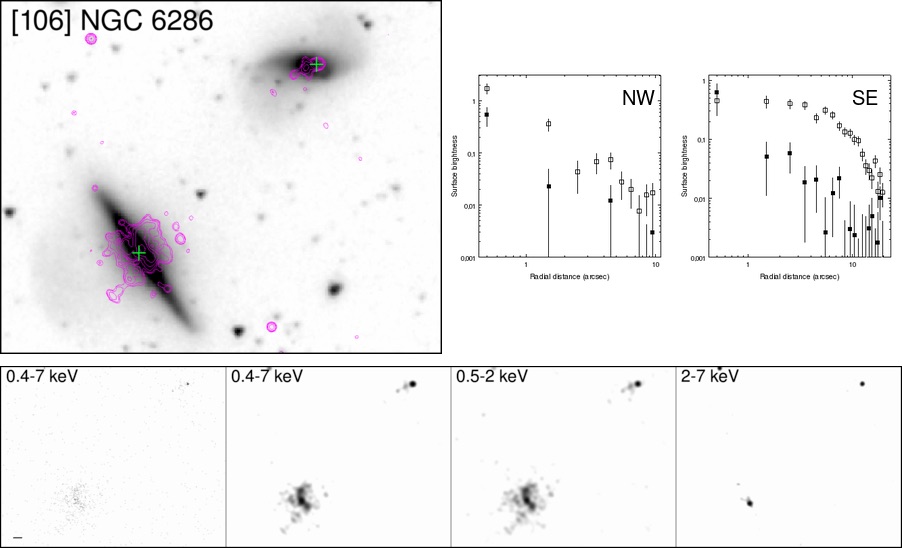
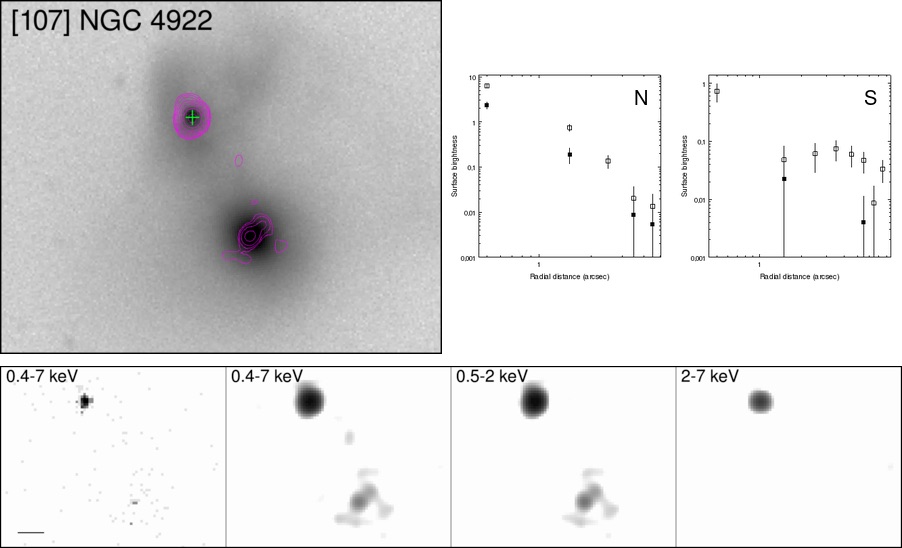
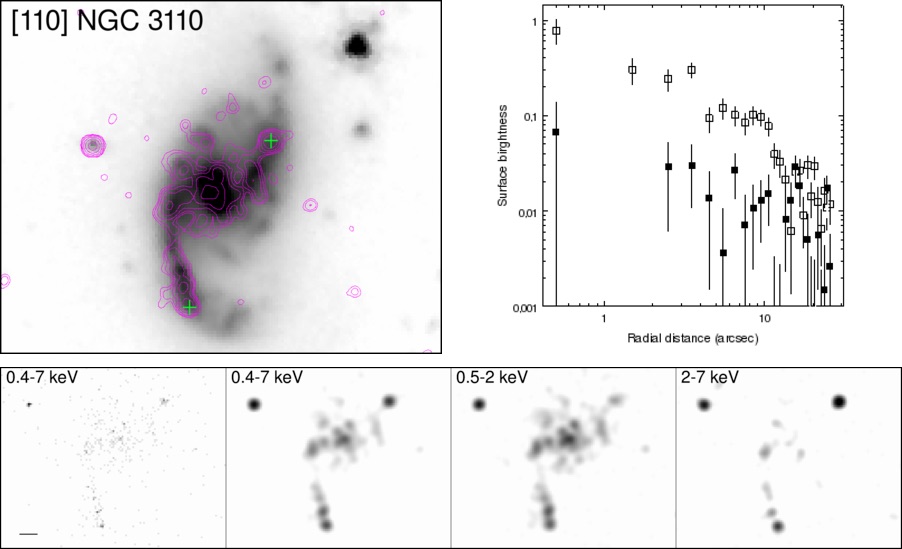
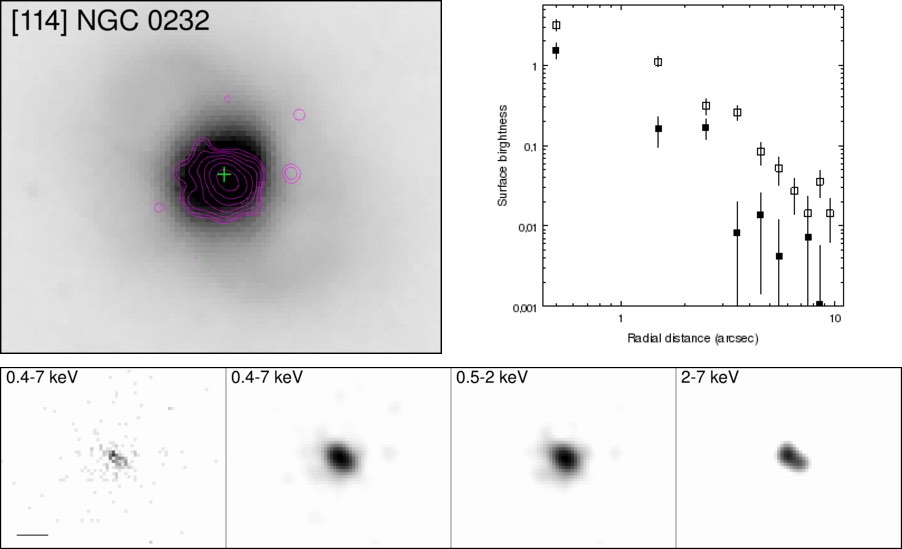
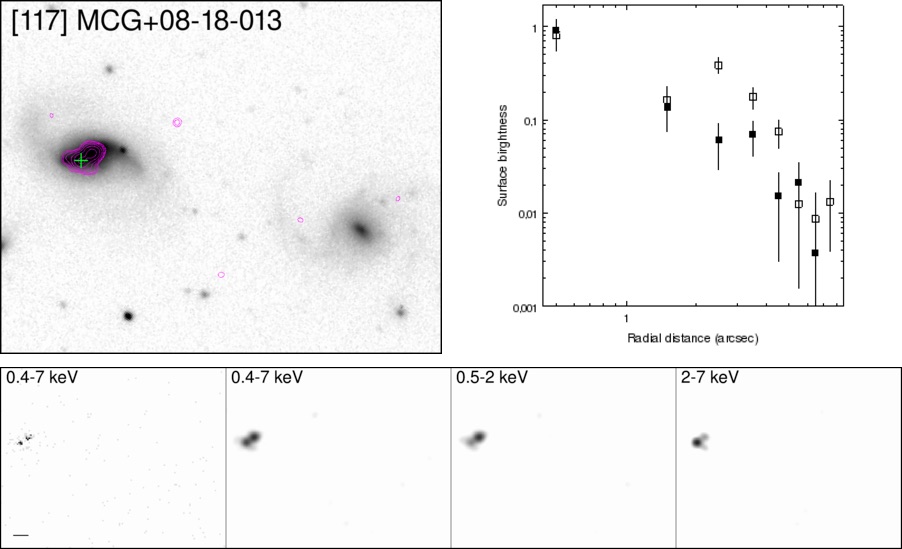
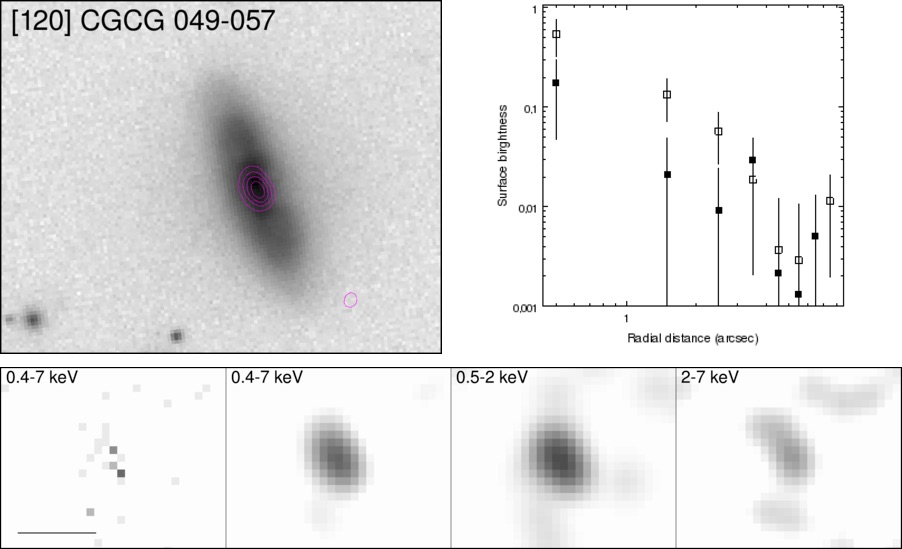
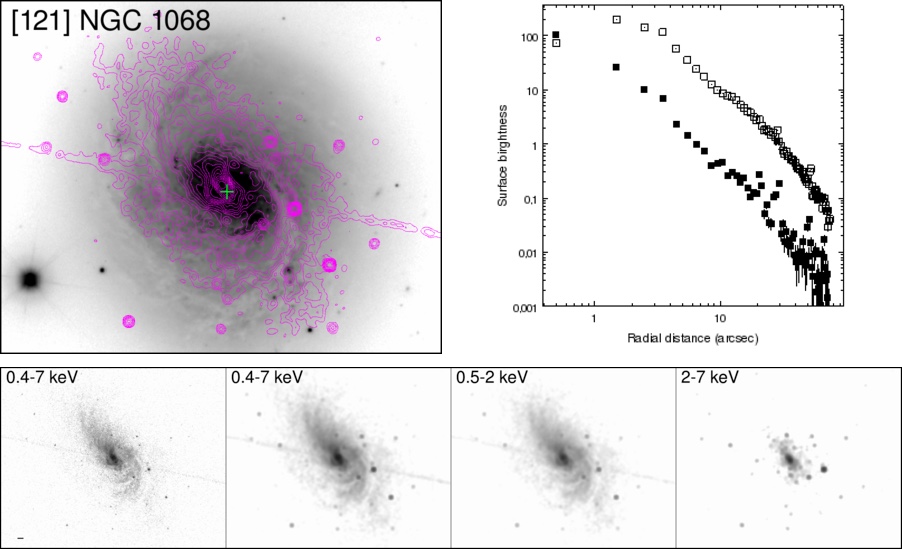
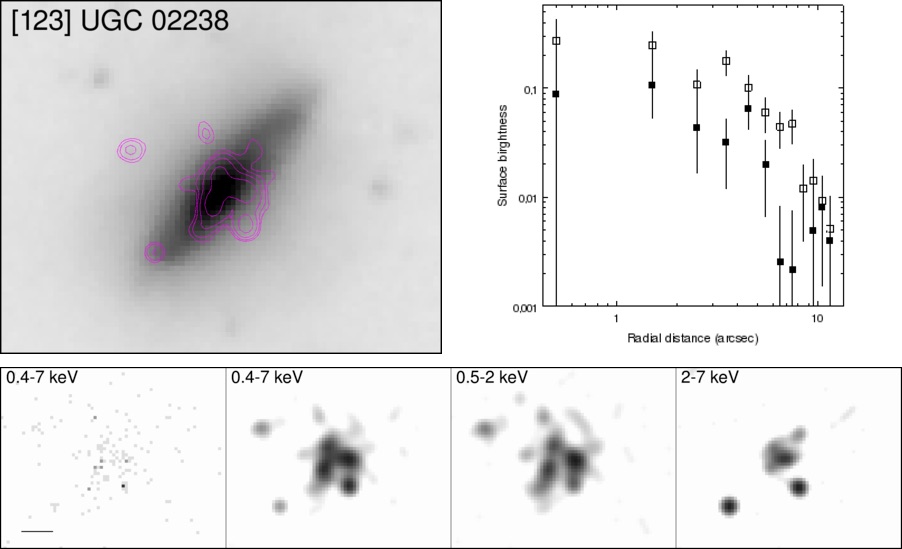
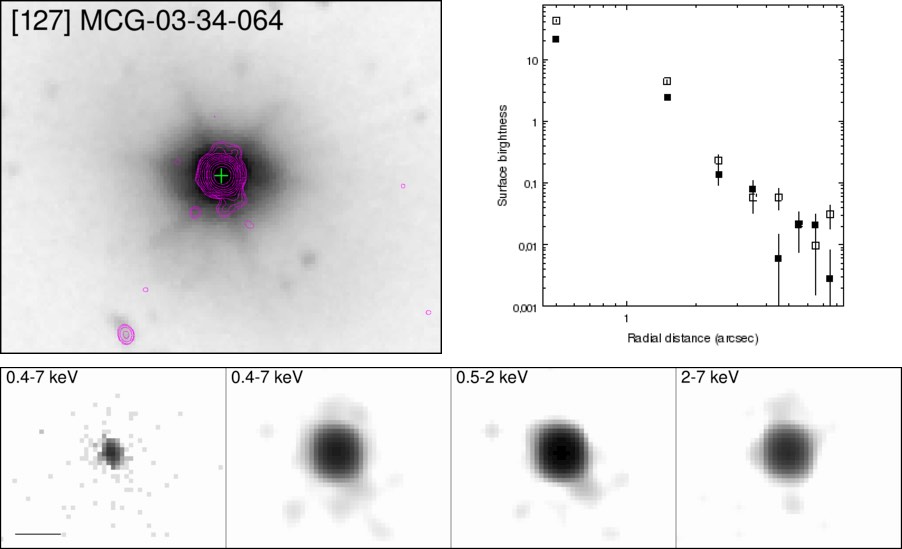
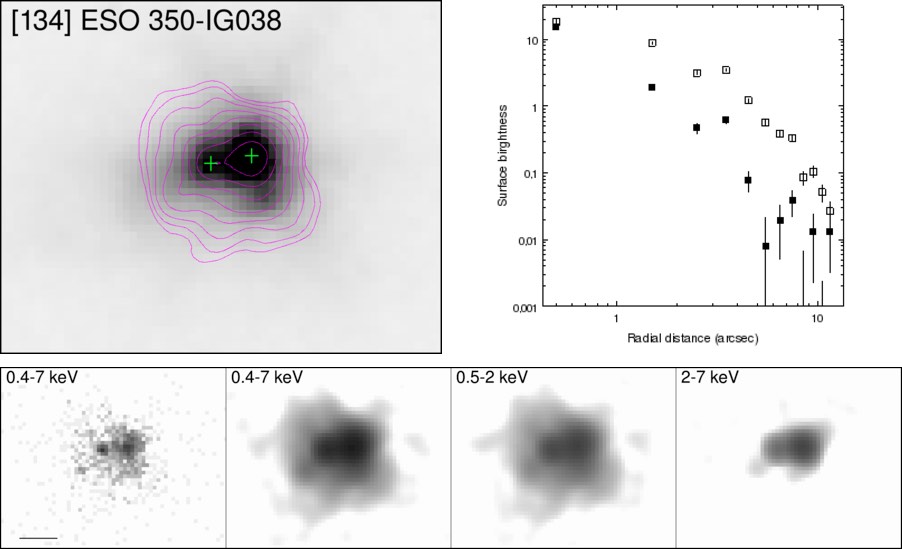
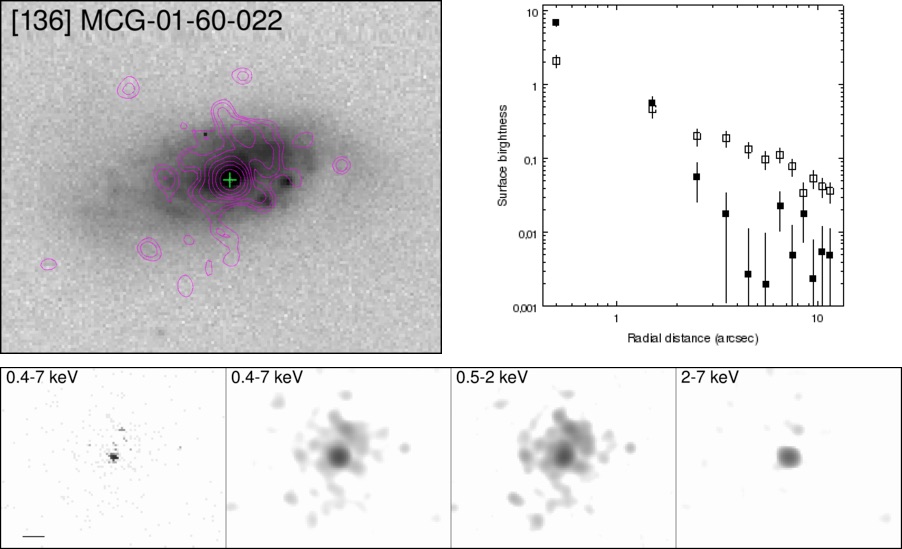
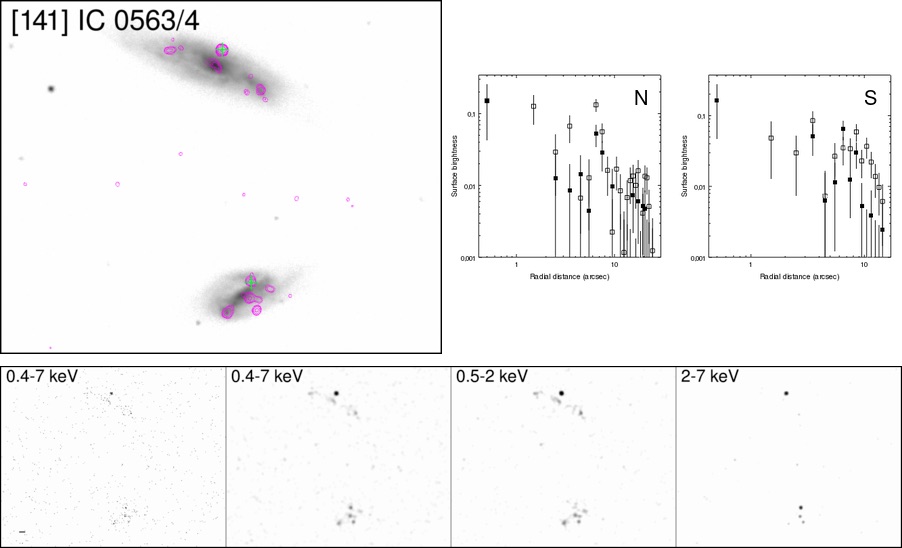
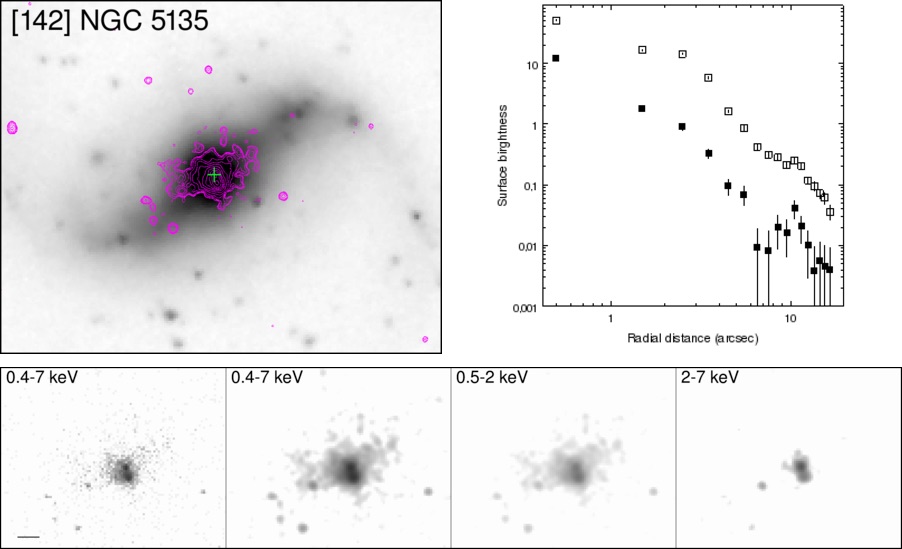
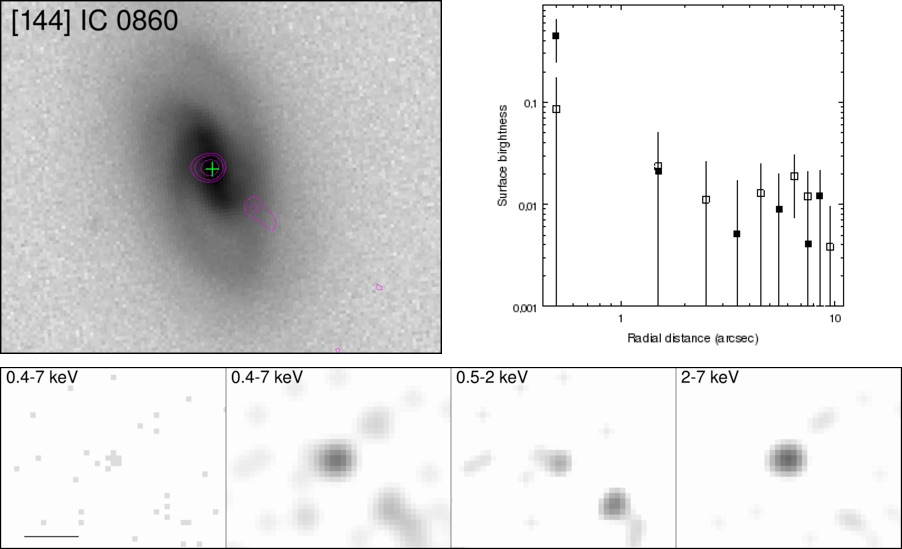
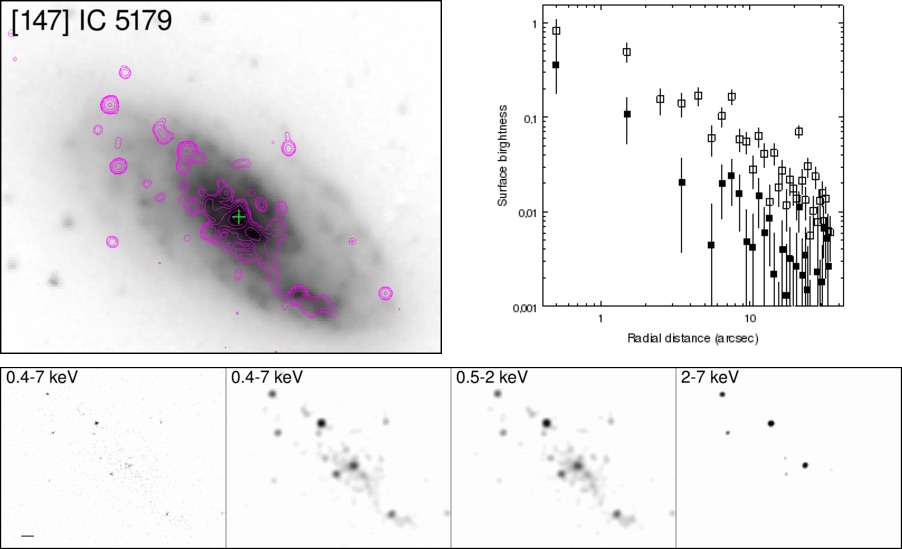
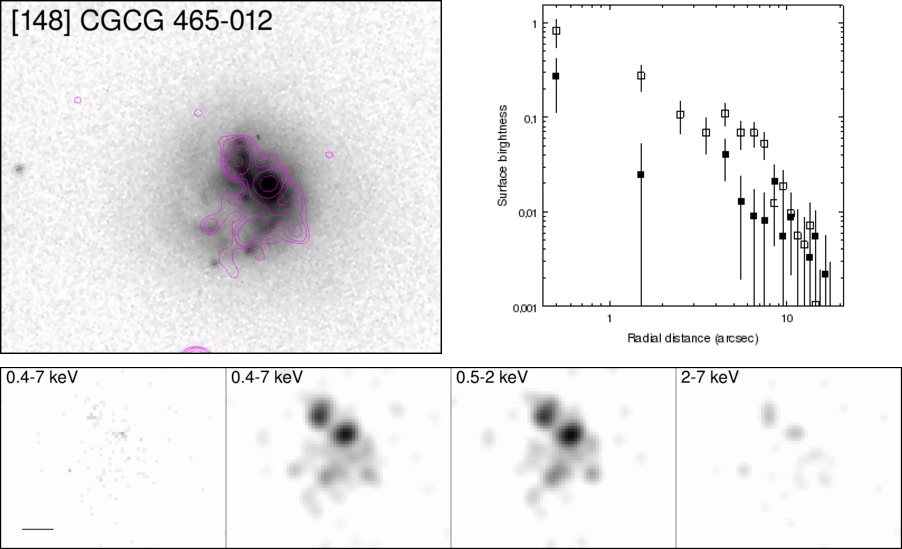
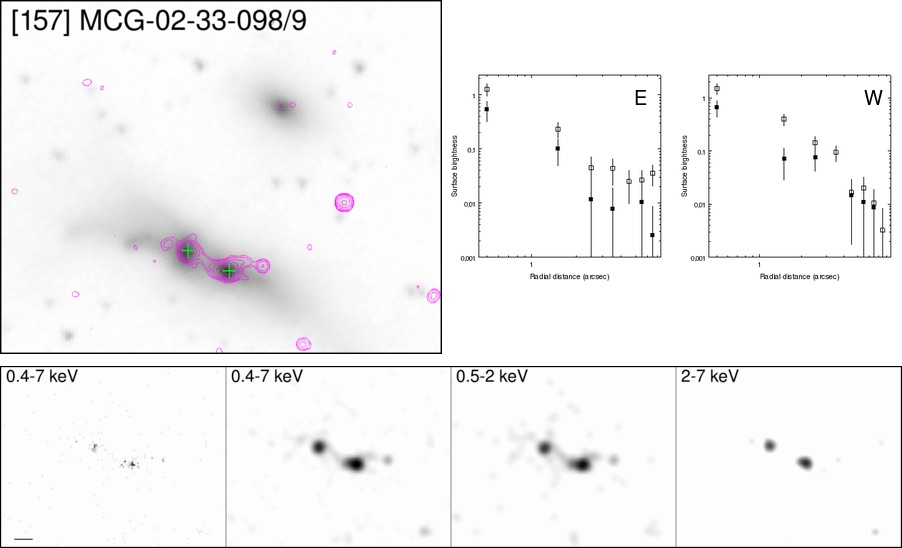
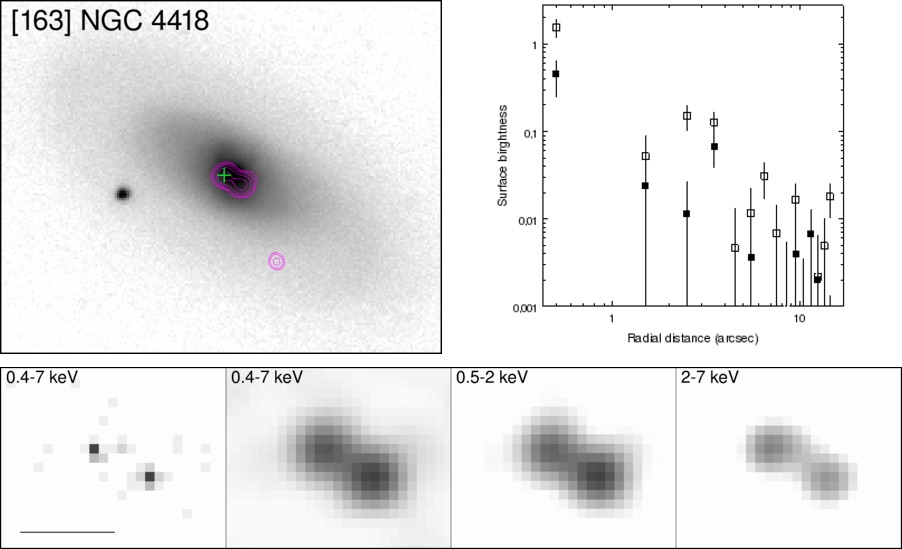
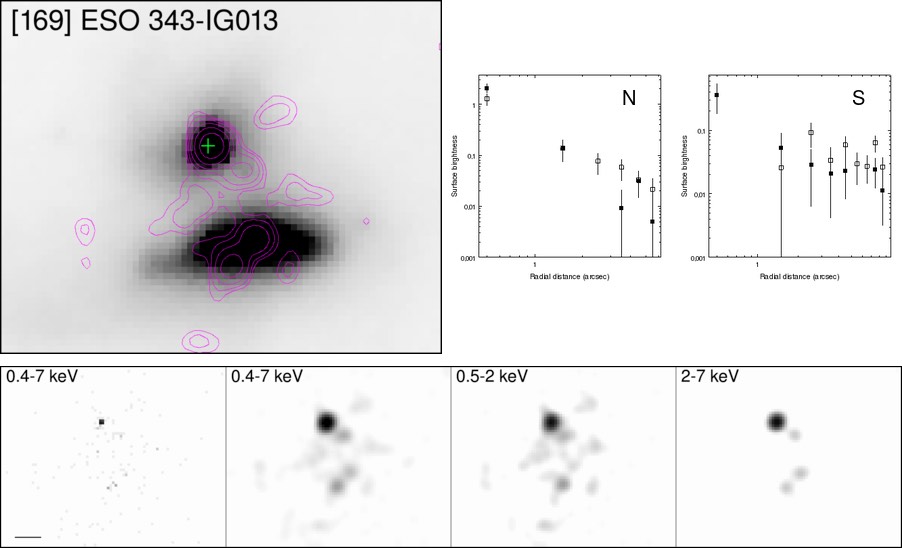
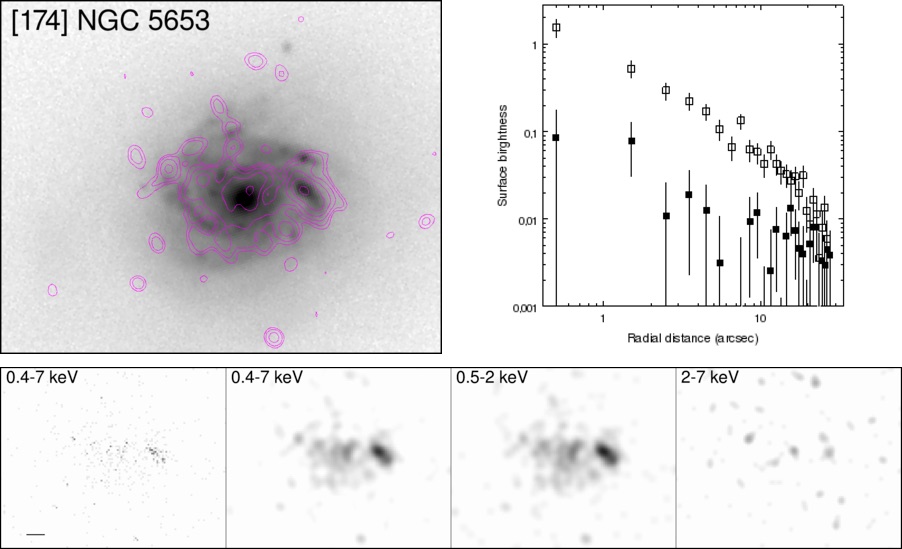
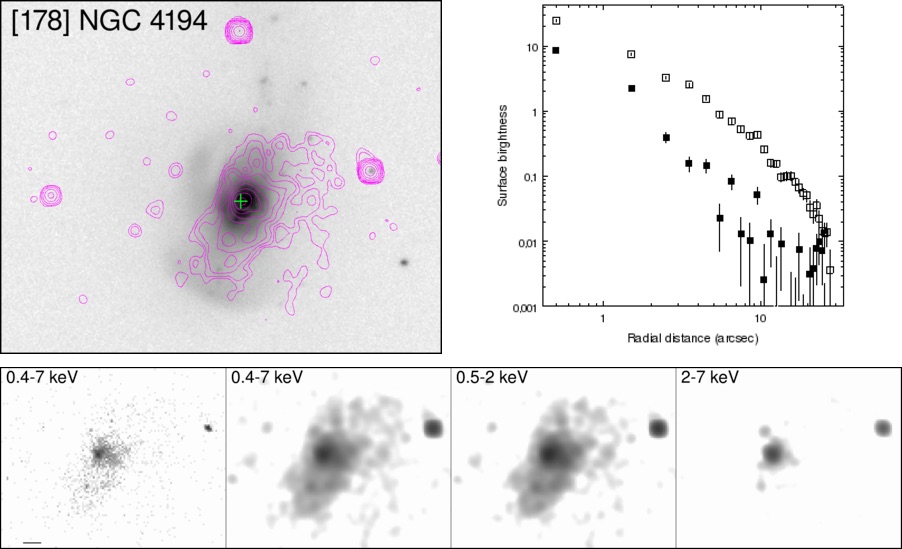
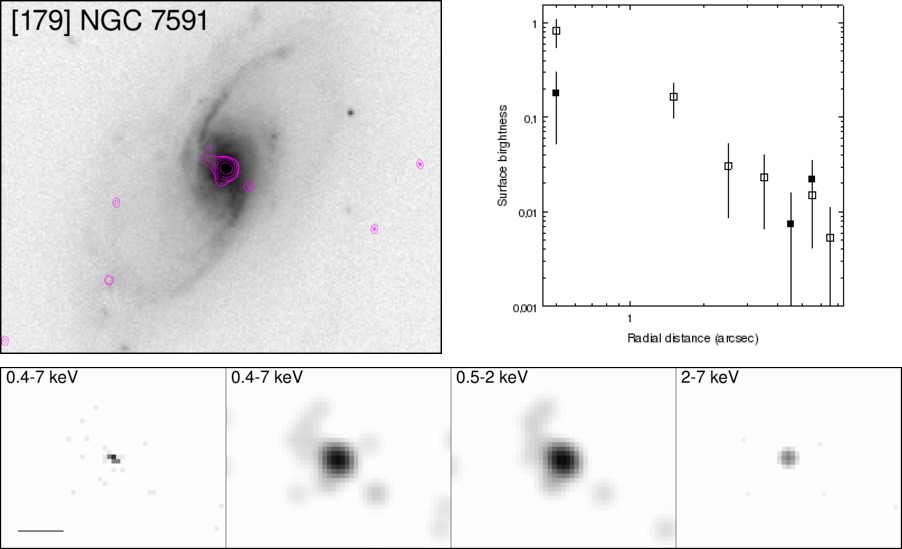
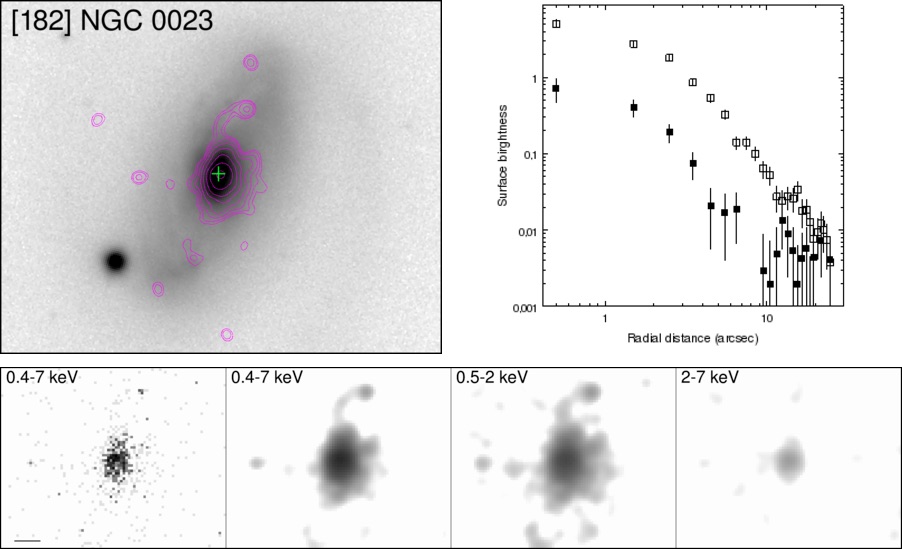
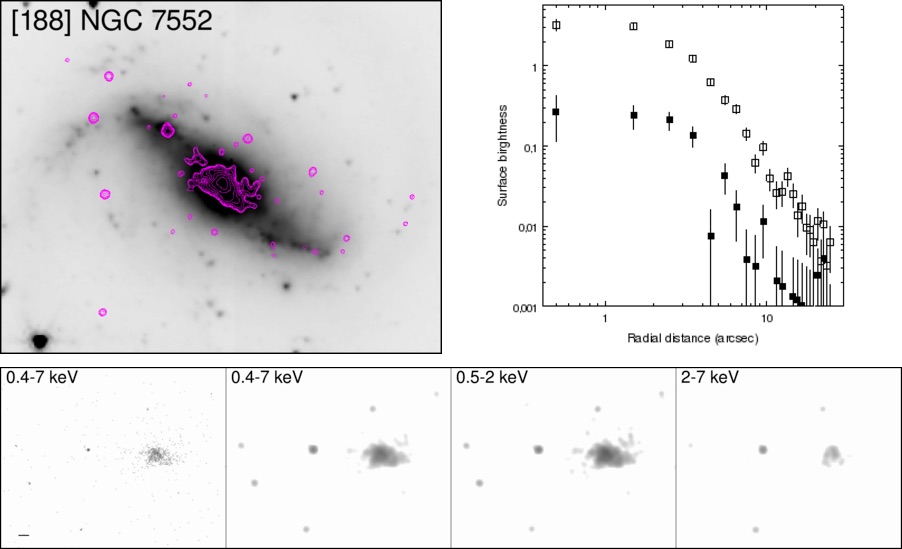
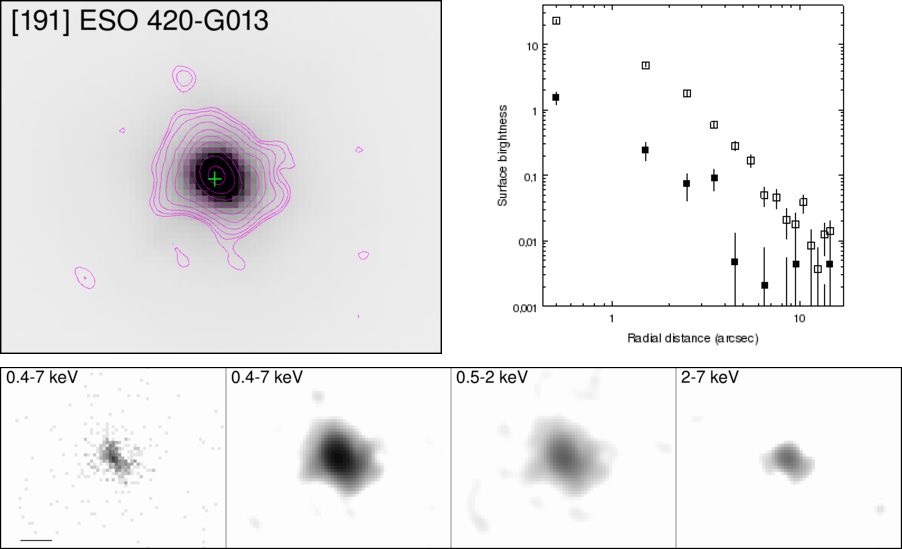
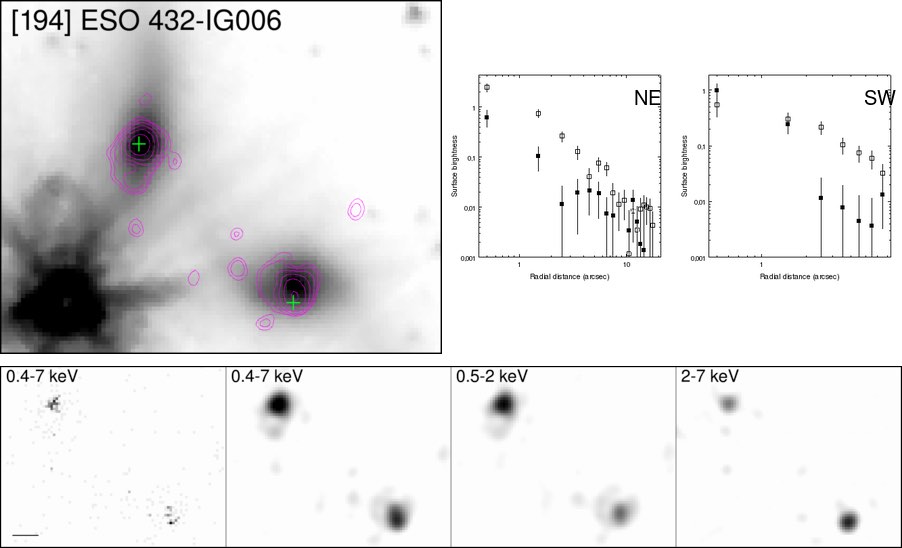
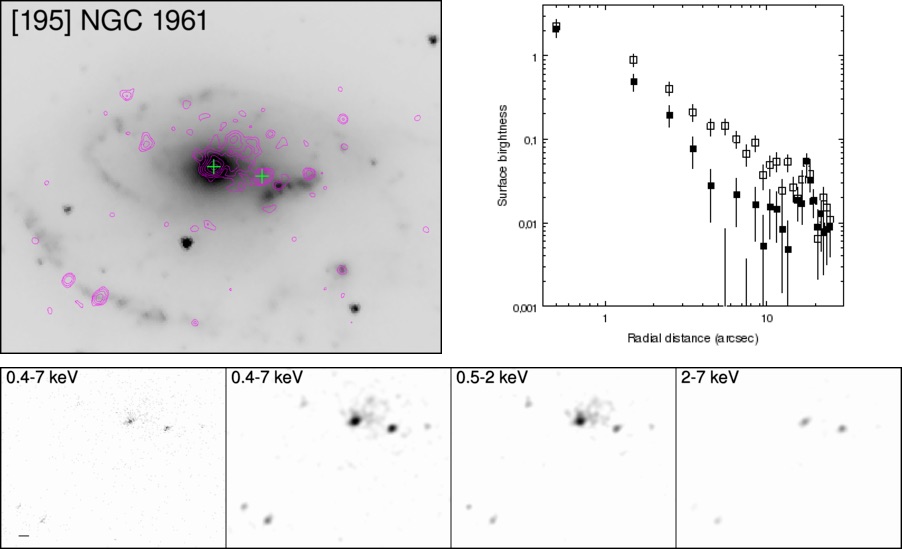
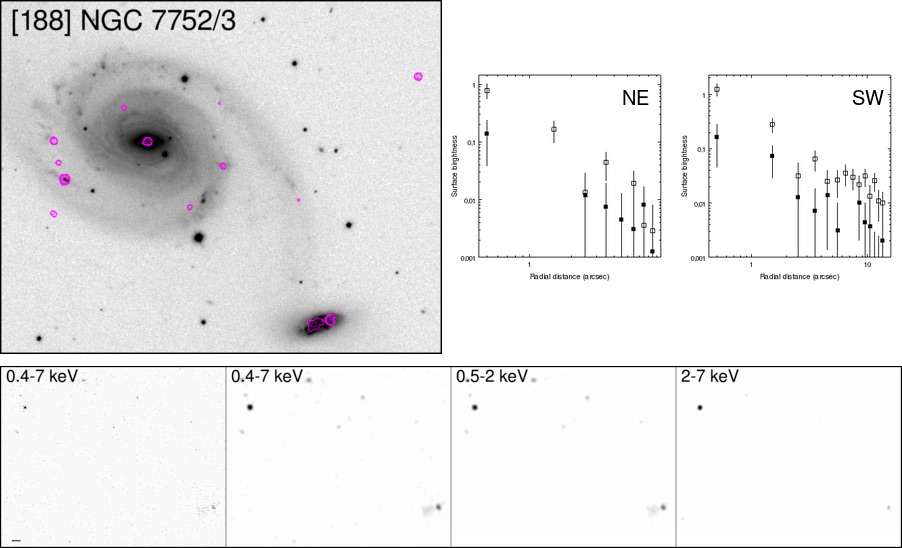
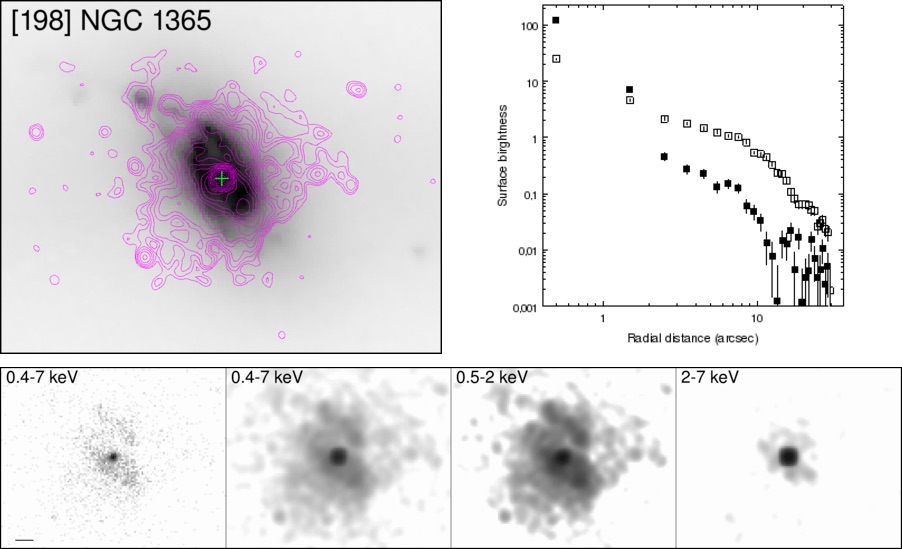
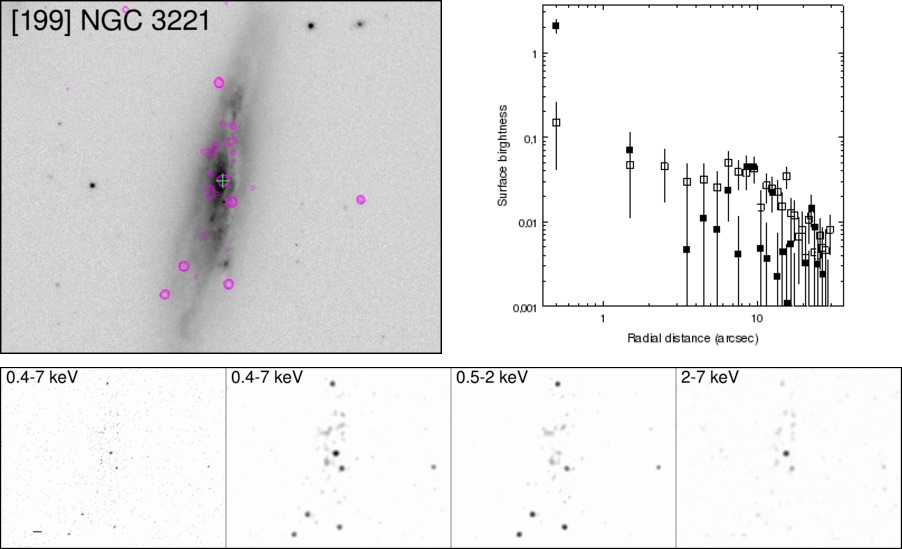
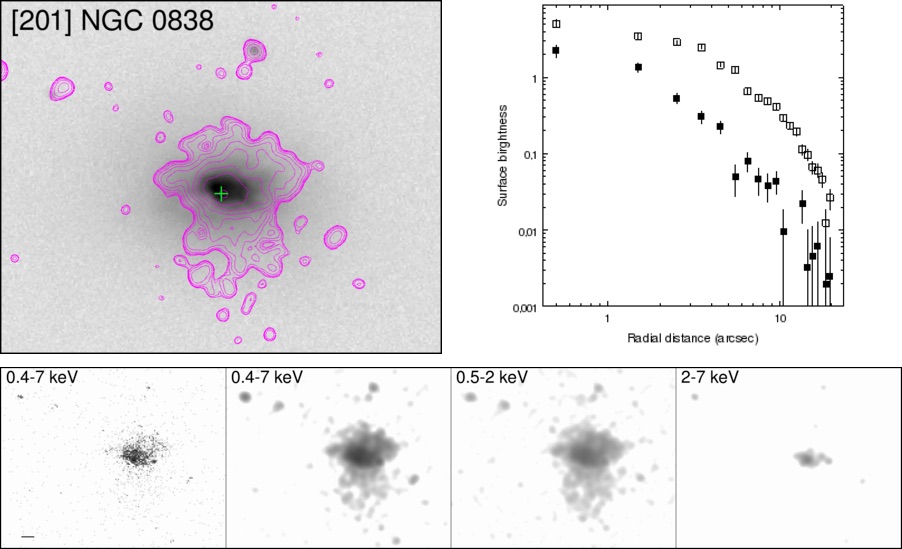
Appendix C X-ray Spectra