Present address: ]National Superconducting Cyclotron Laboratory, Michigan State University, East Lansing, Michigan 48824, USA. Present address: ]Department of Physics, The University of Burdwan, Burdwan 713104, West Bengal, India Present address: ]Department of Physics and Astronomy, Northwestern University, Evanston, IL 60208, USA Deceased.] Present address: ]Physics Division, Los Alamos National Laboratory, Los Alamos, NM 87545, USA
Precise branching ratio measurements in 19Ne beta decay and fundamental tests of the weak interaction
Abstract
We used the 8 -ray spectrometer at the TRIUMF-ISAC radiocative ion beam facility to obtain high-precision branching ratios for 19Ne decay to excited states in 19F. Together with other previous work, our measurements determine the superallowed beta branch to the ground state in 19F to be 99.9878(7)%, which is three times more precise than known previously. The implications of these measurements for testing a variety of weak interaction symmetries are discussed briefly.
pacs:
29.38.-c,23.40.-s, 23.40.BwI Introduction
High precision measurements of observables in 19Ne decay offer several opportunities to rigorously test symmetries of the weak interaction. For example, correlation measurements from the decay have been previously used to search for second-class Calaprice et al. (1975) and right-handed weak interactions Carnoy et al. (1992); Barry R. Holstein and Treiman (1977), as well as set stringent limts on Fierz interference terms Barry R. Holstein (1977) and time-reversal-odd currents Hallin et al. (1984); Schneider et al. (1983). Such experiments have constituted valuable probes for physics beyond the standard model (BSM). In addition, precision measurements of 19Ne decay transition probabilities provide a test of the conserved vector current (CVC) hypothesis, allowing a determination of , the up-down element of the Cabibbo-Kobayashi-Maskawa (CKM) quark mixing matrix Naviliat-Cuncic and Severijns (2009) and are also important to test shell model calculations Haxton et al. (1980); Brown et al. (1980) used to interpret parity mixing in 19F Adelberger et al. (1983); Adelberger and Haxton (1985).
In this paper, we report precise measurements of 19Ne decay branches to excited states in 19F, shown in Fig. 1. We briefly discuss the implications of our results for fundamental tests of the weak interaction.

II Experimental details
II.1 Apparatus
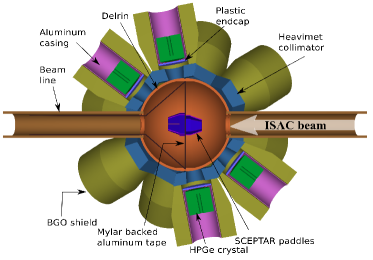
The experiment was carried out using a radioactive 19Ne ion beam ( s) at the TRIUMF Isotope Separator and Accelerator (ISAC) facility located in Vancouver, Canada. The beam was produced by bombarding a thick, heated SiC target with A of 500 MeV protons from the TRIUMF main cyclotron inducing spallation reactions. The diffused reaction products from the target were then introduced into a forced electron beam-induced arc-discharge (FEBIAD) ion-source via effusion. Subsequently, a pulsed mass-separated beam of 19Ne ions s-1, with an energy of 37 keV was delivered to the 8 -ray spectrometer Garnsworthy and Garrett (2014); Garrett et al. (2015). As shown schematically in Fig. 2, the spectrometer comprised an array of 20 symmetrically placed Compton-suppressed high-purity germanium (HPGe) detectors, whose inner volume consisted of 20 similarly placed 1.6-mm-thick BC404 plastic scintillator detectors called SCEPTAR (Scintillating Electron Positron Tagging Array) Garnsworthy and Garrett (2014); Garrett et al. (2015). The SCEPTAR detectors were coupled to Hamamatsu H3165-10 photomultiplier tubes (PMTs) and covered 80% of the total solid angle. The radioactive ions were implanted on a 1.3 cm wide, 40 m-thick mylar-backed aluminum tape at the center of the 8 array. This tape was part of a continuous moving tape collector (MTC) system that looped in vacuum through a lead-shielded aluminum box located downstream from the array center. The beam pulsing and the MTC allowed for data to be registered using tape cycles. In a typical cycle, the beam was implanted on the tape for a certain amount of time, following which the beam was ‘turned off’ using an electrostatic deflector near the ion-source. After a predetermined counting period, the MTC controls were triggered to move any potential long-lived activity on the tape away from the detectors into the shielded tape box.
II.2 Data Acquisition
The data for this experiment were acquired with a fast encoding and read out ADC (FERA) system, with independent data streams for the SCEPTAR and HPGe detectors Garrett et al. (2015). The data acquisition (DAQ) trigger included scaled singles and - coincidences for the scintillators and singles for the HPGe data stream. The events in each data stream were time-stamped using a LeCroy 2367 universal logic module (ULM) acting as a latching scaler, which counted pulses from a precision temperature-stabilized Stanford Research Systems 10 MHz 0.1 Hz oscillator.
The signals from the 20 SCEPTAR photomultiplier tubes were first shaped by a Phillips Scientific 776 fast amplifier and then sent in parallel to different parts of the data acquisition system. One output from each channel was sent to a LeCroy 4300 charge-to-digital converter (QDC) to generate the minimum ionizing energy spectra. The other output was sent to an Ortec 935 constant fraction discriminator (CFD) for timing purposes. The 500 ns wide pulses from the CFD were also sent in parallel to different units. One branch was converted to 50 ns wide pulses using a fast Phillips Scientific 706 leading edge discriminator and sent to a logic OR fan-in-fan-out unit. The summed pulses from the individual SCEPTAR detectors were imposed with fixed non-extendible dead times in the range of 4-24 s, much longer than any processing time in the preceding electronics. The dead-time-affected outputs were finally multiscaled using a Struck SIS3801 multi-channel scaler (MCS). These MCS data were used to obtain a high-precision measurement of the 19Ne half-life, which is described in Ref. Triambak et al. (2012). The other branch was sent to multichannel CAEN 894 discriminators, from which the signals were fed to a 32-channel multi-hit LeCroy 3377 time to digital converter (TDC) to store timing information.
The preamplifier output signals from the HPGe detectors were duplicated as well. The -ray energies were acquired using Ortec 572 spectroscopy amplifiers (with 3 s shaping time) and Ortec AD114 peak sensing ADCs. In parallel, the preamplifier signals were sent to Ortec 474 timing filter amplifiers (TFAs) and subsequently discriminated using Ortec 583b CFDs. The fast output of the CFDs were further processed by the TDCs, providing timing information for the -ray events relative to the master trigger signal. These TDCs were additionally used to process the timing from the HPGe bismuth-germanate (BGO) Compton suppression shields, as well as the ‘inhibit’ signals from the pulse pile-up rejection circuitry in the spectroscopy amplifiers.
Scaled-down singles (with a scale-down factor of 255), singles and - coincidence data were stored event-by-event in full list mode and reconstructed in an offline analysis.
III Analysis
III.1 Characteristics of the -ray spectrum
For this experiment the MTC was configured Triambak et al. (2012) so that in each tape cycle we acquired background data for 2 s, following which the 19Ne ions were collected for 1-2 s. A counting time of 300 s (20 half-lives) was used to collect the decay data.
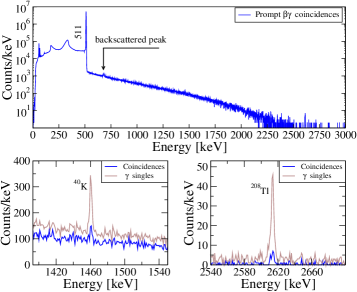
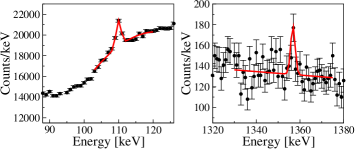
Figures 3 and 4 show the -ray spectrum obtained in coincidence with positrons registered with the SCEPTAR detectors. Similar to other high precision branching ratio measurements performed with the 8 array Finlay et al. (2008); Leach et al. (2008); Dunlop et al. (2013) this spectrum was obtained by gating on the time differences between successive and triggers registered with the ULM. These data were acquired from the same cycle time window that used to determine the total observed singles (which is described in Section III.3). As further illustrated in Fig. 4, we clearly identify two -ray peaks at 110 and 1357 keV that arise from the and keV transitions in the daughter 19F nucleus. The -ray peak from the keV transition is not visible because of the large Compton artefact in that region of the spectrum. We also do not observe explicit signatures of the (much weaker) 1554 and 1444 keV rays (c.f. Fig. 1) in these data. However, this did not have a bearing in our determination of the decay branches, as discussed below.
III.2 Efficiency calibration
The HPGe detection efficiency for the array was determined using a combination of Monte Carlo simulations performed with the PENELOPE radiation transport code Sempau et al. (1997) and data obtained from standard 133Ba, 152Eu and 60Co sources. The absolute activities of the latter were known to 3% at the 99%CL. The reasons for performing the simulations were two-fold:
-
1.
To obtain coincidence summing corrections due to -ray cascades in the calibration sources.
-
2.
To offer a comparison between the simulated efficiencies and the experimentally determined values.
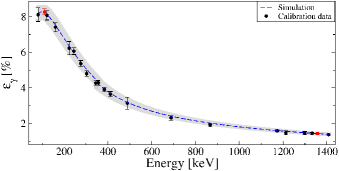
Figure 5 shows the extracted efficiencies for the calibration rays after applying small corrections due to both coincidence summing as well as pulse pile-up.111The summing corrections were of the order , while the pile-up corrections were of the order . Incorporating known - angular correlations in the simulations had an insignificant effect on the former. These values are found to be in excellent agreement with the results from the PENELOPE simulations (for multiplicity 1 photons), apart from an overall normalization factor.
Once we ascertained the credibility of the PENELOPE model, the simulations were used both to determine -ray summing corrections for 19Ne decay (described in Section IV) and the attenuation of photons due to absorption in the tape material. Using a 19Ne implantation profile from TRIM sri ; Ziegler et al. (2010)222The 19Ne source was assumed to be uniformly distributed on the tape over a 3 mm radial diameter. TRIM predicts a nearly Gaussian implantation (depth) profile, with a range of 700 Å and straggle of 290 Å. The final uncertainties in the extracted efficiencies also included the effect of a (conservative) 1 mm offset in the beam spot laterally., the simulations showed that the attenuation was negligible for the 1357 keV ray, whose efficiency was eventually determined from a polynomial fit to the calibration points
| (1) |
On the other hand, the efficiency for the 110 keV ray needed a small correction () to the value determined from the above equation, due to -ray absoprtion within the tape. Our extracted efficiencies for both the rays are highlighted in red in Fig. 5.
III.3 singles determination
Similarly as described in Ref. Iacob et al. (2006), we obtained absolute -decay branches to the excited and states in 19F from the ratios of - coincident counts to the total number of observed singles. Hence, an important step in our analysis was to obtain the integrated number of singles events () detected by the SCEPTAR array. This was determined by a maximum likelihood fit to the total activity (sum of the scaled-up singles and the coincident decay curves) assuming Poisson-distributed statistics Baker and Cousins (1984). The fitted number of counts in each time bin (of width ) was described by the function
| (2) |
where
| (3) |
Eq. (2) represents a realistic model for cycles of data, that are affected by an instrumentation dead time per event.
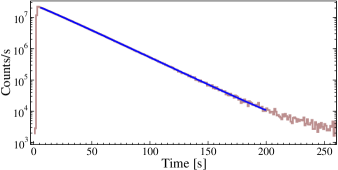
Figure 6 shows the summed activity curve generated from the list-mode ULM data, for a total of 724 cycles recorded over the course of our experiment. These data were fitted using fixed values333The 19Ne half life used for the fit was from a weighted mean of the results from three recent high-precision measurements Triambak et al. (2012); Ujić et al. (2013); Fontbonne et al. (2017). We refrain from using the result of Broussard et. al. Broussard et al. (2014) due to the inconsistency of their measurement with the other three highest precision results Fontbonne et al. (2017). of and , while the and parameters were varied as free parameters. Since the data were the sum of several experimental runs with different implant times, we circumspectly chose the range of the fit to be from s to s. This time interval corresponds to approximately 11 half-lives. While it is large enough to provide a reasonably accurate understanding of the background, it avoids the region where the 19Ne activity does not play a statistically significant role.
The optimal value of was determined from an algorithm that performed the fits described above over a large range of dead times , in steps of s. The corresponding to the minimum ( = 3.5 s) was eventually used to obtain the total number of singles recorded.
The best fit to our data on using the optimal value for the effective dead time is shown in Fig. 6. The reduced value for this highly constrained fit is rather poor, but not unexpected, considering the high statistics acquired. More realistically, to obtain an improved fit to the data, one would require the incorporation of rate-dependent effects and an accurate understanding of additional complications such as scintillator afterpulsing Triambak et al. (2012). To bypass this problem we choose to make an overly conservative estimation of the total uncertainty on the extracted value. This was done by using a 99.9% confidence level uncertainty on and further inflating the uncertainty in by a scale factor of for degrees of freedom. Both these uncertainties were added in quadrature to the uncertainty contribution from the half life value. This procedure yielded a final value of registered in the time range of the fit.
Although the ray spectrum in Fig. 3, and the half-life analysis described in Ref. Triambak et al. (2012) show no obvious indication of contaminants in the beam, a small contamination of molecular cannot be ruled out. However any such contamination would not consequentially affect our measurements, mainly because the long half-life of 18F ( min) would result in an almost constant decay rate over 300 s. Furthermore, the decay of 18F does not feed any excited levels in 18O. Therefore its presence in the beam would only result in an increased background component and not affect our singles determination described above.
IV Results
If one neglects the small electron-capture fraction for the decay, the ratio of the number of - coincidences for a given transition from level to the total number of singles is simply
| (4) |
where is the branch to the level, is the detection efficiency for decays feeding level , is the probability of a transition from level to and is the efficiency of detecting that ray. This expression can be simplified further to obtain the branches in Fig. 1. For example, we determine using the photopeak area of the 110 keV ray and the simple expression
| (5) |
which neglects the contribution with the vanishingly small product . The branch was obtained similarly. For both these cases, the were extracted from a -ray spectrum (shown in Figs. 3 and 4) that was projected out from the same cycle time window that was used to determine the total number of singles.
In the above, is a correction factor () which accounts for small systematic effects and is imperative for an accurate result. Analogous to the approach followed in Ref. Iacob et al. (2006), we determined this factor444Similarly, a correction factor is used to determine . from the product of five distinct corrections that are listed in Table 1 and described below.
| Source | Correction | (%) |
|---|---|---|
| Coincidence summing | 1.0089(6) | |
| Random coincidences | 0.961(9) | |
| Pile up | 1.00324(1) | |
| Dead time | 1.00577(6) | |
| value dependence on efficiency | 1.000(2) | |
| / ratio | ||
| HPGe efficiency () |
Summing corrections and random coincidences : The -ray spectrum in Fig. 3 does not show an explicit signature of photopeak summing with 511 keV annihilation photons, due to the large continuum in the region around 621 keV. Nevertheless, it was important to estimate the photopeak summing with 511 keV rays, in addition to other summing contributions from scattered positrons, bremsstrahlung and Compton-scattered radiation. Therefore an important part of our analysis was to estimate the coincidence summing corrections for the two rays of interest. We quantified these corrections with additional PENELOPE Monte Carlo simulations that tracked both the positrons and the photons in the active volume of the array, while also taking into account positron annihilation in flight. Our simulations show that roughly 0.9% of the 110 keV rays were lost due to coincidence summing. In comparison, the correction for the 1357 keV peak was . This value is slightly larger than that for the 110 keV -ray due to an additional contribution from the keV cascade, which is significant and therefore cannot be ignored.
On the other hand, we determine the correction factor for random - coincidences to be . This was obtained from the intensity ratios of the background ray lines observed in the prompt-coincidence and singles ray spectra (shown in the lower panels of Fig. 3) together with the known absolute efficiency of the SCEPTAR array.
Dead time and pile up : The latching scalers in the ULM enabled HPGe and SCEPTAR dead times to be calculated independently, on an event-by-event basis G.F. Grinyer et al. (2007). While the SCEPTAR dead time effectively cancels out in Eq. (4), the -ray photopeak areas required an additional dead time correction. The average dead time per event for the HPGe data stream was found to be 30.4(3) s. Using this value we obtain a HPGe dead time correction factor . Independently, we also obtain a pile-up correction from the events registered by the pile-up TDC, that were vetoed from the final -ray spectrum.
endpoint energy dependence on SCEPTAR efficiency : This small correction factor is important for the branch, where the energy distribution is very different than the ones feeding the ground and first excited states in 19F. It is given by
| (6) |
We determined this correction from simulations of SCEPTAR efficiencies for the different values feeding the three states of interest at 0, 110 and 1554 keV. The simulations show that the branch requires a correction factor of . Expectedly this correction for the branch agrees with unity (as ). More detailed investigations of the value dependence on SCEPTAR efficiency can be found in Ref. Finlay (2007); *finlay2.
Table 2 compares our results from this experiment with previous work. While in excellent agreement with earlier measurements555We do not include the 1975 result of by Freedman et al. Freedman et al. (1975) as it significantly disagrees with all subsequent work, including ours., our result for the first-forbidden branch is 2.4 times more precise than the previous highest-precision measurement. A weighted mean of the results yields final branching ratios of and . This directly translates to a ground state superallowed branch of 99.9878(7)%, which is three times more precise than the value reported in a previous compilation Severijns et al. (2008).
| Measured branch (%) | |||
|---|---|---|---|
| Transition | Previous work | This work | |
| 0.0021(3)a | 0.0023(3)b | 0.0017(5) | |
| 0.012(2)c | 0.011(9)d | 0.0099(7) | |
a D. E. Alburger Alburger (1976).
b E. G. Adelberger et al. Adelberger et al. (1983).
c E. G. Adelberger et al. Adelberger et al. (1981).
d E. R. J. Saettler et al. Saettler et al. (1993).
Since our published 19Ne half-life result Triambak et al. (2012), there have been three additional half-life measurements reported with comparable or better precision. Similar to our experiment, the authors of Refs. Fontbonne et al. (2017); Ujić et al. (2013) used the method of counting, while Broussard et al. Broussard et al. (2014) determined the half-life using 511 keV annihilation radiation detected in two collinear HPGe detectors. A weighted mean of the four values yields a poor probability of . This is not unexpected, since the -ray measurement disagrees with the other three measurements and is more than away than the latest (and most precise) value published in Ref. Fontbonne et al. (2017). The probability improves to 65% if we exclude the value from Ref. Broussard et al. (2014). Since this discrepancy is yet to be resolved, for our subsequent analysis we choose to use an average value of s, obtained using only the results from Refs. Triambak et al. (2012); Ujić et al. (2013); Fontbonne et al. (2017)666If we include the result from Ref. Broussard et al. (2014), the weighted mean changes insignificantly to s..
Together with the electron-capture branching fraction Firestone et al. (1966); Bambynek et al. (1977); Severijns et al. (2008), the mass excesses from the most recent Atomic Mass Data Center compilation amd ; Wang et al. (2017) and other small corrections Severijns et al. (2008) due to isospin symmetry breaking and radiative effects, we obtain a corrected value for the 19Ne superallowed decay to be
| (7) |
where we follow the same notation as Refs. Severijns et al. (2008); Hardy and Towner (2015) and is the vector component of the statistical rate function for the transition.777This is slightly different than the axial-vector part, mainly because of the effect of weak magnetism Triambak et al. (2017); Grenacs (1985) on the shape-correction factor of the latter Iacob et al. (2006). We obtain ian , where, similar to Ref. Naviliat-Cuncic and Severijns (2009), we assign a 20% relative uncertainty on the deviation of from unity.
As a result of the aforementioned high-precision half-life and branch measurements, the value in Eq. (IV) is now one of the most precisely measured values for mirror transitions. Consequently, it provides a benchmark for comparison with experimental observables that are used for searches of BSM physics. We discuss some examples below.
V Discussion
V.1 Implications for searches of second-class weak interactions
Beyond the allowed approximation, the hadronic weak current contains additional recoil-order form factors Grenacs (1985); Triambak et al. (2017); Barry R. Holstein (1974a); Vincenzo Cirigliano et al. (2013). Some of these terms are classified as second-class, based on their transformation properties under the -parity operation Weinberg (1958); Triambak et al. (2017). Within the limit of perfect isospin symmetry, second-class currents are forbidden in the standard model. Angular correlation measurements in nuclear decays are known to be useful probes to search for induced second-class currents Barry R. Holstein (1974a); Barry R. Holstein and Treiman (1971). As an example, we focus on the decay of spin-polarized 19Ne nuclei. After integrating over the neutrino directions, the differential decay rate can be expressed in terms of the spectral functions Barry R. Holstein and Treiman (1971)
| (8) |
where
| (9) |
and
| (10) |
In the above, , is the total energy of the positrons, is the end-point energy, is the positron momentum, is the positron mass and is the average of the parent and daughter masses. The remaining terms are momentum-transfer dependent form factors; and are the leading vector and axial-vector form factors, is the weak magnetism form factor and is an induced-tensor form factor. It is apparent from Eq.(8) that if one ignores small electromagnetic corrections due to final-state Coulomb interactions Barry R. Holstein (1974b), then the asymmetry parameter for the decay can be defined in terms of these spectral functions, so that .
In the low-momentum transfer () limit, and , where and are the usual Fermi and Gamow-Teller matrix elements Severijns et al. (2008). Both these and the other energy dependent (recoil-order) terms in the spectral functions can be determined using the conserved vector current (CVC) hypothesis Feynman and Gell-Mann (1958). For 19Ne decay, the vector and weak magnetism form factors reduce to and Naviliat-Cuncic and Severijns (2009), where the latter is calculated from the magnetic moments of the parent and daughter nuclei Barry R. Holstein and Treiman (1971). The standard-model-allowed (first-class) contribution to the induced-tensor form factor is expected to be highly suppressed as the decay mainly occurs between isobaric analog states Barry R. Holstein and Treiman (1971). Finally, the standard model value for the Gamow-Teller form factor can be extracted from the averaged value of superallowed Fermi transitions Hardy and Towner (2015) (or equivalently ) and . We determine this to be .888This form factor has a negative sign because we follow the same representation for Dirac matrices as Ref. Barry R. Holstein and Treiman (1971). Standard-model-allowed recoil-order corrections Barry R. Holstein (1974a) are taken into consideration in this calculation and hereafter.
| Year | Reference | a | b |
|---|---|---|---|
| 1963 | Commins and Dobson Commins and Dobson (1963) | ||
| 1967 | Calaprice et al. Calaprice et al. (1967) | ||
| 1969 | Calaprice et al. Calaprice et al. (1969) | ||
| 1975 | Calaprice et al. Calaprice et al. (1975) | … | |
| 1983 | Schreiber Schreiber (1983) | … | |
| 1996 | Jones Jones (1996) | … |
a Standard model prediction for %.
b Standard model prediction for %.
There have been several measurements of 19Ne decay asymmetry performed in the past. These are listed in Table 3. Furthermore, since the weak magnetism and induced-tensor form factors affect the energy dependence of , a measurement of the slope allows a sensitive search for second-class currents. This approach was first used by Calaprice et al. Calaprice et al. (1975) to search for second-class currents in 19Ne decay. Interestingly, their measurement significantly disagreed with CVC predictions, requiring an unexpectedly large second-class tensor form factor to describe the data. Calaprice et al. also reported a zero kinetic energy intercept value for the beta asymmetry, which is listed as in Table 3. This work was followed by two other measurements whose results were never published, but reported in Ph.D. theses Schreiber (1983); Jones (1996). Although the results from the three experiments are in reasonable agreement with each other, the unpublished values are more consistent with the standard model prediction and other experimental results that do not show explicit signatures of second class currents Tribble et al. (1981); Tribble and May (1978); Minamisono et al. (2011, 2001).
For completeness we list these results together with earlier asymmetry measurements in Tables 3 and 4. It is worthwhile to note that unlike Refs. Calaprice et al. (1975); Schreiber (1983); Jones (1996), the older measurements Commins and Dobson (1963); Calaprice et al. (1967, 1969) were performed by integrating over the whole positron spectrum.
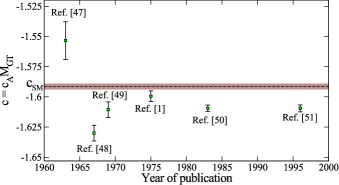
If one assumes , the measured coefficient can be used to determine the axial-vector form factor for the decay, independent of other standard model expectations. This is shown in Fig. 7, where we plot the value for extracted from all previous asymmetry measurements999For the measurements MeV. For the others we use an averaged value of MeV for the positrons. for 19Ne decay. Clearly, these data are in conflict with the CVC prediction and with each other. Some consequences of these differences are discussed below.
V.2 Implications for searches of right-handed currents
Despite the observed character of weak interactions, some of the earliest extensions to the standard model Pati and Salam (1974); Senjanović and Mohapatra (1975) and their more modern versions Shaban and Stirling (1992); Herczeg (2001) use a parity symmetric Lagrangian Bég et al. (1977) to describe the theory. These models restore parity at a higher energy scale, and provide a framework within which the apparent non-conservation of parity at lower energies can be attributed to the spontaneous breakdown of a higher gauge symmetry Herczeg (2001); Bég et al. (1977); Paul Langacker and S. Uma Sankar (1989). The extended gauge group requires the existence of additional right-handed and bosons, which are much heavier than their left-handed counterparts.
Such models present a compelling case. Not only does the inherent left-right (LR) symmetry make them aesthetically pleasing, the suppression of type weak interactions at low energies is a natural consequence in these models, owing to the large masses of the right-handed gauge bosons. It has also been shown that this suppression has a direct relation to both the smallness of neutrino masses Mohapatra and Senjanović (1980) as well as the experimentally observed violation Branco et al. (1983).
In the simplest (manifest) LR models Bég et al. (1977), the left-handed and right-handed charged weak currents couple to the weak interaction eigenstates and and have identical transformation properties (apart from chirality).101010Here, the left-handed and right-handed sectors have identical coupling constants and mixing angles. There are no additional violating phases apart from the usual Kobayashi-Maskawa phase Herczeg (2001). On account of the symmetry breaking, the mass eigenstates are simply linear combinations of the weak interaction eigenstates, with a LR mixing angle Bég et al. (1977). The weak interaction can therefore be parameterized Carnoy et al. (1988) in terms of and the ratio , where is the mass of the left (right) handed boson, with . Following Holstein and Treiman Barry R. Holstein and Treiman (1977) and Bég et al. Bég et al. (1977), one can further define two new parameters and , which are related to and . For sufficiently small and , these reduce to and Carnoy et al. (1988). Such a prescription ensures that purely left-handed weak interactions would emerge for vanishing values of and .
The above parameterization modifies the and spectral functions to allow for right handed currents (RHCs), such that Barry R. Holstein and Treiman (1977)
| (11) | ||||
| (12) |
This makes the experimentally measured parameter sensitive to right-handed weak interactions.111111This analysis is valid only if the RH neutrinos are light enough not to kinematically suppress the decay.
We have already shown in Table. 3 that the asymmetry for 19Ne decay is quite small. This is due to an accidental cancellation of the leading form factors in Eq. (V.1). Evidently, a similar cancellation does not take place for the RHC contribution in Eq. (12), except when . This makes 19Ne decay highly sensitive to RHCs. As a matter of fact, it is the most sensitive probe for RHCs among all mirror transitions up to Naviliat-Cuncic et al. (1991). For example, using a ‘sensitivity coefficient’ defined by the authors of Ref. Naviliat-Cuncic et al. (1991), it is calculated to be 70 times more sensitive Naviliat-Cuncic et al. (1991) than 37K decay, whose beta asymmetry was recently reported Fenker et al. (2018) with the highest relative precision amongst all nuclides.
Unless the ratio of axial-vector and vector form factors for the decay is determined independently (e.g. from a - correlation measurement), a stand alone asymmetry measurement by itself cannot be used to place constraints on allowed values of and . In facing such a scenario for 19Ne decay, one has to resort to the ratio
| (13) |
where s is the averaged value from superallowed Fermi transitions Hardy and Towner (2015).
If one permits the existence of RHCs , then can be expressed as Barry R. Holstein and Treiman (1977)
| (14) |
where are the small recoil-order corrections in Eq. (9). Therefore, it is imperative that both and are known with high precision and accuracy, in order to place meaningful bounds on RHCs. On using the currently determined high-precision value for , we obtain , which is three times more precise than known previously.
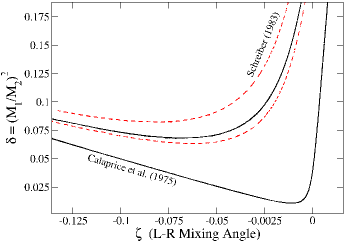
In Fig. 8 we show the 90% CL allowed region in the parameter space, obtained121212We set in this part of the analysis and the next subsection. from a simultaneous fit to and the beta asymmetry measured by Calaprice et al. Calaprice et al. (1975). Despite the fact that the measured from the same experiment yielded a much larger slope than expected, we choose this value of for the following reasons. Firstly, it is the latest (and most precise) published asymmetry measurement for 19Ne decay. Secondly, together with the value in Eq. (IV), the other asymmetry measurements of Refs. Calaprice et al. (1967, 1969); Schreiber (1983); Jones (1996) yield values for the matrix element (c.f. Section. V.3) that are much smaller than expected. Consequently, together with the current Particle Data Group (PDG) recommended values pdg ; M. Tanabashi et al. (2018) (Particle Data Group) for and , these results lead to significant violations of the CKM unitarity condition.131313The extracted values of from the results of Refs. Calaprice et al. (1967); Schreiber (1983); Jones (1996) result in a violation of CKM unitarity by 5 standard deviations or more. The value obtained from the 1969 measurement Calaprice et al. (1969) can also be ruled out as it disagrees with unitarity at the 99.6% CL. For the sake of comparison we also show in Fig. 8 the CL bounds obtained using the most precise reported (unpublished) value of the asymmetry parameter by Schreiber Schreiber (1983). The ratio of the Gamow-Teller to Fermi form factors obtained from this measurement is in almost exact agreement with the independent determinations of Refs. Calaprice et al. (1969); Jones (1996) (c.f. Fig.7). Furthermore, the energy dependence determined from Schreiber’s experiment shows no indication of second-class currents and is also in excellent agreement with the later measurement by Jones Jones (1996). However, despite this consistency, the quoted value from this experiment shows a significantly large signal for RHCs, as apparent in Fig. 8. This should not be surprising, given the CKM unitarity violation mentioned previously. The best fit to these data disagrees with the standard model prediction for no RHCs () at the level. In contrast, the best fit using the result from Ref. Calaprice et al. (1975) deviates from the standard model by only .
In light of the above, we conclude that the systematic effects that might have affected the slope measurement in Ref. Calaprice et al. (1975) did not significantly influence their extraction of the zero kinetic energy intercept value . All the other measured values for the asymmetry (except the lowest precision measurement from 1963) can be ruled out. There has been a recent effort Combs et al. (2016) to reanalyze the data acquired by Ref. Jones (1996), by placing emphasis on positron backscattering and other systematic effects. The results from this reanalysis are expected to be published soon you .
V.3 A determination of
It was implicit in the previous discussion that if one assumes conservation of the vector current, the value in Eq. (IV) determines Naviliat-Cuncic and Severijns (2009) the element of the CKM quark-mixing matrix. The expression to obtain is analogous to neutron decay, where
| (15) |
Here, Hardy and Towner (2015), is the universal Fermi coupling constant Tishchenko et al. (2013), is a nucleus independent electroweak radiative correction Marciano and Sirlin (2006) and . Needless to say, determining in this manner requires an independent correlation measurement to obtain the mixing ratio . We obtain from the measurement of Ref. Calaprice et al. (1975). Using this value of and the value determined in this work, we obtain . This is in reasonable agreement with the high precision value extracted from superallowed Fermi transitions Hardy and Towner (2015).
It should be noted that the radiative correction mentioned above was recently revaluated to be Chien-Yeah Seng et al. (2018) using dispersion relations together with neutrino scattering data. However, incorporating this new result has an insignificant effect on our extracted value for , as the latter’s uncertainty is dominated by the uncertainty contribution from .
V.4 Towards a better understanding of parity violating NN interactions
The ), parity doublet in 19F (shown in Fig. 1) plays an important role in elucidating both the isoscalar and isovector components of parity non-conserving (PNC) hadronic weak interactions Adelberger and Haxton (1985); Haeberli and Barry R. Holstein (1995). It is one of the few cases where the PNC NN interaction admixes the doublet states significantly, on account of the small energy spacing between the levels ( keV) and the absence of other nearby states. This leads to an amplification of the parity violating observable, namely the asymmetry of the 110 keV rays that would be emitted from a polarized ensemble of 19F nuclei in the first excited state. The asymmetry has been measured independently by two groups, whose results are in excellent agreement with each other Adelberger et al. (1983); Elsener et al. (1984). However, these experimental results are approximately three times smaller than shell model predictions Haxton et al. (1980); Brown et al. (1980) that used the ‘best values’ recommended by Desplanques, Donoghue and Holstein Adelberger and Haxton (1985); Haeberli and Barry R. Holstein (1995); Bertrand Desplanques et al. (1980) for the weakly interacting PNC meson-nucleon couplings.
It has been shown that the model dependence in extracting the weak NN amplitudes from the PNC observables can be largely minimized in such cases via measurements of the decay transition rates connecting the isobaric analog of one member of the doublet to the other Adelberger et al. (1983). Here it is the first-forbidden transition in 19Ne decay. In the limit, the forbidden decay matrix element is dominated by the axial-charge operator, and is very similar to the isovector part of the parity mixing matrix element. Therefore, not only does the measured 19Ne decay rate offer a model-independent means to calculate the isovector PNC NN amplitudes, it also allows a useful check of the wavefunctions that are used to analyze the parity mixing in 19F. A previous analysis showed that the calculated decay rate was about 10 times larger than the measured values Adelberger et al. (1981), presumably because of the omission of correlations in the shell model wavefunctions. This would explain the factor of 3 discrepancy between the measured and calculated values of the asymmetry mentioned previously, assuming that the isoscalar contribution of the parity violating matrix element also scales similarly Adelberger et al. (1983). It has been suggested Adelberger et al. (1981, 1983) that a large-basis shell model calculation which includes excitations would resolve this issue.
In light of the above and the recent development of state-of-the-art computational techniques Joseph Wasem (2012); Phillips et al. (2015); Schindler et al. (2016); Wick C. Haxton and Barry R. Holstein (2013); Susan Gardner et al. (2017) to extract elementary PNC amplitudes, we anticipate our high precision measurement of the first-forbidden branch will be useful to constrain future calculations. Together with the high-precision values for the 19Ne half-life and a weighted mean of the results in Table 2, we obtain a first-forbidden transition rate of . On further assuming an allowed spectrum shape141414This is a reasonable approximation as the axial-charge operator is independent of the momentum transferred to the leptons Adelberger et al. (1981, 1983). for the first forbidden transition Adelberger et al. (1981) we determine its value to be s. Our values are roughly two times more precise, yet in agreement with previous measurements.
VI Conclusions
We measured decay branches to excited states in 19F for the first time using a radioactive 19Ne beam. Unlike previous measurements that used reactions on gas targets, our experiment was minimally affected by the source distribution and other associated systematic effects. We obtain high precision values for the transition rates that would be useful for a variety of fundamental symmetry tests that involve 19Ne and 19F nuclei.
Acknowledgements.
We thank Ian Towner for calculating the statistical rate functions. We are also grateful to Alejandro García, Eric Adelberger, Wick Haxton and Dan Melconian for fruitful discussions. This work was partially funded by the National Research Foundation (NRF) of South Africa and the Natural Sciences and Engineering Research Council of Canada (NSERC). PZM thanks the NRF funded MANUS/MATSCI program at UWC/UZ for financial support during the course of her M.Sc. TRIUMF receives federal funding via a contribution agreement through the National Research Council of Canada.References
- Calaprice et al. (1975) F. P. Calaprice, S. J. Freedman, W. C. Mead, and H. C. Vantine, Phys. Rev. Lett. 35, 1566 (1975).
- Carnoy et al. (1992) A. S. Carnoy, J. Deutsch, R. Prieels, N. Severijns, and P. A. Quin, Journal of Physics G: Nuclear and Particle Physics 18, 823 (1992).
- Barry R. Holstein and Treiman (1977) Barry R. Holstein and S. B. Treiman, Phys. Rev. D 16, 2369 (1977).
- Barry R. Holstein (1977) Barry R. Holstein, Phys. Rev. C 16, 753 (1977).
- Hallin et al. (1984) A. L. Hallin, F. P. Calaprice, D. W. MacArthur, L. E. Piilonen, M. B. Schneider, and D. F. Schreiber, Phys. Rev. Lett. 52, 337 (1984).
- Schneider et al. (1983) M. B. Schneider, F. P. Calaprice, A. L. Hallin, D. W. MacArthur, and D. F. Schreiber, Phys. Rev. Lett. 51, 1239 (1983).
- Naviliat-Cuncic and Severijns (2009) O. Naviliat-Cuncic and N. Severijns, Phys. Rev. Lett. 102, 142302 (2009).
- Haxton et al. (1980) W. C. Haxton, B. F. Gibson, and E. M. Henley, Phys. Rev. Lett. 45, 1677 (1980).
- Brown et al. (1980) B. A. Brown, W. A. Richter, and N. S. Godwin, Phys. Rev. Lett. 45, 1681 (1980).
- Adelberger et al. (1983) E. G. Adelberger, M. M. Hindi, C. D. Hoyle, H. E. Swanson, R. D. Von Lintig, and W. C. Haxton, Phys. Rev. C 27, 2833 (1983).
- Adelberger and Haxton (1985) E. G. Adelberger and W. C. Haxton, Ann. Rev. Nucl. Part. Sci. 35, 501 (1985).
- Garnsworthy and Garrett (2014) A. B. Garnsworthy and P. E. Garrett, Hyperfine Interactions 225, 121 (2014).
- Garrett et al. (2015) P. E. Garrett et al., Journal of Physics: Conference Series 639, 012006 (2015).
- Triambak et al. (2012) S. Triambak et al., Phys. Rev. Lett. 109, 042301 (2012).
- Finlay et al. (2008) P. Finlay et al., Phys. Rev. C 78, 025502 (2008).
- Leach et al. (2008) K. G. Leach et al., Phys. Rev. Lett. 100, 192504 (2008).
- Dunlop et al. (2013) R. Dunlop et al., Phys. Rev. C 88, 045501 (2013).
- Sempau et al. (1997) J. Sempau, E. Acosta, J. Baro, J. Fernández-Varea, and F. Salvat, Nucl. Inst. Meth. Phys. Res. B 132, 377 (1997).
- (19) http://www.srim.org/.
- Ziegler et al. (2010) J. F. Ziegler, M. D. Ziegler, and J. P. Biersack, Nucl. Instr. Meth. Phys. Res. B 268, 1818 (2010).
- Iacob et al. (2006) V. E. Iacob, J. C. Hardy, C. A. Gagliardi, J. Goodwin, N. Nica, H. I. Park, G. Tabacaru, L. Trache, R. E. Tribble, Y. Zhai, and I. S. Towner, Phys. Rev. C 74, 015501 (2006).
- Baker and Cousins (1984) S. Baker and R. D. Cousins, Nucl. Instr. Meth. Phys. Res. 221, 437 (1984).
- Ujić et al. (2013) P. Ujić et al., Phys. Rev. Lett. 110, 032501 (2013).
- Fontbonne et al. (2017) C. Fontbonne et al., Phys. Rev. C 96, 065501 (2017).
- Broussard et al. (2014) L. J. Broussard et al., Phys. Rev. Lett. 112, 212301 (2014).
- G.F. Grinyer et al. (2007) G.F. Grinyer et al., Nucl. Instr. Meth. Phys. Res. A 579, 1005 (2007).
- Finlay (2007) P. Finlay, M.Sc. thesis, University of Guelph (2007).
- (28) https://www.physics.uoguelph.ca/Nucweb/theses/paulfinlay_62Ga_mscthesis.pdf.
- Freedman et al. (1975) S. J. Freedman, R. M. Del Vecchio, and C. Callias, Phys. Rev. C 12, 315 (1975).
- Severijns et al. (2008) N. Severijns, M. Tandecki, T. Phalet, and I. S. Towner, Phys. Rev. C 78, 055501 (2008).
- Alburger (1976) D. E. Alburger, Phys. Rev. C 13, 2593 (1976).
- Adelberger et al. (1981) E. G. Adelberger, M. M. Hindi, C. D. Hoyle, H. E. Swanson, and R. D. Von Lintig, Phys. Rev. C 24, 313 (1981).
- Saettler et al. (1993) E. R. J. Saettler, F. P. Calaprice, A. L. Hallin, and M. M. Lowry, Phys. Rev. C 48, 3069 (1993).
- Firestone et al. (1966) R. B. Firestone et al., eds., in Table of isotopes (Wiley, New York, 1966) 8th ed.
- Bambynek et al. (1977) W. Bambynek et al., Rev. Mod. Phys. 49, 77 (1977).
- (36) https://www-nds.iaea.org/amdc/.
- Wang et al. (2017) M. Wang, G. Audi, F. Kondev, W. Huang, S. Naimi, and X. Xu, Chinese Physics C 41, 030003 (2017).
- Hardy and Towner (2015) J. C. Hardy and I. S. Towner, Phys. Rev. C 91, 025501 (2015).
- Triambak et al. (2017) S. Triambak et al., Phys. Rev. C 95, 035501 (2017).
- Grenacs (1985) L. Grenacs, Ann. Rev. Nucl. Part. Sci. 35, 455 (1985).
- (41) I. S. Towner, private communication.
- Barry R. Holstein (1974a) Barry R. Holstein, Rev. Mod. Phys. 46, 789 (1974a).
- Vincenzo Cirigliano et al. (2013) Vincenzo Cirigliano, Susan Gardner, and Barry R. Holstein, Progress in Particle and Nuclear Physics 71, 93 (2013).
- Weinberg (1958) S. Weinberg, Phys. Rev. 112, 1375 (1958).
- Barry R. Holstein and Treiman (1971) Barry R. Holstein and S. B. Treiman, Phys. Rev. C 3, 1921 (1971).
- Barry R. Holstein (1974b) Barry R. Holstein, Phys. Rev. C 9, 1742 (1974b).
- Feynman and Gell-Mann (1958) R. P. Feynman and M. Gell-Mann, Phys. Rev. 109, 193 (1958).
- Commins and Dobson (1963) E. D. Commins and D. A. Dobson, Phys. Rev. Lett. 10, 347 (1963).
- Calaprice et al. (1967) F. P. Calaprice, E. D. Commins, H. M. Gibbs, G. L. Wick, and D. A. Dobson, Phys. Rev. Lett. 18, 918 (1967).
- Calaprice et al. (1969) F. P. Calaprice, E. D. Commins, H. M. Gibbs, G. L. Wick, and D. A. Dobson, Phys. Rev. 184, 1117 (1969).
- Schreiber (1983) D. F. Schreiber, Ph.D. thesis, Princeton University (1983).
- Jones (1996) G. L. Jones, Ph.D. thesis, Princeton University (1996).
- Tribble et al. (1981) R. E. Tribble, D. P. May, and D. M. Tanner, Phys. Rev. C 23, 2245 (1981).
- Tribble and May (1978) R. E. Tribble and D. P. May, Phys. Rev. C 18, 2704 (1978).
- Minamisono et al. (2011) K. Minamisono et al., Phys. Rev. C 84, 055501 (2011).
- Minamisono et al. (2001) K. Minamisono, K. Matsuta, T. Minamisono, T. Yamaguchi, T. Sumikama, T. Nagatomo, M. Ogura, T. Iwakoshi, M. Fukuda, M. Mihara, K. Koshigiri, and M. Morita, Phys. Rev. C 65, 015501 (2001).
- Pati and Salam (1974) J. C. Pati and A. Salam, Phys. Rev. D 10, 275 (1974).
- Senjanović and Mohapatra (1975) G. Senjanović and R. N. Mohapatra, Phys. Rev. D 12, 1502 (1975).
- Shaban and Stirling (1992) N. Shaban and W. Stirling, Physics Letters B 291, 281 (1992).
- Herczeg (2001) P. Herczeg, Progress in Particle and Nuclear Physics 46, 413 (2001).
- Bég et al. (1977) M. A. B. Bég, R. V. Budny, R. Mohapatra, and A. Sirlin, Phys. Rev. Lett. 38, 1252 (1977).
- Paul Langacker and S. Uma Sankar (1989) Paul Langacker and S. Uma Sankar, Phys. Rev. D 40, 1569 (1989).
- Mohapatra and Senjanović (1980) R. N. Mohapatra and G. Senjanović, Phys. Rev. Lett. 44, 912 (1980).
- Branco et al. (1983) G. Branco, J.-M. Frère, and J.-M. Gérard, Nuclear Physics B 221, 317 (1983).
- Carnoy et al. (1988) A.-S. Carnoy, J. Deutsch, and Barry R. Holstein, Phys. Rev. D 38, 1636 (1988).
- Naviliat-Cuncic et al. (1991) O. Naviliat-Cuncic, T. A. Girard, J. Deutsch, and N. Severijns, Journal of Physics G: Nuclear and Particle Physics 17, 919 (1991).
- Fenker et al. (2018) B. Fenker, A. Gorelov, D. Melconian, J. A. Behr, M. Anholm, D. Ashery, R. S. Behling, I. Cohen, I. Craiciu, G. Gwinner, J. McNeil, M. Mehlman, K. Olchanski, P. D. Shidling, S. Smale, and C. L. Warner, Phys. Rev. Lett. 120, 062502 (2018).
- (68) http://pdg.lbl.gov/.
- M. Tanabashi et al. (2018) (Particle Data Group) M. Tanabashi et al. (Particle Data Group), Phys. Rev. D 98, 030001 (2018).
- Combs et al. (2016) D. Combs, F. Calaprice, G. Jones, and A. Young, in APS Division of Nuclear Physics Meeting Abstracts (2016) p. KG.008.
- (71) A. R. Young, private communication.
- Tishchenko et al. (2013) V. Tishchenko et al. (MuLan Collaboration), Phys. Rev. D 87, 052003 (2013).
- Marciano and Sirlin (2006) W. J. Marciano and A. Sirlin, Phys. Rev. Lett. 96, 032002 (2006).
- Chien-Yeah Seng et al. (2018) Chien-Yeah Seng, Mikhail Gorchtein, Hiren H. Patel, and Michael J. Ramsey-Musolf, Phys. Rev. Lett. 121, 241804 (2018).
- Haeberli and Barry R. Holstein (1995) W. Haeberli and Barry R. Holstein, in Symmetries and Fundamental Interactions in Nuclei, edited by W. Haxton and E. Henley (World Scientific, 1995) p. 17.
- Elsener et al. (1984) K. Elsener, W. Grüebler, V. König, P. A. Schmelzbach, J. Ulbricht, D. Singy, C. Forstner, W. Z. Zhang, and B. Vuaridel, Phys. Rev. Lett. 52, 1476 (1984).
- Bertrand Desplanques et al. (1980) Bertrand Desplanques, John F. Donoghue, and Barry R. Holstein, Annals of Physics 124, 449 (1980).
- Joseph Wasem (2012) Joseph Wasem, Phys. Rev. C 85, 022501 (2012).
- Phillips et al. (2015) D. R. Phillips, D. Samart, and C. Schat, Phys. Rev. Lett. 114, 062301 (2015).
- Schindler et al. (2016) M. R. Schindler, R. P. Springer, and J. Vanasse, Phys. Rev. C 93, 025502 (2016).
- Wick C. Haxton and Barry R. Holstein (2013) Wick C. Haxton and Barry R. Holstein, Progress in Particle and Nuclear Physics 71, 185 (2013).
- Susan Gardner et al. (2017) Susan Gardner, W. C. Haxton, and Barry R. Holstein, Ann. Rev. Nucl. Part. Sci 67, 69 (2017).