Influence of anti-site disorder and electron-electron correlations on the electronic structure of CeMnNi4
Abstract
CeMnNi4 exhibits an unusually large spin polarization, but its origin has baffled researchers for more than a decade. We use bulk sensitive hard x-ray photoelectron spectroscopy (HAXPES) and density functional theory based on the Green’s function technique to demonstrate the importance of electron-electron correlations of both the Ni 3 () and Mn 3 () electrons in explaining the valence band of this multiply correlated material. We show that Mn-Ni anti-site disorder as well as play crucial role in enhancing its spin polarization: anti-site disorder broadens a Ni 3 minority-spin peak close to the Fermi level (), while an increase in shifts it towards , both leading to a significant increase of minority-spin states at . Furthermore, rare occurrence of a valence state transition between the bulk and the surface is demonstrated highlighting the importance of HAXPES in resolving the electronic structure of materials unhindered by surface effects.
In recent years, hard x-ray photoelectron spectroscopy (HAXPES) has turned out to be a reliable tool to study the electronic structure of correlated systems, thin films and buried interfaces of materials, thus providing new insights into their physical propertiesFadley10 ; Wocik16 ; Grayandothers . In this work, we present the first study of the electronic structure of CeMnNi4, an interesting material with large spin transport polarization of 66%Singh06 , using HAXPES and density functional theory calculations based on the spin polarized relativistic Korringa-Kohn-Rostoker (SPRKKR) methodEbert . CeMnNi4 has a cubic MgCu4Sn-type structureDhiman07 ; it is ferromagnetic with a magnetic moment of 4.95 and Curie temperature of 140 KSingh06 . These encouraging properties of CeMnNi4 started a flurry of activity aimed at understanding its electronic structureMazin06Voloshina06 ; Lahiri10 ; Bahramy10 . However, no photoemission study of its electronic structure has been reported to date, and the theoretical studies so far have been unable to explain the different aspects of its electronic structure and its spin polarization in particular. The early density functional theory (DFT) calculationsMazin06Voloshina06 reported a spin polarizationp0formula () value of about 16-20; and the much larger experimental polarization was attributed to disorder or non-stoichiometry of the specimens. In fact, in a subsequent x-ray absorption fine structure (XAFS) study, about 6 Mn-Ni anti-site disorder was reportedLahiri10 . The authors also performed a DFT calculation using the pseudopotential method as implemented in the VASP code including an ordered anti-site defect configuration of nearest neighbour Ni and Mn that were site-exchanged. Thus, in this approach, the effect of randomly disordered anti-site defects is not taken into account. Their results however showed a significant increase in , which was not related to disorder, but rather to enhanced minority spin states of the site-exchanged Mn 3 partial density of states (PDOS) due to hybridization with neighboring Ni atomLahiri10 . On the other hand, another DFT calculation that considered electron-electron correlation of the Mn 3 electrons () but no anti-site defect showed that increases with Bahramy10 . In the absence of any photoemission study and its direct comparison with theory that addresses the influence of both anti-site disorder and correlation, their role in determining the electronic structure and spin polarization of CeMnNi4 has remained an unresolved question until date.
In this letter, we show that both anti-site disorder and electron-electron correlations for Ni 3 () and Mn 3 () electrons have a crucial influence on the bulk electronic structure of CeMnNi4. In addition, since is typically taken to be about 7 eV in Ce intermetallicsImer87 , CeMnNi4 can be regarded as a multiply correlated system, further complicated by the presence of inherent disorderLahiri10 . and are responsible for determining the energy positions of the peaks in the valence band (VB) and their optimum values (= 4.5 eV, = 6.5 eV) are obtained by the best agreement between theoretically calculated and the experimental HAXPES VB. A surprising result is that the large of CeMnNi4 has two origins: the anti-site disorder () and . The former broadens a minority spin Ni 3 peak close to , while the latter shifts it towards . Thus, in both cases, the minority spin total DOS at (()) increases, while the majority spin total DOS (()) remains essentially unchanged, resulting in a clear enhancement of . The total magnetic moment exhibits contrasting variation: a decrease with and an increase with .
Furthermore, rare occurrence of a valence state transition on the surface of a ternary material is demonstrated: a bulk mixed valent state transforms to a nearly trivalent Ce3+ state due to the weakened hybridization on the surface.
Experimental and computational methods: HAXPES measurements were performed at the P09 beamline in PETRA III synchrotron center, Germany on polycrystalline CeMnNi4 ingot that was cleaved under ultra high vacuum at 210-8 mbar pressure to expose a fresh surface. The spectra were recorded by using Phoibos 225 analyzer with 30 eV pass energy at 50 KAndrei . Photons were incident on the sample at a grazing angle (10∘) and the photoelectrons were collected in the nearly normal emission geometry. The total instrumental resolution (including both source and analyzer contributions), obtained from the least square fitting of the Au Fermi edge in electrical contact with the specimen, is 0.26 eV. CeMnNi4 ingot was prepared by an arc melting method and characterized for its structure using x-ray diffraction, as discussed in Ref. Singh06, .
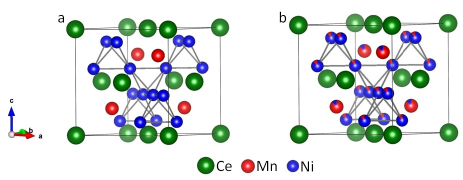
The bulk ground state properties of CeMnNi4 have been calculated in symmetry using the experimental lattice parameter (= 6.9706Å) as determined by neutron powder diffraction at 17 KDhiman07 . Disordered Mn-Ni anti-site defects have been considered by setting the 16 site occupations to 1-0.25 for NiNi and 0.25 for MnNi, while the occupancies at the 4 site were set to for MnMn and for NiMn, where XZ refers to a X atom at a Z atom site (X, Z= Ni, Mn). Here, quantifies the amount of anti-site disorder as the fraction of Mn atoms occupying the Ni sites. In this work, we have varied from 0 to 0.12. The structures are shown in Fig. S1 of SM.
Self-consistent band structure calculations were carried out using fully relativistic SPRKKR method in the atomic sphere approximationEbert . The exchange and correlation effects were incorporated within the generalized gradient approximation framework.Perdew96 The electron-electron correlation has been taken into account as described in the LSDA+U schemeEbert03 . The parameters of screened on-site Coulomb interaction for all the components (, and ) have been varied up to 7 eV, with the exchange interaction fixed at 0.8 eV. The static double counting of LSDA+U approach has been corrected using the atomic limit scheme. The angular momentum expansion up to = 4 has been used for each atom. The energy convergence criterion and coherent potential approximation tolerance has been set to 10-5 Ry. Brillouin zone integrations were performed on a 363636 mesh of -points in the irreducible wedge of the Brillouin zone. We have employed Lloyd’s formula, which provides an accurate determination of the Fermi level and density of statesLlyod . For calculating the angle integrated VB spectrum, all the PDOS contributions from s, p, d and f states of Ce, Mn and Ni were multiplied with their corresponding photoemission cross-sectionsYeh85 and then added. This is multiplied by the Fermi function and convoluted with the instrumental resolution and an energy dependent lifetime broadening 0.01(-)Barman95 to obtain the VB.
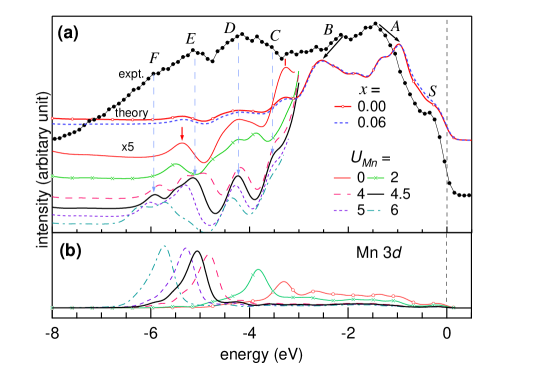
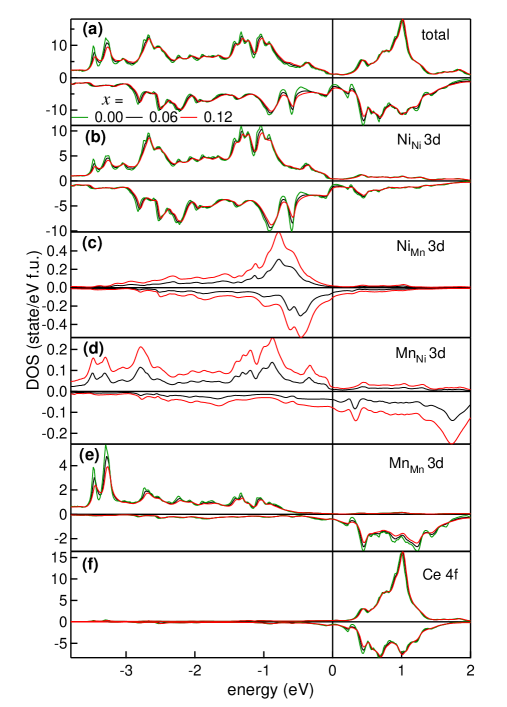
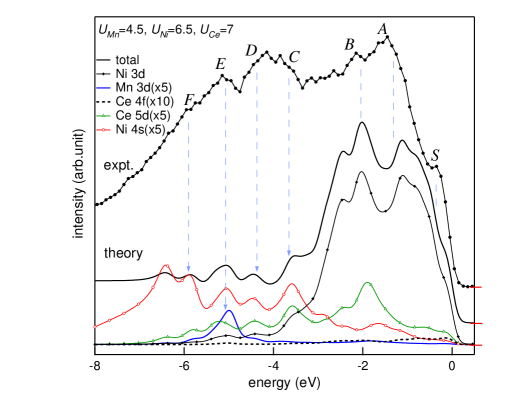
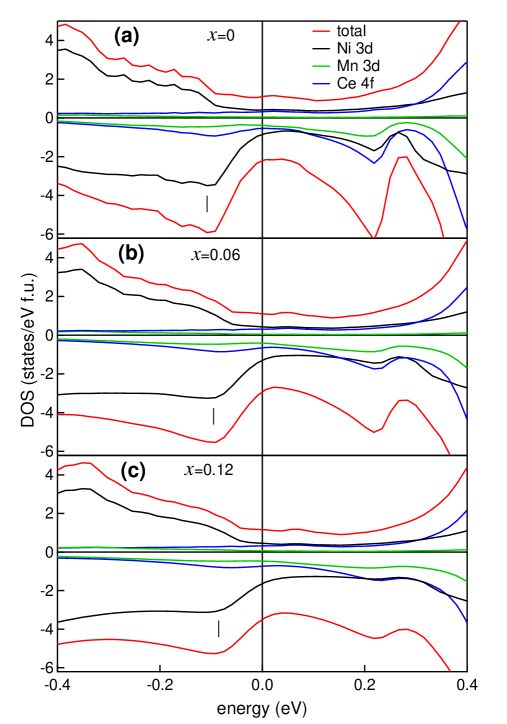
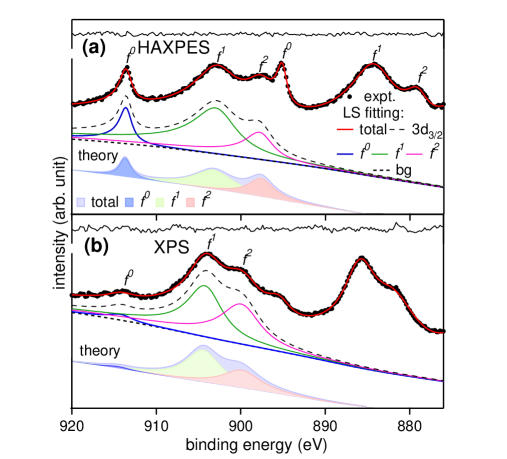
Valence band of CeMnNi4: The VB spectrum recorded with 8 keV photon energy at 50 K shows a step () close to at -0.4 eV; peaks at -1.5 (), -2.2 (), -3.6 (), -4.2 (), -5.2 eV () and a weak shoulder at -6 eV () (Fig. 1(a)). In order to ascertain their origin and study the influence of disorder on the spectral shape, we have calculated the VB spectra without (red line with open circles, = 0) and with 6% Mn-Ni anti-site disorder (blue dashed line, = 0.06). 6% disorder is considered because a previous XAFS studyLahiri10 inferred a disorder of this magnitude on a specimen that was prepared by the same procedure as ours. As discussed above, the VB has been calculated from the partial DOS (PDOS) in Fig. S2. We find that disorder results in a small but finite broadening of the VB, but it has no effect on the position of the peaks. Comparison of the calculated VB with HAXPES shows glaring differences: the peaks corresponding to and (black arrows) are positioned at higher and lower energies, respectively and thus their separation (1.6 eV) is significantly larger compared to experiment (0.7 eV). The peak at -5.4 eV (red arrow) is shifted peak of the experimental VB, the peak at -3.3 eV (red tick) appears at a dip, while there is no peak in the theory corresponding to (see the blue dashed arrows). In Fig. S2, DOS calculated with disorder up to = 0.12 ( 12% aniti-site disorder) show increased broadening, but the positions of all the peaks remain unchanged.
Thus, it is obvious from the above discussion that disorder is unable to explain the VB. So, we examine the possible role of correlation starting with . As is increased, interesting modifications in the -3 to -6 eV region is observed in Fig. 1(a), which are primarily related to the systematic changes in the Mn 3 PDOS (Fig. 1(b) and PDOS in Fig. S3). At = 0, the Mn 3 states are delocalized over 0 to -5 eV with the most intense peak at -3.3 eV. Increase of narrows the Mn 3 PDOS, the peak intensity increases and it shifts by a large amount to lower energies i.e. away from ( -5.2 eV for = 4.5 eV). The best agreement with experiment in the -3 to -6 eV region is obtained for = 4.5 eV (black line), where the peaks at -3.6, -4.2, -5.2 and -6 eV appear at the same positions as , , , and , respectively of the experimental VB, as shown by the blue dashed arrows in Fig. 1(a). The Mn 3 states contribute primarily to the peak , however, its intensity is relatively less due to smaller photoemission cross-section of Mn 3 with respect to Ni 3 at 8 keVYeh85 .
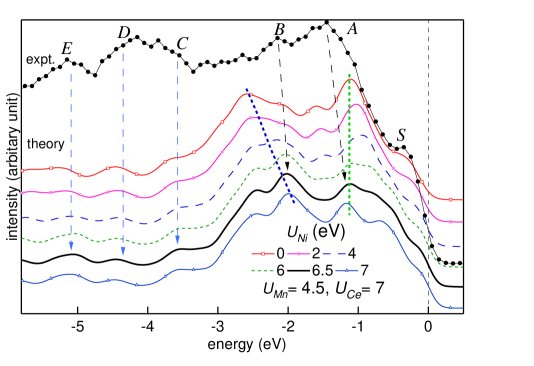
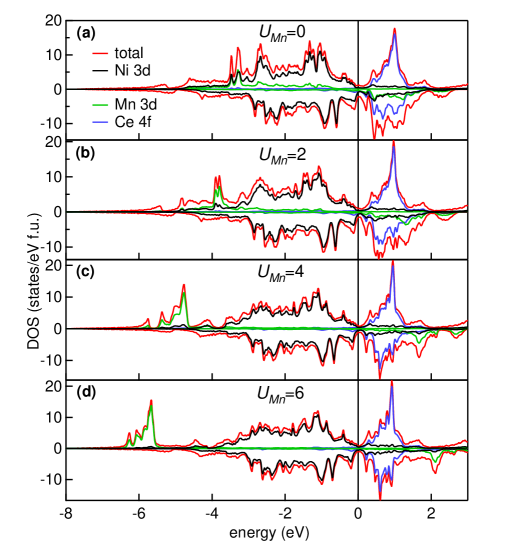
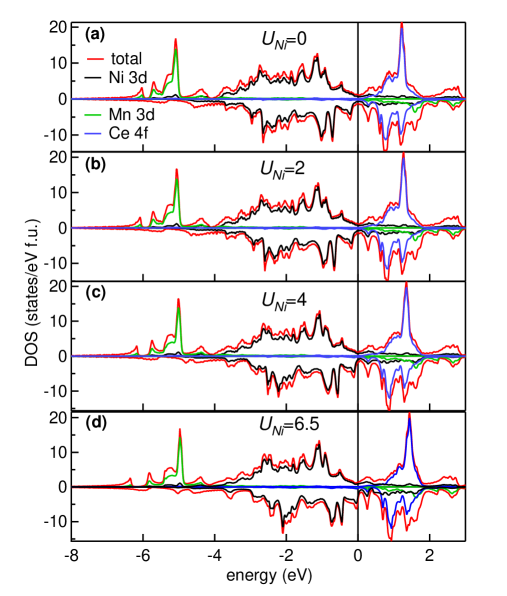
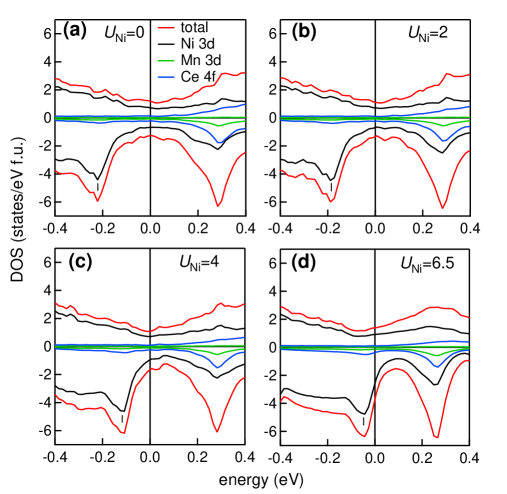
Although = 4.5 eV provides a good agreement for peaks -, the positions of the peaks and are not well reproduced, and these remain unaltered with (Fig. S3). It is evident that and originate primarily from Ni 3 states, and so we calculate the VB by introducing , with fixed at 4.5 eV. We find that as increases, the peak at -2.6 eV shifts to higher energy i.e. towards (blue dashed line) and appears close to the position of peak for = 6.5 eV (Fig. 2, see Fig. S4 for PDOS). On the other hand, the peak at -1.1 eV initially shifts to higher energies and eventually shifts back to lower energy (green dashed line) towards peak . The separation of these two peaks is lowest (0.8 eV) at = 7 eV. However, for = 7 eV, a new peak appears at -0.7 eV in disagreement with experiment. Thus, we conclude that the best agreement is observed for = 6.5 eV, where the positions as well as the separation (0.9 eV) of the calculated peaks agree well with and (black dashed arrows in Fig. 2). Note that the peaks in the -3 to -6 eV region are hardly affected by .
It is to be noted that in Fig. 2 we also consider a value of (= 7 eV) for the Ce 4 electrons that is generally observed in Ce intermetallic compoundsImer87 . However, does not have any discernible effect on the occupied states and the VB, since the Ce 4 peak appears mostly above at 0.9 eV for = 0 (Fig. S3(c)) and shifts to higher energy (1.2 eV) for = 7 eV (Fig. S4(a)). Thus, due to the significant variation of Ni and Mn 3 states with and , respectively and taking from literatureImer87 , we are able to determine the optimum values of for CeMnNi4 to be: = 4.5 eV, = 6.5 eV and = 7 eV (referred henceforth as ). The partial contributions of the different PDOS to each of the peaks in the VB for are shown in Fig. S5 of SM.
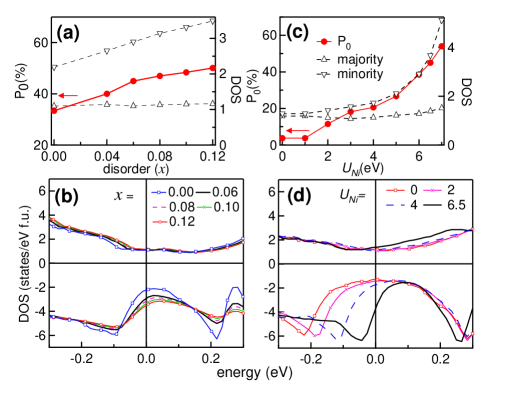
Spin polarization and magnetic moments: We find that the Mn-Ni anti-site disorder has an unexpected positive effect on the spin polarization (). As shown in Fig. 3(a) and Table I of SM, exhibits a monotonic increase with , reaching a value of 45% (50%) for = 0.06 (0.12). This is an important result since in half metals and Heusler alloys, a low experimental value of is generally attributed to disorderhm . In order to understand the reason for this unusual behavior, we show the spin polarized total DOS around in Fig. 3(b). A peak in the minority spin DOS close to at -0.1 eV progressively broadens and also shifts by a small amount ( 15 meV) towards resulting in increase of () with . On the contrary, the structureless majority spin DOS and consequently () remain almost unchanged. Thus, this contrasting behavior of () and () brings about the increase of with (Fig. 3(a)). Table I of SM defines and shows the partial contributions from Ni 3 (), Mn 3 () and Ce 4 () PDOS to for different , and we find that increases solely because of . This is also confirmed in Fig. S6 where the peak in the minority spin DOS is clearly dominated by Ni 3 PDOS (black tick).
Turning to the influence of on (Fig. 3(c)), we find that it increases with from about 3.8% for (4.5,0,7) to 45% for = 6.5 eV for the optimum (4.5,6.5,7). This is related to increase of () due to a significant shift of the minority spin total DOS peak towards from -0.2 to -0.05 eV (Fig. 3(d)). Clearly the total DOS is dominated by Ni 3, black ticks in Fig. S7 show how the minority spin Ni 3 PDOS peak shifts with . In contrast, the majority spin total DOS is structureless and () remains almost unchanged (Fig. 3(c,d)). The partial contributions to for different clearly show that the increase in is entirely due to (Table I of SM).
Due to disorder, the Ni 3 minority spin peak will broaden and also possibly shift by small amount towards and thus significantly increase () because of its proximity to ( at -0.05 eV for (4.5,6.5,7)). On the other hand, () would remain unchanged due to the nearly flat nature of the majority spin total DOS. Thus, disorder would further increase , and assuming that its effect is independent of , we estimate for (4.5,6.5,7) to increase from 45% to 55% (60%) for = 0.06 (0.12). This is in good agreement with the experimental value of 66%, given the fact that the measurements were performed in the diffusive limitSingh06 and here we calculate the static spin polarization.
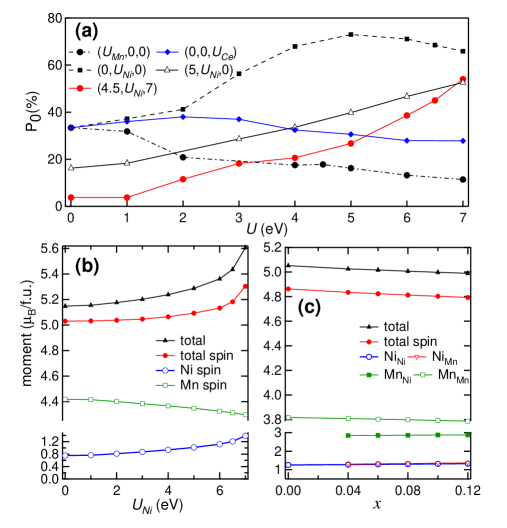
We have also studied how and affects and find that both have detrimental effect: in Fig. 4(a), (,0,0) shows a decrease from 33.4% to 11.4% with varying from 0 to 7 eV. In comparison, the effect of is milder with (0,0,) decreasing from 33.4% to 28%. If and are set to 0, increases to a large value of 66% for = 7 eV for (black filled squares in Fig. 4(a)). On the other hand, a comparison of () for (0,,0), (5,,0), (4.5,,7) shows that the extent of increase of is clearly arrested when and are non-zero. These results refute an earlier counterintuitive reportBahramy10 , which concluded that increases , while neither nor have any influence on (see Supplementary discussion SD1).
The calculated magnetic moments show that the total moment of CeMnNi4 is quite large 5.43 for , the main contribution coming from the Mn spin moment (4.31 ). Fig. 4(b) shows that both the total moment as well as the Ni spin moment increase with , for the total moment (Ni spin moment) is 5.15 (0.19) , whereas for it is 5.43 (0.3) . The increase in the Ni spin moment is because of the shift of the Ni 3 minority spin states towards (Fig. 3(d)) resulting in a decrease of the integrated occupied minority spin PDOS, while the majority spin PDOS remains largely unchanged. It may be noted that the total moment of 5.43 for is somewhat overestimated compared to the experimental value of 4.95 from magnetization measurement at 5 KSingh06 .
Interestingly, we find that the total magnetic moment decreases with increasing disorder (Fig. 4(c)). This can be ascribed to the difference of the MnNi (Mn atom in Ni position) and MnMn (Mn atom in Mn position) 3 spin-polarized PDOS, the latter having considerably reduced exchange splitting (Fig. S2). This difference is related to the change in hybridization due to different nearest neighbor configurations (Fig. S1). The local moment of MnNi is thus substantially smaller (2.8 ) compared to MnMn (3.8 ). Although the local moments hardly vary, the proportion of MnNi increases with , resulting in a decrease of the total moment. Thus, it can be argued that the overestimation of the total moment by theory with (4.5,6.5,7) mentioned above could be somewhat compensated by its decrease caused by anti-site disorder.
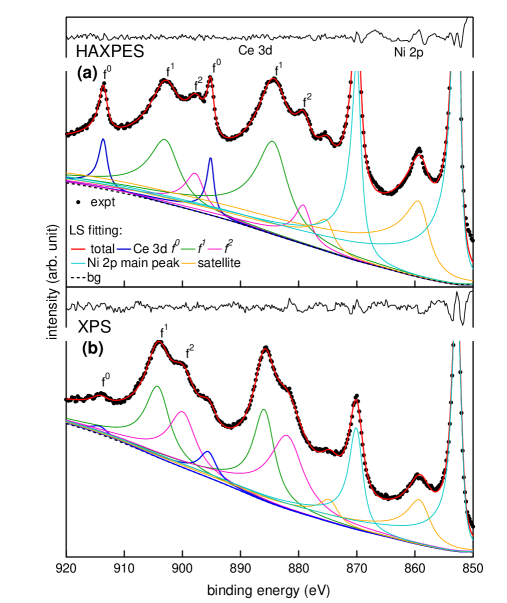
An additional interesting outcome of our study is the demonstration of a valence state transition a change of the valency of Ce between the bulk and the surface. Valence state transition could significantly alter the surface electronic structure compared to the bulk. It was first reported in Sm metalWertheim78 and later in binary Ce intermetallic compoundsLaubschat90 . From the analysis of the Ce 3 core-level spectra using HAXPES and XPS and using a simplified version of the Anderson single-impurity modelGunnarsson83 proposed by Imer and Wuilloud (IW)Imer87 , we show that the Ce 4 occupancy in the ground state () turns out to be 0.8 in the bulk, indicating a mixed valent state with 20% Ce in (Ce4+) while 80% in (Ce3+) configuration, where and are the satellite peaks in the Ce 3 spectrum related to 34 and 34 final states, respectivelyHillebrecht82 ; Fuggle83 . In contrast, from the surface sensitive Ce 3 XPS spectrum, increases to 0.98 and thus the surface has predominantly 34 (Ce3+) ground state. Thus, in the bulk, the Ce 4 electron transfers to the valence states comprising primarily of Ni 3 states making CeMnNi4 a mixed valent system with 4 occupancy of = 0.8. However, at the surface, the reduced hybridization between the Ce 4 and unsaturated 3 states results in a lowering of the Ce 4 states further below . This increases the occupancy of the Ce 4 level (= 0.98) and results in the valence state transition. The detailed discussion on the valence state transition and comparison with surface sensitive XPS is provided in the Supplementary discussion SD2.
In conclusion, we settle the long standing debate about the electronic structure of CeMnNi4. We establish the importance of both anti-site disorder and electron-electron correlation in explaining its intriguing properties. Our work fundamentally alters the general notion that anti-site disorder is detrimental for spin polarization. We hope it will motivate further experimental work on CeMnNi4 and related materials, mainly because disorder could be controlled and further enhanced. We find that the total magnetic moment exhibits contrasting behaviour, it decreases with , but increases with . A valence state transition that originates due to the weakened hybridization on the surface is demonstrated. Our study highlights the power of HAXPES in combination with density functional theory for clarifying the electronic structure and properties of multiply-correlated materials with inherent anti-site disorder.
Acknowledgments: The experiments were carried out at PETRA III of Deutsches Elektronen-Synchrotron, a member of Helmholtz-Gemeinschaft Deutscher Forschungszentren. Financial support by the Department of Science and Technology, Government of India within the framework of India@DESY collaboration is gratefully acknowledged. We would like to thank W. Drube and C. Narayana for support and encouragement. S.W.D. gratefully acknowledges the financial support from CEDAMNF project (CZ.02.1.01/0.0/0.0/15-003/0000358), New Technologies Research Centre, University of West Bohemia, Czech Republic. A.C. thanks P.A. Naik, A. Banerjee for support and encouragement and the Computer Centre of RRCAT, Indore for providing the computational facility for a part of the work.
∗,aPresent addresseses: ∗New Technologies Research Centre, University of West Bohemia, Univerzitní 8, CZ-306 14 Pilsen, Czech Republic; aDepartment of Physics, Indian Institute of Technology Delhi, Hauz Khas, New Delhi 110016, India
References
- (1) C. S. Fadley, J. Electron. Spectros. Relat. Phenom. 178–179, 2 (2010); K. Kobayashi, Nuc. Instrum. Meth. Phys. Res. A 601, 32 (2009).
- (2) Hard X-ray Photoelectron Spectroscopy, ed. J. C. Woicik, Springer Series in Surface Sciences vol. 59 (Springer International Publishing, Switzerland, 2016).
- (3) A. X. Gray et al, Nat. Mater. 10, 759 (2011); Nat. Mater. 11, 958 (2012); Phys. Rev. Lett. 108, 257208 (2012); J. Nayak et al., Phys. Rev. Lett. 109, 216403 (2012); T. Ohtsuki et al., Phys. Rev. Lett. 106, 047602 (2011); M. Sing et al., Phys. Rev. Lett. 102, 176805 (2009).
- (4) S. Singh, G. Sheet, P. Raychaudhuri, and S. K. Dhar, Appl. Phys. Lett. 88, 022506 (2006).
- (5) H. Ebert, D. Kdderitzsch, J. Minr, Rep. Prog. Phys. 74, 096501 (2011).
- (6) I. Dhiman, A. Das, S. K. Dhar, P. Raychaudhuri, S. Singh, P. Manfrinetti, Solid State Comm. 141, 160 (2007).
- (7) I. Mazin, Phys. Rev. B 73, 012415 (2006); E. N. Voloshina, Y. S. Dedkov, M. Richter and P. Zahn, Phys. Rev. B 73, 144412 (2006).
- (8) D. Lahiri, S. Khalid, P. Modak, P. Raychaudhuri, S. K. Dhar, and S. M. Sharma, Phys. Rev. B 82, 134424 (2010).
- (9) M. S. Bahramy, P. Murugan, G. P. Das, and Y. Kawazoe, Phys. Rev. B 81, 165114 (2010).
- (10) = ()-()]/[()+(.
- (11) J. -M. Imer and E. Wuilloud, Z. Phys. B Condens. Matter 66, 153 (1987).
- (12) A. Gloskovskii, G. Stryganyuk, G. H. Fecher, C. Felser, S. Thiess, H. Schulz-Ritter, W. Drube, G. Berner, M. Sing, R. Claessen, and M. Yamamoto, J. Electron Spectrosc. Relat. Phenom. 185, 47 (2012).
- (13) J. P. Perdew, K. Burke, M. Ernzerhof, Phys. Rev. Lett. 77, 3865 (1996).
- (14) H. Ebert, A. Perlov, S. Mankovsky, Solid State Commun. 127, 443 (2003).
- (15) P. Lloyd, Proc. Phys. Soc. 90, 207 (1967); P. Lloyd, P. V. Smith Adv. Phys. 21, 69 (1972); R. Zeller, J. Phys.: Condens. Matter 20, 035220 (2008).
- (16) J. J. Yeh, I. Lindau, Atomic Data Nucl. Data Tables 32, 1 (1985).
- (17) A. Fujimori, F. Minami, Phys. Rev. B 30, 957 (1984); S. R. Barman, D. D. Sarma, Phys. Rev. B 51, 4007 (1995).
- (18) K. zdoan, E. Sasiolu, B. Aktas, I. Galanakis, Phys. Rev. B 74, 172412 (2006); Y. Miura, K. Nagao, and M. Shirai, Phys. Rev. B 69, 144413 (2004).
- (19) G. K. Wertheim and G. Crecelius, Phys. Rev. Lett. 40, 813 (1978); B. Johansson, Phys. Rev. B 19, 6615 (1979).
- (20) C. Laubschat, E. Weschke, C. Holtz, M. Domke, O. Strebel, and G. Kaindl, Phys. Rev. Lett. 65, 1639 (1990).
- (21) O. Gunnarsson and K. Schönhammer, Phys. Rev. B 28, 4315 (1983).
- (22) F. U. Hillebrecht and J. C. Fuggle, Phys. Rev. B 25, 3550 (1982).
- (23) J. C. Fuggle, F. U. Hillebrecht, Z. Zolnierek, R. Lsser, Ch. Freiburg, O. Gunnarsson, K. Schnhammer, Phys. Rev. B 27, 7330 (1983).
- (24) S. Doniach and M. Šunjić, J. Phys C 3, 287 (1970).
- (25) S. Tougaard, Surf. Sci. 216, 343 (1989).
- (26) M. Yano, A. Sekiyama, H. Fujiwara, Y. Amano, S. Imada, T. Muro, M. Yabashi, K. Tamasaku, A. Higashiya, T. Ishikawa, Y. nuki, and S. Suga, Phys. Rev. B 77, 035118 (2008).
- (27) M. Sundermann, F. Strigari, T. Willers, J. Weinen, Y. F. Liao, K. -D. Tsuei, N. Hiraoka, H. Ishii, H. Yamaoka, J. Mizuki, Y. Zekko, E. D. Bauer, J. L. Sarrao, J. D. Thompson, P. Lejay, Y. Muro, K. Yutani, T. Takabatake, A.Tanaka, N. Hollmann, L. H. Tjeng, A. Severing, J. Electron Spectros. Relat. Phenom. 209, 1 (2016).
- (28) S. Tanuma, C. J. Powell, and D. R. Penn, Surf. Intf. Anal. 43, 689 (2011).
Supplementary material to the paper entitled:
Influence of anti-site disorder and electron-electron correlations on the electronic structure of CeMnNi4
Pampa Sadhukhan1,†, Sunil Wilfred D′Souza1,†∗, Vipin Kumar Singh1, Rajendra Singh Dhaka1a, Andrei Gloskovskii2, Sudesh Kumar Dhar3, Pratap Raichaudhuri3, Ashish Chainani4, Aparna Chakrabarti5, Sudipta Roy Barman1
†Both the authors have contributed equally to this work.
This Supplementary material contains seven figures (S1 to S7), two tables (TABLE-I and II) and two Supplementary discussions (SD1 and SD2, which include figures S8-S13 ).
= ()-()]/[()+(,
where () is the majority spin total DOS at and () is the minority spin total DOS at . The partial contributions to from an X PDOS () where X= Ni, Mn or Ce; =3-6; = or is given by
= ()-()]/[()+(,
where () is the majority spin X PDOS at and () is the minority spin X PDOS at . Note that = , when all possible X, , are considered.
| Mn-Ni anti-site disorder | Ni 3 electron-electron correlation | ||||||||
| (%) | (%) | (%) | (%) | (%) | (%) | (%) | (%) | ||
| 0 | 33.4 | 13.4 | 10.4 | 7 | 3 | 18.2 | 4.9 | 3.3 | 5.8 |
| 0.04 | 40 | 18.6 | 9.2 | 7.5 | 4 | 20.6 | 9.1 | 3.2 | 5.2 |
| 0.06 | 45 | 21.4 | 9.1 | 8.4 | 5 | 26.7 | 15 | 3 | 5.2 |
| 0.08 | 47 | 23.1 | 9.2 | 9.3 | 6 | 38.6 | 25.3 | 2.7 | 5.6 |
| 0.10 | 48.4 | 24.3 | 8.8 | 8.9 | 6.5 | 45 | 32.2 | 2.4 | 5.4 |
| 0.12 | 50.1 | 25.3 | 8.8 | 9 | 7 | 54 | 42 | 2 | 5.2 |
I Supplementary Discussions
I.1 SD1: Discussion on the spin polarization reported in Ref. 9
Bahramy Bahramy10 found the cubic phase of CeMnNi4 to be stable when is turned on and reported that the Mn 3 states shift to lower energies with . We also find similar behavior of the Mn 3 states. However, the authors also reported that the static spin polarization () increases substantially with , and commented that or have no effect on or any other ground state properties. This is not in agreement with the spin polarization results we obtain here and so we discuss below the possible reason for this.
, being proportional to the difference of () and (), is highly sensitive to any small change of the DOS at . So, it is very unlikely that the states at that are dominated by Ni 3 PDOS will not be influenced by , whose value (6.5 eV) we find to be larger than (4.5 eV) from the comparison of the experimental HAXPES VB with DFT calculations performed by us using SPRKKR. Our results clearly show that has large influence on both the position of the VB peaks and (Fig. 2 of MS) as well as the DOS close to (Fig. 3(d)). This leads to large increase of (Fig. 3b, Fig. S7 and Table I).
On the other hand, the spin polarized DOS near with was not shown in Ref.Bahramy10, . Fig. 4(b,c) of that work shows the total and , , and PDOS for =0 and 6 eV. Based on this figure the authors conclude that increases from 10% to 30% with increasing from 0 to 6 eV. We have analyzed this figure critically and find that the increase in in Ref. Bahramy10, is due to an unusual variation of Ce 4 PDOS at for = 6. In their calculation, Ce 4 PDOS at has a value of 0.3 for the minority spin, whereas in the majority spin PDOS it is largely reduced to 0.02. Thus, increase in to 30% for = 6 eV results primarily from the variation of the Ce 4 spin polarized states. Thus, we find (defined in Table I of SM) increases from 7.9% to 30%, a whopping 380% increase, while increases from 10 to 30%. Thus at = 6 eV, the whole spin polarization is contributed by Ce 4 states only.
The above discussed effect of on and Ce 4 states is unlikely, since the Mn atom is surrounded by the Ni atoms and Ce is only the second nearest neighbor at a large distance of 3.02Å. Rather, one would expect that the Ni 3 states that are dominant at would contribute to , but between Fig. 4(b) and Fig. 4(c) of Ref. Bahramy10, , the 3 states hardly change (for =0 these are 0.3 and 0.5 states/eV for majority and minority spin, respectively and for = 6 eV these are 0.2 and 0.4 states/eV for majority and minority spin, respectively). Thus, strangely, spin polarization due to the 3 states remains essentially similar (= 13% for = 0 and = 16% = 6 eV). Thus, while increases by 380%, hardly changes. This seems to be an unphysical result.
We find that the increase of for both anti-site disorder () as well as electron-electron correlation of the Ni 3 electrons () is primarily due to the changes in the Ni 3 PDOS. Table I of SM clearly shows how only increases as , while and remain almost unchanged and thus do not play any role in the enhancement of .
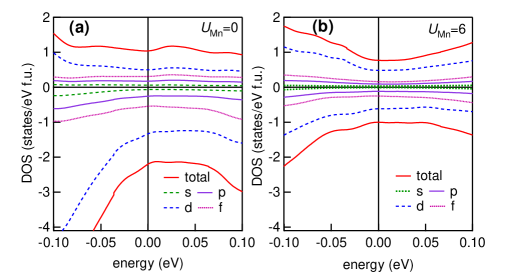
For comparison with Ref. Bahramy10, , in Fig. S8, we show the total and PDOS with =6 eV, with = =0. We find that decreases from 33.4% to 13.2% with varying from 0 to 6 eV (Fig. 4(a) in MS). It is evident that the total PDOS is less than the total PDOS over the entire range and most importantly remains similar between =0 and = 6 eV. Thus, is almost unchanged (rather decreases slightly) from 7.3% to 5.3% from = 0 to 6 eV. This is in stark disagreement with the 380% increase of that can be concluded from Ref. Bahramy10 .
I.2 SD2: Surface valence transition
The Ce 3 core-level spectrum displays two sets of triplet peaks corresponding to the spin-orbit split components (Fig. S9). The most intense among the triplet peaks is the satellite associated with a poorly screened 34 final state occurring at 902.8 eV and 884.4 eV binding energies. The two additional satellite peaks that occur at relatively higher and lower binding energies are referred to as and , respectively. The well screened satellite has an extra screening electron with 34 final state, while the satellite is related to 34 final stateHillebrecht82 ; Fuggle83 . Notable in Fig. S9 is the large
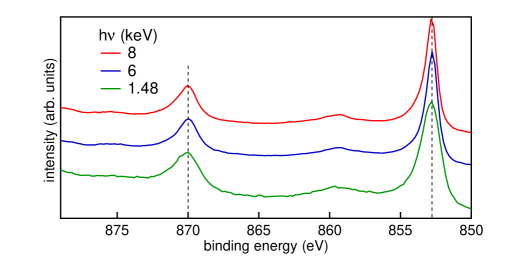
intensity in HAXPES, which decreases drastically in soft x-ray PES (XPS). In order to extract quantitative information, the Ce 3 core-level spectra were fitted using a least square error minimization routine with each peak assigned a Doniach and unji (DS) line shapeDoniach70 . This was further convoluted with a Gaussian function of fixed width to represent the instrumental broadening. Since Ni 2 that appears close in binding energy to Ce 3 might contribute to the intensity in the Ce 3 region, the Ni 2 main and satellite peaks were also included in the fitting scheme. The whole region including Ni 2 along with the components is shown in Fig. S10. A total 10 DS line shapes were used, 6 for Ce 3 comprising of the three components for each spin-orbit (s.o.) peaks and 4 for Ni 2 representing the main peak and satellite for both the s.o. components. The parameters defining each DS line shape are the intensity, position, width () and asymmetry parameter (). A Touguaard background was also included in the fitting scheme, where the parameter was varied and the parameter was kept fixed at 1643 eV2Tougaard89 . Thus, a total of 35 parameters defined the full spectral shape including Ce 3 and Ni 2. However, some reasonable constraints were needed, for example (i) the life time broadening of for Ce 3 was constrained to be greater than or equal to for Ce 3, (ii) was kept equal for all Ce 3 DS components, (iii) for XPS fitting, the satellites of Ni 2 have same width as HAXPES.
From the least square fitting, we find that the normalized intensity of () is 0.15 for HAXPES, where = /) (Table II of SM). Such large intensity of having almost similar height as is unusual and has not been observed in other Ce based intermetallic compoundsYano08 ; Sundermann16 . In contrast, is an order of magnitude less (0.04) in XPS. This could be related to the bulk sensitivity of HAXPES with mean free path () of 91 Å for Ce 3 electrons while XPS is surface sensitive with = 13 Åtpp2m . In order to understand the differences between the above discussed bulk and surface Ce 3 spectra, we turn to a simplified version of the Anderson single-impurity modelGunnarsson83 proposed by Imer and Wuilloud (IW), where the extended valence states are considered as a band of infinitely narrow widthImer87 . The Ce 3 spectrum is calculated as a function of the energy of the unhybridized state relative to (), Coulomb repulsion between 4 electrons at the same site (), Coulomb attraction between 4 electron and the final-state core hole (), and hybridization between the 4 states and the conduction band ().
| h | PES experiment | IW theory | |||||||
|---|---|---|---|---|---|---|---|---|---|
| (keV) | 0.2 | 0.4 | |||||||
| 8 | 0.150.01 | 913.5 | 0 | 0.15 | 0 | ||||
| 0.60.1 | 902.8 | 10.7 | -1.0 | 1.5 | 10 | 0.53 | 10.5 | ||
| 0.250.1 | 897.8 | 15.7 | 0.32 | 16.1 | |||||
| 1.48 | 0.040.01 | 914.3 | 0 | 0.04 | 0 | ||||
| 0.50.1 | 904.1 | 10.2 | -2.5 | 1.1 | 8 | 0.62 | 10.1 | ||
| 0.450.1 | 899.9 | 14.4 | 0.34 | 14.7 | |||||
The above mentioned parameters are varied such that the satellites of the calculated Ce 3 spectrum have similar intensities () and energy separations between and (), as obtained from the fitting of the experimental spectra. For example, besides the large change in (), the binding energies of the satellites are lower in HAXPES (this is not due to recoil effectFadley10 , see Fig. S11), resulting in different as shown in Table II.
In order to simulate the Ce 3 HAXPES spectra using IW theory, we note that () increases sensitively with , and so this parameter is varied keeping the others fixed at the values suggested for Ce compounds (= 1.5 eV, = 7 eV, = 10 eV)Imer87 . For = -1 eV, we find ()= 0.15 in excellent agreement with experiment; and the other quantities such as , () and () are also in good agreement (Table II). The calculated spectrum obtained with = -1 eV, = 1.5 eV, = 7 eV, = 10 eV is shown at the bottom of Fig. S9(a), where the satellites have been broadened by their respective widths obtained from the fitting and a backgroundTougaard89 has also been added. The occupancy in the ground state () turns out to be 0.8, indicating a mixed valent state with 20% Ce in (Ce4+) while 80% in (Ce3+) configuration.
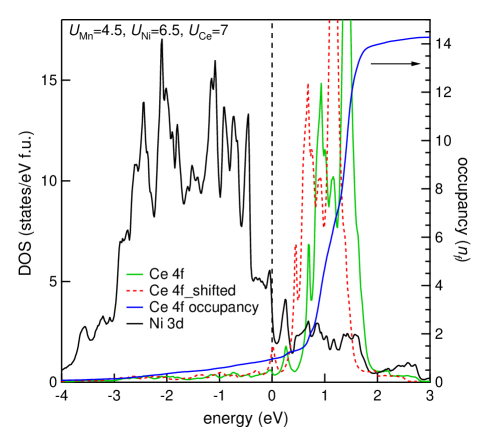
In order to simulate the Ce 3 XPS spectrum, we decrease to -2.5 eV from the HAXPES value of -1 eV and obtain ()= 0.04. But concomitantly, both (=12.1 eV) and (=18.9 eV) become larger than experimental values of 10.2 eV and 14.4 eV, respectively (Table II). In order to decrease , both and need to be decreased, and thus, we obtain a good agreement with experiment for = -2.5 eV, = 1.1 eV, = 8 eV, and = 7 eV (bottom of Fig. S9(b)). Due to the decrease of , increases to 0.98, and thus, in contrast to bulk, at the surface Ce has predominantly 34 (Ce3+) ground state. Thus, in the bulk, since (= -1 eV) is closer to and is larger, the Ce 4 electron transfers to the valence states comprising of primarily Ni 3 states making CeMnNi4 a mixed valent system with 4 occupancy of = 0.8. However, at the surface, the reduced hybridization between the Ce 4 and unsaturated 3 states results in a lowering of the Ce 4 states further below . This increases the occupancy of the Ce 4 level (= 0.98) and results in the surface valence transition. Decrease in from about 10 eV to 8 eV at the surface is also a manifestation of this transition possibly caused by the more efficient screening of the core hole due to increased .
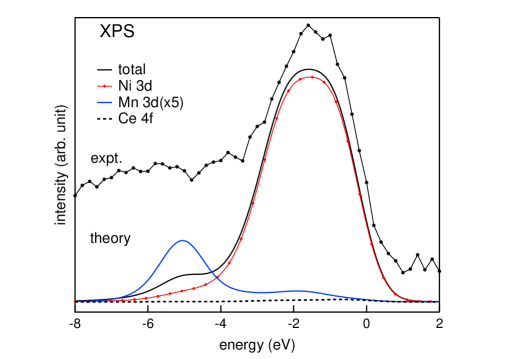
It might be noted that although the surface valence transition is clearly manifested in the Ce 3 core-level spectra, it does not however result in appearance of any Ce 4 peak in the XPS VB (Fig. S12), which could be expected due to enhanced at the surface. Firstly, this happens because the occupied part of Ce 4 PDOS from -3 eV to is largely diminished, broad and featureless (Fig. S13). Its integration (blue line) up to gives = 0.96 in the bulk from DFT, which is in reasonable agreement with = 0.8 from IW method, considering the assumptions of the latter model calculationImer87 . The increase of by 0.18 at the surface obtained from IW method would manifest itself through a small shift of the Ce 4 PDOS by 0.25 eV (obtained from integration of PDOS that gives = 1.14) to lower energy in the rigid band model (red dashed line in Fig. S13). Thus, the main peak of Ce 4 still remains above at the surface. Secondly, occupied Ni 3 PDOS as well as its photoemission cross-sectionYeh85 are much larger than Ce 4 (Fig. S12, S2-S4) resulting in complete domination of the VB by Ni 3 states at low photon energies too. This is reconfirmed by the relative contributions of Ni 3 and Ce 4 to the calculated XPS VB in Fig. S12.