High-resolution VLA
observations of FR 0 radio galaxies:
properties and nature of compact
radio sources.
Abstract
We present the results of Karl G. Jansky Very Large Array (VLA) observations to study the properties of FR 0 radio galaxies, the compact radio sources associated with early-type galaxies which represent the bulk of the local radio-loud AGN population. We obtained A-array observations at 1.5, 4.5, and 7.5 GHz for 18 FR 0s from the FR0CAT sample: these are sources at , unresolved in the FIRST images and spectroscopically classified as low excitation galaxies (LEG). Although we reach an angular resolution of 0.3 arcsec, the majority of the 18 FR 0s is still unresolved. Only four objects show extended emission. Six have steep radio spectra, 11 are flat cores, while one shows an inverted spectrum. We find that 1) the ratio between core and total emission in FR 0s is 30 times higher than in FR I and 2) FR 0s share the same properties with FR Is from the nuclear and host point of view. FR 0s differ from FR I only for the paucity of extended radio emission. Different scenarios were investigated: 1) the possibility that all FR 0s are young sources eventually evolving into extended sources is ruled out by the distribution of radio sizes; 2) similarly, a time-dependent scenario, where a variation of accretion or jet launching prevents the formation of large-scales radio structures, appears to be rather implausible due to the large abundance of sub-kpc objects 3) a scenario in which FR 0s are produced by mildly relativistic jets is consistent with the data but requires observations of a larger sample to be properly tested.
keywords:
galaxies: active galaxies: elliptical and lenticular, cD galaxies: nuclei - galaxies: jets radio continuum: galaxies1 Introduction
Among the variety of observed morphologies of radio-emitting Active Galactic Nuclei (AGN) in the local Universe, the most common one is the presence of a single compact emitting region (Baldi & Capetti, 2010). This conclusion could be derived only after the advent of deep large area radio surveys in opposition to high-flux limited sample studies (such as the 3C, 2Jy, and B2 catalogues Bennett 1962; Wall & Peacock 1985; Colla et al. 1975) which typically selected radio sources extending on scale of many kpc and belonging to the Fanaroff & Riley classes I and II. The cross-match of optical and radio surveys (SDSS, NVSS, and FIRST dataset, SDSS/NVSS sample, Best et al. 2005; Best & Heckman 2012) showed that compact radio sources, at 5 resolution, represent the vast majority of the local radio AGN population (Baldi & Capetti, 2009, 2010; Sadler et al., 2014; Banfield & al., 2015; Whittam et al., 2016, 2017; Miraghaei & Best, 2017; Lukic et al., 2018). Earlier radio studies (Rogstad & Ekers, 1969; Heeschen, 1970; Ekers & Ekers, 1973; Wrobel & Heeschen, 1991; Slee et al., 1994; Giroletti et al., 2005) already pointed out that most of the radio sources in the local universe are flat-spectrum compact sources, but the attention of the community has been mainly focused on the study of extended radio sources (FR I/FR II).
Compact radio sources can potentially be associated with different classes of AGN, including radio-quiet AGN, compact steep-spectrum sources (CSS) and blazars. By using multiwavelength data provided by SDSS, Baldi & Capetti (2010) selected from the SDSS/NVSS sample (Best et al., 2005; Best & Heckman, 2012) a large population of massive red early-type galaxies (ETGs) associated with compact radio sources. These objects have been named FR0s by Ghisellini (2011) as a convenient way of linking the compact radio sources seen in nearby galaxies into the canonical Fanaroff-Riley classification scheme (Sadler et al., 2014). Adopting these selection criteria, FR 0s form a rather homogeneous population of low-luminosity radio galaxies (Baldi et al., 2018a). FR 0s appear indistinguishable from low-power FR I/FR II LEG radio sources (Capetti et al., 2017a, b), sharing similar range of AGN bolometric luminosities, host galaxy properties and BH masses: apparently, the only feature which characterise FR 0s from the other FR classes is their lack of substantial extended radio emission.
Since this vast population is still virtually unexplored, Baldi et al. (2015) carried out a pilot study of Karl G. Jansky Very Large Array (VLA) radio imaging of a small sample of FR 0s. The main result is that most of the sources still appears compact at higher resolution, with 80 per cent of the total radio emission unresolved in the core (i.e., they are highly core-dominated). The few extended sources show a symmetric radio structure. Their radio spectra generally are flat or steep, but with an emerging flat core at higher radio frequencies. In addition, these sources show radio core energetics, line and X-ray luminosities (Torresi et al., 2018), similar to FR Is. Baldi et al. (2015) conclude that FR 0s are able to launch a jet whose unresolved radio core base appears indistinguishable from those of FR Is, but not emitting prominently at large scales. This radio behaviour is similar to what is observed in nearby giant ETGs which harbour low-power RL AGN (1036-38 erg s-1; Baldi & Capetti 2009; Baldi et al. 2016), named Core Galaxies (CoreG, Balmaverde & Capetti 2006) or very low power (1033-38 erg s-1) LINERs recently studied with eMERLIN (Baldi et al., 2018b) and VLA (Nyland et al., 2016). These sources exhibit compact radio emission at the VLA resolution, only occasionally associated with diffuse extended emission (Filho et al., 2000, 2002; Falcke et al., 2000; Nagar et al., 2000; Nagar et al., 2002), and consistent with a FR 0 classification.
The multiband properties of FR 0s indicate that their compactness and high core dominance are genuine and not due to a geometric effect (Baldi et al., 2015; Torresi et al., 2018). All these characteristics point out the uniqueness of the radio properties of the FR 0s as a stand-alone class, different from the other FR classes, blazars, CSS and radio-quiet AGN.
We proposed various explanations to account for the radio properties of FR 0s. Their small size might indicate the youth of their radio activity, but Baldi et al. (2018a) showed that a scenario in which all FR 0s eventually evolve into extended radio sources, cannot account for the space numbers of different FR classes. However, other open possibilities are: i) FR0s could be short-lived and/or recurrent episodes of AGN activity, not long enough for radio jets to develop at large scales (Sadler et al., 2014), ii) FR0s produce slow jets, possibly due to small BH spin, experiencing instabilities and entrainment in the dense interstellar medium of the host galaxy corona that causes their premature disruption (Baldi & Capetti, 2009; Bodo et al., 2013), and iii) the differences between FR 0 and extended radio galaxies are due to a distinct environment.
In order to explore the FR 0 with a more systematic approach we selected a homogeneous and well defined sample of such sources, named FR0CAT (Baldi et al., 2018a). The FR0CAT includes 104 compact radio sources selected by combining observations from the NVSS, FIRST, and SDSS surveys (see Appendix A for an update of the catalogue). We included in the catalogue the sources with redshift and with an optical spectrum characteristic of low excitation galaxies. We imposed a limit on their deconvolved angular sizes of 4, corresponding to a linear size 5 kpc, based on the FIRST images. Their FIRST radio luminosities at 1.4 GHz are mostly in the range . The FR0CAT hosts are mostly (86 %) luminous () red early type galaxies with black hole (BH) masses with a small tail down to .
Compactness is not a well defined property as it depends on the resolution, sensitivity and the frequency of the available observations. Furthermore, we lack of any information on their radio spectral shape. For these reasons we started a comprehensive study of FR0CAT sources with VLA observations at higher frequency and resolution with respect to FIRST, in order to explore their morphology at different scales and wavelengths. Following the pilot study (Baldi et al., 2015), here we present VLA A-array radio observations for 18 sources at 1.5, 4.5 and 7.5 GHz reaching a resolution of 0.3 arcsec to: i) study the extended emission, morphology and asymmetry ; ii) resolve the radio cores; iii) derive the radio spectral distributions.
The paper is organised as follows. In Sect. 2 we define the sample and present the new VLA observations for 18 sources. In Sect 3 we analyse the radio and spectro-photometric properties of the sample which are discussed in Sect. 4. The summary and conclusions to our findings are given in Sect. 5. We also present a revision of the FR0CAT sample in Appendix A.
| SDSS | name | z | L | MBH | LNVSS | LFIRST | Lcore |
|---|---|---|---|---|---|---|---|
| J090734.91+325722.9 | 0.049 | 39.33 | 7.7 | 39.60 | 39.52 | 39.40 | |
| J093003.56+341325.3 | MCG +06-21-042 | 0.042 | 39.93 | 8.4 | 39.31 | 39.24 | 39.59 |
| J093938.62+385358.6 | 0.046 | 39.59 | 8.1 | 38.65 | 38.62 | 39.22 | |
| J094319.15+361452.1 | NGC 2965 | 0.022 | 39.85 | 7.9 | 39.10 | 39.05 | 40.36 |
| J101329.65+075415.6 | 0.046 | 39.86 | 8.7 | 38.76 | 38.68 | 39.18 | |
| J102544.22+102230.4 | 0.045 | 39.48 | 8.9 | 39.75 | 39.69 | 40.62 | |
| J104028.37+091057.1 | NGC 3332 | 0.019 | 39.54 | 8.3 | 38.94 | 38.86 | 39.19 |
| J113637.14+510008.5 | MCG +09-19-133 | 0.050 | 39.35 | 8.3 | 38.90 | 38.80 | 38.71 |
| J121329.27+504429.4 | NGC 4187 | 0.031 | 40.12 | 8.7 | 39.50 | 39.49 | 40.09 |
| J123011.85+470022.7 | MCG +08-23-044 | 0.039 | 40.00 | 8.4 | 39.70 | 39.63 | 40.13 |
| J150808.25+265457.6 | 0.033 | 39.36 | 8.1 | 38.87 | 38.85 | 39.38 | |
| J152010.94+254319.3 | MCG +04-36-038 | 0.034 | 39.52 | 8.6 | 38.85 | 38.79 | 39.43 |
| J153016.15+270551.0 | 0.033 | 39.71 | 8.2 | 38.69 | 38.66 | 39.93 | |
| J155951.61+255626.3 | IC 4587 | 0.045 | 39.33 | 8.5 | 40.00 | 39.28 | 39.68 |
| J162146.06+254914.4 | 0.048 | 39.61 | 8.1 | 38.87 | 38.79 | 38.96 | |
| J162846.13+252940.9 | 0.040 | 39.65 | 8.5 | 39.15 | 39.14 | 39.87 | |
| J165830.05+252324.9 | 0.033 | 39.68 | 8.3 | 38.68 | 38.71 | 39.41 | |
| J170358.49+241039.5 | UGC 10678 | 0.031 | 39.66 | 8.8 | 39.03 | 38.84 | 38.85 |
Column description: (1) source SDSS name; (2) other name; (3) redshift; (4) logarithm of the [O III] line luminosity (erg s-1); (5) logarithm of the BH mass (M⊙); (6 and 7) logarithm of the radio luminosity from NVSS and FIRST (erg s-1); (8) logarithm of the radio core luminosity (erg s-1).
| ID | beam | rms | ID | beam | rms |
|---|---|---|---|---|---|
| J0907+32 | 2.11.4 | 0.041 | J1230+47 | 1.41.3 | 0.025 |
| 0.70.5 | 0.014 | 0.50.5 | 0.020 | ||
| 0.40.3 | 0.013 | 0.30.3 | 0.035 | ||
| J0930+34 | 1.81.3 | 0.062 | J1508+26 | 1.91.4 | 0.028 |
| 0.70.5 | 0.021 | 0.50.5 | 0.013 | ||
| 0.40.3 | 0.018 | 0.30.3 | 0.013 | ||
| J0939+38 | 1.71.4 | 0.041 | J1520+25 | 1.71.3 | 0.031 |
| 0.70.5 | 0.012 | 0.50.5 | 0.013 | ||
| 0.40.3 | 0.016 | 0.30.3 | 0.013 | ||
| J0943+36 | 1.71.4 | 0.015 | J1530+27 | 1.71.3 | 0.076 |
| 0.70.5 | 0.018 | 0.50.5 | 0.020 | ||
| 0.40.3 | 0.045 | 0.30.3 | 0.024 | ||
| J1013+07 | 1.91.4 | 0.043 | J1559+25 | 1.91.3 | 0.061 |
| 0.80.5 | 0.012 | 0.60.5 | 0.023 | ||
| 0.50.3 | 0.013 | 0.40.3 | 0.023 | ||
| J1025+10 | 1.81.4 | 0.044 | J1621+25 | 1.51.4 | 0.036 |
| 0.70.5 | 0.017 | 0.60.5 | 0.013 | ||
| 0.40.3 | 0.020 | 0.40.3 | 0.011 | ||
| J1040+09 | 1.81.4 | 0.038 | J1628+25 | 1.51.3 | 0.040 |
| 0.60.5 | 0.017 | 0.60.5 | 0.019 | ||
| 0.40.3 | 0.012 | 0.40.3 | 0.017 | ||
| J1136+51 | 1.51.4 | 0.028 | J1658+25 | 1.51.3 | 0.047 |
| 0.50.5 | 0.012 | 0.50.5 | 0.016 | ||
| 0.30.3 | 0.011 | 0.30.3 | 0.015 | ||
| J1213+50 | 1.41.3 | 0.038 | J1703+24 | 1.61.3 | 0.050 |
| 0.50.5 | 0.027 | 0.50.5 | 0.013 | ||
| 0.30.3 | 0.060 | 0.30.3 | 0.010 |
Column description: (1) name; (2) beam size (arcseconds) at 1.4 GHz, 4.5 GHz and 7.5 GHz in the three following rows; (3) rms (mJy beam-1) at 1.4 GHz, 4.5 GHz and 7.5 GHz in the three following rows.
2 The sample and the VLA observations
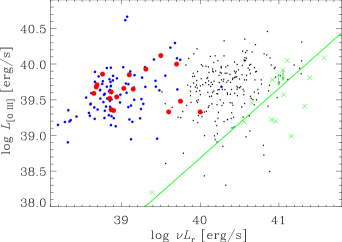
Eighteen objects, whose main properties are listed in Table 1, were randomly extracted from the FR0CAT sample and observed with the VLA. More specifically, we formed groups of three or four FR 0s located at small angular separations, as to reduce the telescope overheads and the time needed for observations of the calibrators. All groups were included in the schedule and five of them were actually executed. Because the observing strategy was only based on the location in the sky, this source selection does not introduce specific biases. The observed FR 0s reside in the redshift range 0.019–0.050 and are well representative of the whole FR0CAT sample in terms of radio and AGN power, see Figure 1. This figure also shows the large deficit of radio emission of FR 0s when compared to the FR Is part of the 3C sample by a factor ranging from 30 to 1000 in the same range of bolometric AGN luminosity (represented by the [O III] line luminosity).
We obtained 8.67 hours of observations with the VLA in its A-array configuration between December 27, 2016 and January 23, 2017. We observed the 18 objects in 5 separate scans, ranging from 1 to 2 hours, including 3 or 4 sources. Similar to the observation strategy for the VLA pilot study of 7 FR 0s used in Baldi et al. (2015), the targets have been observed in L and C bands splitting the exposure times in two. While the L band configuration corresponds to the default 1 GHz-wide band centred at 1.5 GHz, the C band was modified based on our purposes. We divided the available 2-GHz bandwidth into two sub-bands of 1 GHz centred at 4.5 and 7.5 GHz (hereafter C1 and C2 bands, respectively). This strategy allows to obtain images in 3 different radio frequencies in two integration scan. Each of the three bands was configured in 7 sub-bands of 64 channels of 1 MHz. Each source was observed for 10 minutes in both the L and C band, spaced out by the pointing to the phase calibrators for 2-4 minutes. The flux calibrator was 3C 286 observed for 6-7 minutes.
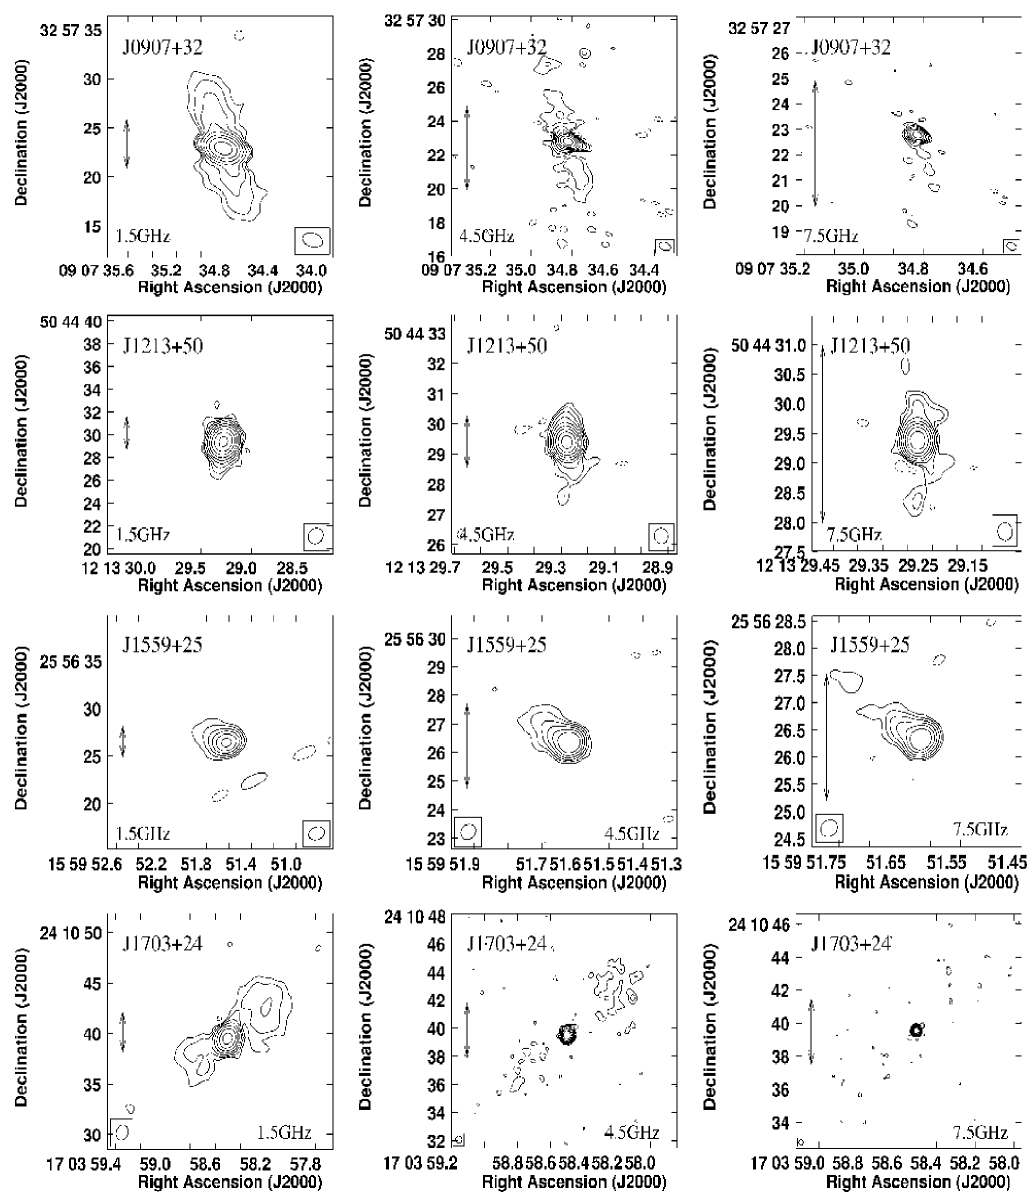
The data were calibrated by the CASA 5.0.0 pipeline v1.4.0, adding further manual flagging to remove low-level radio-frequency interferences and noisy scans to increase the general quality of the data. The final imaging process was performed with AIPS (Astronomical Image Processing System) package according to standard procedures. The images were then produced in the L, C1, and C2 bands from the calibrated data using the task IMAGR. The angular resolutions reached in the three bands are, respectively, 1.7, 0.5, 0.3 arcsec. We self-calibrated the maps of the sources with flux density 5 mJy. The typical rms of the final images is 0.02 mJy, measured in background regions near the target. We measured the flux densities of the unresolved core components with the task JMFIT and the total radio emission from the extended sources with the task TVSTAT. In Tab. 2 we give the main parameters of the resulting images. Fig. 2 presents the maps of the extended radio sources with radio contour level listed in Tab. 3.
| ID | Freq. | Cont. Levels |
|---|---|---|
| J0907+32 | 1.5 | 0.15(-1,1,2,4,8,16,32,64,128) |
| 4.5 | 0.05(-1,1,2,4,8,16,32,64,128) | |
| 7.5 | 0.05(-1,1,2,4,8,16,32,64) | |
| J1213+50 | 1.5 | 0.36(-1,1,2,4,8,16,32,64,128,256) |
| 4.5 | 0.20(-1,1,2,4,8,16,32,64,128,256) | |
| 7.5 | 0.27(-1,1,2,4,8,16,32,64,128,256) | |
| J1559+25 | 1.5 | 0.50(-1,1,2,4,8,16,32) |
| 4.5 | 0.12(-1,1,2,4,8,16,32) | |
| 7.5 | 0.12(-1,1,2,4,8,16,32) | |
| J1703+24 | 1.5 | 0.135(-1,1,2,4,8,16,32,64) |
| 4.5 | 0.035(-1,1,2,4,8,16,32,64) | |
| 7.5 | 0.03(-1,1,2,4,8,16,32,64) |
3 Results
The VLA observations show radio emission with flux densities in the three bands ranging between 1 and 281 mJy (with typical errors of 0.04 mJy in L band and 0.02 mJy in the two C bands). Most of the sources (14/18) appears unresolved down to a resolution of 03 which corresponds to 100–300 pc.111In Appendix A, we also show the radio maps at the three frequencies of IC 711, originally included in the FR0CAT sample (and observed in this VLA project) but subsequently discarded based on the presence of extended emission in its NVSS image. Four sources show instead radio emission extended on a few arcseconds, on a scale of 2–14 kpc (see Table 4 and Fig. 2). In J0907+32 two symmetric jets reach a distance of 7 (14 kpc in largest linear size, LLS). In J1213+50 the jets are best seen in the 4.5 GHz image where they extend out to (LLS 2 kpc) from the nucleus. Only one jet, long (LLS 3 kpc), is detected in J1559+25. Finally, two diffuse radio structures are found in J1703+24, with an angular size of 14 (LLS 9 kpc). In the Table 4 we also provide the total flux densities on the entire radio source. For the four extended sources, we estimated the jet counter-jet ratio measuring the brightness ratio in two symmetric regions as near as possible to the nuclear emission by avoiding the core and considering the surface brightness at similar distance from the core. The brightness jet ratio range between 1 and 2, while one source is fully one-sided (8).
Our high resolution VLA observations, obtained with a relatively short exposure time, might miss faint extended emission. In order to explore this possibility we compared the observed total VLA 1.5 GHz flux densities with those measured by FIRST and NVSS at larger resolutions (5 and 45 arcsec, respectively, see Table 4). The flux densities measured in the L band from our maps are generally consistent with those from the FIRST catalogue (derived from observations between 1994 and 1999 for our sources), an indication that we recovered most of the radio emission. Indeed, all but four sources show differences of less than 20% over a timescale of 20 years. One of them (J1136+51) decreased in flux from 7.8 to 5.3 mJy. Three sources (namely J0943+36, 1025+10, and J1530+27) instead increased their flux densities by a factor between 1.5 to 3.2.
All the 18 FR0s show a ratio between NVSS and FIRST flux densities very close to unity () with only two exceptions. One is J1559+25 with a ratio of 5: this is due to the presence of a second compact source with a FIRST flux density of 117 mJy located 28 to the West, blended with our target in the NVSS image. The second is J1703+24 with a ratio of 1.43: this is one of the FR0s with extended emission, suggesting that some extended emission is lost in the FIRST images.
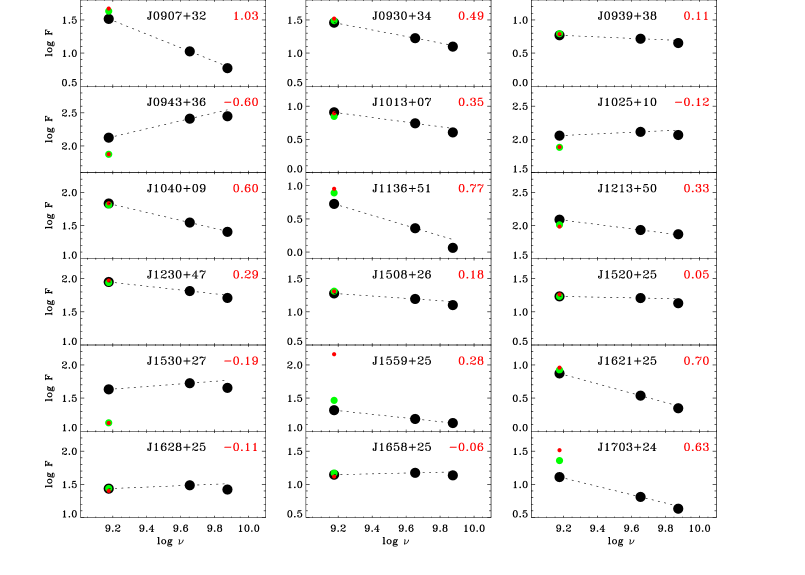
We also obtained matched-beam radio maps222We matched the C-band radio images at the resolution obtained in L band by using the parameter uvtaper in the IMAGR task in AIPS. to derive the radio spectra at the three frequencies for all sources. The resolution-matched flux densities of the central components are reported in Table 4 and plotted in the radio spectra in Fig. 3. The typical flux errors for the central components are smaller than 0.1 mJy. Only for the brightest sources, exceeding mJy, they can be as high as 0.5 mJy. We do not report them in the Table for sake of clarity.
The spectral indices between 1.5 and 4.5 GHz () cover a broad range, from 1 to -0.2: most spectra are flat ( is measured for 11 objects), six are steep (). In one case (J0943+36) the spectrum is strongly inverted, with = -0.6. If we consider the spectral indices measured between the two adjacent bands, we typically observe a spectral steepening at 7.5 GHz, with a median difference between the two indices of 0.16. We also note that four flat-spectrum sources (1025+10, 1530+27 1628+25 1658+25) have slightly convex radio spectra: the flux density at 4.5 GHz is typically 20 per cent higher than the one at 1.5 GHz and 15 per cent higher than at 7.5 GHz.
| Name | NVSS | FIRST | F1.5 | F4.5 | F7.5 | F1.5,,tot. | Morph. | size | jet ratio |
|---|---|---|---|---|---|---|---|---|---|
| J0907+32 | 46.9 | 42.9 | 32.7 | 10.61 | 5.92 | 42.5 | twin-jets | 14 kpc | 1.30.23 |
| J0930+34 | 33.1 | 30.8 | 28.73 | 16.77 | 12.51 | ||||
| J0939+38 | 6.1 | 6.2 | 5.87 | 5.20 | 4.48 | ||||
| J0943+36 | 75.1 | 74.9 | 133.3 | 257.8 | 280.4 | ||||
| J1013+07 | 7.8 | 7.0 | 8.08 | 5.51 | 4.02 | ||||
| J1025+10 | 76.6 | 75.7 | 113.6 | 129.6 | 116.2 | ||||
| J1040+09 | 68.5 | 64.7 | 68.0 | 35.1 | 25.44 | ||||
| J1136+51 | 9.0 | 7.8 | 5.33 | 2.29 | 1.16 | ||||
| J1213+50 | 96.5 | 102.7 | 122.7 | 85.8 | 74.0 | 133.0 | two jets | 2 kpc | 2.00.7 |
| J1230+47 | 93.8 | 87.4 | 89.0 | 65.0 | 51.2 | ||||
| J1508+26 | 20.3 | 20.5 | 18.94 | 15.62 | 12.63 | ||||
| J1520+25 | 18.3 | 17.1 | 17.09 | 16.13 | 13.48 | ||||
| J1530+27 | 13.3 | 13.4 | 42.8 | 52.9 | 45.1 | ||||
| J1559+25 | 155.9 | 29.2 | 20.78 | 15.31 | 13.30 | 24.5 | one jet | 3 kpc | 8 |
| J1621+25 | 9.1 | 8.4 | 7.44 | 3.44 | 2.22 | ||||
| J1628+25 | 25.2 | 27.4 | 27.22 | 30.59 | 26.40 | ||||
| J1658+25 | 13.1 | 14.8 | 13.97 | 14.91 | 13.65 | ||||
| J1703+24 | 32.7 | 22.8 | 12.87 | 6.46 | 4.29 | 17.7 | two lobes | 9 kpc | 1.00.4 |
Column description: (1) source name; (2) and (3) NVSS and FIRST 1.4 GHz flux density (mJy); (4), (5), and (6) fluxes of the nuclear components from matched-beam images at the three observing frequencies (mJy), (4) total flux at 1.5 GHz flux density (mJy); (8) morphology for the extended sources, (9) largest linear size, and (10) brightness ratio between the opposite structures for the extended sources.

Interestingly, results of VLBI observations for four of FR 0s studied here have been recently presented by Cheng & An (2018). J0943+36, the inverted-spectrum source, shows an unresolved VLBI core with an inverted spectrum and significant variability, with a flux density increasing from 0.17 to 0.25 Jy over four years. J1213+50, a twin-sided jet FR 0, show a similar morphology but on mas-scale and perpendicular to the VLA jets. J1230+47, a flat-spectrum FR 0, shows twin jets on mas scale with the VLBI. J1559+25, the one-sided FR 0, appears similarly one-sided on mas scale with the VLBI with no sign of variability (%).
One of the aims of this study is the measurement of the radio core. In the four extended sources a compact central component is always clearly visible. However, the spectrum of the central source of, e.g., J0907+32 is very steep () indicating a substantial contribution from optically thin, extended emission. We must then rely on the radio spectra to isolate the core emission. We considered as core-dominated the 11 sources with central component characterised by a flat spectrum (). For the remaining objects the 7.5 GHz flux density is adopted as upper limit to the core. In Baldi et al. (2015) we noticed several sources with a flattening of the radio spectrum between 4.5 and 7.5 GHz with respect to that measured between 1.5 and 4.5 GHz and interpreted this behaviour as the emerging of a flat core at the higher frequencies. In the observations we are presenting here, there is not a clear evidence of a flattening of the radio spectra at 7.5 GHz: the extrapolation of the 1.5 4.5 GHz agrees or slightly over-predicts the actual measurement at 7.5 GHz by 20 per cent.
The distribution of core dominance of our sources, , defined as the ratio between the nuclear emission at 7.5 GHz and the total NVSS flux density at 1.4 GHz333Except for J1559+25 for which we used the FIRST data because of the contamination to the NVSS flux density from the nearby source. is presented in Fig. 4. The 11 sources with a flat spectrum have . The upper limits on for those with a steep spectrum are in the range -0.9 to -0.4. This distribution is significantly different from from that of 3CR/FRIs (with a 99.9% probability, according to a Kolmogorov Smirnoff test) while it is not distinguishable from the distribution of CoreG and the other FR 0s studied in the previous VLA project (Baldi & Capetti, 2010; Baldi et al., 2015).444We estimated as the ratio between the 7.5 GHz core emission and the total 1.4 GHz flux density, while for the 3CR/FRIs sources we used the 5 GHz core flux density against the 1.4 total flux density. However, since the radio core emission has generally a flat spectrum this quantity is only weakly dependent on the frequency used for the core measurement and this comparison is robust.
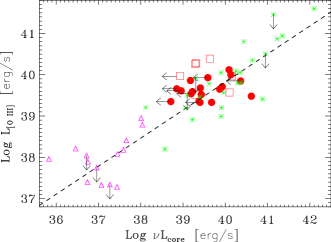
We can now include our sources in the vs. L plane similarly to what done in Baldi et al. (2015) for the VLA FR 0 pilot study. This diagnostic plot compares the radio core energetics with the line luminosity, adopted as a proxy for the AGN luminosity (Heckman et al., 2004). The FR 0s lie in the same region populated by the lower luminosity 3CR/FR Is and follow the same core-line relation found for FR Is and CoreG. This relation further strengthens the similarity between the nuclei of FR 0s and FR Is. However, we remind that for seven of them we only derived upper limits to their radio core flux densities for the lack of a clear flat-spectrum unresolved core. Although the point scatter of FR 0s is consistent with that of FR Is, the presence of upper-limits on the core measurements in the correlation challenges the FR 0–FR I similarity scenario.
4 Discussion
Despite the fact that FR 0s share the same properties with FR I radio galaxies from the nuclear and host point of view, FR 0s differ from the other FR classes for their remarkable lack of significant extended radio emission, and for being dominated by a sub-kpc scale flat-spectrum component. In Baldi et al. (2015) and Baldi et al. (2018a) we discussed various scenarios to interpret this unique feature of FR 0 and we now review them in the light of the results obtained with the new VLA observations.
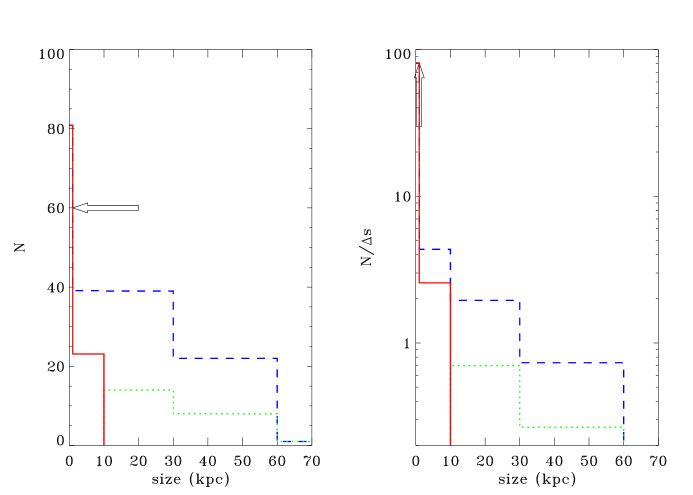
Baldi et al. (2018a) conclude that a scenario in which all FR 0s are young radio sources that will eventually evolve into extended radio source does not reconcile with the relative number densities of these classes. Thanks to the new high-resolution observations, we can further test this possibility, by exploring the distribution of radio sizes of FR 0s. In Fig. 6 we show the size distribution of all 182 SDSS/NVSS LEG radio galaxies with 0.05, 104 of which are included in FR0CAT. The fraction of FR0s unresolved in the VLA observations is %, for which we set a conservative size limit of 1 kpc (represented by the arrow in the Fig. 6 left panel), and they represent % of the whole population of radio emitting AGN within this volume. The remaining sources extend up to 100 kpc and about one third of them are FR Is, part of the FRICAT and sFRICAT samples. In the right panel of this Figure we present the number of objects in each bin, divided by the bin size in kpc. As already discussed in Baldi et al. (2018a), in case of constant expansion speed all bins should be equally populated. Conversely, the number density of sources with size 1 kpc exceed by 2 orders of magnitude that of the extended sources indicating that FR 0s do not generally grow to become large radio galaxies.
The distribution of sizes also sets strong constraints of the interpretation that FR 0 are short-lived recurrent sources. As we mentioned in Baldi et al. (2015), the results obtained by Shin et al. (2012) indicate that the more massive galaxies spend a larger fraction of their time in active states than satellite galaxies. The possibility that this is the origin of the strong peak in the size distribution appears to rather contrived considering the relatively small differences in host galaxy masses between FR 0s and FR Is, on average only a factor 1.6 and with substantial overlap between the two classes (Baldi et al., 2018a; Miraghaei & Best, 2017). Nevertheless, it is correct to mention that a low/moderate amplitude radio flux density variation has been detected for a few FR 0s over time scale of years (Cheng & An, 2018). This variability is not necessary associated with a nuclear recurrence, but a phenomenon expected within an evolutionary scenario of the source (Morganti, 2017).
Another scenario for the origin of FR 0s is related to the jet launching region. The similar nuclear luminosities of FR 0s and FR Is and the FR 0 radio morphologies we observed suggest that within the radio core, less than 1 kpc, the jets of FR 0s should start relativistic (Cheng & An, 2018). However, at larger scales ( 1 kpc), we envisaged that the jet factors of FR 0s are lower than in FR Is by affecting their ability to the penetrate the host’s interstellar medium and transforming the relativistic jets to turbulent flow not far outside the optical core of the galaxy as seen in nearby FR I radio galaxies (e.g. Killeen et al. 1986; Venturi et al. 1993; Bicknell 1995). Nevertheless, no evidence of deceleration sites along the jet on different scales has been observed in our FR 0 sources. We can test the possibility of a jet deceleration and the bulk jet speed by measuring the sidedness of jets in FR 0s and to compare it with that of FR Is. By considering together this new dataset and the results of the pilot program there are now five FR 0s with rather symmetrical extended or slightly sided structures (jet brightness ratio 1–2, J0907+32, J1213+50, J1703+24 in this work and ID 547 and ID 590 from Baldi et al. 2015). We also found one highly asymmetric source but the minimum jet Lorentz factor to obtain the observed flux ratio between the jet and counter-jet of is only , not necessarily indicative of a highly relativistic jet. From the comparison between our VLA and VLBI images from Cheng & An (2018) for 5 FR 0s, we learnt that, when observed, sub-kpc scale jets are typically present also at mas scale. However, for our source (J1213+504) the mas-scale jets appear perpendicular to those observed with VLA, possibly due to jet procession, while in one compact FR 0 (J1230+47), two pc-scale twin jets emerge, pointing to a sub-relativistic jet speed on sizes smaller than what probed by the VLA. An inferred mildly relativistic jet bulk speed on sub-kpc scale is in agreement with the Doppler boosting factors estimated by Cheng & An (2018) from VLBI observations. The modelling of the multiband spectrum of the first FR 0 detected in -ray with Fermi (Grandi et al., 2016) with standard beamed and misaligned jet models (Maraschi & Tavecchio, 2003; Ghisellini et al., 2005) produce bulk jet factor 2 – 10 (Tavecchio et al., 2018). Clearly, the statistic on the jets asymmetries in FR 0s is still insufficient to draw a firm conclusion on their speed, but an evidence of mildly-relativistic jet speed is increasing.
Another tool that can be used to measure the jets speed is to consider the dispersion of the core powers with respect to a quantity independent of orientation, such as the emission line luminosity, see Fig. 5. Because there might be a substantial level of intrinsic scatter, this approach can provide us with an upper limit on the jet . However, due to the presence of a significant fraction of non detections of flat cores, we can only derive a lower limit to the cores dispersion. Higher frequency observations are needed to isolate the core emission also in the sources with steep spectra and fully exploit this method.
We must also mention that a different matter content of the FR 0 jets from the other FR classes might account for the reduced jet extension observed in FR 0s. Lighter jets, possibly composed mainly of electron-positron pairs (Ghisellini, 2012) would correspond a much lower jet power, again, hampering the formation of large scale radio structures, with respect to what is predicted by a leptonic model (Maraschi & Tavecchio, 2003).
While the majority of FR 0s conform with the idea that they are compact flat spectrum sources, some of them show steep spectra. Interestingly, the fraction of flat and steep sources in our sample (with a two to one ratio) is the same found by Sadler et al. (2014) in their sample of FR 0 LEG, despite the rather different selection criteria. FR 0s certainly are a mixed population low-power radio sources, one expected contaminant being a small population of genuinely young FR Is, as also suggested by Cheng & An (2018).
We must mention that four sources show a slightly convex radio spectra and one source (J0943+36) has an inverted spectrum, similar to what seen in GHz peaked sources (GPS, Peacock & Wall 1982). Nevertheless, VLBI observations (Cheng & An, 2018) did not resolve a mas-scale double-lobe structure as expected by this class of radio sources. Therefore, its particular radio behaviour requires more attention to investigate whether its compactness and spectrum reconciles with being a young radio galaxy, which expands at a very low rate due to its much lower power with respect to GPS (O’Dea, 1998) or, instead, is consistent with what expected from young FR Is.
5 Summary and Conclusions
We presented new VLA observations at array A at three frequencies 1.5, 4.5 and 7.5 GHz for a sample of 18 FR 0 radio galaxies selected from the FR0CAT sample. At the highest angular resolution (0.3 arcsec), most of the sources are still unresolved with with 80 per cent of the total radio emission enclosed in the core (i.e., they are more core-dominated than FR Is by a factor 30). Only four objects show extended emission up to 14 kpc, with various morphologies: one- and two-sided jets, and double lobes. Six have steep radio spectra, one shows an inverted spectrum, while 11 are flat cores. Four of the flat-spectrum cores in FR 0s are actually slightly convex, with a small steepening between 4.5 and 7.5 GHz with respect to the slope measured at lower frequencies.
For 11 the sources, where a radio core is detected, the core and emission line luminosities correlate following the relation valid for FR I and CoreG radio galaxies, respectively at high and low luminosities. However, for 7 sources due to their their steep spectra and morphology, we can give only an upper limit to the radio core luminosity, which is still in agreement with the correlation. More high-resolution data are necessary to isolate their core components. Adding the 7 FR 0s studied in a previous VLA exploratory pilot Baldi et al. (2015), we confirm the similarity between the radio cores of FR 0s and FR Is and the absence of strong beaming effect in the FR 0 cores.
The size distribution of nearby RL AGN shows, thanks to the new observations, a strong peak for sources smaller than kpc. This rules out the possibility that FR 0s are young sources that will all evolve into more extended radio galaxies and it also disfavours the interpretation that they are recurrent sources, with very short periods of activity. The most likely possibility is that FR 0s are associated with jets that are mildly relativistic at sub-kpc scale.
The combination of high-resolution, large collecting area, and wide frequency range of the new generation of radio telescopes (e.g., SKA, ngVLA, LOFAR) will enable to satisfy the increasing interest in low-power radio sources (Nyland et al., 2018), and, consequently, in FR 0s (Whittam et al., 2017). The advent of larger radio surveys will give the opportunity to study the pc-scale emission of FR 0s and test whether their jets have smaller bulk jet speed than the other FR classes on firmer statistical grounds, by expanding the size of the observed sample with high quality radio observations. Higher frequency observations are also needed to isolate the core emission in sources in which the radio spectra is steep and detect their jets. On the opposite side, lower frequency observations will be very useful to establish whether among them there are other inverted-spectrum sources, which will provide indications on the nature of the FR0 population: slow jets or young radio sources?
Acknowledgments
The National Radio Astronomy Observatory is a facility of the National Science Foundation operated under cooperative agreement by Associated Universities, Inc. RDB acknowledge the support of STFC under grant [ST/M001326/1]. We thank Francesca Panessa, Graziano Chiaro and Matt Malkan for a helpful discussion on the nature of compact radio sources. We also thank the reviewer for the useful comments, which helped us improve the quality of the manuscript.
References
- Baldi & Capetti (2009) Baldi R. D., Capetti A., 2009, A&A, 508, 603
- Baldi & Capetti (2010) Baldi R. D., Capetti A., 2010, A&A, 519, A48+
- Baldi et al. (2015) Baldi R. D., Capetti A., Giovannini G., 2015, A&A, 576, A38
- Baldi et al. (2016) Baldi R. D., Capetti A., Giovannini G., 2016, Astronomische Nachrichten, 337, 114
- Baldi et al. (2018a) Baldi R. D., Capetti A., Massaro F., 2018a, A&A, 609, A1
- Baldi et al. (2018b) Baldi R. D., Williams D. R. A., McHardy I. M., Beswick R. J., Argo M. K. e. a., 2018b, MNRAS, 476, 3478
- Balmaverde & Capetti (2006) Balmaverde B., Capetti A., 2006, A&A, 447, 97
- Banfield & al. (2015) Banfield J. K., al. 2015, MNRAS, 453, 2326
- Bennett (1962) Bennett A. S., 1962, MmRAS, 68, 163
- Best & Heckman (2012) Best P. N., Heckman T. M., 2012, MNRAS, 421, 1569
- Best et al. (2005) Best P. N., Kauffmann G., Heckman T. M., Ivezić Ž., 2005, MNRAS, 362, 9
- Bicknell (1995) Bicknell G. V., 1995, ApJS, 101, 29
- Bodo et al. (2013) Bodo G., Mamatsashvili G., Rossi P., Mignone A., 2013, MNRAS, 434, 3030
- Buttiglione et al. (2010) Buttiglione S., Capetti A., Celotti A., Axon D. J., Chiaberge M., Macchetto F. D., Sparks W. B., 2010, A&A, 509, A6+
- Capetti et al. (2017a) Capetti A., Massaro F., Baldi R. D., 2017a, A&A, 598, A49
- Capetti et al. (2017b) Capetti A., Massaro F., Baldi R. D., 2017b, A&A, 601, A81
- Cheng & An (2018) Cheng X.-P., An T., 2018, ApJ, 863, 155
- Colla et al. (1975) Colla G., Fanti C., Fanti R., Gioia I., Lari C., Lequeux J., Lucas R., Ulrich M. H., 1975, A&AS, 20, 1
- Ekers & Ekers (1973) Ekers R. D., Ekers J. A., 1973, A&A, 24, 247
- Falcke et al. (2000) Falcke H., Nagar N. M., Wilson A. S., Ulvestad J. S., 2000, ApJ, 542, 197
- Filho et al. (2000) Filho M. E., Barthel P. D., Ho L. C., 2000, ApJS, 129, 93
- Filho et al. (2002) Filho M. E., Barthel P. D., Ho L. C., 2002, ApJS, 142, 223
- Ghisellini (2011) Ghisellini G., 2011, arXiv=1104.0006
- Ghisellini (2012) Ghisellini G., 2012, MNRAS, 424, L26
- Ghisellini et al. (2005) Ghisellini G., Tavecchio F., Chiaberge M., 2005, A&A, 432, 401
- Giroletti et al. (2005) Giroletti M., Giovannini G., Taylor G. B., 2005, A&A, 441, 89
- Grandi et al. (2016) Grandi P., Capetti A., Baldi R. D., 2016, MNRAS, 457, 2
- Heckman et al. (2004) Heckman T. M., Kauffmann G., Brinchmann J., Charlot S., Tremonti C., White S. D. M., 2004, ApJ, 613, 109
- Heeschen (1970) Heeschen D. S., 1970, AJ, 75, 523
- Killeen et al. (1986) Killeen N. E. B., Bicknell G. V., Ekers R. D., 1986, ApJ, 302, 306
- Lukic et al. (2018) Lukic V., Brüggen M., Banfield J. K., Wong O. I., Rudnick L., Norris R. P., Simmons B., 2018, MNRAS, 476, 246
- Maraschi & Tavecchio (2003) Maraschi L., Tavecchio F., 2003, ApJ, 593, 667
- Miraghaei & Best (2017) Miraghaei H., Best P. N., 2017, MNRAS, 466, 4346
- Morganti (2017) Morganti R., 2017, Nature Astronomy, 1, 596
- Nagar et al. (2000) Nagar N. M., Falcke H., Wilson A. S., Ho L. C., 2000, ApJ, 542, 186
- Nagar et al. (2002) Nagar N. M., Falcke H., Wilson A. S., Ulvestad J. S., 2002, A&A, 392, 53
- Nyland et al. (2018) Nyland K., Harwood J. J., Mukherjee D., Jagannathan P., Rujopakarn W., Emonts B., al. 2018, ApJ, 859, 23
- Nyland et al. (2016) Nyland K., Young L. M., Wrobel J. M., Sarzi M., Morganti R., al. 2016, MNRAS, 458, 2221
- O’Dea (1998) O’Dea C. P., 1998, PASP, 110, 493
- Peacock & Wall (1982) Peacock J. A., Wall J. V., 1982, MNRAS, 198, 843
- Rogstad & Ekers (1969) Rogstad D. H., Ekers R. D., 1969, ApJ, 157, 481
- Sadler et al. (2014) Sadler E. M., Ekers R. D., Mahony E. K., Mauch T., Murphy T., 2014, MNRAS, 438, 796
- Shin et al. (2012) Shin M.-S., Ostriker J. P., Ciotti L., 2012, ApJ, 745, 13
- Slee et al. (1994) Slee O. B., Sadler E. M., Reynolds J. E., Ekers R. D., 1994, MNRAS, 269, 928
- Tavecchio et al. (2018) Tavecchio F., Righi C., Capetti A., Grandi P., Ghisellini G., 2018, MNRAS, 475, 5529
- Torresi et al. (2018) Torresi E., Grandi P., Capetti A., Baldi R. D., Giovannini G., 2018, MNRAS
- Vallee & Roger (1987) Vallee J. P., Roger R. S., 1987, AJ, 94, 1
- Vallee & Wilson (1976) Vallee J. P., Wilson A. S., 1976, Nature, 259, 451
- Venturi et al. (1993) Venturi T., Giovannini G., Feretti L., Comoretto G., Wehrle A. E., 1993, ApJ, 408, 81
- Wall & Peacock (1985) Wall J. V., Peacock J. A., 1985, MNRAS, 216, 173
- Whittam et al. (2017) Whittam I. H., Jarvis M. J., Green D. A., Heywood I., Riley J. M., 2017, MNRAS, 471, 908
- Whittam et al. (2016) Whittam I. H., Riley J. M., Green D. A., Jarvis M. J., 2016, MNRAS, 462, 2122
- Wrobel & Heeschen (1991) Wrobel J. M., Heeschen D. S., 1991, AJ, 101, 148


Appendix A The case of IC 711 and an update of the FR0CAT
Most of the 108 sources in the FR0CAT catalogue show a ratio between the FIRST and NVSS flux densities between 0.8-1.2, indicating that, in general, in FR 0s there is no significant amount of extended low-brightness radio emission lost due to the missing short baselines of the FIRST observations. However, individual exceptions might exist. In Fig. 7 we present the images obtained as part of our program of VLA observations of SDSS J113446.55+485721.9 which shows a pair of bent asymmetric jets extending for 90″ from the radio core. This source, also known as IC 711, is actually the longest head-tail radio source known (Vallee & Wilson, 1976), extending over 500 kpc (Vallee & Roger, 1987). Its extended nature is clearly seen also in the NVSS image (see Fig. 8).
The NVSS images were not used for the FR 0s selection because of their low spatial resolution (45) and the resulting high level of confusion. Nonetheless, the case of IC 711 indicates that they can still be used to improve the sources morphological classification. We then retrieved the NVSS images of all 108 FR 0s in FR0CAT looking for extended emission. Elongations in the iso-contours are rather common, usually extending just in one direction. As expected, in most cases this is the result of confusion, due to the presence of a nearby radio source, well visible in the FIRST images. Nonetheless, there are four sources in which the radio emission is clearly extended . Their NVSS images are shown in Fig. 8. These sources (namely SDSS J112039.95+504938.2 SDSS J113446.55+485721.9 aka IC 711, SDSS J160616.02+181459.8, and SDSS J162549.96+402919.4) are not genuine compact FR 0s and should be then removed from the FR0CATcatalogue, which now counts 104 sources.
Regarding IC 711, the core flux densities measured from the VLA observations are 25.92 0.03 at 1.5 GHz, 24.30 0.02 at 4.5 GHz, and 23.23 0.01 at 7.5 GHz, respectively, showing a flat spectrum with = - 0.07. In this source the jets are highly asymmetric in the innermost regions, but their brightness ratio decreases at larger distances, possibly due to a deceleration from relativistic to subsonic (Bicknell, 1995).