Determination of resonance locations in NGC 613 from morphological arguments
Abstract
In this paper, we present imaging data of NGC 613. We use these data to determine the corotation radius of the bar, using the photometric phase crossing method. This method uses the phase angle of the spiral structure in several wavebands, and looks for a crossing between the blue () light and the redder wavebands (e.g., or ). For NGC 613, we find two phase crossings, an outer phase crossing at arcsec and an inner phase crossing at arcsec. We argue that the outer phase crossing is due to the bar corotation radius, and from the bar length of arcsec we go on to calculate a relative bar pattern speed of , which is consistent with the results of previous methods described in the literature. For a better understanding of the inner phase crossing, we have created structure maps in all four wavebands and a color map. All of our structure maps and our color map highlight a nuclear ring of star formation at a radius of arcsec, which had also been observed recently using ALMA. Furthermore, the radius of our inner phase crossing appears to be consistent with the size of a nuclear disk of star formation that has been recently detected and described in the literature. We therefore suggest that the phase crossing method can be used to detect the size of nuclear star formation regions as well as the location of corotation resonances in spiral galaxies.
keywords:
galaxies: fundamental parameters — galaxies: kinematics and dynamics — galaxies: spiral — galaxies: structure1 Introduction
Identifying corotation resonances and their locations in barred spiral galaxies is important for a number of reasons. First, resonances are a requirement of quasi-stationary density waves, so finding them would be evidence that supports density wave models. Furthermore, the location of the bar corotation resonance is related to how it transfers material from the outer parts of the galaxy to the central regions, i.e., the process that dominates secular evolution in nearby disk galaxies. Also, resonances scatter stars and cause disk heating. In the determination of bar pattern speeds, authors often determine the dimensionless quantity , which is the ratio of the bar corotation radius divided by the bar radius , i.e., .
Several other methods that can be used to measure the location of the corotation resonance (CR) and/or bar pattern speeds. This includes the Tremaine-Weinberg method (Tremaine & Weinberg, 1984, hereafter TW), which is the most direct method of determining the CR location (see, e.g. Aguerri et al., 2015; Treuthardt et al., 2007). The TW method requires a significant amount of telescope time and it is only useful for galaxies where the bar major axis and galaxy major axis are offset by (Gerssen, Kuijken & Merrifield, 2003) and for galaxies that are inclined by (Debattista, 2003), so there are a very limited number of galaxies to which TW can be applied.
Other, alternative methods to TW include computer simulations or response models (e.g. Rautiainen, Salo & Laurikainen, 2008; Treuthardt et al., 2008, 2012; Patsis, Kalapotharakos & Grosbol, 2010; Piñol-Ferrer et al., 2014). In this method, galaxy simulations are run to determine the gas response to a bar pattern speed with a bar potential that has been determined from near-infrared imaging. The resulting simulations are compared with optical observations. The simulation that matches the observational morphology closest determines the bar pattern speed. This is considered an indirect method for determining the pattern speed of the bar.
Another method for determining the CR location was introduced by Canzian (1993). In this method, kinematic data along the minor axis of a spiral galaxy shows a change in sign of the radial velocity across spiral arms. This change occurs at the location of the CR. This has been investigated by several authors (e.g. Canzian & Allen, 1997; Fridman et al., 2001; Font et al., 2014), but once again, the requirement for spectroscopic data means that it is expensive in terms of telescope time.
The potential density shift method can also be used to determine the location of CR. In this method, the pattern speed and the corotation radius are determined using the azimuthal phase shift between the potential and the density wave pattern (Zhang & Buta, 2007). An issue with this method is that it frequently uncovers “superfast” bars, where the corotation radius is smaller than the length of the bar. Under these circumstances, the stability and morphology of the orbits in the corotation region do not allow a bar to exist there (Contopoulos, 1980).
These methods have revealed that most bars have “fast” pattern speeds with the ratio of the bar pattern speed to the bar length falling in the range . Some galaxies appear to harbor “slow” bars (i.e., where ), but these seem to be the exception rather than the rule.
In this paper, we concentrate on a method for determining the location of CR that was first described by Puerari & Dottori (1997, hereafter PD). Sierra et al. (2015) used the PD method to show that the CR radius of bars in spiral galaxies can be determined using imaging data alone. Sierra et al. (2015) used the PD method to determine the corotation radii for 17 galaxies that already had CR measurements determined by other methods in the literature and showed that the PD method reproduced the same results. They then went on to apply the method to another 50 barred spiral galaxies.
In this paper, we apply the PD method to NGC 613. The PD method in this galaxy finds two phase crossings. The outermost phase crossing probably corresponds to the corotation radius of the bar. We also use our imaging data to highlight some nuclear structure to try and understand the inner phase crossing revealed by the PD method. We suggest that the inner phase crossing may be indicative of nuclear activity in NGC 613 that has been revealed elsewhere in the literature. For example Davies et al. (2017) and Miyamoto et al. (2018) both study star formation in the nuclear region of NGC 613. In their work, they find nuclear star formation in a circum-nuclear disk extending out to the location of the nuclear phase crossing that we have found here.
2 Data and Methods
2.1 Data Description
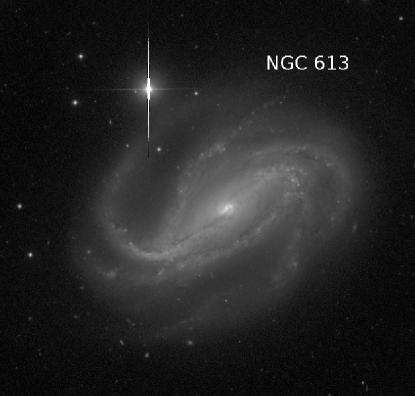
For this project, we used images of NGC 613 that were taken as part of the Carnegie-Irvine Galaxy Survey (Ho et al., 2011, hereafter CGS). The observations were taken at the 2.5-m du Pont Telescope at the Las Campanas Observatory with the 20482048 Direct CCD Camera on 4 April 2006 in photometric conditions. The exposure times were 2360 s in , 2180 s in , 2120 s in , and 2180 s in . The pixel scale for the CCD camera is 0.259 arcsec/pixel, resulting in a field of view of . The limiting surface brightness in each waveband is 27.5, 26.9, 26.4, and 25.3 mag arcsec-2 in the , , , and bands respectively. A combined true-color image of NGC 613 is shown in Figure 1.
2.2 Mask creation
In order to remove foreground objects (e.g., stars) and/or background galaxies from the images of NGC 613, we used the Source Extractor routine (Bertin & Arnouts, 1996). This routine was used to determine the location and extent of foreground and background objects. Source Extractor creates a FITS file which was then manipulated in IRAF to create a mask file.
2.3 Image deprojection
The Fourier transform code that we use only works on deprojected galaxy images. In order to deproject galaxies, we assume that the outermost isophotes of spiral galaxies are intrinsically circular in shape. To do this, we use the IRAF task ellipse. This routine fits ellipses to isophotes in an interative method described by Jedrzejewski (1987). Using this routine, we derive the ellipticity and position angle (PA) of the outermost isophotes of NGC 613. Deprojection of the galaxy images was then performed by rotating each image through an angle equal to the PA of the major axis. The images were then stretched along the x-axis by an amount determined by the ellipticity of the outer isophotes. For each waveband, the same PA and ellipticity was used. The final image was then inspected by eye to verify that the outermost isophotes all appeared circular in shape.
2.4 Determination of bar radius
The deprojected image of the galaxy was viewed in the band and the approximate visual end of the bar was recorded. Then, the method described in Wozniak et al. (1995) was used to find the bar end. Following this method, the PA and ellipticity were plotted as a function of as this facilitates detection of details in the inner regions of images. These plots can also be used to highlight bar structure (see Figure 1 in Wozniak et al. (1995)). In a plot of ellipticity as a function of , a bar shows up as a morphological feature with a high ellipticity, and the end of the bar is highlighted by a sudden change to the minimum ellipticity, . Similarly, the PA changes rapidly at the bar end.
2.5 Determination of corotation radii
The method we use in this paper for determining corotation radii is described by Sierra et al. (2015), who first applied the method to a large sample of spiral galaxies. It is based upon the idea that color profiles of galaxies can be a useful tool in studying spiral structure (Beckman & Cepa, 1990). They showed that phase shifts in the profiles of the and band spiral structure can highlight the locations of star-forming regions. PD then built upon this by suggesting that the phase crossings of and band light indicates the location of a corotation radius. PD describes the photometric method for determing corotation radii, and we refer the reader to this paper as well as Sierra et al. (2015) for a detailed discussion of how the method works and its successes.
In summary, the PD method uses a code that creates azimuthal profiles of galaxies and performs Fourier transforms on them. The image is first divided into 180 azimuthal sections each 2∘ wide, and 360 radial sections each 1 pixel wide. An azimuthal profile was created at each radial division. The code then runs a Fourier transform for each of the azimuthal profiles, i.e.,
| (1) |
where the associated phase angles are given by
| (2) |
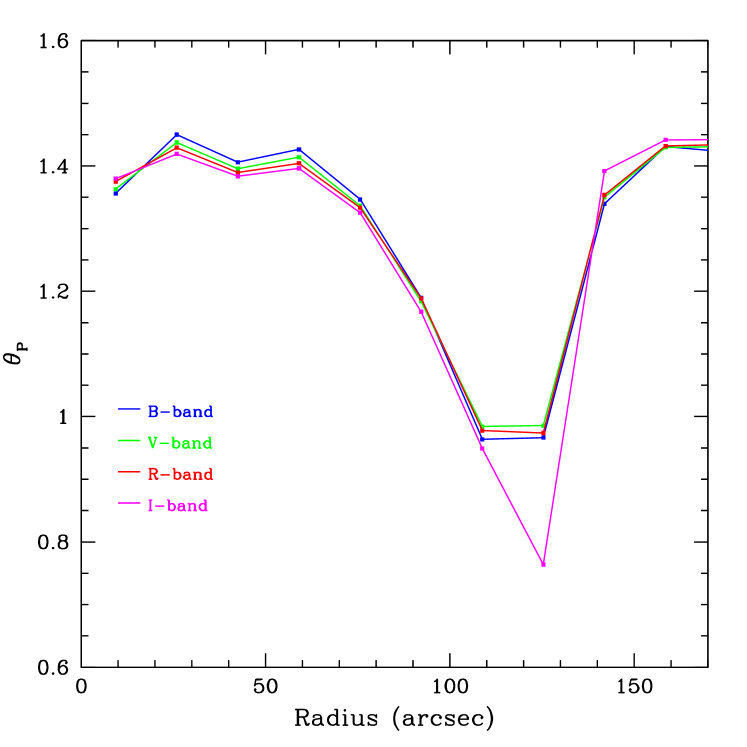
where and are the real and imaginary parts of the complex Fourier coefficient, . The phase angle as a function of radius for each waveband was then plotted on the same graph (see Figure 2). Locations where the phase angles intersect are indicative of corotation radii.
As with any method, the PD method does have its limitations. One may think that dust attenuation may be a factor because we are using visible light images. However, the main reason this method works is because at CR, the bluer star formation regions and the redder dust lane regions flip across the spiral arm at the CR location. As most of the dust attenuation occurs within the dust lanes, the PD method actually relies, to some extent, on this dust attenuation. The main limitation with the PD method actually occurs when multiple phase crossings occur, which can lead to misinterpretations of such results. Furthermore, in some cases multiple phase crossings are seen within just a few arcseconds of each other. In these cases, authors often refer to this as a corotation region (see. e.g. Sierra et al., 2015), although it is unclear why multiple crossing would occur in such a small region of the disk of a galaxy.
2.6 Calculation of the dimensionless quantity
Here, we calculate the following dimensionless parameter, i.e., the ratio of the CR radius to the bar radius,
| (3) |
where is the corotation radius determined in section 2.5 and is the bar radius as determined in section 2.4. If , the bar is defined as a “slow” rotator and if , the bar is “fast” (Debattista & Sellwood, 2000). Athanassoula (2014) argues that is a good method for standardizing comparisons of bar pattern speeds in different galaxies.
2.7 Creation of structure and color maps
To enhance the observable dust and star formation structure in our images of NGC 613, we have chosen to create structure maps, a technique originally developed by Pogge & Martini (2002). Mathematically, the structure map is defined as
| (4) |
where is the structure map, is the image, is the point-spread function (PSF), is the transform of the PSF, and is the convolution operator. Structure maps enhance structure variations on the smallest resolvable scale of the image. In the case of our optical imaging data of NGC 613, the seeing in all four wavebands is arcsec.
3 Results and Discussion
Figure 2 shows the phase angle of the spiral structure as a function of radius for all four wavebands, , , , and . The locations on this plot where all four wavebands intesect (a phase crossing) should denote the location of corotation radii. For NGC 613, there are two phase crossings highlighted in Figure 2, an inner phase crossing at arcsec and an outer corotation radius at arcsec. The main source of the error in determining these phase crossings is the frequency at which the phase angle is sampled.
For NGC 613, Rautiainen, Salo & Laurikainen (2008) found a corotation resonance at arcsec using sticky particle simulations. This is in fairly good agreement with the location we determine for the outer corotation radius, i.e., arcsec.
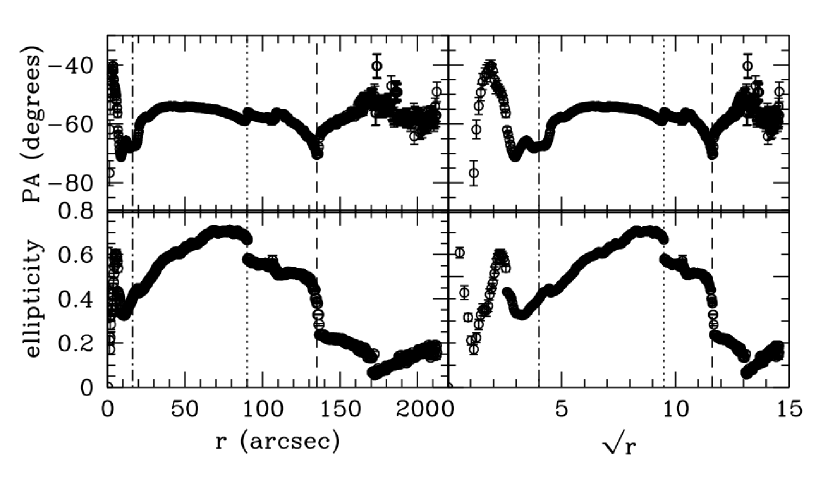
In order to determine the ratio of the outer corotation resonance to the bar length, we now need to determine the bar length. Figure 3 shows both position angle and ellipticity as a function of radius. In these plots, the end of the bar is shown as a sudden change from a maximum ellipticity. Often (but not always) this is accompanied by a change in position angle. From this analysis, we estimate the bar length as arcsec. At this radius a sudden change can be seen in ellipticity, from a maximum of , and a small but sudden change can also be seen in the position angle at this radius. This is slightly larger than the bar length reported in Rautiainen, Salo & Laurikainen (2008) who found arcsec for their sticky particle simulations. For their bar lengths, which are used as inputs to the sticky particle simulations, Rautiainen, Salo & Laurikainen (2008) used a modified version of the method used by Erwin (2004, 2005) to calculate the size of the bar.
Given the location of the outer corotation radius, arcsec, and the bar length, arcsec, that we have determined here, we calculated the ratio of the outer corotation resonance to the bar length . For a comparison, Rautiainen, Salo & Laurikainen (2008) derive a bar pattern speed of from their sticky particle simulations. Our estimate is in agreement with their determination of the bar pattern speed within the uncertainties. Also, both our estimate and that of Rautiainen, Salo & Laurikainen (2008) are consistent with , which is the transition from slow () to fast () bar pattern speeds. We therefore consider the bar in NGC 613 to have a slow pattern speed.
As highlighted in Figure 2, we have found an inner phase crossing at a radius of arcsec. One potential explanation for this inner phase crossing is that NGC 613 has an inner bar, or a bar within a bar (e.g. Maciejewski & Sparke, 2000; Maciejewski & Athanassoula, 2008), in which case this phase crossing represents the corotation resonance of this morphological feature. However, in the position angle and ellipticity profiles in Figure 3, a bar should show up with approximately constant position angle and with an ellipticity that reaches a high ellipticity and then suddenly changes to a minimum. While this is clearly the case for the large-scale bar in NGC 613, no such indication exists in these profiles for a nuclear bar. It is possible that the data presented here, simply do not have the resolution to highlight a nuclear bar, but such a feature has not been seen elsewhere in the literature for NGC 613. As a result, we have chosen not to focus on this explanation, and instead focus on other forms on nuclear activity that is known to exist in NGC 613.
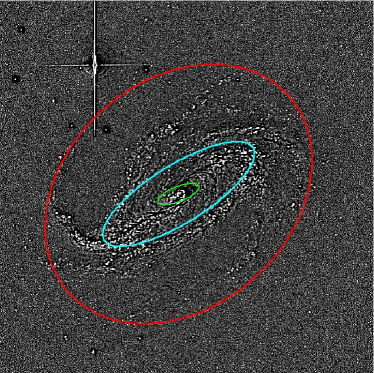
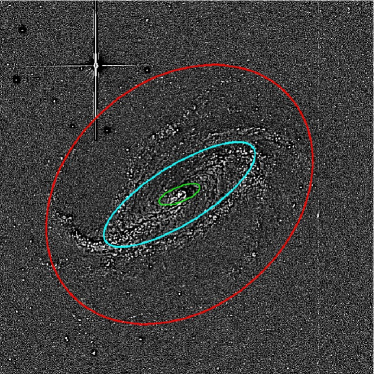
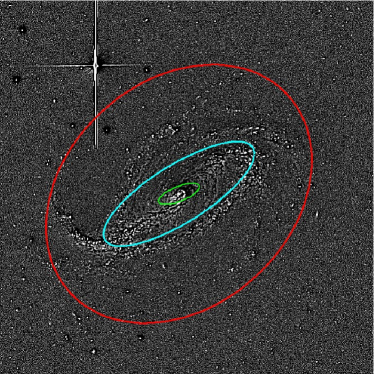
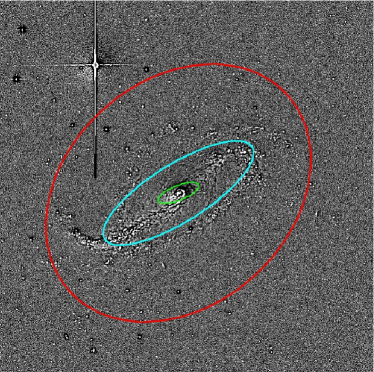
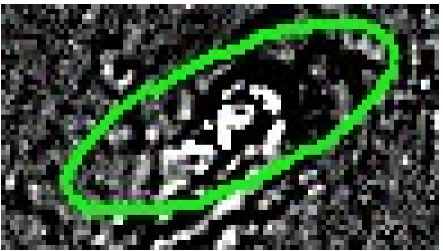
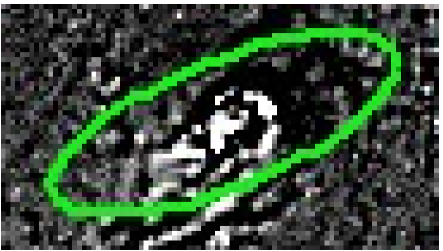
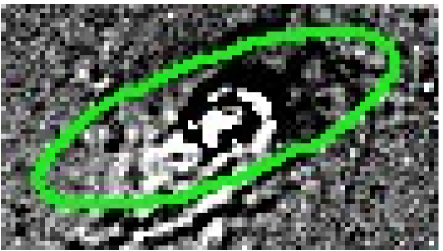
The presence of an inner phase crossing may be consistent with nuclear activity in NGC 613, which is a low-luminosity AGN with prominent radio jets (e.g., Goulding & Alexander, 2009; Hummel & Joraster, 1992). In order to study this in more detail, we have created structure maps of NGC 613 (see Figures 4 and 5) and a color map (see Figure 6).
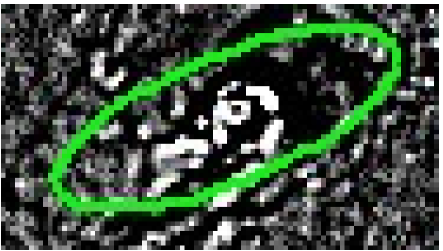
Both the structure maps (in , , , and ) and the color map show evidence of a partial ring of star formation at a radius of arcsec, which has been highlighted in previous works (e.g., Miyamoto et al., 2018). Beyond this radius, the structure maps and color maps show no other evidence of nuclear structure in NGC 613. The large-scale bar and spiral structure can clearly be seen in the outer parts of all of the structure maps and the color map.
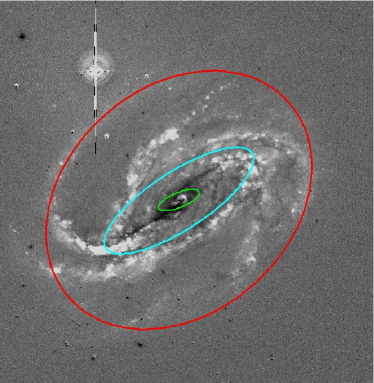
The partial circum-nuclear star formation ring shown in Figures 4 and 6, was also recently studied by Miyamoto et al. (2018). They studied the central circum-nuclear disk and star-forming ring with the Atacama Large Millimeter Array (ALMA) in [CI], 13CO, and C18O. Their observations place the star-formation ring at a radius of arcsec (see their Figure 1), well within the inner phase crossing that we have found. Furthermore, Davies et al. (2017) studied the AGN activity in NGC 613 using H, H, [NII], [SII], and O[III] emission lines, and they find evidence of star formation within the inner phase crossing, at arcsec, that we have found here (see their Figure 3).
The left panel of Figure 6 also highlights that the major part of the dominant two-armed spiral structure in NGC 613 is included inside the outer corotation radius at arcsec. This is consistent with the result of Kranz, Slyz & Rix (2003) who located corotation resonances by comparing simulated gas density dsitributions for different spiral patterns and compared them to observed disk morphology for a sample of five galaxies. In all five galaxies, Kranz, Slyz & Rix (2003) found that the corotation resonance was also located near the end of the dominant spiral pattern, at an average galactocentric radius of , where is the exponential disk scalelength.
Nonlinear orbital modeling and some N-body simulations also place corotation resonances in a similar location (Patsis, Contopoulos & Grosbol, 1991; Patsis & Kaufmann, 1999). In the response models of Patsis & Tsigaridi (2017), they find two sets of spirals, which appear to be caused by different dynamical mechanisms. The structure inside corotation appears to be supported by regular orbits and this appears to be consistent with above theoretical studies. Outside corotation, the spirals in the Patsis & Tsigaridi (2017) models appear to be associated with “chaotic spirals” in both the stellar and the gaseous disk. The two spirals meet near the unstable Lagrangian points of the system. Our finding that the outer corotation resonance appears to be located near the end of the dominant spiral pattern is, therefore, consistent with the results of several dynamical simulations, and could be more evidence in favor of the modal theory of spiral structure.
4 Conclusions
The main three conclusions of this paper are now summarized as follows:
-
•
Using the PD (or multi-band photometric) method, we have determined that NGC 613 has an outer corotation radius at arcsec. Given our determination of the bar length of , we find a relative bar pattern speed of , which is consistent with that found using other methods (Rautiainen, Salo & Laurikainen, 2008). This suggests that NGC 613 has a bar with a slow pattern speed.
-
•
We have also found that NGC 613 has an inner phase crossing, although this is likely not related to a corotation resonance. Instead, we suggest that this inner phase crossing is indicative of nuclear activity, in particular nuclear star formation. Previous works have indicated the presence of a star-forming ring and a star-forming nuclear disk in NGC 613 (Peeples & Martini, 2006; Falcon-Barroso et al., 2014; Davies et al., 2017; Miyamoto et al., 2018). These works highlight a nuclear star-forming disk that extended out to arcsec. This is consistent with the location of our inner phase crossing radius at arcsec. We therefore suggest that phase crossings may also be useful for detecting the limit of nuclear activity, particularly nuclear star formation.
-
•
We find that the outer corotation resonance, located at , is close to the end of the dominant two-armed spiral pattern. On the surface, this appears to be consistent with the expectations from theoretical models and simulations (e.g. Kranz, Slyz & Rix, 2003; Bertin et al., 1989a, b; Bertin, 1993; Patsis & Tsigaridi, 2017). According to the theory of global modes (Bertin et al., 1989a, b; Bertin, 1993; Bertin & Lin, 1996), the corotation radius should be located in the outer parts of the disk. This is consistent with our findings.
It should be noted that nuclear rings of star formation are likely due to orbits in the bar region and they they migrate inwards over time (Regan & Teuben, 2003). Indeed, simulations of galaxies have shown that these nuclear rings of star formation have a dusty rings to their interiors (Regan & Teuben, 2003), and this supports the idea that the ring is migrating inwards. However, at the resolution of the images presented in this paper, it is unlikely that we can detect the interior dusty ring in NGC 613. Instead, we believe that we have detected the extended disk reported by several authors (e.g., Miyamoto et al., 2018).
Finally, taking the results of Treuthardt et al. (2012), Sierra et al. (2015) and Karki et al. (2018) as well as the result for NGC 613 here, it seems that there is a phase crossing or corotation resonance in the outer part of the visible spiral structure whether or not there is a central bar. Salo et al. (2010) have statistically shown that there is a correlation between bar strength and spiral arm amplitude out to a radius of . This suggests that either the spiral arms are a continuation of the bar mode or they are driven by the bar out to that radius. Further out, spirals may be independent. For NGC 613, we determine that the corotation radius is arcsec , which is inside the limit of suggested by Salo et al. (2010). At least superfically, our result appears to be consistent with the result of Salo et al. (2010).
Acknowledgements
MSS wishes to thank the University of Minnesota Duluth for their support and the Fund for Astrophysical Research. The data presented in this paper were collected as part of the Carnegie-Irvine Galaxy Survey (CGS), using facilities at Las Campanas Observatory, Carnegie Institution for Science. The optical data were reduced independently from those presented in Ho et al. (2011). The authors wish to thank the anonymous referee for comments that significantly improved the content of this paper.
References
- Aguerri et al. (2015) Aguerri J. A. L., 2015, A&A, 576, 102
- Athanassoula (2014) Athanassoula E., 2014, MNRAS, 438, L81
- Beckman & Cepa (1990) Beckman J. E., Cepa, J., 1990, A&A, 229, 37
- Bertin & Arnouts (1996) Bertin E., Arnouts, S., 1996, A&AS, 117, 393
- Bertin et al. (1989a) Bertin G., Lin C., Lowe S., Thurstans R., 1989a, ApJ, 338, 78
- Bertin et al. (1989b) Bertin G., Lin C., Lowe S., Thurstans R., 1989a, ApJ, 338, 104
- Bertin (1993) Bertin G., 1993, PASP, 105, 640
- Bertin & Lin (1996) Bertin G., Lin C. C., 1996, Spiral Structure in Galaxies – A Density Wave Theory. MIT Press, Cambridge MA
- Canzian (1993) Canzian B., 1993, PASP, 105, 661
- Canzian & Allen (1997) Canzian B., Allen R. J., 1997, ApJ, 479, 723
- Contopoulos (1980) Contopoulos G., 1980, A&A, 81, 198
- Davies et al. (2017) Davies R. L., Groves B., Kewley L. J., et al., 2017, MNRAS, 470, 4974
- de Vaucouleurs et al. (1991) de Vaucouleurs G., de Vaucouleurs A., Corwin H. G., Jr., Buta R. J., Paturel G., Fouqué P., 1991, Third Reference Catalogue of Bright Galaxies. Springer, New York (RC3)
- Debattista & Sellwood (2000) Debattista V. P., Sellwood J. A., 2000, ApJ, 543, 704
- Debattista (2003) Debattista V. P., 2003, MNRAS, 342, 1194
- Erwin (2004) Erwin P., 2004, A&A, 415, 941
- Erwin (2005) Erwin P., 2005, MNRAS, 364, 283
- Falcon-Barroso et al. (2014) Falcon-Barroso J., Ramos Almeida C., Boker T., Schinnerer E., Knapen J. H., Lancon A., Ryder, S., 2014, MNRAS, 438, 329
- Font et al. (2014) Font J., Beckman J. E., Querejeta M., Epinat B., James P. A., Blasco-herrera J., Erroz-Ferrer S., Pérez I., 2014, ApJS, 210, 2
- Fridman et al. (2001) Fridman A. M., Khoruzhii O. V., Lyakhovich V. V., Sil’chenko O. K., Zasov A. V., Afanasiev V. L., Dodonov S. N., Boulesteix J., 2001, A&A, 371, 538
- Gerssen, Kuijken & Merrifield (2003) Gerssen J., Kuijken K., Merrifield M. R., 2003, MNRAS, 345, 261
- Goulding & Alexander (2009) Goulding A. D., & Alexander D. M., 2009, MNRAS, 298, 1165
- Ho et al. (2011) Ho L. C., Li Z.-Y., Barth A. J., Seigar M. S., Peng C. Y., 2011, ApJS, 197, 21 (CGS)
- Hummel & Joraster (1992) Hummel E., Joraster S., 1992, A&A, 261, 85
- Jedrzejewski (1987) Jedrzejewski R. I., 1987, MNRAS, 226, 747
- Karki et al. (2018) Karki A., Seigar M., Harrington A., Puerari, I., 2018, in preparation
- Kranz, Slyz & Rix (2003) Kranz T., Slyz A., Rix H.-W., 2003, ApJ, 586, 143
- Maciejewski & Sparke (2000) Maciejewski W., Sparke L., 2000, MNRAS, 313, 745
- Maciejewski & Athanassoula (2008) Maciejewski W., Athanassoula E., 2008, MNRAS 389, 545
- Miyamoto et al. (2018) Miyamoto Y., Seta M., Nakai N., Watanabe Y., Salak D., Ishii, S., 2018, PASJ, 70, L1
- Patsis, Contopoulos & Grosbol (1991) Patsis P. A., Contopoulos G., Grosbol P., 1991, A&A, 243, 373
- Patsis & Kaufmann (1999) Patsis P. A., Kaufmann D. E., 1999, A&A, 352, 469
- Patsis, Kalapotharakos & Grosbol (2010) Patsis P. A., Kalapotharakos C., Grosbol P., 2010, MNRAS, 408, 22
- Patsis & Tsigaridi (2017) Patsis P. A., Tsigaridi L., 2017, Ap&SS, 362, 129
- Peeples & Martini (2006) Peeples M. S., Martini, P., 2006, ApJ, 652, 1097
- Piñol-Ferrer et al. (2014) Piñol-Ferrer N., Fathi K., Carignan C., Font J., Hernandez O., Karlsson R., van de Ven G., 2014, MNRAS, 438, 971
- Pogge & Martini (2002) Pogge R. W., Martini P., 2002, ApJ, 569, 624
- Puerari & Dottori (1997) Puerari I., Dottori H., 1997, ApJ, 476, L73 (PD)
- Rautiainen, Salo & Laurikainen (2008) Rautiainen P., Salo H., Laurikainen E., 2008, MNRAS, 388, 1803
- Regan & Teuben (2003) Regan M. W., Teuben P., 2003, ApJ, 582, 723
- Salo et al. (2010) Salo H., Laurikainen E., Buta R., Knapen J. H., 2010, ApJL, 715, L56
- Sierra et al. (2015) Sierra A. D., Seigar M. S., Treuthardt P., Peurari I., 2015, MNRAS, 450, 1799
- Tremaine & Weinberg (1984) Tremaine S., Weinberg M. D., 1984, ApJ, 282, L5 (TW)
- Treuthardt et al. (2007) Treuthardt P., Buta R., Salo H., Laurikainen E., 2007, AJ, 134, 1195
- Treuthardt et al. (2008) Treuthardt P., Salo H., Rautiainen P., Buta R., 2008, AJ, 136, 300
- Treuthardt et al. (2012) Treuthardt P., Seigar M. S., Sierra A. D., Al-Baidhany I., Salo H., Kennefick D., Kennefick J., Lacy C. H. S., 2012, MNRAS, 423, 3118
- Veron-Cetty & Veron (2006) Veron-Cetty M.-P., Veron, P., 2006, A&A, 455, 773
- Wozniak et al. (1995) Wozniak H., Friedli D., Martinet L., Martin P., Bratschi P., 1995, A&AS, 111, 115
- Zhang & Buta (2007) Zhang X., Buta R. J., 2007, AJ, 133, 2584