11email: vadibekyan@astro.up.pt 22institutetext: Université Côte d’Azur, Observatoire de la Côte d’Azur, CNRS, Laboratoire Lagrange, Bd de l’Observatoire, CS 34229, 06304 Nice cedex 4, France 33institutetext: Departamento de Física e Astronomia, Faculdade de Ciências, Universidade do Porto, Rua do Campo Alegre, 4169-007 Porto, Portugal 44institutetext: Byurakan Astrophysical Observatory, 0213 Byurakan, Aragatsotn province, Armenia
The AMBRE project: searching for the closest solar siblings
Abstract
Context. Finding solar siblings, that is, stars that formed in the same cluster as the Sun, will yield information about the conditions at the Sun’s birthplace. Finding possible solar siblings is difficult since they are spread widely throughout the Galaxy.
Aims. We search for solar sibling candidates in AMBRE, the very large spectra database of solar vicinity stars.
Methods. Since the ages and chemical abundances of solar siblings are very similar to those of the Sun, we carried out a chemistry- and age-based search for solar sibling candidates. We used high-resolution spectra to derive precise stellar parameters and chemical abundances of the stars. We used these spectroscopic parameters together with Gaia DR2 astrometric data to derive stellar isochronal ages. Gaia data were also used to study the kinematics of the sibling candidates.
Results. From the about 17 000 stars that are characterized within the AMBRE project, we first selected 55 stars whose metallicities are closest to the solar value ( [Fe/H] 0.1 dex). For these stars we derived precise chemical abundances of several iron-peak, - and neutron-capture elements, based on which we selected 12 solar sibling candidates with average abundances and metallicities between to 0.03 dex. Our further selection left us with 4 candidates with stellar ages that are compatible with the solar age within observational uncertainties. For the 2 of the hottest candidates, we derived the carbon isotopic ratios, which are compatible with the solar value. HD186302 is the most precisely characterized and probably the most probable candidate of our 4 best candidates.
Conclusions. Very precise chemical characterization and age estimation is necessary to identify solar siblings. We propose that in addition to typical chemical tagging, the study of isotopic ratios can give further important information about the relation of sibling candidates with the Sun. Ideally, asteroseismic age determinations of the candidates could solve the problem of imprecise isochronal ages.
Key Words.:
stars: abundances, stars: kinematics and dynamics, solar neighborhood1 Introduction
As most low-mass stars, the Sun was probably formed in a cluster (e.g., Lada & Lada 2003) about 4.57 Gyr ago (Bonanno & Fröhlich 2015). The early solar nebula hosted short-lived radioactive isotopes (with half-lives shorter than a few Myr), which are mainly products of stellar nucleosynthesis. This indicates that pollution by a supernova with a progenitor mass of 20 M⊙ (Looney et al. 2006) or even higher (e.g., 75-100 M⊙ Williams & Gaidos 2007) occurred in the first epochs ( 2 Myr). The existence of such a massive star in the birth cluster of the Sun would require its initial mass to be at least 500 M⊙ Weidner & Kroupa (2004) or even 104 if the progenitor mass of the exploded supernova was 75 M⊙ (Weidner & Kroupa 2004).
Moreover, the dynamical excitement of the trans-Neptunian object Sedna and the Kuiper belt objects (Brown et al. 2004; Morbidelli & Levison 2004) requires a close encounter with another star in the birth cluster, which also suggests that the solar birth cluster contained 103–104 stars (Adams 2010). Portegies Zwart (2009) suggested that the birth cluster could have had a mass between 500 and 3000 M⊙ if the size of the cluster was 1–3 pc.
The lifetime of open clusters is typically about 200 Myr (e.g., Piskunov et al. 2006), although it depends on the cluster mass (massive clusters live longer) and on the galaxy properties (e.g., Lamers & Gieles 2006). The birth cluster of the Sun therefore has long since been dissipated, and its members, the solar siblings, are scattered throughout the Milky Way (e.g., Bland-Hawthorn et al. 2010).
Finding solar siblings is important for several reasons. It would help us to better understand the origin of our Sun and to constrain its birthplace and the environmental conditions of the Sun’s birth cluster. Moreover, finding and characterizing planetary systems (e.g., their frequency and architecture) around solar siblings could give relevant information about the outcome of planet formation in a common environment. Solar siblings can also be good candidates to search for planets with life, assuming that the life transportation between solar systems in the Sun’s birth cluster was efficient (e.g., Adams & Spergel 2005; Tepfer & Leach 2006). The highly speculative hypothesis that life (biotic materials) can travel in space and can settle in new habitats is called panspermia. The transfer of life between exoplanet systems in particular is called interstellar lithopanspermia (von Bloh et al. 2003).
Several attempts have been made to find solar siblings (e.g., Brown et al. 2010; Bobylev et al. 2011; Liu et al. 2015), but only four plausible candidates have been identified to date: HIP21158, HIP87382, HIP47399, and HIP92831 (Batista & Fernandes 2012; Batista et al. 2014; Ramírez et al. 2014). In most of the solar sibling search studies, the authors started their search from a kinematic selection of candidates and then verified if th metallicities and chemical abundances of the candidates are compatible with those of the Sun.
Following a different approach, Batista et al. (2014) conducted a search for solar siblings in the HARPS high-resolution FGK dwarf sample (Adibekyan et al. 2012) using a new approach based on the observed chemical abundance trends with condensation temperature. The initial HARPS sample used by these authors consisted of 1,111 stars, the abundances of only 12 elements were used to search for solar chemical twins, and finally, astrometric data were taken from Hipparcos (van Leeuwen 2007). Batista et al. (2014) found only one candidate solar sibling. Today, we have the possibility to make a new search with improvements in all these aspects: a larger sample, chemical abundances of many more elements, and astrometric data with better precision. All these possibilities are provided by the AMBRE project (de Laverny et al. 2013) and Gaia DR2 (Gaia Collaboration et al. 2018). AMBRE is a Galactic archeology project set up by ESO and the Observatoire de la Côte d’Azur in order to determine the stellar atmospheric parameters for the archived spectra from the ESO spectrographs FEROS, HARPS, UVES, and GIRAFFE. A total of about 230,000 spectra have been homogeneously analyzed.
This paper is organized as follows. In Sect. 2 we describe the initial selection of the sample stars, and in Sect. 3 we characterize these stars in terms of stellar parameters (Sect. 3.1), chemical abundances (Sect. 3.3), ages and activities (Sect. 3.4), and kinematics (Sect. 3.5). In Sect. 4 we apply different criteria to select the best-fit solar sibling candidates, which we study in more detail in Sect. 5. We summarize our work in Sect. 6.
2 Initial sample selection
Our initial sample is based on AMBRE project data (de Laverny et al. 2013). Currently, the AMBRE project provides stellar parameters and the chemical index [/Fe] for 6,508 FEROS archived spectra (Worley et al. 2012), 10,212 UVES spectra (Worley et al. 2016), and 93,116 HARPS spectra (De Pascale et al. 2014). These spectra correspond to about 17,000 individual stars. The spectra were processed using the MATISSE algorithm (Recio-Blanco et al. 2006), and we used a specific grid of synthetic spectra assembled by de Laverny et al. (2012).
From this initial AMBRE sample we selected 28,631 spectra for which the MATISSE parameterization suggested a mean metallicity ([M/H]) and -element abundance [/H]) close to the solar value within (0.1 dex). These spectra correspond to 1,019 unique stars, for 987 of which Gaia DR2 (Gaia Collaboration et al. 2018) astrometry is available.
The numerical simulations of Martínez-Barbosa et al. (2016) for solar sibling candidates with a parallax 5 mas suggest a proper motion () in the range 4 6 mas yr-1 and a heliocentric radial velocity (RV) in the range RV km/s. We note that these kinematic criteria are only suggestive and are used to increase the probability of finding a solar sibling. Moreover, they are dependent on which model of the Milky Way is assumed. We decided to apply very broad initial kinematic criteria to avoid excluding any potential candidate at this stage. From the 987 stars we selected 119 relatively nearby stars ( 5 mas) with an RV between and 100 km/s, and total mas/yr. Following Lindegren et al. (2018), we corrected the parallaxes for the global offset (0.029 mas) and for the 30% underestimation of the parallax uncertainties of bright stars (Luri et al. 2018; Arenou et al. 2018). We did not consider distant stars with 5 mas (about 10% of the sample stars) because predictions of the kinematic properties of solar siblings are provided for nearby stars. Moreover, most of these distant stars are either very faint (the average V magnitude is 11.8 mag) or evolved massive giant stars (M 1.3 M⊙). The spectra of faint stars are also usually of low quality, and it is difficult to derive precise chemical abundances. The massive evolved stars have lifetimes shorter than the present-day age of the Sun.
We finally made an intensive literature search for the 119 selected stars and excluded 26 stars belonging to open clusters that are much younger than the Sun (younger than 1 Gyr). Three stars with effective temperature () lower than 4500 K were also excluded since our spectroscopic analysis method does not guarantee a derivation of very precise stellar parameters and chemical abundances (at the level of 0.1 dex) for these very cool stars. After these selections, we had a sample of 90 stars. We study them in detail in the next sections.
3 Properties of the sample stars
3.1 Stellar atmospheric parameters
In this section we describe how we derived precise stellar parameters for the selected 90 stars for which the initial parameterization by MATISSE suggests that they are solar sibling candidates. For most of the selected stars, several high-resolution (R100.000) spectra were publicly available at the ESO archive. In order to work with spectroscopic data of the highest possible quality, we coadded all the available spectra of the stars that were observed with the same instrument and the same setup. For a few stars, spectra obtained with different instruments were available, and we selected spectra with the highest signal-to-noise ratio (S/N). In this work the signal-to-noise ratio refers to an S/N per angstrom at around 6000 Å. For one of the stars (HD5418), an UVES spectrum was available that covers only blue wavelengths. This wavelength coverage was insufficient to derive the parameters with our technique, and this star was thus excluded from the sample.
The coadded spectra were used to derive precise stellar atmospheric parameters (, [Fe/H], , and ) for the target stars, similar as in our previous works (Sousa et al. 2008, 2015b). For a detailed description we refer to Sousa (2014). The method is based on classical curve-of-growth analysis where the equivalent widths (EW) of the spectral lines are automatically measured with the ARES v2 code111The last version of the ARES code (ARES v2) can be downloaded from http://www.astro.up.pt/sousasag/ares (Sousa et al. 2015a). Under the assumption of local thermodynamic equilibrium (LTE), the parameters were derived by imposing excitation equilibrium and ionization balance for Fe I and Fe II lines. We used the grid of ATLAS9 plane-parallel model atmospheres (Kurucz 1993) and the 2014 version of the MOOG222The source code of MOOG can be downloaded from http://www.as.utexas.edu/chris/moog.html radiative transfer code (Sneden 1973). For stars with 5200 K, we derived the parameters using the line-list compiled in Tsantaki et al. (2013). This list represents a selection of lines presented in Sousa et al. (2008) that do not suffer from blends at low temperatures.
| Star | CPD-60315A | CPD-60315B |
|---|---|---|
| Gaia DR2 | 4677970179987090304 | 4677970179988001280 |
| Gmag (mag) | 9.85410.0005 | 9.68300.0006 |
| (mas) | 9.58090.0277 | 9.58380.0271 |
| RV (km/s) | 11.9291 | 11.5168 |
For eight stars (HD217738, HD207889, HD217739, HD13021, TYC 964-160-1, BD-114934B, BD-114934B, and BD-202665A), the combined spectra had an S/N 50. The spectroscopic analysis of these low-S/N spectra did not allow us to derive very precise stellar parameters and chemical abundances. Our analysis of these stars suggested that they are all more metallic than the Sun by at least 0.1 dex, that is, [Fe/H] 0.1 dex. These stars were excluded from the sample. Moreover, the spectroscopic analysis showed that HD22556 is a spectral binary, and it was excluded from the sample. HD66488 and HD110108 were also excluded since we were unable to derive precise parameters (the method did not converge) for these hot stars ( 6500 K). Finally, we decided to exclude HD29167, which is a member of a binary system that consists of two practically identical stars: CPD-60315A and CPD-60315B (see Table 1). The Gaia DR2 astrometry suggests that they have very similar parallaxes (the difference is 0.0029 mas, while the error of parallax for each component is at least ten times larger), and G magnitudes (the difference is 0.17 mag). ESO archive contains two HARPS spectra for each of the components with an average S/N 30. The spectra are almost identical and suggest almost the same RV. It is unclear if the individual spectra obtained for each component may be contaminated by the companion. We decided to exclude this system from our sample. However, it is a very interesting system to be studied in more detail using spectra with higher quality and ensuring that the two components are observed separately.
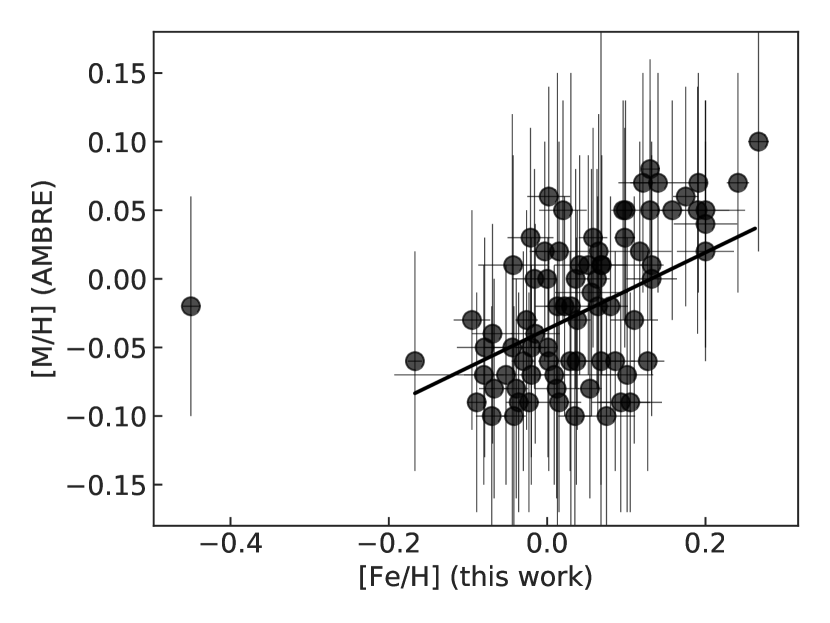
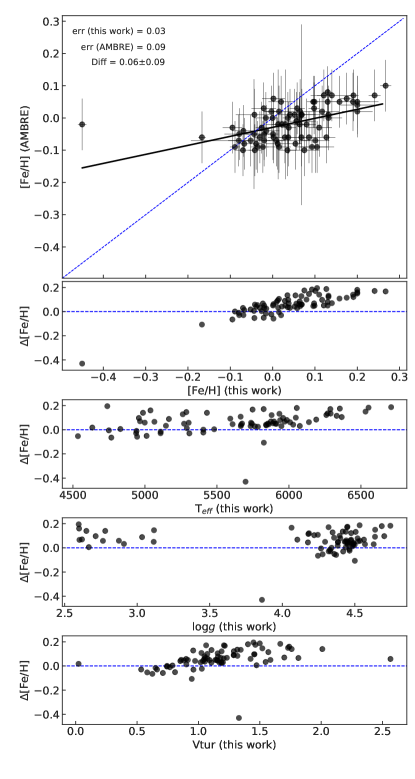
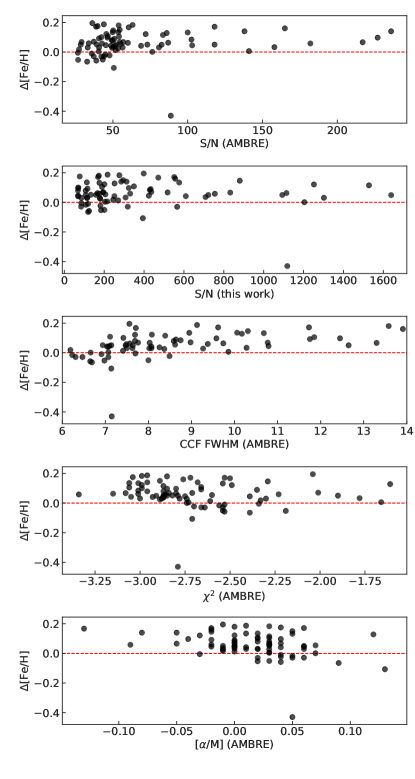
In Fig. 1 we show the comparison between the mean stellar metallicity ([M/H]) derived by the AMBRE team and the metallicity derived in the current work based on iron lines alone ([Fe/H]). The plot shows that in addition to an offset of 0.06 dex and a scatter of 0.09 dex, there is a trend: the overestimation of [Fe/H] relative to [M/H] is higher for stars tht are more metallic. This probably reflects the influence of chemical elements other than iron in the definition of the [M/H] index. HD171028333This star also belongs to the HARPS metal-poor sample of Santos et al. (2011) and is known to host a giant planet (Santos et al. 2007). is clearly an outlier in this plot. Our literature search confirms that it is a metal-poor star, while AMBRE parameterization resulted in a near solar metallicity. The star has 79 spectra in the ESO archive, 47 of which are parameterized by AMBRE. The AMBRE mean metallicity for this star (excluding the results obtained for the ’outlier’ spectrum) is 0.64, which is even lower than what we report in this work. The same happened for some other stars that showed the most discrepant results between AMBRE and this work. It is important to recall that the AMBRE metallicities are derived for individual spectra (sometimes of low quality), while the [Fe/H] in this work is derived from the combined spectra. Without HD171028, the mean difference between [M/H] and [Fe/H] is 0.060.07 dex. The errors of the mean difference here represent the scatter, that is, standard deviation of the differences. To derive the standard error of the mean, these values need to be divided by the square root of the sample size. We note that the average error for [M/H] is 0.09 dex and for [Fe/H] is 0.03 dex. Thus the obtained difference is within the errors of our metallicity derivations.
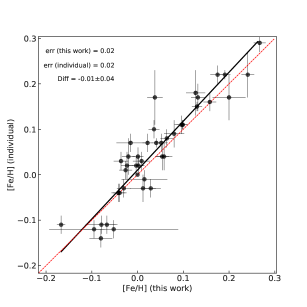
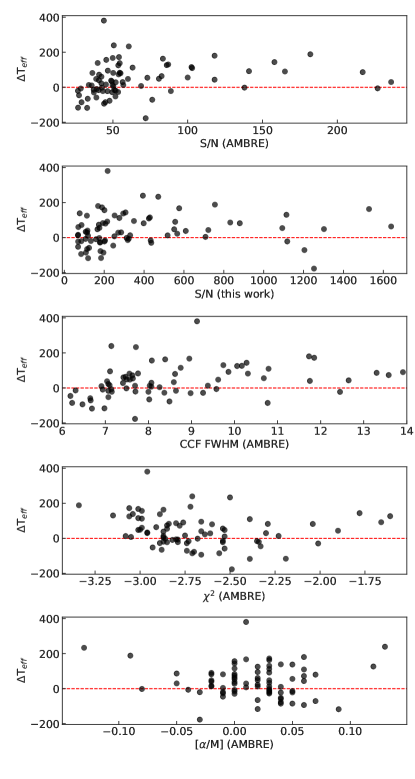
A similar difference (0.0720.10 dex) between AMBRE [M/H] and [Fe/H] (derived by spectral synthesis method) was observed in Mikolaitis et al. (2017) for a much wider range of stellar metallicities. These authors also stressed that these two parameters are not exactly the same and can be different for stars that have different element-over-iron abundances when compared to the solar values. In order to understand the possible reasons of the observed discrepancies, we show in Fig. 8 the [Fe/M] ratio against the stellar atmospheric parameters, and parameters that might influence the results (e.g., S/N, or the CCF FWHM as a proxy of rotational velocity). This ratio, in addition to metallicity, correlates with the microturbulent velocity, effective temperature, and CCF FWHM (full-width at half-maximum of the cross-correlation function). In addition, we also derived the stellar parameters with our EW method using the individual spectra of the stars that were used in the AMBRE project. The comparison between the metallicities derived from individual and coadded spectra is shown in Fig. 9. The plot shows a very good agreement, which suggests that the slightly discrepant results obtained in the AMBRE project and this work are probably related to the methods with which the stellar parameters are derived.
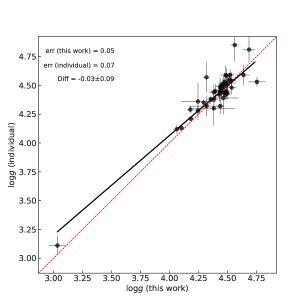
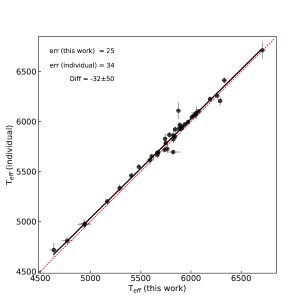
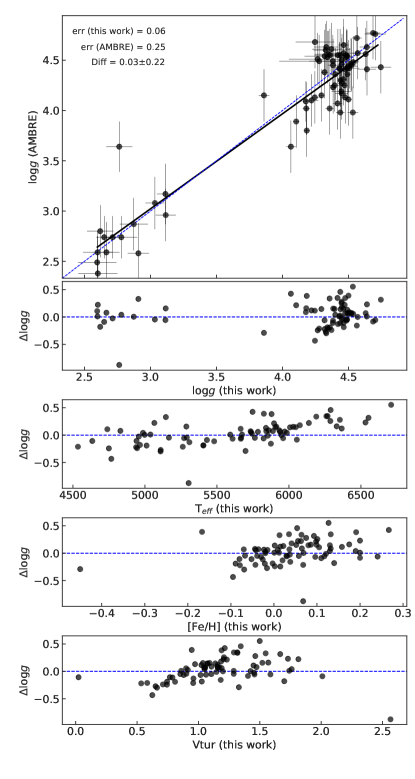
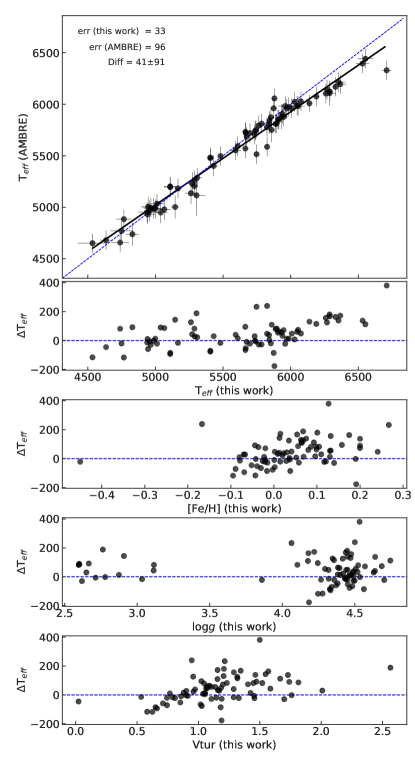
Similar to stellar metallicity, in Figs. 10 and 11 we compare the surface gravity and derived by the AMBRE team and in this work. For , we observe a negligible offset of 0.03 dex and a scatter of 0.22 dex. This scatter can be explained with the average errors of 0.25 dex and 0.06 dex reported for AMBRE and in this work, respectively. For the , we observe a good agreement between the two works. The 4191 K difference is within the reported errors of 96 and 33 K for AMBRE and this work, respectively.
For the further search of the best-fit solar sibling candidates, we restricted our final sample to the stars with [Fe/H] 0.1 dex, which left us with a sample of 55 stars. The stellar parameters of these stars are presented in Table 3. We note that only 23 of these stars were included in the search for solar sibling by Batista et al. (2014).
3.2 Trigonometric surface gravity
A known difficulty of spectroscopic methods is that they cannot constrain the stellar surface gravity with good accuracy (it is typically lower than 0.2 dex, e.g., Sozzetti et al. 2007; Kordopatis et al. 2011; Mortier et al. 2013; Tsantaki et al. 2014). It has been shown that the spectroscopic surface gravity derived with the assumption of an LTE ionization balance does not always agree well with the derived from the transit light curves of exoplanet host stars and asteroseismology (e.g., Mortier et al. 2014). A clear disagreement is also observed between spectroscopic and trigonometric surface gravities (e.g., Tsantaki et al. 2013; Bensby et al. 2014; Delgado Mena et al. 2017). This observed difference between spectroscopic and trigonometric depends on the of the stars (e.g., Delgado Mena et al. 2017). The trigonometric values probably represent the real surface gravity of the stars better since they follow the isochrones in the Hertzsprung-Russell (HR) diagram far better than the spectroscopically derived ones (see e.g., Delgado Mena et al. 2017). Thus we decided to derive trigonometric for the sample stars using Gaia DR2 astrometric data. We note that if no trigonometric is available, the corrections of spectroscopic surface gravities proposed by Mortier et al. (2014) can be used. Since all the targets are bright stars from the solar vicinity, Gaia provides very accurate parallaxes. Only four stars out of the 55 have relative error in worse than 2%, with the largest error being 6.4%.
We calculated the trigonometric using the well-known Newton law of universal gravitation and the Stefan–Boltzmann law (see, e.g., Eq. 1 from Santos et al. 2004). We used the Gaia DR2 parallaxes (Gaia Collaboration et al. 2018), V magnitudes extracted from Simbad444http://simbad.u-strasbg.fr/simbad/, bolometric corrections based on Flower (1996), and revisited by Torres (2010), the stellar masses and spectroscopic . Stellar masses, together with the radii and ages of the stars, were derived from the PARAM v1.3 web interface555http://stev.oapd.inaf.it/cgi-bin/param based on the Padova theoretical isochrones from Bressan et al. (2012) and with the use of a Bayesian estimation method (da Silva et al. 2006). As input parameters for PARAM, we used the V mag, , and spectroscopic and [Fe/H]. As priors for the mass, the initial mass function of Chabrier (2001) was used. No correction for interstellar reddening was needed since all the stars are nearby objects within 200 pc. The results are presented in Table 3.
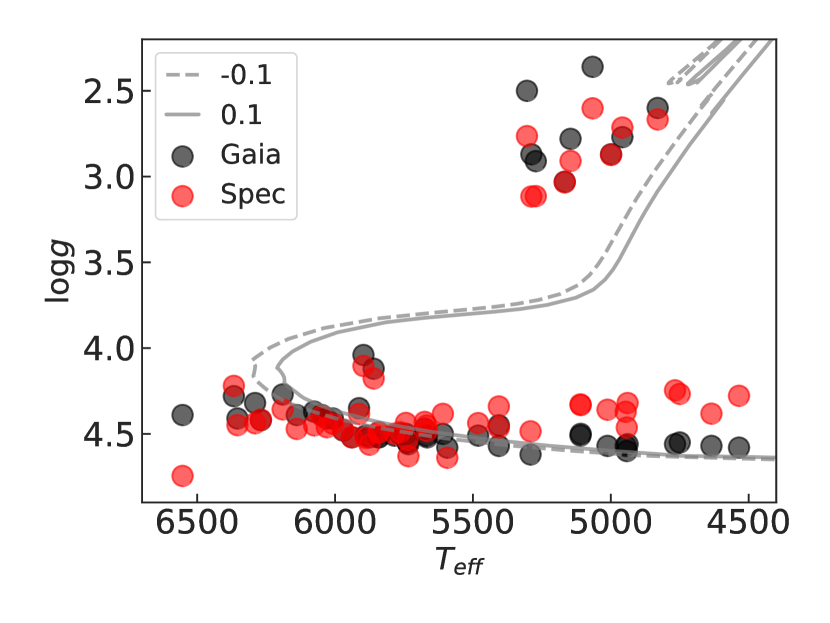
In Fig.2 we show the spectroscopic HR diagram for the sample stars together with the Padova isochrones for solar age and metallicity. The plot clearly demonstrates that the spectroscopic values do not follow the expected stellar evolution curves for cool dwarfs. It is also clear that the evolved stars are too far away from the solar age isochrones (they are mostly very young: see Sect. 3.4).
3.3 Chemical abundances
When we derived chemical abundances of the elements, we generated the model atmospheres for the spectroscopically derived and [Fe/H], and the trigonometric . We did not rederive the and [Fe/H] by fixing the since the effect of an unconstrained on the derivation of other stellar parameters is small for the EW-based curve-of-growth approach (Torres et al. 2012; Mortier et al. 2013). Moreover, although the effect is not very strong, fixing can bias the results and derivation of other atmospheric parameters (Mortier et al. 2014; Smalley 2014).
The chemical abundances were derived in the same way as in our previous works (e.g., Adibekyan et al. 2012; Delgado Mena et al. 2017). We used the same tools and models of atmospheres as for the derivation of stellar parameters. For elements with only a few spectral lines, the EW measurements of ARES were made with careful visual inspection of the spectra. In some very few cases, when the ARES measurements were obviously incorrect (e.g., as a result of cosmic rays or bad pixels close to the spectral line), we manually measured the EWs using the task splot in IRAF666IRAF is distributed by National Optical Astronomy Observatories, operated by the Association of Universities for Research in Astronomy, Inc., under contract with the National Science Foundation, USA.. The final abundances of the elements with more than three measured spectral lines were calculated as a weighted mean of the estimates from each line, where the inverse of the distance from the median abundance was considered as a weight. This method can be effectively used without removing suspected outlier lines (Adibekyan et al. 2015a). For the elements with only two or three lines, we calculated the errors on EWs following Cayrel (1988) to provide more realistic errors for the abundances of elements. This uncertainty takes into account the statistical photometric error that is due to the noise in each pixel and the error related to the continuum placement. The latter contributes most to the total error (Cayrel 1988; Bertran de Lis et al. 2015). These errors were then propagated to derive the abundance uncertainties for each spectral line. The final uncertainties for the average abundance were propagated from the individual errors. The final errors of the [X/H] abundances were calculated as a quadratic sum of the errors due to EW measurements and errors due to uncertainties in the atmospheric parameters. The solar reference abundances were taken from Adibekyan et al. (2016) and Delgado Mena et al. (2017), which were derived using the combined HARPS reflected spectrum (S/N 1300) from Vesta, which we extracted from the ESO public archive. We note that the choice of asteroids from which to obtain the solar reflected spectra and observations at different epochs have effects smaller than 0.01 dex (e.g., Bedell et al. 2014).
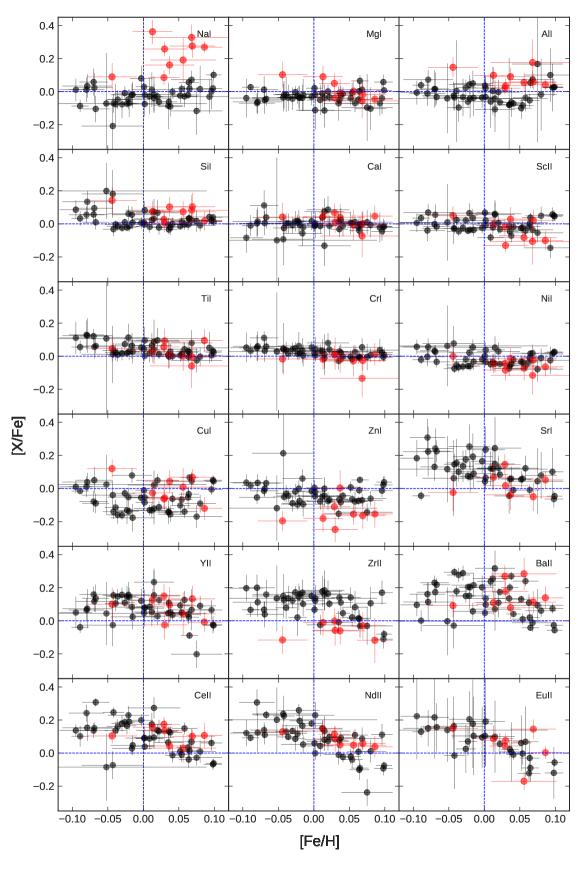
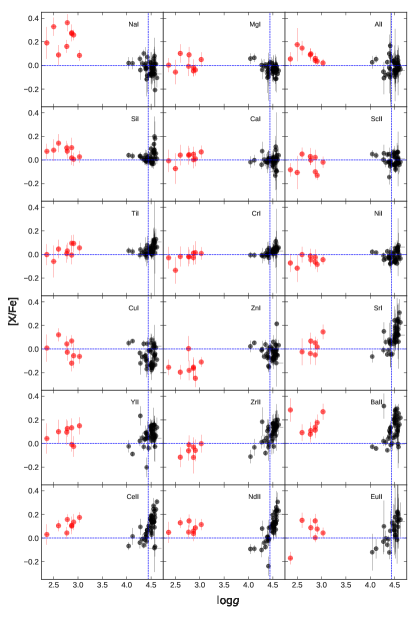
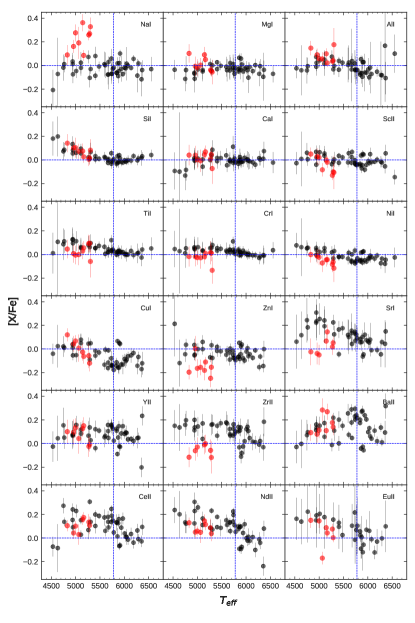
In Figs. 3 and 12 we show the dependence of [X/Fe] abundance ratios on the metallicity, trigonometric surface gravity, and effective temperature. The massive and evolved stars ( 3.5 dex and M 1.5 M⊙) of the sample are shown in red and the dwarf solar-type stars are in black. The abundance of all the stars is presented in an electronically readable table at the CDS. We note that for two relatively fast rotators (HD75006 and HD62816) we were unable to derive abundances of all the elements.
3.4 Stellar ages and activity
 |
One of the main parameters for identifying solar siblings is the stellar age, as the solar siblings are expected to share the same age. As discussed in Sec. 3.2, the stellar ages for the sample stars were derived using the Padova isochrones (Table 4). Although the precise astrometric data of Gaia help increase the precision of stellar ages, for a significant fraction of the stars, the uncertainties of the age estimations are unfortunately still 2-3 Gyr.
Several stellar parameters correlate with stellar age. These chronometers can be used, at least, to cross-check the isochronal ages of the stars. One of the most frequently discussed chronometers is the (R) chromospheric activity indicator (e.g., Mamajek & Hillenbrand 2008; Pace 2013; Lorenzo-Oliveira et al. 2016, 2018). We followed the works of Suárez Mascareño et al. (2015) and Hojjatpanah et al. (2018, in prep.) to measure the emission flux in the cores of the Ca II H&K lines and determine the activity index. For most of the stars we had HARPS spectra available, which cover the wavelength region of Ca II lines. However, for two stars (HD209458 and HD92987), high-resolution UVES spectra that were used to spectroscopically characterize the stars did not cover the Ca II lines. To determine the activity indexes of these stars, we used the HARPS-N777HARPS-N is the northern copy of HARPS and has the same resolution and same spectral coverage (Cosentino et al. 2012). spectrum for HD209458 and the R = 58,000 resolution UVES spectrum that covered 3732-4999Å region for HD92987. The activity indices of the stars can be found in Table 4.
|
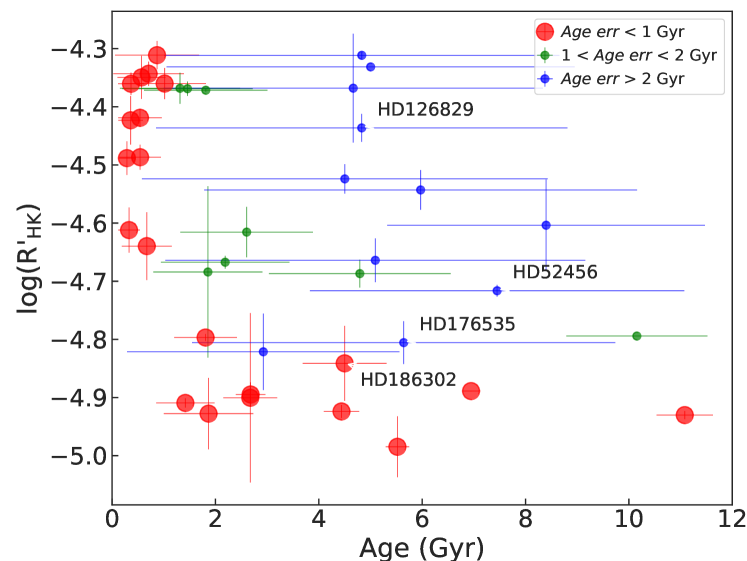
In Fig. 4 we show the dependence of stellar activity on age for the stars with masses 1.2 M⊙. This mass limit corresponds to F3 spectral type. Stars of spectral types earlier than F4 have shallower convection zones and show no correlation between stellar activity, rotation, and age (e.g., Wolff et al. 1985; Garcia-Lopez et al. 1993). Moreover, most of these massive stars are already evolved from the main sequence (MS), for which the age-activity relation is probably not valid (Wright et al. 2004). The figure clearly shows that all the active stars ((R) 4.7 dex) with age estimates with errors 1 Gyr are younger than about 1.5 Gyr. The group of active stars that have isochronal ages older than 4 Gyr is also easily identified. These are the stars with the largest errors in age.
In addition to the chromospheric activity, some abundance ratios can also be used, such as [Y/Mg], (e.g., Nissen 2015; Tucci Maia et al. 2016; Slumstrup et al. 2017; Delgado Mena et al. 2018, Titarenko et al., 2018 submitted), and the Li abundance (e.g., Sestito & Randich 2005; Charbonnel & Talon 2005; Andrássy & Spruit 2015) as an indicator of stellar age. We use these chronometers to verify the robustness of the derived ages for the best-fit solar sibling candidates in Sect. 4.
3.5 Kinematics
During its evolution, the Sun’s birth cluster can have undergone many disruptive processes (e.g., dissolution of the cluster, and non-axisymetric perturbations due to the presence of the bar and spiral arms), which will have spread the solar siblings throughout the Milky Way. Several studies have provided predictions on the current distribution of the solar siblings (e.g., Bland-Hawthorn et al. 2010; Brown et al. 2010; Bobylev & Bajkova 2014; Martínez-Barbosa et al. 2016). Depending on the assumptions about the Galactic model and the number of stars in the initial cluster, different numbers of solar siblings are suggested to be currently present in the solar neighborhood (Bland-Hawthorn et al. 2010; Martínez-Barbosa et al. 2016). These solar siblings are also predicted to have a given kinematics (Bobylev et al. 2011), Galactic coordinates (e.g., Bland-Hawthorn et al. 2010), and phase-space distribution (Martínez-Barbosa et al. 2016).
We calculated the Galactic space velocity components (UVW) by combining the Gaia astrometric data and the RV derived in the current work. When calculating the velocity components with respect to the local standard of rest (LSR), for the solar motion relative to the LSR we adopted the values of (U, V, W)⊙ = (11.1, 12.24, 7.25) km s-1 as measured by Schönrich et al. (2010). The orbital parameters of the sample stars were also derived using the space velocities and the publicly available package galpy888 http://github.com/jobovy/galpy (Bovy 2015). We used the axisymmetric potential MWPotential2014 (Bovy 2015), and assumed R⊙ = 8.34 kpc and Z⊙ = 0.025 kpc (Reid et al. 2014).
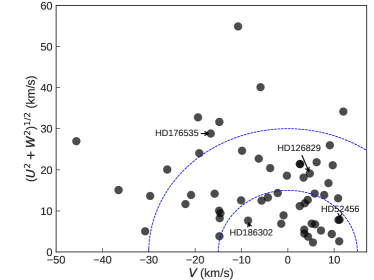
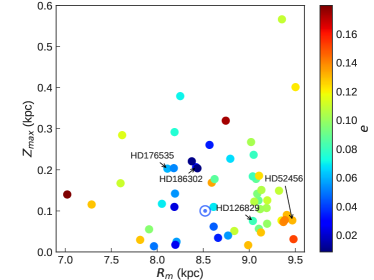
In the left panel of Fig. 5 we show the distribution of the stars in the Toomre diagram. The velocities of the stars are relative to the Sun. We also show the isovelocity curves of Vpec = (U2 + V2 + W2)1/2 = 15 km s-1 and 30 km s-1. The right panel of the same figure shows the dependence of the maximum height from the Galactic plane (Zmax) versus the mean orbital radius (Rm), color-coded by their eccentricities (). The position of the Sun is also shown in the figure. We note that the kinematic parameters of the Sun were calculated using galpy following the instructions in the package manual. The kinematic properties of the stars are presented in Table 5.
4 Selecting the best-fit solar sibling candidates
After deriving the main properties for the sample stars, we can select the best-fit solar sibling candidates. The two main and very strict conditions for solar siblings are i) that they need to be chemically similar to the Sun and ii) that they need to have the same age as the Sun.
4.1 Siblings by chemistry
The level of chemical similarity between the solar siblings depends on the chemical homogeneity of the Sun’s birth cluster. Some theoretical works have suggested that open clusters are chemically homogeneous up to 105 in mass (e.g., Bland-Hawthorn et al. 2010). The very recent work by Armillotta et al. (2018) suggested that the spatial scale of the chemically homogeneous clusters consisting of about 2000 stars is 1 pc. The typical diameter of open clusters is a few parsec (Schilbach et al. 2006). The observed variation of chemical abundances in open clusters (star-to-star abundance scatter) that is due to turbulent mixing in star-forming molecular clouds is much smaller than the initial gas abundance scatter where the stars were formed (e.g., Feng & Krumholz 2014). Most recent observational studies suggest that open clusters are homogeneous at about 0.03 dex level (e.g., Hogg et al. 2016; Liu et al. 2016b; Bovy 2016).
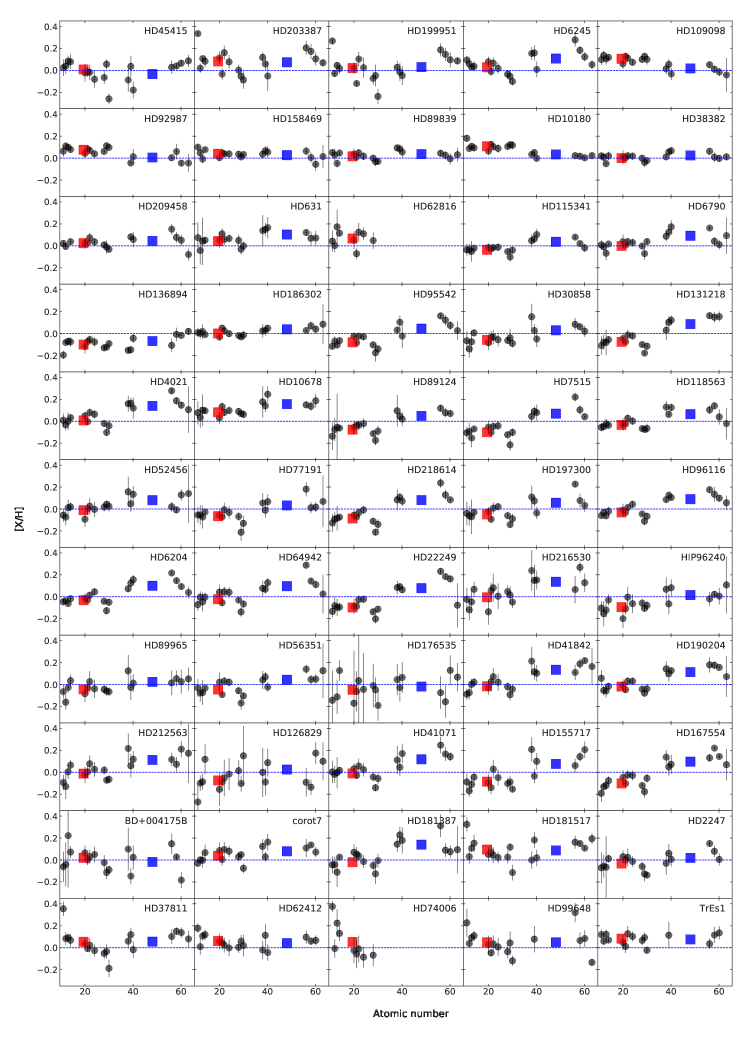
In Fig. 13 we show the chemical abundances of the stars as a function of atomic number. Some stars clearly show a systematic over- or underabundance in heavy elements (Z 30) when compared to the light elements. This high or low heavy-to-light element ratio relative to the solar value is probably a consequence of galactic chemical evolution. The interstellar medium becomes polluted in neutron-capture elements by stars at the asymptotic giant branch (AGB) phase. Thus stars with different ages might show different abundance ratios of light-to-light elements (e.g., Meléndez et al. 2014; Spina et al. 2016). In addition, the enhancement of neutron-capture elements for an individual star can be due to pollution from a companion AGB star (Liu et al. 2016a).
To identify the solar sibling candidates, we selected the stars with metallicities and average chemical abundances of light and heavy elements close to the solar cluster value within the uncertainties. Because of the (possible) chemical inhomogeneity of the Sun’s birth cluster described above, we assumed the solar cluster value for chemistry to be within 0.000.03 dex. The average chemical abundances of the light and heavy elements were calculated as the weighted mean using the inverse of the uncertainties of individual abundances as weights. For evolved massive stars we did not consider the abundance of Na when we calculated the mean abundances because it is overabundant when compared to the dwarfs (see Fig. 12 and e.g., Adibekyan et al. 2015b). The overabundance of Na in giant stars is usually explained as a stellar evolutionary effect (e.g., Jacobson et al. 2007), although an inappropriate spectroscopic analysis method (e.g., not taking into account non-LTE effects, which are stronger for giants than for dwarfs (Alexeeva et al. 2014) can also affect the results. Note that the very recent work by Smiljanic et al. (2016) suggests that the Na abundance of stars with masses below 2 M⊙ is not affected by internal mixing processes.
Our chemical and metallicity selection criteria left us with 12 stars: HD2247, HD45415, HD52456, HD62412, HD74006, HD77191, HD99648, HD115341, HD126829, HD176535, HD186302, and HD199951.
4.2 Siblings by age
| Star | Age([Y/Mg])1 | Age([Y/Si])1 | Age([Y/Mg])2 |
|---|---|---|---|
| Gyr | Gyr | Gyr | |
| HD186302 | 3.11.7 | 2.41.6 | 3.81.7 |
| HD126829 | 3.53.3 | 9.45.1 | 4.23.4 |
| HD176535* | – | 7.84.5 | – |
| HD52456 | 1.02.5 | 2.62.4 | 1.52.6 |
∗No [Mg/H] abundances were derived for this star.
1Based on Delgado Mena et al. (2018, in prep.).
2Based on Tucci Maia et al. (2016).
Very recently, Ness et al. (2018) demonstrated that at solar metallicity ([Fe/H] = 0.000.02 dex), 1% of the field star pairs can have indistinguishable chemical abundances at a 0.03 dex precision level. Chemical identity to the Sun therefore is an important and mandatory criterion, but clearly not enough to identify stellar siblings. In this section we aim at selecting the candidates whose ages are compatible to the age of the Sun.
Five of the 12 selected candidates (HD45415, HD62412, HD74006, HD99648, and HD199951) have M 1.65 M⊙. The lifetimes of these stars are therefore shorter than the current age of the Sun, and thus they cannot be solar siblings. Three other stars have isochronal ages shorter than 3 Gyr: 0.650.50, 1.461.26, and 2.670.52 Gyr for HD2247, HD77191, and HD115341, respectively. These three stars were thus excluded from the sample of best-fit candidates.
The remaining four stars (HD52456, HD126829, HD176535, and HD186302: see Table 2) have isochronal ages similar to the age of the Sun within the uncertainties. It is important to note that except for HD186302, the uncertainties of isochronal ages are larger than 3.5 Gyr (see Table 4), which makes it very difficult to conclude whether they are solar siblings. One of these stars (HD126829) seems to be very active for a solar-age dwarf: (R) = 4.4 dex. The B–V color of this cool K-type star is beyond the range for which Mamajek & Hillenbrand (2008) have calibrated their age-activity relation, and thus we cannot use this chronometric indicator. The relation between chromospheric activity and rotation (and age) is probably more complex at temperatures that are much cooler than the temperature of the Sun (e.g., Noyes et al. 1984; Suárez Mascareño et al. 2016). However, we were able to use the age-activity relation of Mamajek & Hillenbrand (2008) to derive the ages of HD186302 and HD52456, which are 3.8 and 2.2 Gyr, respectively. The errors on this age can be 30-60%, depending on the activity level of the star (Mamajek & Hillenbrand 2008).
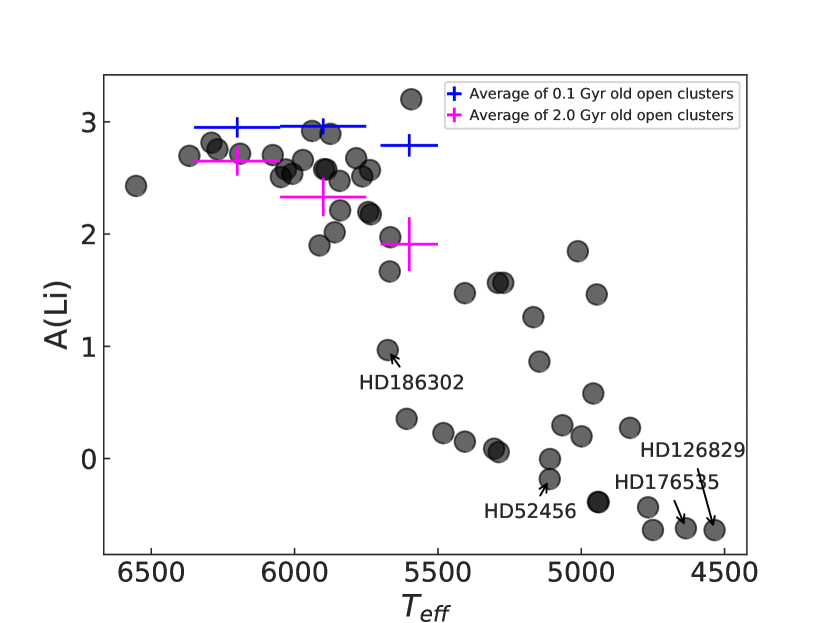
As an independent chronometer, we also examined the Li abundance of these four stars. The Li abundances of the sample stars were derived from the EW measurements of the Li I 6708Å line. We note that to derive an accurate Li abundance, the spectral synthesis method is commonly used (as we did previously, e.g., Delgado Mena et al. 2014, 2015). However, for the purpose of verifying the stellar ages, the fast EW method is sufficient. In Fig. 6 we show the relation between Li abundance and . The plot suggest that all four stars, including the active star HD126829, are not particularly young ( 2 Gyr).
Moreover, as we mentioned in Sect. 3.4, [Y/Mg] and [Y/Si] ratios can also be used to estimate the stellar ages. We used the relation between [Y/Mg] and age, and [Y/Mg] and age provided in Delgado Mena et al. (2018, in prep.), and the [Y/Mg] versus age relation from Tucci Maia et al. (2016). The results are presented in Table 2. Unfortunately, the errors of the age estimates are large and cannot be used to further constrain the ages. Nevertheless, the abundances of HD52456 suggest a young age ( 3 Gyr) for this star. We note that the relations in Delgado Mena et al. (2018, in prep.) and Tucci Maia et al. (2016) are obtained for solar-analog and solar-twin stars and do not cover the temperatures of the three coolest stars in our sample. Thus, the age estimates for these three stars derived by this method should be taken with more caution. Unfortunately, the uncertainty of the age estimations based on the activity and chemical abundances are very large and do not help significantly in making a a better selection on these last candidates.
5 Four best-fit sibling candidates
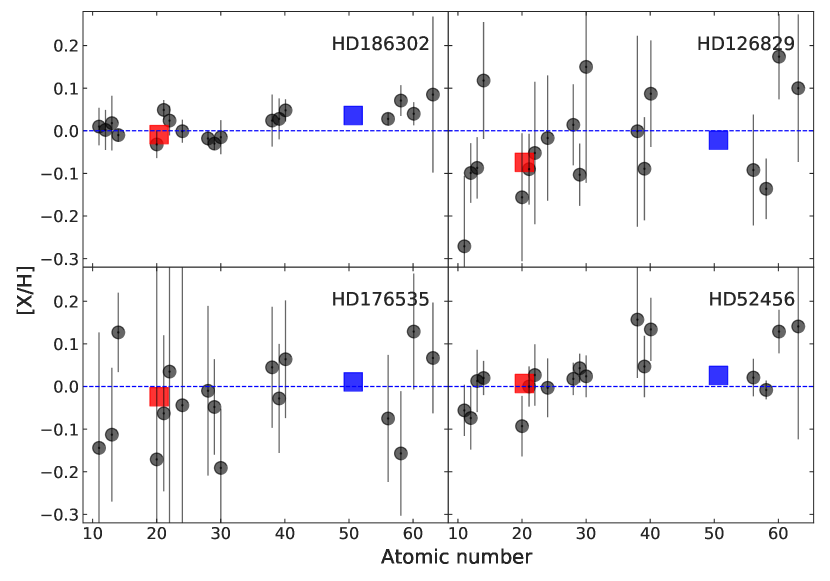
In the previous sections we identified four solar sibling candidates whose chemical abundances (see Fig. 7) and ages are similar to those of our Sun. In this section we explore the kinematic properties and the carbon isotopic ratio of these targets.
5.1 Kinematics and orbits
As described in Sect. 3.5, several attempts have been made to predict the present-day kinematics and orbits of the solar siblings. These predictions are highly dependent on the Galaxy model and the initial properties (e.g., mass and position in the Galaxy) of the parent cluster (see, e.g., Bland-Hawthorn et al. 2010; Martínez-Barbosa et al. 2016, for details and discussion).
In terms of the peculiar velocity and orbital parameters, HD186302 seems to be the closest to the Sun (see Fig. 5). HD176535 is the farthest star in terms of peculiar velocity and HD52456 is most different in terms of galactic orbital parameters. It is clear that these kinematic analyses are only very qualitative. For a quantitative kinematic study, the Galactic orbits of these candidates need to be construced and the orbits have to be integrated backward in time to determine whether their orbits encountered the orbit of the Sun about 4.6 Gyr ago. An obvious limitation of this technique is that serious assumptions are required for the Milky Way model.
5.2 Carbon abundances and isotopic ratios
We also tried to estimate LTE carbon abundances and carbon isotopic ratios (12C/13C) by spectral synthesis for our best-fit sibling candidates. The carbon isotopic ratio is indeed another good indicator of the initial composition of the parent cluster, since this ratio is expected to have remained the same in the atmosphere of dwarf stars (a strong decrease of 12C/13C is only expected after the first dredge-up in low-mass stars). We also recall that isotopic ratios are insensitive to atmospheric parameter uncertainties because the lines originating from identical molecular excitation levels are compared. Moreover, the 12C/13C ratio changes with galactocentric distance (e.g., Wilson & Matteucci 1992) and time (e.g., Kobayashi et al. 2011) and, thus, this ratio could help to characterize the parent cluster. In summary, the solar sibling nature of our best-fit candidates would be supported if carbon abundances and 12C/13C ratios that are close to solar were found.
For such abundance derivations, we analyzed the coadded HARPS spectra of our best-fit candidates around the G band where several C12H and C13H features are expected to be present. Very high resolution and high S/N spectra are required for such an analysis since the 13CH lines are expected to be very weak in metal-rich cool dwarfs because most (99%) of the carbon is 12C. Moreover, a very good linelist is reqquired for the spectral synthesis since there are almost no isolated 13CH lines in such spectra, and several blends need to be investigated. Finally, the spectra of metal-rich cool dwarfs are also difficult to normalize in this spectral domain. Owing to such difficulties, no previous determinations of carbon isotopic ratios in metal-rich cool-dwarfs from CH lines are found in the literature. However, some carbon abundance derivations in such dwarfs have been reported (e.g., Suárez-Andrés et al. 2017) since the pioneering works of Pagel (1964) and Cohen (1968). Some measurements of carbon isotopic ratios are reported in giant stars with lower 12C/13C ratios, and thus stronger 13CH lines (see, e.g., Sneden et al. 1986; Aoki et al. 2006).
Our analysis has been conducted by computing synthetic spectra with the TURBO spectrum code (Alvarez & Plez 1998) and MARCS model atmospheres (Gustafsson et al. 2008) interpolated at the stellar parameters of the sibling candidates. We adopted the CH linelist (including 12CH and 13CH lines) from Masseron et al. (2014) and the Vienna Atomic Line Database999VALD: http://vald.inasan.ru/ vald3/php/vald.php (VALD; Piskunov et al. 1995; Kupka et al. 1999; Ryabchikova et al. 2015). First, we estimated the carbon abundance by comparing the synthetic and observed spectra over a wide wavelength domain around the G band (typically from 4290 to 4320 Å). After fixing the carbon abundance, we examined several spectral regions where the 13CH lines are predicted to be stronger. We point out that since the C13H lines become extremely weak for 12C/13C ratios higher than 60, only a lower limit can be estimated. To validate our procedure, we first analyzed a HARPS spectrum of Vesta and derived A(C) = 8.35 and a lower limit of 12C/13C 70 for the Sun, in agreement with the reference solar values: A(C) = 8.39 dex (Asplund et al. 2005) and 12C/13C = 86.8 (Scott et al. 2006). This method allowed us to derive a carbon abundance equal to 8.40 and 8.35 dex for HD186302 and HD52456, respectively (i.e., a carbon abundance very close to that of the Sun, which confirs their probable sibling nature). Furthermore, their carbon isotopic ratio is found to be higher than 50-60. As for the solar spectrum, their 13CH lines are too weak to analyze them well in crowded spectra, which are difficult to normalize. Moreover, because of such difficulties, it was impossible to derive abundances for the spectra of our two other sibling candidates since they are even cooler and thus suffer from much stronger blends and normalization problems. The reported carbon abundances and upper limits for the 12C/13C ratio in HD186302 and HD52456 agree with the hypothesis that these stars are solar siblings.
6 Summary
As discussed in the introduction, finding solar siblings will help us to better understand the environment in which our Sun has been formed. The search for solar siblings is difficult since these stars are expected to have been spread throughout the Milky Way. Only a handful of solar siblings are expected (depending on how they are dispersed in the Galaxy) to be found in the solar vicinity (Portegies Zwart 2009). Moreover, most of these siblings are expected to have low masses (because of the initial mass function) and thus be faint (Martínez-Barbosa et al. 2016), which means that they are hard to find and then to precisely characterize. Since by definition solar siblings are the stars that were formed with the Sun in the same cluster, i) their chemical abundances must be very similar to those of the Sun (if stellar evolution did not affect the atmospheric chemical composition) and ii) their age must be the same as that of the Sun. In addition, they should have present-day kinematics, suggesting that they have been formed in the same location as the Sun. The predictions about the kinematics and orbits of solar siblings in the vicinity of our Sun is difficult and heavily depends on the characteristics of the solar birth cluster (size, location, etc.) and the adopted Galactic model. We here carried out a mostly chemical and age-based search for solar siblings among the AMBRE stars that are located within about 200 pc ( 5mas). The selected sibling candidates were then briefly studied to understand how similar are they to the Sun in terms of kinematics.
From about 17,000 stars characterized within the AMBRE program, we selected 55 stars with a stellar metallicity ([Fe/H]) from 0.1 to 0.1 dex. For these stars we derived the chemical abundances of several iron-peak, -capture, and neutron-capture elements. Then we selected 12 stars whose average abundances and metallicity are very similar to those of the Sun (by 0.03 dex).
The stellar ages of these 12 sibling candidates, derived by chemistry, allowed us to narrow the 12 stars down to a sample of 4 candidates whose ages are similar to that of the Sun within the uncertainties. The ages of the stars were derived by isochrone fitting. Additional independent age indicators (such as chromospheric activity, Li abundance, and age-sensitive abundance ratios) were also used to confirm or refute the isochronal ages of the stars with large uncertainties. Of the 4 selected stars, HD186302 alone has an isochronal age error of less than 1 Gyr. The other 3 candidates have errors in age greater than 3 Gyr.
Our very simple kinematic study of the four best-fit candidates suggests that HD176535 might be the least likely candidate. HD186302 is the most likely candidate in terms of kinematics.
As a final test, we derived the carbon isotopic ratio for the two hottest ( 5000 K) candidates that were compatible with the solar value. We suggest that other isotopic ratios sensitive to Galactic chemical evolution such as 24Mg/25Mg and 25Mg/26Mg (Kobayashi et al. 2011) can be used to identify solar siblings. For example, Yong et al. (2004) have studied the 24Mg/25Mg and 25Mg/26Mg ratios in Hyades cool dwarfs and found a good agreement in the values of isotope ratios in the stars belonging to the cluster.
We note that we did not consider some important astrophysical effects such as atomic diffusion and extra mixing mechanisms that can affect the atmospheric abundances of the stars during their evolution and also influence the derivation of their isochronal ages (e.g., Dotter et al. 2017). We did not consider either the possibility of a change in stellar surface abundances caused by planet engulfment and/or planet formation (Smith et al. 2001; Meléndez et al. 2009; Ramírez et al. 2010). Some theoretical works support the possible modification of stellar abundances through planet formation (e.g., Kunitomo et al. 2018; Chambers 2010), (but see also Théado & Vauclair 2012; Gustafsson 2018). However, from an observational point of view, the presence of chemical signatures of planet formation in the spectra of stars is still lively debated (see, e.g., Adibekyan et al. 2014, 2017, and references therein).
In summary, we identified four solar sibling candidates in the AMBRE data. Because of its relatively high temperature ( = 5675 K), HD186302 is the most precisely characterized star of the four. Interestingly, HD176535 has previously been identified as a solar sibling candidate by Batista et al. (2014). The other three candidates are cooler, which led to larger errors in the atmospheric parameters, chemical abundances, and ages. Additional spectroscopic characterization of these stars (e.g., using the ESPRESSO ultrahigh-resolution spectra) including derivation of different isotopic ratios will help to confirm or refute their relation with the solar parent cluster.
Acknowledgements.
This work was supported by Fundação para a Ciência e Tecnologia (FCT) through national funds (project ref. PTDC/FIS-AST/7073/2014, PTDC/FIS-AST/32113/2017, and PTDC/FIS-AST/32113/2017) and by Fundo Europeu de Desenvolvimento Regional (FEDER) through the COMPETE 2020 - Programa Operacional Competitividade e Internacionalização (POCI) (project ref. POCI-01-0145-FEDER-007672, POCI-01-0145-FEDER-032113). This work was also supported by FCT, POCI, FEDER in the framework of the project POCI-01-0145-FEDER-032113. V.A., E.D.M, N.C.S., and S.G.S. also acknowledge the support from FCT through Investigador FCT contracts nr. IF/00650/2015/CP1273/CT0001, IF/00849/2015/CP1273/CT0003, IF/00169/2012/CP0150/CT0002, and IF/00028/2014/CP1215/CT0002, respectively, and POPH/FSE (EC) by FEDER funding through the program “Programa Operacional de Factores de Competitividade - COMPETE”. V.A. also acknowledges the support from Observatoire de la Côte d’Azur (OCA) for the visitor program and would like to offer his special thanks to the OCA stuff for all the support during his stay in Nice. P.deL., A.R.B, and G.K. acknowledge financial support form the ANR 14-CE33-014-01. ACSF is supported by grant 234989/2014-9 from CNPq (Brazil).References
- Adams (2010) Adams, F. C. 2010, ARA&A, 48, 47
- Adams & Spergel (2005) Adams, F. C. & Spergel, D. N. 2005, Astrobiology, 5, 497
- Adibekyan et al. (2017) Adibekyan, V., Delgado-Mena, E., Feltzing, S., et al. 2017, Astronomische Nachrichten, 338, 442
- Adibekyan et al. (2016) Adibekyan, V., Delgado-Mena, E., Figueira, P., et al. 2016, A&A, 591, A34
- Adibekyan et al. (2015a) Adibekyan, V., Figueira, P., Santos, N. C., et al. 2015a, A&A, 583, A94
- Adibekyan et al. (2015b) Adibekyan, V. Z., Benamati, L., Santos, N. C., et al. 2015b, MNRAS, 450, 1900
- Adibekyan et al. (2014) Adibekyan, V. Z., González Hernández, J. I., Delgado Mena, E., et al. 2014, A&A, 564, L15
- Adibekyan et al. (2012) Adibekyan, V. Z., Sousa, S. G., Santos, N. C., et al. 2012, A&A, 545, A32
- Alexeeva et al. (2014) Alexeeva, S. A., Pakhomov, Y. V., & Mashonkina, L. I. 2014, Astronomy Letters, 40, 406
- Alvarez & Plez (1998) Alvarez, R. & Plez, B. 1998, A&A, 330, 1109
- Andrássy & Spruit (2015) Andrássy, R. & Spruit, H. C. 2015, A&A, 579, A122
- Aoki et al. (2006) Aoki, W., Frebel, A., Christlieb, N., et al. 2006, ApJ, 639, 897
- Arenou et al. (2018) Arenou, F., Luri, X., Babusiaux, C., et al. 2018, ArXiv e-prints [arXiv:1804.09375]
- Armillotta et al. (2018) Armillotta, L., Krumholz, M. R., & Fujimoto, Y. 2018, ArXiv e-prints [arXiv:1807.01712]
- Asplund et al. (2005) Asplund, M., Grevesse, N., Sauval, A. J., Allende Prieto, C., & Blomme, R. 2005, A&A, 431, 693
- Batista et al. (2014) Batista, S. F. A., Adibekyan, V. Z., Sousa, S. G., et al. 2014, A&A, 564, A43
- Batista & Fernandes (2012) Batista, S. F. A. & Fernandes, J. 2012, New A, 17, 514
- Bedell et al. (2014) Bedell, M., Meléndez, J., Bean, J. L., et al. 2014, ApJ, 795, 23
- Bensby et al. (2014) Bensby, T., Feltzing, S., & Oey, M. S. 2014, A&A, 562, A71
- Bertran de Lis et al. (2015) Bertran de Lis, S., Delgado Mena, E., Adibekyan, V. Z., Santos, N. C., & Sousa, S. G. 2015, A&A, 576, A89
- Bland-Hawthorn et al. (2010) Bland-Hawthorn, J., Krumholz, M. R., & Freeman, K. 2010, ApJ, 713, 166
- Bobylev & Bajkova (2014) Bobylev, V. V. & Bajkova, A. T. 2014, Astronomy Letters, 40, 353
- Bobylev et al. (2011) Bobylev, V. V., Bajkova, A. T., Mylläri, A., & Valtonen, M. 2011, Astronomy Letters, 37, 550
- Bonanno & Fröhlich (2015) Bonanno, A. & Fröhlich, H.-E. 2015, A&A, 580, A130
- Bovy (2015) Bovy, J. 2015, ApJS, 216, 29
- Bovy (2016) Bovy, J. 2016, ApJ, 817, 49
- Bressan et al. (2012) Bressan, A., Marigo, P., Girardi, L., et al. 2012, MNRAS, 427, 127
- Brown et al. (2010) Brown, A. G. A., Portegies Zwart, S. F., & Bean, J. 2010, MNRAS, 407, 458
- Brown et al. (2004) Brown, M. E., Trujillo, C., & Rabinowitz, D. 2004, ApJ, 617, 645
- Cayrel (1988) Cayrel, R. 1988, in IAU Symposium, Vol. 132, The Impact of Very High S/N Spectroscopy on Stellar Physics, ed. G. Cayrel de Strobel & M. Spite, 345
- Chabrier (2001) Chabrier, G. 2001, ApJ, 554, 1274
- Chambers (2010) Chambers, J. E. 2010, ApJ, 724, 92
- Charbonnel & Talon (2005) Charbonnel, C. & Talon, S. 2005, Science, 309, 2189
- Cohen (1968) Cohen, J. G. 1968, Astrophys. Lett., 2, 163
- Cosentino et al. (2012) Cosentino, R., Lovis, C., Pepe, F., et al. 2012, in Proc. SPIE, Vol. 8446, Ground-based and Airborne Instrumentation for Astronomy IV, 84461V
- da Silva et al. (2006) da Silva, L., Girardi, L., Pasquini, L., et al. 2006, A&A, 458, 609
- de Laverny et al. (2013) de Laverny, P., Recio-Blanco, A., Worley, C. C., et al. 2013, The Messenger, 153, 18
- de Laverny et al. (2012) de Laverny, P., Recio-Blanco, A., Worley, C. C., & Plez, B. 2012, A&A, 544, A126
- De Pascale et al. (2014) De Pascale, M., Worley, C. C., de Laverny, P., et al. 2014, A&A, 570, A68
- Delgado Mena et al. (2015) Delgado Mena, E., Bertrán de Lis, S., Adibekyan, V. Z., et al. 2015, A&A, 576, A69
- Delgado Mena et al. (2014) Delgado Mena, E., Israelian, G., González Hernández, J. I., et al. 2014, A&A, 562, A92
- Delgado Mena et al. (2017) Delgado Mena, E., Tsantaki, M., Adibekyan, V. Z., et al. 2017, A&A, 606, A94
- Delgado Mena et al. (2018) Delgado Mena, E., Tsantaki, M., Zh. Adibekyan, V., et al. 2018, in IAU Symposium, Vol. 330, IAU Symposium, ed. A. Recio-Blanco, P. de Laverny, A. G. A. Brown, & T. Prusti, 156–159
- Dotter et al. (2017) Dotter, A., Conroy, C., Cargile, P., & Asplund, M. 2017, ApJ, 840, 99
- Feng & Krumholz (2014) Feng, Y. & Krumholz, M. R. 2014, Nature, 513, 523
- Flower (1996) Flower, P. J. 1996, ApJ, 469, 355
- Gaia Collaboration et al. (2018) Gaia Collaboration, Brown, A. G. A., Vallenari, A., et al. 2018, ArXiv e-prints [arXiv:1804.09365]
- Garcia-Lopez et al. (1993) Garcia-Lopez, R. J., Rebolo, R., Beckman, J. E., & McKeith, C. D. 1993, A&A, 273, 482
- Gustafsson (2018) Gustafsson, B. 2018, ArXiv e-prints [arXiv:1809.02361]
- Gustafsson et al. (2008) Gustafsson, B., Edvardsson, B., Eriksson, K., et al. 2008, A&A, 486, 951
- Hogg et al. (2016) Hogg, D. W., Casey, A. R., Ness, M., et al. 2016, ApJ, 833, 262
- Jacobson et al. (2007) Jacobson, H. R., Friel, E. D., & Pilachowski, C. A. 2007, AJ, 134, 1216
- Kobayashi et al. (2011) Kobayashi, C., Karakas, A. I., & Umeda, H. 2011, MNRAS, 414, 3231
- Kordopatis et al. (2011) Kordopatis, G., Recio-Blanco, A., de Laverny, P., et al. 2011, A&A, 535, A106
- Kunitomo et al. (2018) Kunitomo, M., Guillot, T., Ida, S., & Takeuchi, T. 2018, ArXiv e-prints [arXiv:1808.07396]
- Kupka et al. (1999) Kupka, F., Piskunov, N., Ryabchikova, T. A., Stempels, H. C., & Weiss, W. W. 1999, A&AS, 138, 119
- Kurucz (1993) Kurucz, R. L. 1993, SYNTHE spectrum synthesis programs and line data
- Lada & Lada (2003) Lada, C. J. & Lada, E. A. 2003, ARA&A, 41, 57
- Lamers & Gieles (2006) Lamers, H. J. G. L. M. & Gieles, M. 2006, A&A, 455, L17
- Lindegren et al. (2018) Lindegren, L., Hernandez, J., Bombrun, A., et al. 2018, ArXiv e-prints [arXiv:1804.09366]
- Liu et al. (2015) Liu, C., Ruchti, G., Feltzing, S., et al. 2015, A&A, 575, A51
- Liu et al. (2016a) Liu, F., Asplund, M., Yong, D., et al. 2016a, MNRAS, 463, 696
- Liu et al. (2016b) Liu, F., Yong, D., Asplund, M., Ramírez, I., & Meléndez, J. 2016b, MNRAS, 457, 3934
- Looney et al. (2006) Looney, L. W., Tobin, J. J., & Fields, B. D. 2006, ApJ, 652, 1755
- Lorenzo-Oliveira et al. (2018) Lorenzo-Oliveira, D., Freitas, F. C., Meléndez, J., et al. 2018, ArXiv e-prints [arXiv:1806.08014]
- Lorenzo-Oliveira et al. (2016) Lorenzo-Oliveira, D., Porto de Mello, G. F., & Schiavon, R. P. 2016, A&A, 594, L3
- Luri et al. (2018) Luri, X., Brown, A. G. A., Sarro, L. M., et al. 2018, A&A, 616, A9
- Mamajek & Hillenbrand (2008) Mamajek, E. E. & Hillenbrand, L. A. 2008, ApJ, 687, 1264
- Martínez-Barbosa et al. (2016) Martínez-Barbosa, C. A., Brown, A. G. A., Boekholt, T., et al. 2016, MNRAS, 457, 1062
- Masseron et al. (2014) Masseron, T., Plez, B., Van Eck, S., et al. 2014, A&A, 571, A47
- Meléndez et al. (2009) Meléndez, J., Asplund, M., Gustafsson, B., & Yong, D. 2009, ApJ, 704, L66
- Meléndez et al. (2014) Meléndez, J., Ramírez, I., Karakas, A. I., et al. 2014, ApJ, 791, 14
- Mikolaitis et al. (2017) Mikolaitis, Š., de Laverny, P., Recio-Blanco, A., et al. 2017, A&A, 600, A22
- Morbidelli & Levison (2004) Morbidelli, A. & Levison, H. F. 2004, AJ, 128, 2564
- Mortier et al. (2013) Mortier, A., Santos, N. C., Sousa, S. G., et al. 2013, A&A, 558, A106
- Mortier et al. (2014) Mortier, A., Sousa, S. G., Adibekyan, V. Z., Brandão, I. M., & Santos, N. C. 2014, A&A, 572, A95
- Ness et al. (2018) Ness, M., Rix, H.-W., Hogg, D. W., et al. 2018, ApJ, 853, 198
- Nissen (2015) Nissen, P. E. 2015, A&A, 579, A52
- Noyes et al. (1984) Noyes, R. W., Hartmann, L. W., Baliunas, S. L., Duncan, D. K., & Vaughan, A. H. 1984, ApJ, 279, 763
- Pace (2013) Pace, G. 2013, A&A, 551, L8
- Pagel (1964) Pagel, B. E. J. 1964, Royal Greenwich Observatory Bulletins, 87, 227
- Piskunov et al. (2006) Piskunov, A. E., Kharchenko, N. V., Röser, S., Schilbach, E., & Scholz, R.-D. 2006, A&A, 445, 545
- Piskunov et al. (1995) Piskunov, N. E., Kupka, F., Ryabchikova, T. A., Weiss, W. W., & Jeffery, C. S. 1995, A&AS, 112, 525
- Portegies Zwart (2009) Portegies Zwart, S. F. 2009, ApJ, 696, L13
- Ramírez et al. (2010) Ramírez, I., Asplund, M., Baumann, P., Meléndez, J., & Bensby, T. 2010, A&A, 521, A33
- Ramírez et al. (2014) Ramírez, I., Bajkova, A. T., Bobylev, V. V., et al. 2014, ApJ, 787, 154
- Recio-Blanco et al. (2006) Recio-Blanco, A., Bijaoui, A., & de Laverny, P. 2006, MNRAS, 370, 141
- Reid et al. (2014) Reid, M. J., Menten, K. M., Brunthaler, A., et al. 2014, ApJ, 783, 130
- Ryabchikova et al. (2015) Ryabchikova, T., Piskunov, N., Kurucz, R. L., et al. 2015, Phys. Scr, 90, 054005
- Santos et al. (2004) Santos, N. C., Israelian, G., & Mayor, M. 2004, A&A, 415, 1153
- Santos et al. (2011) Santos, N. C., Mayor, M., Bonfils, X., et al. 2011, A&A, 526, A112
- Santos et al. (2007) Santos, N. C., Mayor, M., Bouchy, F., et al. 2007, A&A, 474, 647
- Schilbach et al. (2006) Schilbach, E., Kharchenko, N. V., Piskunov, A. E., Röser, S., & Scholz, R.-D. 2006, A&A, 456, 523
- Schönrich et al. (2010) Schönrich, R., Binney, J., & Dehnen, W. 2010, MNRAS, 403, 1829
- Scott et al. (2006) Scott, P. C., Asplund, M., Grevesse, N., & Sauval, A. J. 2006, A&A, 456, 675
- Sestito & Randich (2005) Sestito, P. & Randich, S. 2005, A&A, 442, 615
- Slumstrup et al. (2017) Slumstrup, D., Grundahl, F., Brogaard, K., et al. 2017, A&A, 604, L8
- Smalley (2014) Smalley, B. 2014, Stellar Parameters from Photometry, ed. E. Niemczura, B. Smalley, & W. Pych (Cham: Springer International Publishing), 111–120
- Smiljanic et al. (2016) Smiljanic, R., Romano, D., Bragaglia, A., et al. 2016, A&A, 589, A115
- Smith et al. (2001) Smith, V. V., Cunha, K., & Lazzaro, D. 2001, AJ, 121, 3207
- Sneden et al. (1986) Sneden, C., Pilachowski, C. A., & Vandenberg, D. A. 1986, ApJ, 311, 826
- Sneden (1973) Sneden, C. A. 1973, PhD thesis, THE UNIVERSITY OF TEXAS AT AUSTIN.
- Sousa (2014) Sousa, S. G. 2014, [arXiv:1407.5817] [arXiv:1407.5817]
- Sousa et al. (2015a) Sousa, S. G., Santos, N. C., Adibekyan, V., Delgado-Mena, E., & Israelian, G. 2015a, A&A, 577, A67
- Sousa et al. (2008) Sousa, S. G., Santos, N. C., Mayor, M., et al. 2008, A&A, 487, 373
- Sousa et al. (2015b) Sousa, S. G., Santos, N. C., Mortier, A., et al. 2015b, A&A, 576, A94
- Sozzetti et al. (2007) Sozzetti, A., Torres, G., Charbonneau, D., et al. 2007, ApJ, 664, 1190
- Spina et al. (2016) Spina, L., Meléndez, J., & Ramírez, I. 2016, A&A, 585, A152
- Suárez-Andrés et al. (2017) Suárez-Andrés, L., Israelian, G., González Hernández, J. I., et al. 2017, A&A, 599, A96
- Suárez Mascareño et al. (2016) Suárez Mascareño, A., Rebolo, R., & González Hernández, J. I. 2016, A&A, 595, A12
- Suárez Mascareño et al. (2015) Suárez Mascareño, A., Rebolo, R., González Hernández, J. I., & Esposito, M. 2015, MNRAS, 452, 2745
- Tepfer & Leach (2006) Tepfer, D. & Leach, S. 2006, Ap&SS, 306, 69
- Théado & Vauclair (2012) Théado, S. & Vauclair, S. 2012, ApJ, 744, 123
- Torres (2010) Torres, G. 2010, AJ, 140, 1158
- Torres et al. (2012) Torres, G., Fischer, D. A., Sozzetti, A., et al. 2012, ApJ, 757, 161
- Tsantaki et al. (2013) Tsantaki, M., Sousa, S. G., Adibekyan, V. Z., et al. 2013, A&A, 555, A150
- Tsantaki et al. (2014) Tsantaki, M., Sousa, S. G., Santos, N. C., et al. 2014, A&A, 570, A80
- Tucci Maia et al. (2016) Tucci Maia, M., Ramírez, I., Meléndez, J., et al. 2016, A&A, 590, A32
- van Leeuwen (2007) van Leeuwen, F. 2007, A&A, 474, 653
- von Bloh et al. (2003) von Bloh, W., Franck, S., Bounama, C., & Schellnhuber, H.-J. 2003, Origins of Life and Evolution of the Biosphere, 33, 219
- Weidner & Kroupa (2004) Weidner, C. & Kroupa, P. 2004, MNRAS, 348, 187
- Williams & Gaidos (2007) Williams, J. P. & Gaidos, E. 2007, ApJ, 663, L33
- Wilson & Matteucci (1992) Wilson, T. L. & Matteucci, F. 1992, A&A Rev., 4, 1
- Wolff et al. (1985) Wolff, S. C., Heasley, J. N., & Varsik, J. 1985, PASP, 97, 707
- Worley et al. (2016) Worley, C. C., de Laverny, P., Recio-Blanco, A., Hill, V., & Bijaoui, A. 2016, A&A, 591, A81
- Worley et al. (2012) Worley, C. C., de Laverny, P., Recio-Blanco, A., et al. 2012, A&A, 542, A48
- Wright et al. (2004) Wright, J. T., Marcy, G. W., Butler, R. P., & Vogt, S. S. 2004, ApJS, 152, 261
- Yong et al. (2004) Yong, D., Lambert, D. L., Allende Prieto, C., & Paulson, D. B. 2004, ApJ, 603, 697
Appendix A Tables
| Star | spec | gaia | [Fe/H] | S/N | ||
|---|---|---|---|---|---|---|
| HD631 | 604828 | 4.400.04 | 4.390.01 | 0.080.02 | 1.070.04 | 70 |
| HD2247 | 626929 | 4.420.04 | 4.420.01 | 0.040.02 | 1.320.04 | 113 |
| HD4021 | 576425 | 4.490.04 | 4.500.01 | 0.060.02 | 1.110.03 | 178 |
| HD6204 | 584316 | 4.490.03 | 4.520.01 | 0.040.01 | 1.050.02 | 708 |
| HD6245 | 516725 | 3.030.07 | 3.030.01 | 0.030.02 | 1.290.03 | 433 |
| HD6790 | 603019 | 4.460.03 | 4.410.01 | 0.050.01 | 1.040.03 | 251 |
| HD7515 | 588921 | 4.520.03 | 4.510.01 | 0.040.02 | 1.050.03 | 206 |
| HD10180 | 591314 | 4.380.02 | 4.350.01 | 0.100.01 | 1.090.02 | 1639 |
| HD10678 | 560920 | 4.380.04 | 4.500.01 | 0.100.02 | 0.880.03 | 69 |
| HD22249 | 573720 | 4.540.04 | 4.550.01 | 0.040.02 | 0.900.03 | 175 |
| HD30858 | 510945 | 4.330.09 | 4.500.02 | 0.070.03 | 0.660.10 | 84 |
| HD37811 | 514631 | 2.910.08 | 2.780.01 | 0.010.03 | 1.550.03 | 307 |
| HD38382 | 607613 | 4.450.03 | 4.370.01 | 0.040.01 | 1.190.02 | 1302 |
| HD41071 | 559340 | 4.640.05 | 4.580.01 | 0.010.03 | 1.290.06 | 116 |
| HD41842 | 501251 | 4.360.12 | 4.570.02 | 0.020.03 | 0.810.12 | 201 |
| HD45415 | 483047 | 2.670.10 | 2.600.04 | 0.040.04 | 1.470.05 | 215 |
| HD52456 | 511046 | 4.330.09 | 4.510.02 | 0.020.03 | 0.650.11 | 108 |
| HD56351 | 573419 | 4.630.02 | 4.560.01 | 0.070.02 | 1.170.00 | 114 |
| HD62412 | 495842 | 2.710.08 | 2.770.02 | 0.040.04 | 1.450.04 | 323 |
| HD62816 | 655357 | 4.750.08 | 4.390.02 | 0.090.04 | 1.670.08 | 276 |
| HD64942 | 587522 | 4.560.04 | 4.520.01 | 0.040.02 | 1.180.03 | 196 |
| HD74006 | 530464 | 2.760.10 | 2.500.03 | 0.070.06 | 2.570.11 | 755 |
| HD77191 | 578540 | 4.500.07 | 4.510.02 | 0.020.03 | 1.190.06 | 180 |
| HD89124 | 566818 | 4.450.03 | 4.510.01 | 0.040.02 | 0.850.03 | 69 |
| HD89839 | 629020 | 4.440.03 | 4.320.01 | 0.050.02 | 1.350.03 | 576 |
| HD89965 | 493968 | 4.320.15 | 4.560.03 | 0.080.04 | 0.530.21 | 318 |
| HD92987 | 586015 | 4.180.02 | 4.120.01 | 0.070.01 | 1.160.02 | 424 |
| HD95542 | 597117 | 4.480.03 | 4.480.01 | 0.020.01 | 1.060.03 | 518 |
| HD96116 | 584114 | 4.490.02 | 4.520.01 | 0.020.01 | 0.970.02 | 609 |
| HD99648 | 506650 | 2.600.15 | 2.360.02 | 0.060.05 | 1.820.06 | 832 |
| HD109098 | 589716 | 4.100.02 | 4.040.01 | 0.100.01 | 1.230.02 | 193 |
| HD115341 | 600817 | 4.440.02 | 4.410.01 | 0.000.01 | 1.070.02 | 166 |
| HD118563 | 548119 | 4.440.04 | 4.510.01 | 0.030.01 | 0.790.03 | 204 |
| HD126829 | 4535108 | 4.280.30 | 4.580.04 | 0.040.04 | 0.580.40 | 184 |
| HD131218 | 574317 | 4.440.03 | 4.500.01 | 0.020.01 | 0.910.03 | 107 |
| HD136894 | 540616 | 4.340.03 | 4.450.01 | 0.090.01 | 0.750.03 | 1204 |
| HD155717 | 494255 | 4.460.13 | 4.600.02 | 0.080.03 | 0.770.12 | 119 |
| HD158469 | 619019 | 4.360.03 | 4.270.01 | 0.060.01 | 1.320.02 | 429 |
| HD167554 | 529128 | 4.490.05 | 4.620.01 | 0.070.02 | 0.900.06 | 270 |
| HD176535 | 463546 | 4.380.18 | 4.570.02 | 0.050.14 | 0.023.52 | 245 |
| HD181387 | 636744 | 4.220.05 | 4.280.01 | 0.020.03 | 1.160.09 | 189 |
| HD181517 | 499941 | 2.870.11 | 2.870.03 | 0.070.03 | 1.430.04 | 330 |
| HD186302 | 567515 | 4.430.02 | 4.470.01 | 0.000.01 | 0.860.03 | 159 |
| HD190204 | 540623 | 4.460.04 | 4.570.01 | 0.000.02 | 1.030.04 | 181 |
| HD197300 | 593924 | 4.520.03 | 4.520.01 | 0.010.02 | 1.160.03 | 107 |
| HD199951 | 527237 | 3.110.07 | 2.910.02 | 0.030.03 | 1.590.03 | 722 |
| HD203387 | 528828 | 3.120.08 | 2.870.01 | 0.090.03 | 1.520.03 | 880 |
| HD209458 | 613921 | 4.470.03 | 4.390.01 | 0.060.02 | 1.210.03 | 1114 |
| HD212563 | 494653 | 4.370.15 | 4.570.02 | 0.000.03 | 0.710.13 | 124 |
| HD216530 | 475084 | 4.270.22 | 4.550.03 | 0.020.04 | 0.740.22 | 85 |
| HD218614 | 566620 | 4.480.03 | 4.520.01 | 0.030.02 | 1.020.03 | 114 |
| HIP96240 | 476755 | 4.250.15 | 4.560.02 | 0.100.02 | 0.630.14 | 119 |
| BD+004175B | 635450 | 4.450.05 | 4.410.02 | 0.080.04 | 1.460.07 | 77 |
| CoRoT-7 | 530937 | 4.420.09 | 4.560.02 | 0.020.03 | 0.960.07 | 566 |
| Star | Mstar | Rstar | Agepadova | ) |
|---|---|---|---|---|
| HD631 | 1.140.02 | 1.110.02 | 1.870.87 | 4.930.06 |
| HD2247 | 1.210.02 | 1.160.03 | 0.650.50 | 5.290.13 |
| HD4021 | 1.040.02 | 0.950.01 | 1.020.80 | 4.360.03 |
| HD6204 | 1.050.01 | 0.950.01 | 0.290.17 | 4.490.03 |
| HD6245 | 2.340.02 | 7.530.19 | 0.770.02 | 4.840.05 |
| HD6790 | 1.120.01 | 1.090.02 | 1.810.61 | 4.800.01 |
| HD7515 | 1.040.01 | 0.950.02 | 0.540.42 | 4.420.02 |
| HD10180 | 1.080.01 | 1.150.00 | 4.440.34 | 4.920.01 |
| HD10678 | 1.000.02 | 0.910.01 | 2.191.24 | 4.670.01 |
| HD22249 | 1.000.01 | 0.870.01 | 0.540.40 | 4.490.02 |
| HD30858 | 0.820.02 | 0.790.01 | 8.403.07 | 4.600.08 |
| HD37811 | 2.830.03 | 10.930.24 | 0.460.01 | 5.280.01 |
| HD38382 | 1.130.01 | 1.150.00 | 2.680.29 | 4.890.02 |
| HD41071 | 0.950.02 | 0.840.02 | 0.870.81 | 4.310.02 |
| HD41842 | 0.810.02 | 0.750.01 | 4.673.67 | 4.370.09 |
| HD45415 | 1.650.15 | 10.450.36 | 2.220.55 | 5.430.01 |
| HD52456 | 0.830.02 | 0.800.01 | 7.453.62 | 4.720.01 |
| HD56351 | 0.980.01 | 0.870.00 | 0.570.47 | 4.350.04 |
| HD62412 | 2.340.09 | 10.40.20 | 0.870.13 | 5.200.03 |
| HD62816 | 1.300.02 | 1.250.02 | 0.350.22 | 4.770.03 |
| HD64942 | 1.060.01 | 0.960.00 | 0.360.24 | 4.420.04 |
| HD74006 | 3.450.12 | 16.581.23 | 0.270.02 | 5.060.02 |
| HD77191 | 1.010.02 | 0.930.02 | 1.461.26 | 4.370.01 |
| HD89124 | 0.970.02 | 0.910.01 | 2.601.28 | 4.620.04 |
| HD89839 | 1.220.01 | 1.260.00 | 1.950.27 | 4.980.10 |
| HD89965 | 0.790.02 | 0.730.01 | 5.094.06 | 4.660.04 |
| HD92987 | 1.100.01 | 1.510.01 | 6.950.16 | 4.890.00 |
| HD95542 | 1.080.01 | 1.000.01 | 0.670.48 | 4.640.06 |
| HD96116 | 1.050.01 | 0.950.01 | 0.330.21 | 4.610.04 |
| HD99648 | 3.660.11 | 19.921.38 | 0.230.02 | 4.770.00 |
| HD109098 | 1.180.01 | 1.690.04 | 5.520.23 | 4.980.05 |
| HD115341 | 1.090.01 | 1.070.03 | 2.670.52 | 4.900.15 |
| HD118563 | 0.910.02 | 0.870.01 | 4.791.76 | 4.690.02 |
| HD126829 | 0.710.01 | 0.660.01 | 4.833.98 | 4.440.02 |
| HD131218 | 1.000.02 | 0.910.01 | 1.851.06 | 4.680.15 |
| HD136894 | 0.850.01 | 0.870.01 | 11.080.55 | 4.930.01 |
| HD155717 | 0.770.02 | 0.720.01 | 4.503.93 | 4.520.03 |
| HD158469 | 1.200.00 | 1.320.01 | 3.030.18 | 4.950.02 |
| HD167554 | 0.860.01 | 0.760.00 | 0.710.68 | 4.340.02 |
| HD176535 | 0.750.02 | 0.690.02 | 5.644.10 | 4.810.04 |
| HD181387 | 1.250.02 | 1.340.03 | 2.000.41 | 5.060.04 |
| HD181517 | 2.330.13 | 9.330.31 | 0.840.16 | 5.380.06 |
| HD186302 | 0.970.01 | 0.950.01 | 4.500.81 | 4.840.06 |
| HD190204 | 0.920.02 | 0.830.02 | 1.311.16 | 4.370.03 |
| HD197300 | 1.070.01 | 0.960.00 | 0.370.25 | 4.360.02 |
| HD199951 | 2.570.05 | 9.030.32 | 0.600.03 | 4.650.03 |
| HD203387 | 2.670.03 | 9.640.29 | 0.550.02 | 4.720.01 |
| HD209458 | 1.170.02 | 1.140.02 | 1.420.56 | 4.910.01 |
| HD212563 | 0.800.02 | 0.750.02 | 4.833.83 | 4.310.01 |
| HD216530 | 0.770.02 | 0.720.01 | 5.003.95 | 4.330.00 |
| HD218614 | 0.980.02 | 0.890.02 | 1.811.19 | 4.370.00 |
| HIP96240 | 0.750.02 | 0.700.01 | 5.974.19 | 4.540.03 |
| BD+004175B | 1.220.02 | 1.160.02 | 0.560.42 | 5.020.09 |
| CoRoT-7 | 0.890.02 | 0.810.02 | 2.932.64 | 4.820.07 |
| NAME TrES-1 | 0.880.01 | 0.910.01 | 10.151.37 | 4.790.00 |
| Star | RV | ULSR | VLSR | WLSR | Z | R | Zmax | Rper | Rap | |
|---|---|---|---|---|---|---|---|---|---|---|
| HD631 | 31.9 | 5.5 | 23.1 | 22.0 | 0.026 | 8.354 | 0.122 | 0.401 | 10.662 | 8.342 |
| HD2247 | 20.6 | 6.4 | 4.8 | 14.7 | 0.115 | 8.336 | 0.034 | 0.261 | 8.860 | 8.275 |
| HD4021 | 3.0 | 11.2 | 15.5 | 10.8 | 0.034 | 8.344 | 0.088 | 0.178 | 9.872 | 8.275 |
| HD6204 | 3.0 | 8.7 | 14.6 | 11.4 | 0.026 | 8.351 | 0.081 | 0.184 | 9.769 | 8.306 |
| HD6245 | 1.5 | 9.9 | 16.5 | 7.2 | 0.046 | 8.329 | 0.090 | 0.125 | 9.923 | 8.277 |
| HD6790 | 23.8 | 1.5 | 20.2 | 29.3 | 0.071 | 8.335 | 0.109 | 0.566 | 10.375 | 8.334 |
| HD7515 | 1.0 | 24.2 | 5.4 | 10.9 | 0.050 | 8.327 | 0.087 | 0.177 | 9.374 | 7.871 |
| HD10180 | 35.4 | 20.4 | 3.7 | 23.3 | 0.007 | 8.332 | 0.071 | 0.379 | 8.832 | 7.666 |
| HD10678 | 16.0 | 15.9 | 3.5 | 1.4 | 0.013 | 8.332 | 0.056 | 0.025 | 8.673 | 7.746 |
| HD22249 | 15.9 | 4.9 | 3.7 | 0.3 | 0.017 | 8.348 | 0.025 | 0.017 | 8.402 | 7.990 |
| HD30858 | 25.9 | 0.6 | 1.2 | 13.8 | 0.006 | 8.368 | 0.008 | 0.204 | 8.506 | 8.366 |
| HD37811 | 5.6 | 31.5 | 13.8 | 1.9 | 0.030 | 8.395 | 0.129 | 0.048 | 10.301 | 7.951 |
| HD38382 | 37.8 | 16.8 | 8.3 | 8.0 | 0.015 | 8.357 | 0.070 | 0.117 | 8.612 | 7.488 |
| HD41071 | 24.9 | 0.1 | 9.8 | 1.0 | 0.000 | 8.355 | 0.049 | 0.014 | 8.355 | 7.572 |
| HD41842 | 12.4 | 0.0 | 6.8 | 2.2 | 0.012 | 8.360 | 0.035 | 0.034 | 8.961 | 8.360 |
| HD45415 | 52.7 | 39.7 | 0.4 | 10.4 | 0.019 | 8.421 | 0.135 | 0.169 | 9.749 | 7.434 |
| HD52456 | 12.0 | 19.5 | 22.3 | 4.1 | 0.028 | 8.365 | 0.131 | 0.077 | 10.710 | 8.225 |
| HD56351 | 5.0 | 18.8 | 16.2 | 9.3 | 0.008 | 8.344 | 0.105 | 0.151 | 10.090 | 8.173 |
| HD62412 | 16.1 | 31.7 | 20.8 | 0.9 | 0.023 | 8.388 | 0.152 | 0.031 | 10.918 | 8.043 |
| HD62816 | 4.5 | 16.5 | 14.7 | 8.5 | 0.032 | 8.378 | 0.094 | 0.142 | 9.942 | 8.230 |
| HD64942 | 8.4 | 23.4 | 13.7 | 7.2 | 0.033 | 8.372 | 0.106 | 0.122 | 10.017 | 8.091 |
| HD74006 | 11.4 | 28.7 | 19.9 | 4.0 | 0.032 | 8.366 | 0.141 | 0.078 | 10.707 | 8.064 |
| HD77191 | 7.5 | 14.2 | 17.0 | 0.8 | 0.059 | 8.380 | 0.099 | 0.069 | 10.106 | 8.280 |
| HD89124 | 4.0 | 17.4 | 18.3 | 7.7 | 0.012 | 8.319 | 0.110 | 0.126 | 10.206 | 8.184 |
| HD89839 | 31.9 | 15.3 | 19.7 | 11.3 | 0.028 | 8.329 | 0.111 | 0.167 | 8.442 | 6.759 |
| HD89965 | 7.0 | 8.1 | 20.6 | 8.5 | 0.042 | 8.342 | 0.108 | 0.149 | 10.331 | 8.314 |
| HD92987 | 4.5 | 13.0 | 9.7 | 14.1 | 0.038 | 8.335 | 0.067 | 0.227 | 9.384 | 8.203 |
| HD95542 | 15.4 | 15.3 | 3.7 | 9.6 | 0.019 | 8.320 | 0.055 | 0.142 | 8.640 | 7.745 |
| HD96116 | 31.3 | 31.1 | 14.9 | 0.5 | 0.027 | 8.321 | 0.128 | 0.029 | 8.816 | 6.812 |
| HD99648 | 8.8 | 28.8 | 14.5 | 0.1 | 0.159 | 8.354 | 0.124 | 0.186 | 10.231 | 7.981 |
| HD109098 | 2.0 | 1.3 | 15.4 | 13.5 | 0.075 | 8.329 | 0.079 | 0.236 | 9.766 | 8.328 |
| HD115341 | 19.4 | 21.5 | 4.7 | 18.0 | 0.065 | 8.322 | 0.076 | 0.292 | 8.806 | 7.569 |
| HD118563 | 18.9 | 8.7 | 17.3 | 1.1 | 0.047 | 8.305 | 0.092 | 0.056 | 9.941 | 8.266 |
| HD126829 | 18.4 | 3.6 | 15.8 | 3.4 | 0.048 | 8.316 | 0.081 | 0.075 | 9.769 | 8.309 |
| HD131218 | 24.9 | 23.4 | 11.0 | 3.8 | 0.008 | 8.306 | 0.096 | 0.055 | 8.671 | 7.151 |
| HD136894 | 6.4 | 6.3 | 10.2 | 0.6 | 0.036 | 8.317 | 0.055 | 0.040 | 9.255 | 8.283 |
| HD155717 | 12.5 | 20.5 | 14.8 | 15.8 | 0.043 | 8.297 | 0.103 | 0.267 | 9.951 | 8.087 |
| HD158469 | 39.3 | 50.8 | 5.2 | 18.3 | 0.021 | 8.274 | 0.174 | 0.319 | 10.268 | 7.220 |
| HD167554 | 21.9 | 32.4 | 13.7 | 0.2 | 0.014 | 8.283 | 0.130 | 0.017 | 10.154 | 7.821 |
| HD176535 | 31.9 | 15.9 | 5.5 | 13.6 | 0.020 | 8.306 | 0.060 | 0.203 | 8.596 | 7.623 |
| HD181387 | 32.0 | 2.8 | 25.4 | 8.2 | 0.009 | 8.221 | 0.129 | 0.116 | 8.225 | 6.348 |
| HD181517 | 10.0 | 15.6 | 8.9 | 6.7 | 0.040 | 8.215 | 0.069 | 0.110 | 9.204 | 8.020 |
| HD186302 | 1.0 | 8.4 | 2.5 | 13.8 | 0.004 | 8.300 | 0.032 | 0.206 | 8.688 | 8.154 |
| HD190204 | 13.0 | 25.0 | 22.0 | 4.4 | 0.009 | 8.285 | 0.139 | 0.073 | 10.677 | 8.064 |
| HD197300 | 13.9 | 7.9 | 7.3 | 4.2 | 0.009 | 8.294 | 0.045 | 0.062 | 9.002 | 8.223 |
| HD199951 | 19.0 | 27.8 | 10.9 | 2.9 | 0.019 | 8.289 | 0.109 | 0.051 | 9.801 | 7.872 |
| HD203387 | 12.4 | 11.2 | 18.9 | 6.6 | 0.015 | 8.301 | 0.103 | 0.107 | 10.133 | 8.244 |
| HD209458 | 15.0 | 4.0 | 3.6 | 7.7 | 0.002 | 8.330 | 0.022 | 0.110 | 8.370 | 8.002 |
| HD212563 | 13.4 | 2.3 | 1.0 | 14.9 | 0.012 | 8.319 | 0.010 | 0.221 | 8.461 | 8.289 |
| HD216530 | 14.0 | 16.0 | 16.9 | 6.4 | 0.016 | 8.318 | 0.101 | 0.104 | 10.044 | 8.193 |
| HD218614 | 7.9 | 19.8 | 22.0 | 5.2 | 0.022 | 8.327 | 0.130 | 0.090 | 10.633 | 8.182 |
| HIP96240 | 5.0 | 12.4 | 22.2 | 4.7 | 0.009 | 8.295 | 0.119 | 0.077 | 10.465 | 8.235 |
| BD+004175B | 47.0 | 14.6 | 34.5 | 9.8 | 0.009 | 8.221 | 0.180 | 0.140 | 8.283 | 5.759 |
| CoRoT-7 | 31.2 | 11.0 | 8.0 | 13.5 | 0.019 | 8.474 | 0.053 | 0.204 | 8.611 | 7.748 |
| NAME TrES-1 | 20.7 | 20.7 | 18.6 | 18.0 | 0.062 | 8.282 | 0.115 | 0.284 | 8.491 | 6.744 |
Appendix B Comparison of stellar parameters
|
|
|
|
Appendix C Abundances
|
 |