[cor1]Corresponding author: bmihov@astro.bas.bg \corresp[cor2]lslav@astro.bas.bg
A Study of the High-Luminosity Quasar HS 1946+7658
Abstract
We study the variability of the quasar HS 1946+7658 on intra-night time scale based on both our own optical and archival X-ray data. We find the quasar non-variable during about 11 hours of optical monitoring. This is in accordance with the low intra-night variability duty cycle of radio-quiet quasars. Regarding the X-rays, we cannot make a firm conclusion about the quasar variability owing to the controversial results of the light curves statistical analysis. In addition, we calibrated Johnson-Cousins magnitudes of 7 field stars that are to be used as secondary standards.
1 INTRODUCTION
Variability is a common property of active galactic nuclei (AGNs). It could be efficiently used to study their structure and properties. In particular, monitoring of high-luminosity quasars allows us to probe the near vicinity of most massive black holes [1].
HS 1946+7658 is a high-redshift ( = 3.051, [2]), high-luminosity (, [3]), radio-quiet [4] quasar. It was discovered in the course of the Hamburg Quasar Survey [5]. At that time this object was the most luminous quasar known. Its total luminosity is in excess of [5].
Since July 1997 we have initiated a photometric monitoring of HS 1946+7658 in order to do a characterization of its variability on various time scales: intra-night (from minutes to hours), short-term (from days to weeks), and long-term (from months to years). The first results of our monitoring were presented in Ref. [6]. No evidence for strong variability during one year of monitoring was reported.
In this study we present the results from the optical and X-ray intra-night monitoring of HS 1946+7658. To calibrate our photometry and facilitate further monitoring of the quasar, we establish a secondary standard sequence in its field.
| ID | ||||||||
| C | 16.713 0.022 | 0.044 | 4.552 | 4 | 15.972 0.015 | 0.034 | 3.180 | 5 |
| R1 | 17.895 0.016 | 0.033 | 2.328 | 4 | 17.222 0.014 | 0.031 | 2.591 | 5 |
| R2 | 17.975 0.022 | 0.045 | 4.291 | 4 | 16.995 0.018 | 0.041 | 4.487 | 5 |
| R3 | 18.465 0.024 | 0.048 | 4.545 | 4 | 17.659 0.017 | 0.039 | 4.029 | 5 |
| R4 | 16.270 0.022 | 0.044 | 4.595 | 4 | 15.482 0.010 | 0.021 | 1.250 | 5 |
| R5 | 16.459 0.012 | 0.025 | 1.426 | 4 | 15.612 0.011 | 0.024 | 1.632 | 5 |
| R6 | 18.829 0.014 | 0.029 | 1.403 | 4 | 17.301 0.012 | 0.027 | 1.892 | 5 |
| C | 15.544 0.011 | 0.011 | 0.209 | 5 | 15.144 0.012 | 0.022 | 1.394 | 3 |
| R1 | 16.835 0.011 | 0.020 | 0.661 | 5 | 16.426 0.027 | 0.047 | 6.341 | 3 |
| R2 | 16.461 0.011 | 0.018 | 0.528 | 5 | 15.971 0.023 | 0.040 | 4.693 | 3 |
| R3 | 17.192 0.011 | 0.017 | 0.457 | 5 | 16.728 0.020 | 0.035 | 3.272 | 3 |
| R4 | 15.004 0.011 | 0.014 | 0.330 | 5 | 14.561 0.011 | 0.019 | 1.072 | 3 |
| R5 | 15.128 0.011 | 0.022 | 0.851 | 5 | 14.651 0.019 | 0.033 | 3.169 | 3 |
| R6 | 16.236 0.014 | 0.030 | 1.861 | 5 | 15.085 0.012 | 0.021 | 1.302 | 3 |
| Evening Date | Duration | |||
| ; | ; | |||
| Jul 27, 2003 | 3.16 | 1.03 | ||
| 126; 016 | 24 | 0.012; 2.229 | 0.008; 1.117 | 1.50 |
| Jan 26, 2009 | 2.17 | 1.25 | ||
| 404; 058 | 48 | 0.030; 1.026 | 0.020; 0.732 | 1.18 |
| Jun 04, 2011 | 4.99 | 1.21 | ||
| 217; 025 | 58 | 0.013; 0.788 | 0.011; 0.835 | 0.96 |
2 SECONDARY STANDARD SEQUENCE
In order to calibrate secondary Johnson-Cousins standard stars in the field of HS 1946+7658, we observed the standard sequence established in the globular cluster M 92 (e.g., [7]) at least at two different airmasses. The observations were performed during the following nights:
-
•
Jul 16, 2009, Aug 5, 6, 7, 2013, and Aug 20, 2014 in the band.
-
•
Jul 18,1998, Apr 17, 1999, Jul 16, 2009, Aug 5, 6, 7, 2013, and Aug 20, 2014 in the bands.
-
•
Aug 5, 6, 7, 2013 and Aug 20, 2014 in the band.
We used the 2 m telescope (2MT; [8], [9]) of the Rozhen National Astronomical Observatory (NAO) equipped with Photometrics AT200111This camera has pixels of m size resulting in a scale factor of 0309 px-1. (1998 and 1999 data) and Princeton Instruments VersArray:1300B222This camera has pixels of m size resulting in a scale factor of 0258 px-1. (2009–2014 data) CCD cameras. The images of both HS 1946+7658 and M 92 fields were de-biased, flat fielded (using twilight flats), de-fringed (regarding all -band frames and the deepest -band ones), cosmic ray hit cleaned, and co-added using eso-midas and idl packages. The photometry and transformation to the standard system were performed as in Ref. [10]. We applied the spatial dependent systematic error correction only for the 1998 and 1999 data following Ref. [7].
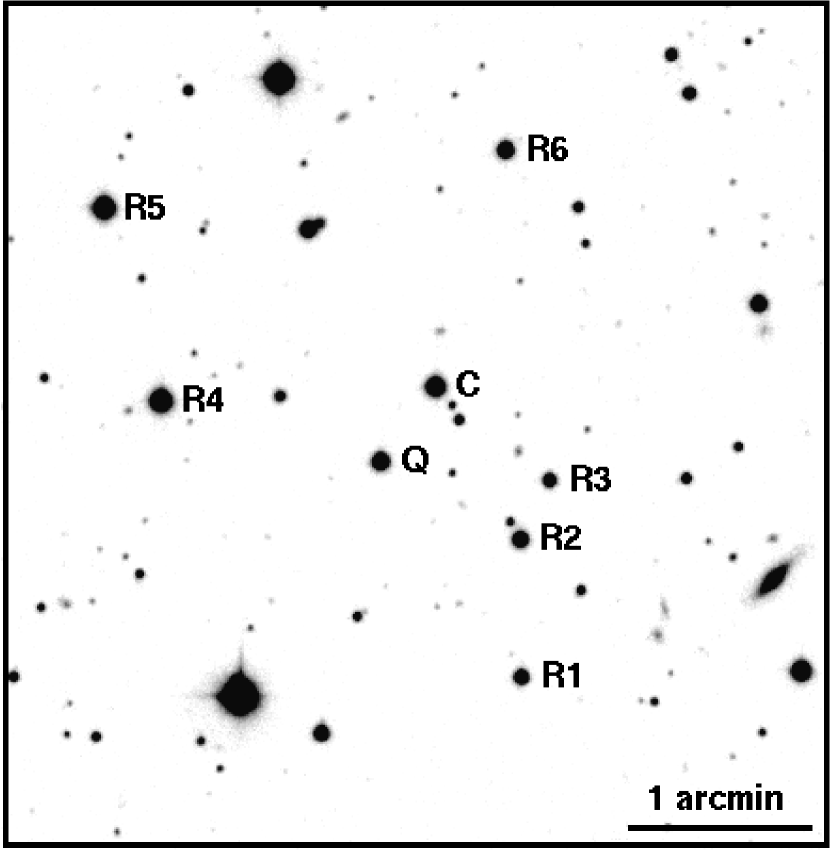
The final weight-averaged magnitudes of the standard stars were estimated after removing up to two most deviant individual measurements. The finding chart of the standard sequence is shown in Figure 2. The star closest in position and magnitude to HS 1946+7658 (star C) is suitable to be used as a control star in the photometry of the quasar. The derived magnitudes of the stars are listed in Table 1, together with the weighted standard deviation about the mean magnitude (), the reduced figure-of-merit of the averaging (), and the number of the epochs being averaged (). The standard stars show no intrinsic variability.
3 INTRA-NIGHT OPTICAL MONITORING
The Cousins band intra-night monitoring of HS 1946+7658 was performed during three nights with the 2MT and the 50/70 cm Schmidt telescope (ST; [11], [12], [13]) of NAO with the following light detectors:
-
•
AT200 CCD camera (at the 2MT) for Jul 27, 2003.
-
•
SBIG STL-11000M CCD camera (at the ST, pixel size of 9 m or ) for Jan 26, 2009.
-
•
FLI PL16803 CCD camera (at the ST, pixel size of 9 m or ) for Jun 4, 2011.
The exposure times of the quasar field were 150–300 sec for the 2MT and 120–300 sec for the ST333Due to tracking problems the exposure times at the ST are limited to few minutes.. All CCD frames were bias/dark subtracted and flat fielded using twilight flats. Aperture photometry of the objects of interest was then performed using daophot package run under idl444https://idlastro.gsfc.nasa.gov/. The optimal aperture radii were set to arcsec in the case of 2MT, 5′′ for ST/STL-11000M, and 4′′ for ST/PL16803.
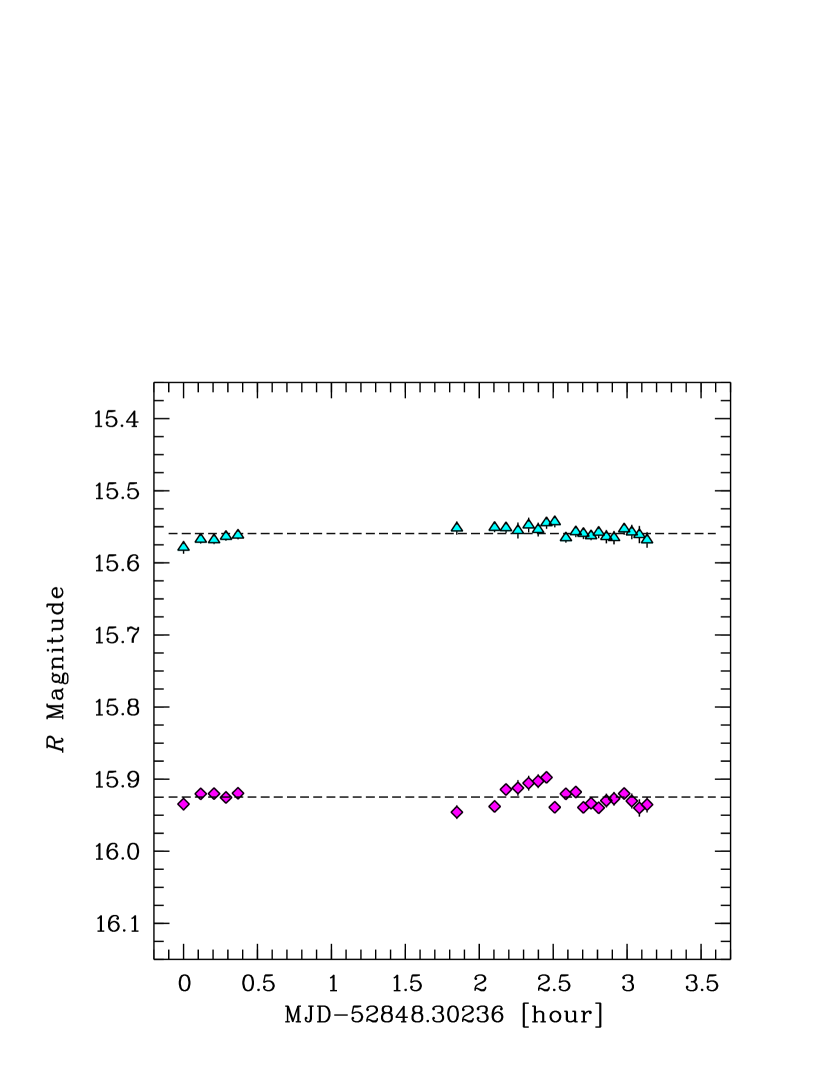
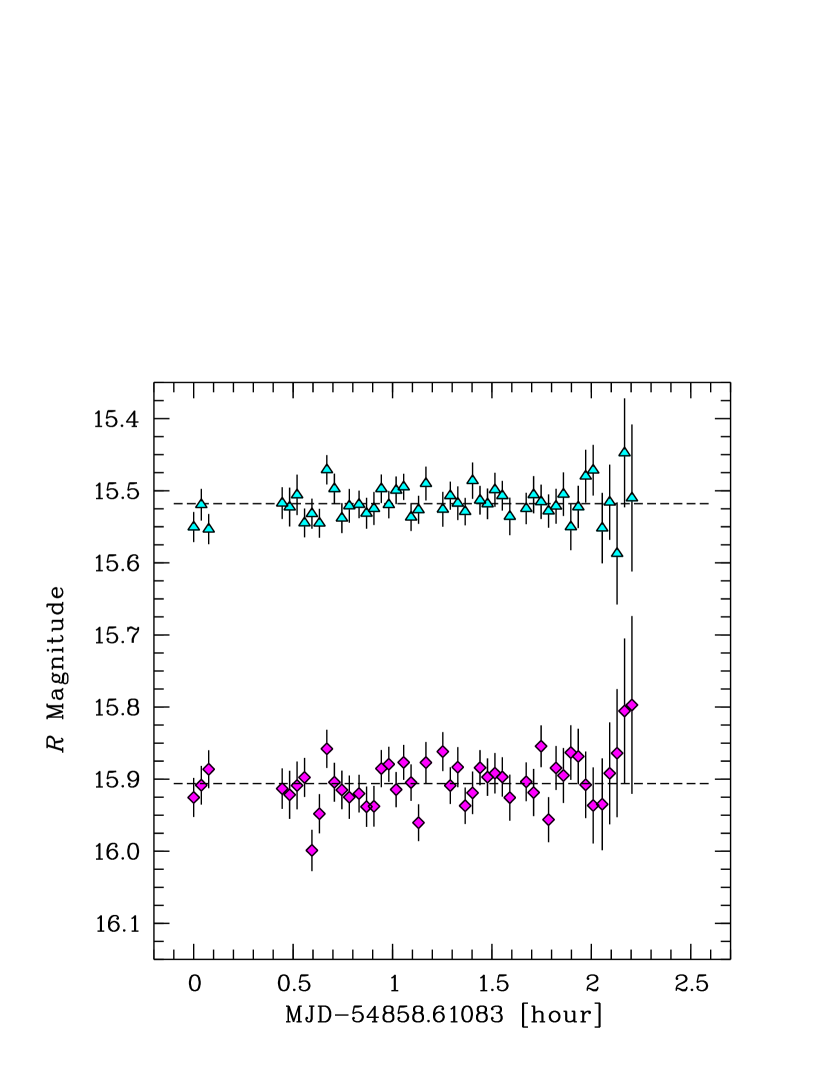
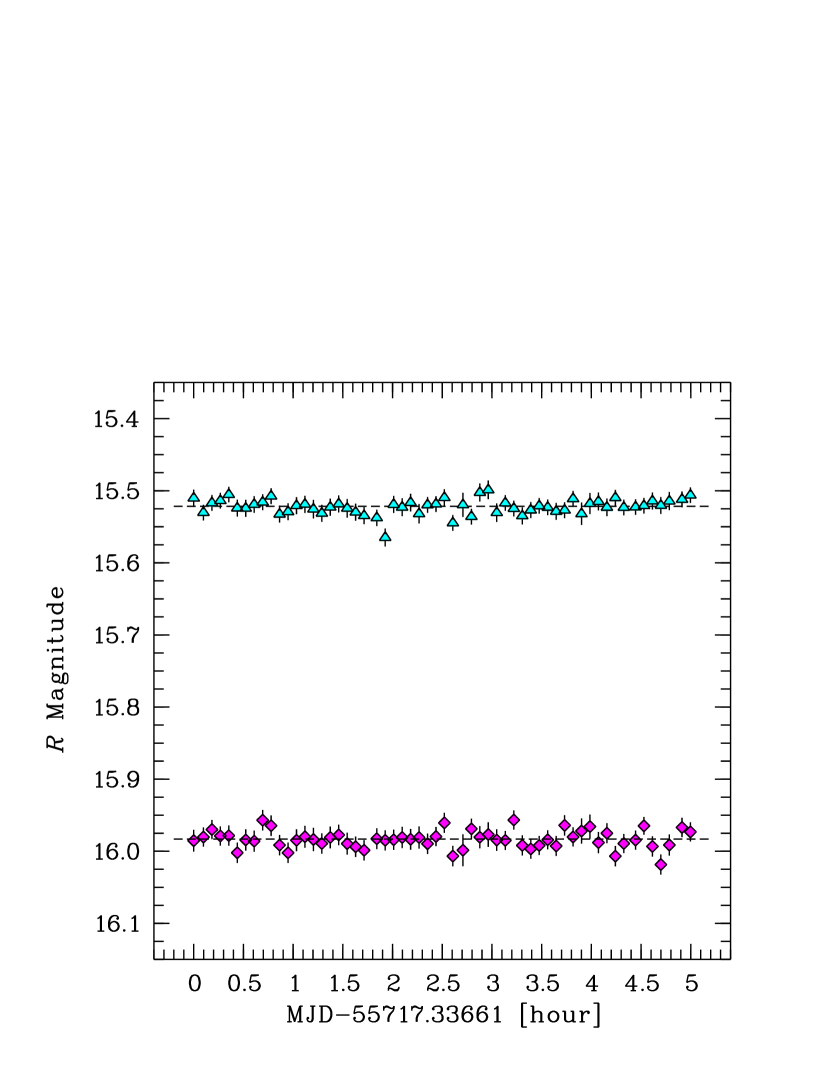
For each frame we computed a zero-point with respect to each reference star, , where and are the instrumental and standard magnitudes of the -th reference star, respectively. Next, the zero-points were weight-averaged, . Finally, the most deviant zero-point was removed and the remaining ones were weight-averaged again. The calibrated magnitudes of the quasar and control star were obtained as . The resulting light curves are plotted in Figure 2 for the 2MT and in Figure 4 and 4 for the ST. The characteristics of the intra-night light curves are given in Table 2. The first row lists the evening date, the monitoring duration in hours, the weight-averaged band magnitudes of the quasar and control star, and the scaling factor (, see below). The second row lists the median during the monitoring, together with the standard deviation about it, the number of the light curve data points (), the weighted standard deviation about the mean magnitudes (), together with the reduced figure-of-merit of the averaging (), and the value of (see below). We did not take into account the colour coefficients, so, this resulted in differences in the magnitudes measured at the 2MT and ST. In addition, the quasar magnitudes are subject to its intrinsic long-term variability.
The search for intra-night variability was performed using the test [14], which compares the standard deviations of the quasar and the control star light curves:
It states that a source is variable at 99.5% confidence level if . Before applying the test we derived the scale factor:
which is the ratio of the median uncertainty of the quasar and the control star magnitudes (e.g., [15]). Thus, the test is scaled as follows:
According to the values of , the quasar does not show variability at 99.5% confidence level. This result is consistent with the general lack of intra-night variability in high-luminosity, high-redshift radio-quiet quasars [16].
4 X-RAY LIGHT CURVES
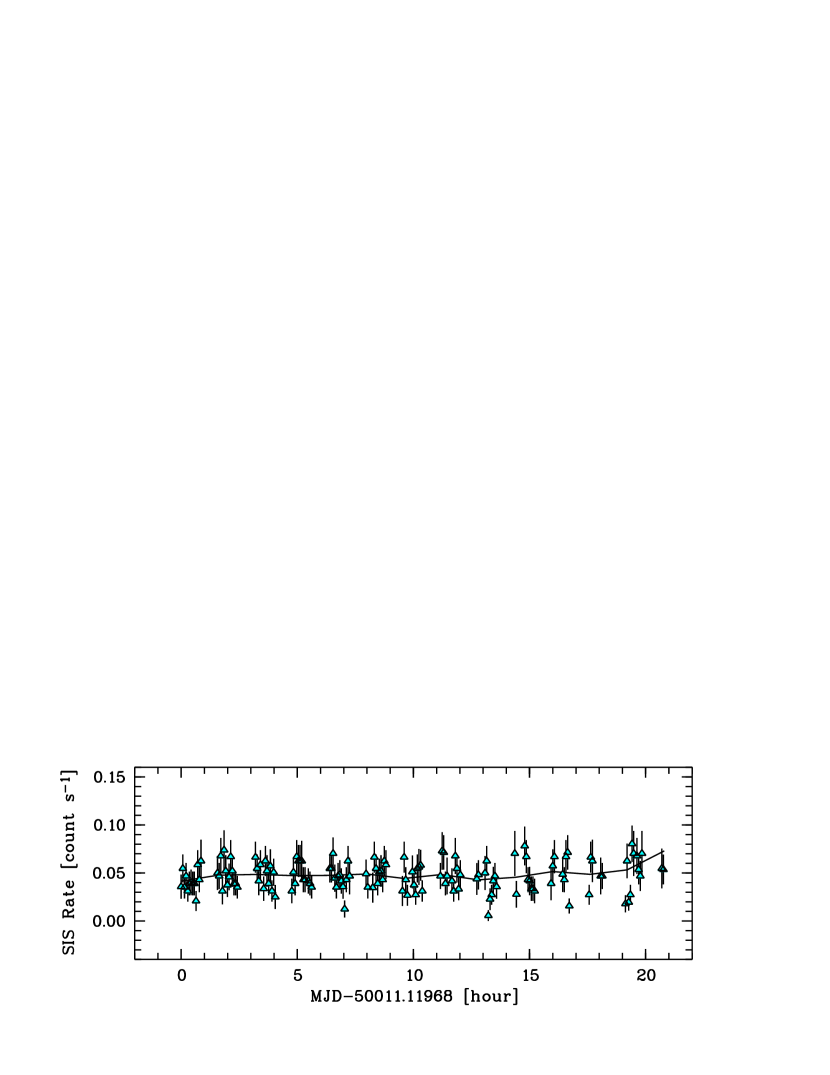
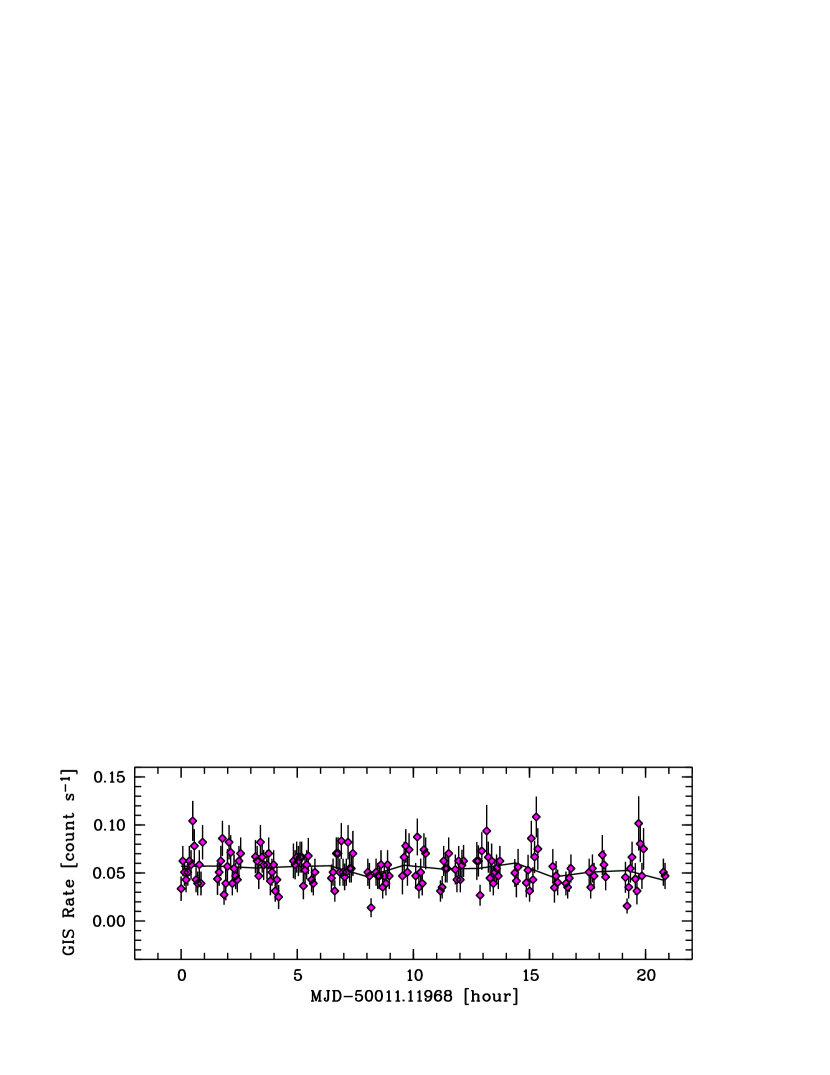
The X-ray light curves of HS 1946+7658, obtained on Oct 21, 1995, were taken from the tartarus database, which contains reduced images, spectra, and light curves for ASCA555Advanced Satellite for Cosmology and Astrophysics. observations of AGNs [17]. ASCA has four X-ray telescopes. Solid-state Imaging Spectrometers (SIS) are detectors for two of them, while Gas Imaging Spectrometers (GIS) are detectors for the other two. We show in Figure 6 and 6 the combined SIS0+SIS1 0.5–10 keV and GIS2+GIS3 0.75–10 keV light curves of HS 1946+7658 with 256 sec time resolution, respectively.
The statistical test showed that, at 99.5% confidence level, HS 1946+7658 is variable (-value = 0.002) if we consider combined SIS light curves and non-variable (-value = 0.07) if we consider combined GIS light curves. Owing to this controversial result, we cannot consider HS 1946+7658 variable in the X-rays given the ASCA data on the above date.
5 SUMMARY
Our results could be summarized as follows:
-
•
We calibrated 7 stars to be used as secondary standards in the field of HS 1946+7658.
-
•
We presented results of the band intra-night monitoring of HS 1946+7658. The scaled test indicates no variability during almost 11 hours of monitoring. This is in accordance with the low intra-night variability duty cycle of radio-quiet quasars.
-
•
The statistical analysis of the X-ray light curves of about 22 hours duration shows controversial results regarding the quasar variability, so, we cannot make a firm conclusion about the quasar flux variation at that time.
6 ACKNOWLEDGMENTS
This research was partially supported by the Bulgarian National Science Fund of the Ministry of Education and Science under grants DN 08-1/2016 and DN 18/13-2017. This research has made use of the tartarus (Version 3.1) database, created by Paul O’Neill and Kirpal Nandra at Imperial College London, and Jane Turner at NASA/GSFC. tartarus is supported by funding from PPARC, and NASA grants NAG5-7385 and NAG5-7067.
References
- [1] S. Kaspi, W. N. Brandt, D. Maoz, H. Netzer, D. P. Schneider, and O. Shemmer, ApJ 659, 997–1007 (2007).
- [2] X.-M. Fan and D. Tytler, ApJS 94, 17–46 (1994).
- [3] M.-P. Véron-Cetty and P. Véron, A&A 518, A10 (2010).
- [4] J. Bechtold et al., AJ 108, 759–765 (1994).
- [5] H.-J. Hagen et al., A&A 253, L5–L8 (1992).
- [6] B. M. Mihov, R. S. Bachev, A. A. Strigachev, L. S. Slavcheva, and G. T. Petrov, “Photometric Monitoring of Selected Quasars: The Highly Luminous Quasar HS 1946+7658”, in Active Galactic Nuclei and Related Phenomena, IAU Symposium 194 Proceedings, edited by Y. Terzian, E. Khachikian, and D. Weedman (San Francisco: Astronomical Society of the Pacific, 1999), pp. 175–176.
- [7] B. M. Mihov and L. S. Slavcheva-Mihova, BlgAJ 27, 3–9 (2017).
- [8] T. Bonev, Publ. Astron. Obs. Belgrade 90, 201–204 (2010).
- [9] T. Bonev, “The 2-Meter Telescope of the National Astronomical Observatory Rozhen: Opportunities for GAIA-FUN-SSO”, in Gaia Follow-up Network for Solar System Objects Proceedings (Observatoire de Paris, 2010), pp. 89–92.
- [10] B. M. Mihov and L. S. Slavcheva-Mihova, AN 329, 418–425 (2008).
- [11] M. K. Tsvetkov, T. B. Georgiev, B. P. Bilkina, A. G. Tsvetkova, and E. H. Semkov, C. R. Acad. Bulg. Sci. 40, 9–12 (1987).
- [12] E. H. Semkov and A. S. Mutafov, “Wide-Field Spectroscopy with 3.5 Degree Objective Prism and 50/70 cm Rozhen Schmidt Telescope”, in Wide-Field Spectroscopy, 2nd conference of the Working Group of IAU Commission 9 on “Wide-Field Imaging” Proceedings, edited by E. Kontizas, M. Kontizas, D. H. Morgan, and G. P. Vettolani (Astrophysics and Space Science Library 212, Springer, Dordrecht, 1997), pp. 125–126.
- [13] A. Kostov, “Opportunities for Follow-Up Observations of Solar System Objects with 50/70 cm Schmidt Telescope of National Astronomical Observatory Rozhen, Bulgaria”, in Gaia Follow-up Network for Solar System Objects Proceedings (Observatoire de Paris, 2010), pp. 137–141.
- [14] L. Zibecchiet al., MNRAS 467, 340–352 (2017).
- [15] R. Joshi, H. Chand, A. C. Gupta, and P. J. Wiita, MNRAS 412, 2717–2728 (2011).
- [16] R. Bachev, A. Strigachev, and E. Semkov, MNRAS 358, 774–780 (2005).
- [17] T. J. Turner, K. Nandra, D. Turcan, I. M. George, “tartarus – An ASCA AGN database”, in X-RAY ASTRONOMY: Stellar Endpoints, AGN, and the Diffuse X-ray Background, AIP Conference Proceedings 599, edited by N. E. White, G. Malaguti, and G. G.C. Palumbo (Melville, NY: American Institute of Physics, 2001), pp. 991–994.