A comparative study of nonequilibrium insulator-to-metal transitions in electron-phonon systems
Abstract
We study equilibrium and nonequilibrium properties of electron-phonon systems described by the Hubbard-Holstein model using the dynamical mean-field theory. In equilibrium, we benchmark the results for impurity solvers based on the one-crossing approximation and slave-rotor approximation against non-perturbative numerical renormalization group reference data. We also examine how well the low energy properties of the electron-boson coupled systems can be reproduced by an effective static electron-electron interaction. The one-crossing and slave-rotor approximations are then used to simulate insulator-to-metal transitions induced by a sudden switch-on of the electron-phonon interaction. The slave-rotor results suggest the existence of a critical electron-phonon coupling above which the system is transiently trapped in a non-thermal metallic state with coherent quasiparticles. The same quench protocol in the one-crossing approximation results in a bad metallic state.
pacs:
05.70.Ln, 71.35.Lk,72.15.-vI Introduction
A Mott insulator can be realized in correlated lattice systems if the interaction energy is comparable to or larger than the kinetic energy. In such systems, changes in thermodynamic parameters may induce insulator-to-metal transitions (IMTs), as has been demonstrated by varying temperature Morin (1959) or pressure. Qiu et al. (2017); Gavriliuk et al. (2012) Laser-induced mechanisms provide another strategy to manipulate quantum phases in these materials. Perfetti et al. (2006); Tobey et al. (2008); Hu et al. (2016); Kaiser (2017) In these experiments, phase transitions or transitions to metastable states are induced by a time-dependent perturbation. The resulting dynamics often follows a highly non-thermal trajectory and in the context of IMTs interesting questions arise concerning both the timescale and the pathway for the non-adiabatic switching.
The essence of the correlation-induced IMT is encapsulated in the Hubbard model. Eckstein and Werner (2013); Sayyad and Eckstein (2016) As the initial Mott insulating phase has a large repulsive electron-electron interaction which localizes electrons, a transition to a metallic state can be achieved by enhancing the screening originating either from the coupling to lattice degrees of freedom Werner and Millis (2007); Koller et al. (2004a) or plasmonic excitations. Werner and Millis (2010); Golež et al. (2015) The theoretical description of these processes involves extensions of the Hubbard model which incorporate the effect of electron-phonon Jeon et al. (2004); Sangiovanni et al. (2005, 2006) or nonlocal Coulomb interactions. Golež et al. (2015); Kapcia et al. (2017); Schüler et al. (2018); Gao and Wang (2009) The proper description of screening effects is particularly important due to the large change in the number of mobile charge carriers during the excitation and IMT.
In this work, we will focus on IMTs triggered by a time-dependent change in the strength of the electron-phonon coupling. The later can be realized by terahertz driving and it is enhanced via anharmonic effects.Babadi et al. (2017); Murakami et al. (2017); Kennes et al. (2017); Sentef (2017) We will consider the Hubbard-Holstein model, where the electrons interact through an on-site Coulomb repulsion and are linearly coupled to dispersionless phonons. The equilibrium phase diagram of the Hubbard-Holstein model contains metallic and Mott-insulating phases as well as a bi-polaronic insulating phase. Jeon et al. (2004); Werner and Millis (2007) Equilibrium studies of the Hubbard-Holstein model have revealed that the dynamical nature of the phonon-induced effective electron-electron interaction cannot be neglected, except in the large-phonon frequency limit, Werner and Eckstein (2013) and it is responsible for the different behavior in the high- and low-energy regimes. Sangiovanni et al. (2005, 2006) Despite a strong influence of the phonons on the high-energy part of the spectrum, the low-energy physics can be described by the Hubbard model with an appropriately determined reduced static interaction. In this study, we consider time-dependent modulations of this screened interaction and the resulting IMTs. We will be interested in a quantitative description of the nonequilibrium transition into the metallic phase and the corresponding thermalization time.
Simulating the nonequilibrium dynamics of a strongly correlated system coupled to phononic degrees of freedom is a challenging problem. In weakly coupled systems, phonons can either be treated by the Migdal approximation with Murakami et al. (2015); Schüler et al. (2016) or without Sentef et al. (2013); Rameau et al. (2016); Kemper et al. (2013) a self-consistent renormalization of the phonon propagator. In the former case the mutual interaction between the electronic and phononic subsystems self-consistently screens the static Coulomb interaction and renormalizes the phonon energy. Strongly interacting electron-phonon coupled systems have been studied within the dynamical mean field theory (DMFT) approximation. Werner and Eckstein (2013, 2015) In contrast to the equilibrium case Werner and Millis (2007); Koller et al. (2004a) powerful exact solvers for non-equilibrium electron-phonon coupled impurity problems are missing. It is thus important to benchmark and compare the existing state-of-the-art impurity solvers which can be extended to non-equilibrium situations. In this study, we focus on the one-crossing approximationGrewe and Keiter (1981); Coleman (1984); Eckstein and Werner (2010) and slave-rotorFlorens and Georges (2002); Sayyad and Eckstein (2016) based impurity solvers and compare equilibrium spectra and phase diagrams against numerically exact reference calculations obtained by the numerical renormalization group (NRG).Wilson (1975); Krishna-murthy et al. (1980); Bulla et al. (2008) This provides information about the parameter regimes in which the approximate impurity solvers produce reliable results. In the second part of this work, we compare the time evolution predicted by the approximate impurity solvers and address the question of nonequilibrium IMTs.
The outline of this paper is as follows. In Sec. II we introduce the model Hamiltonian and the associated dimensionless parameters. Section III explains the three approximate impurity solvers used in the paper. In the first part of Sec. IV we show extensive comparisons of the equilibrium spectral functions obtained from different approximations. The second part is devoted to the study of the low-energy properties of the correlated metal and the search for a purely electronic Hamiltonian which effectively describes the low energy physics. In Sec. V we present the time evolution after a sudden quench of the electron-phonon coupling and discuss the appearance of a non-thermal transient state with an enhanced quasi-particle weight in the slave-rotor calculations. Section VI contains a brief conclusion.
II Model Hamiltonian
The half-filled one-band Hubbard-Holstein model is described by the Hamiltonian
| (1) |
where is the electron creation (annihilation) operator at site with spin , and creates (annihilates) a phonon at site . The first term of Eq. (1) describes the hopping of an electron with spin from site to one of its nearest-neighbors with amplitude that determines the bandwidth . The electrons locally interact with a Coulomb repulsion . This electronic system is coupled to Einstein phonons with frequency by a linear coupling between the local density of electrons and the phonon displacement. Throughout this paper, we use a bandwidth and set as the unit of energy (time).
The system is parametrized by three dimensionless parameters, namely (i) the ratio between the electron-electron (el-el) interaction and bandwidth which controls the insulating tendency of the system, (ii) the dimensionless electron-phonon (el-ph) coupling which measures the gain of energy due to the el-ph coupling in the atomic limit, and (iii) the adiabaticity of the phonon which determines the relative speed of the phononic and electronic degrees of freedom. The equilibrium phase diagram Werner and Millis (2007); Koller et al. (2004a) (excluding symmetry broken phases Murakami et al. (2013, 2014)) at half-filling results from a competition between these effects. For weak el-ph coupling the system exhibits a metal-to-insulator (Mott) transition due to the el-el interaction. The metallic and the Mott insulating states are driven into a bi-polaronic insulating state by increasing the coupling to the bosonic degrees of freedom. However, since phonons are coupled to charge fluctuations, which are strongly suppressed in insulators, the correlation functions in metals are expected to be more sensitive to the el-ph coupling than in insulators. In the adiabatic limit, the Migdal theorem states that the vertex corrections are small and the transition to the bi-polaronic state will occur at intermediate el-ph coupling while away from the adiabatic limit the critical coupling increases.Werner and Millis (2010) In Sec. IV we will demonstrate the characteristic behaviors in the various regimes of the phase diagram by comparing the spectral functions obtained from different approaches in order to assess the validity of the employed approximations in the parameter space.
III Numerical methods
Our numerical investigation is based on the dynamical mean field theory (DMFT). Georges et al. (1996); Aoki et al. (2014) This approximate method assumes a spatially local self-energy and maps the lattice model onto a self-consistent solution of a quantum impurity model which is coupled to a bath. The formalism becomes exact in the limit of infinite coordination number and our calculations with a semi-circular density of states corresponds to a Bethe lattice in this limit. The main limitation which determines the accuracy of the DMFT solution in this limit is the impurity solver. While in equilibrium powerful non-perturbative methods have been developed to solve impurity problems coupled to bosonic degrees of freedom, such as quantum Monte Carlo Werner and Millis (2007); Assaad and Lang (2007) or numerical renormalization group (NRG)Bulla et al. (2008) solvers, there exists no numerically exact and efficient approach to treat the nonequilibrium situation. For this reason, several approximate nonequilibrium solvers have been developed. Each has specific merits, applicability restrictions, and numerical demands. In order to understand their limitations we will collect DMFT solutions obtained from three different impurity solvers. By comparing the equilibrium spectral functions and by considering NRG results as an accurate reference point, we obtain insights into the features that are properly described, as well as the range of validity of the different solvers.
In the following we briefly describe some relevant properties of the impurity solvers used in this work:
-
1.
The strong-coupling perturbation method based on a self-consistent diagrammatic expansion in the hybridization function, which at the first (second) order is known as the non-crossing (one-crossing) approximation NCA (OCA),Grewe and Keiter (1981); Coleman (1984); Eckstein and Werner (2010) has been extended to el-ph interacting problems via an additional weak coupling expansion in the el-ph coupling strength.Golež et al. (2015); Haule et al. (2003); Chen et al. (2016) A detailed description of this combined strong/weak coupling approach can be found in Ref. Golež et al., 2015. In the following, we will employ the OCA approximation, since the description of the correlated metal is significantly improved in comparison to the NCA counterpart. By construction, this method is limited to strong el-el interactions and to the weak el-ph coupling regime and will be referred to as OCA-WC. For strong electron-phonon coupling a complementary approachWerner and Millis (2007); Werner and Eckstein (2013) can be formulated using the Lang-Firsov transformation.Lang and Firsov (1963) However, since this approximation is not well-behaved in the small- limit, we defer the discussion of this method to Appendix C.
-
2.
The slave-rotor (SR) decomposition has been employed to solve the impurity problem in Refs. Florens and Georges, 2002; Sayyad and Eckstein, 2016. In this work, we fix the fudge parameter of the SR to to adjust the phase diagram at . In the self-consistent weak el-ph coupling approximation, one can substitute the interacting phononic Green’s function, instead of the dissipative propagator, into the slave-rotor method, see Ref. Sayyad and Eckstein, 2016. To obtain the interacting phononic Green’s function, we employ the updating procedure of the weak-coupling expansion described in Ref. Golež et al., 2015. The combination of the weak el-ph coupling expansion and the slave-rotor decomposition restricts this impurity solver (denoted SR-WC) to the physics in the weak el-ph coupling regime.
-
3.
The numerical renormalization group (NRG) methodWilson (1975); Krishna-murthy et al. (1980); Bulla et al. (2008) can be easily extended to incorporate local phonon modes by expanding the impurity basis with a vibrational degree of freedom.Hewson and Meyer (2002); Meyer et al. (2002); Jeon et al. (2003, 2004); Cornaglia et al. (2004) This approach has found many applications in the context of quantum transport through vibrating molecules and for bulk systems via the DMFT mapping.Koller et al. (2004b, c); Cornaglia et al. (2005); Koller et al. (2005); Cornaglia et al. (2007); Bauer (2010); Bauer and Hewson (2010); Golež et al. (2012) The phonon cutoff needs to be increased until convergence is reached. This implies that the calculations become numerically costly when the phonon mode softens close to the transition into the polaronic state. In this work, most calculations are performed with a phonon cutoff set at ten, with the NRG discretization parameter (or for mapping out the phase diagrams), keeping all multiplets up to an upper cutoff energy (in units of the characteristic energy scale at the -th step of the iteration), with interleaved discretization grids.Žitko and Pruschke (2009); Žitko (2009) To study finite temperatures, we made use of the full-density-matrix algorithm.Anders and Schiller (2005); Peters et al. (2006); Weichselbaum and von Delft (2007)
In the SR-WC and OCA-WC approaches, we employ the non-equilibrium Keldysh formalism to describe the time evolution.Aoki et al. (2014) The spectral properties are obtained by the real-time propagation of the solution and a partial Fourier transform. For example, the spectral function is obtained as
| (2) |
where the typical value for the integration window is given by for OCA-WC and for SR-WC. The associated phononic spectral function is computed by substituting the electronic Green’s function by its phononic counterpart.
In the NRG calculations, the spectral functions are computed through the Lehmann decomposition, and using the full-density-matrix approach to approximate the thermal density matrix for temperature . The raw spectra in form of weighted peaks are broadened using a log-Gaussian kernel with (or for mapping out the phase diagrams) and further with a Gaussian kernel with a width of order .
IV Equilibrium
IV.1 Phase diagram
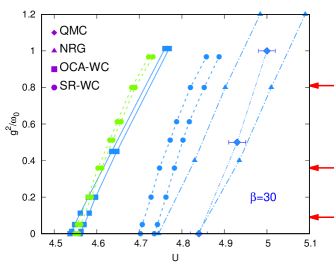
Figure 1 presents the phase diagram of the Hubbard-Holstein model obtained by different impurity solvers at inverse temperature . The lines delimit the coexistence regime for the transition between the correlated metal and the Mott insulator. These critical Hubbard interactions depend on the el-ph coupling and are renormalized towards larger values upon enhancing . This is due to the retarded phonon-mediated el-el attraction which results in a reduction of the effective Coulomb repulsion. Intuitively, by increasing the el-ph coupling electrons can excite more phonons which gives rise to a larger el-el attraction and a reduction in the repulsive Coulomb interaction.
We note some deviations between the slope of the numerically exact -curve from QMCWerner and Millis (2007) and the corresponding NRG result. This is a consequence of the NRG truncation at the initial steps of the iteration and the usage of a bigger discretization and broadening parameters in the scan of the phase diagram (due to computational cost). While we will use the NRG data as the benchmark in the following discussion, it should be kept in mind that the corresponding spectra involve some approximations in the larger el-ph coupling regime and that these approximations tend to overestimate the metallic character.
Integrating out the phononic degrees of freedom from the action obtained from Eq. (1) shows that reproducing the spectral properties of the Hubbard-Holstein model within a purely electronic system is possible if the effective Hubbard interaction has the frequency dependence
| (3) |
In the anti-adiabatic limit , this dynamical Hubbard interaction simplifies to the static value . Away from this limit, however, the competition between different energy scales leads to nontrivial low-energy physics. It is thus an interesting problem to define a static effective Coulomb repulsion which reproduces the low-energy spectral properties of the original Hubbard-Holstein model. In Sec. IV.4 we will describe an approach to calculate this interaction.
The comparison of the phase boundary in Fig. 1 between SR-WC and OCA-WC reveals that both approaches capture the renormalization of the metal-insulator transition line. Already in the purely electronic model () the coexistence region is different in both approaches, originating from the different approximate treatments of charge fluctuations. To be precise, these approximations are: 1) the use of the non-crossing approximation in the auxiliary space of the slave-rotor method, and 2) the one-crossing approximation in the OCA-WC formalism. Besides, it is evident that the coexistence regime of the OCA-WC phase diagram shrinks by enhancing the el-ph coupling while the coexistence region within the SR-WC approach is roughly constant as a function of the el-ph coupling. From now on we will study SR-WC and OCA-WC results at the temperatures where a decent agreement in the location of the phase-boundary is obtained, namely in SR-WC and in the OCA-WC.
IV.2 Spectral properties
In this section, we present a comparison of the equilibrium spectral functions obtained from the different approximations. The analysis is restricted to weak and intermediate el-ph couplings, because of the weak (el-ph) coupling methods, namely OCA-WC and SR-WCm break down as we approach the bi-polaronic transition.
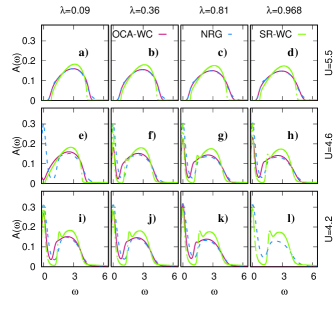

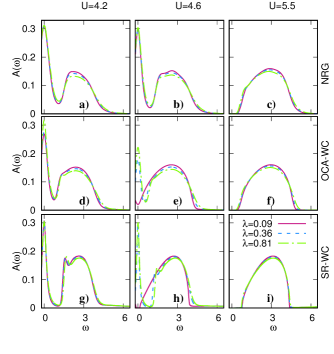
Low frequency phonons The first comparison in Fig. 2 shows spectra in the Mott insulating and strongly correlated metallic regimes for increasing el-ph couplings at fixed phonon frequency . In the insulating phase, see the first row in Fig. 2 for , due to the strong el-el repulsion, the phonon-mediated deformations of the spectrum are barely noticeable. The OCA spectral function in this phase nicely agrees with the reference NRG spectral function for all couplings. A slight difference can be observed at the edge of the band, where NRG exhibits a slightly broader tail, which originates from the NRG broadening. The SR shows a consistent behavior but the bandwidth of the Hubbard band is smaller due to the symmetry of the employed rotor.Florens and Georges (2002) The comparison of the spectra closer to the metal-to-insulator transition is complicated due to the fact that the numerical value of the critical Hubbard interaction differs among the methods, see the second row in Fig. 2 for and the phase diagram in Fig. 1. For the weakest el-ph coupling, , the NRG calculations exhibit a strongly renormalized quasi-particle peak, which is not yet manifest in the OCA spectrum, while the presented SR results are at higher temperatures, see Fig. 1. At the stronger el-ph interactions, , the quasi-particle peak is present in all approximations, but its weight is consistently larger in NRG.
As the el-ph interaction is increased a spectral feature appears at the lower edge of the Hubbard band and it is most pronounced in the SR-WC, while it is completely absent in the NRG. The comparison at the lowest interaction strength shows a similar trend, however, the convergence in the OCA approximation was much slower and we failed to converge the OCA result for the strongest depicted el-ph interaction
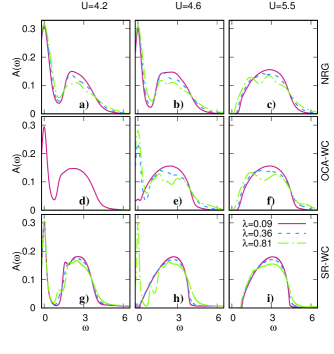
High frequency phonons While in the adiabatic limit () the vertex corrections are suppressed, as the phonon energy gets comparable to the electronic energy scale, we expect that the phonon effects become more pronounced. To demonstrate the effect on the spectral functions we present a similar comparison as before, but for the phonon frequency set equal to the hopping , , while keeping the same dimensionless el-ph coupling , see Fig. 3. As the el-ph coupling is increased the deformation of the Hubbard bands becomes more evident. It leads to a splitting of the Hubbard band into two peaks and we interpret the lower peak as a polaronic feature. This feature is already present in the insulating phase , where the agreement between NRG and OCA is reasonably good. However, for the strongest el-ph interaction the splitting between the peaks substantially differs. Even though one would like to attribute the higher energy features to additional discrete phonon excitations the numerical data do not support this picture, since the splitting is larger than the bare phonon energy . NRG and OCA spectra mainly disagree in the energies of these sidebands. In contrast, the SR results are different: they show only a shoulder-like feature at the lower edge of the upper Hubbard band.
The strongly correlated metal at and exhibits a rich internal structure of the upper Hubbard band with several peaks, which become sharper when increasing the el-ph interaction These structures extend the Hubbard bands to higher energies and therefore systems with the same dimensionless el-ph coupling have a larger bandwidth for larger phonon frequency see also Fig. 4. This is a direct consequence of the fact that the spectral function is normalized to unity. The different methods do not agree on the detailed shape of these high-energy features. This disagreement originates from the different approximations, but also from the broadening used in the NRG and the finite Fourier window employed in the calculation of the spectral functions in the OCA approximations.
In order to illustrate the evolution of the spectral function for different interaction strengths within a given approximation we present in Appendix A the same data set as in Figs. 2 and 3, but restructured such that each plot shows the evolution of the spectral function with increasing el-ph interaction for a given approximation.
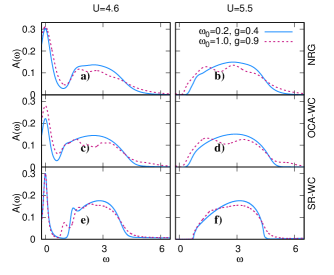
Effect of the phonon frequency To demonstrate the effect of the phonon frequency on the electronic properties we compare the spectral function for and within different approximations at a fixed dimensionless el-ph coupling in Fig. 4. For the strongly correlated metal the main effect of the increased phonon frequency is the enhancement of polaronic effects leading to the internal structures in the Hubbard band and the associated increase in the bandwidth. In NRG and OCA the quasi-particle weight is increased for high-frequency phononic modes, while in the SR it remains almost constant. In the Mott insulating phase, namely , the NRG and OCA shows a renormalization of the Hubbard gap, while in the SR this effect is much smaller.
IV.3 Renormalized phonon frequency
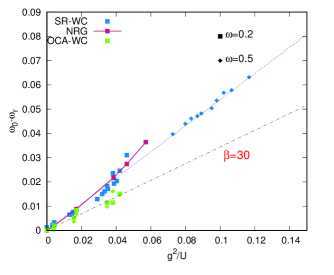
As a result of the feedback between the electronic and phononic subsystems, the effective phonon frequency () is renormalized. In this section, we compare how well the renormalization of the phonon frequency is captured within each of the approximations. The renormalized frequency is extracted from the position of the peak in the phonon spectrum. We start with the observation that within SR-WC one finds an explicit scaling for the phonon softening,
| (4) |
which originates from the interaction between charge fluctuations (as described by the rotor) and phonons. Here, is a proportionality factor which depends on the model parameters. The detailed derivation of this scaling is presented in Appendix B. The basic assumption is that charge fluctuations are reduced, as expected within the Mott phase, which leads to the emerging small parameter see also Appendix B. In the zeroth order of the charge-phonon coupling, we would obtain , and therefore the value of this fitting parameter can be taken as a measure for the effective interaction between the charge and phonon sectors. In Fig. 5, we illustrate to which extent Eq. (4) holds within the SR-WC, OCA-WC, and NRG approximations. A roughly linear dependence between and is found in all methods, although the associated slopes for NRG and SR-WC are larger () than for the OCA-WC formalism (). This difference can be attributed to the strong-coupling diagrammatic nature of the OCA, which underestimates the charge fluctuations responsible for the phonon softening. The deviation from the linear fitting for SR-WC and NRG is more evident when is comparable or larger than . This behavior is rooted in the moderate interplay between the local charge-fluctuations and the phonon displacement.
IV.4 Quasi-particle weight and effective static interaction
The effective low-energy physics in the strongly correlated metal is determined by the quasi-particle weight which in the DMFT context is also the inverse of the effective mass The effect of the el-ph interaction on the quasi-particle weight is twofold: a) the phonon-mediated effective interaction is screened, see Eq. (3), and the reduced static interaction leads to an enhanced quasi-particle weight , b) the dressing of the quasi-particle with the phonon cloud leads to an enhanced effective mass or equivalently to a reduced quasi-particle weight In the atomic limit, the renormalization is given by the Lang-Firsov factor .Mahan (2000) The overall effect of the el-ph interaction on the low-energy physics is a non-trivial problem resulting from the competition between these two mechanisms. Here we will follow Ref. Sangiovanni et al., 2005, where it was proposed that the low-energy physics of the Hubbard-Holstein problem can be effectively described by a purely electronic system with a renormalized interaction and that retardation effects only affect the high-energy region of the spectrum.
Due to the finite propagation time , the evaluation of the quasi-particle weight from the derivative of the self-energy becomes a tedious task, and the subsequent non-equilibrium analysis exacerbates this problem. Here we instead propose an analysis based on the integral over the low-energy part of the photo-emission spectrum (PES) . The latter is computed as Freericks et al. (2009)
| (5) |
for a Gaussian probe pulse with the time resolution given by , where is set to be smaller than the phonon period () and we have used the time-translational invariance. In order to have a practical measurement of the quasi-particle weight also out of equilibrium we use the low-energy integral as the matching condition between the el-ph coupled system and the effective electronic system. In other words, the effective interaction of the purely electronic Hubbard model is determined by matching the low-energy integral to the result obtained from the Hubbard-Holstein model.
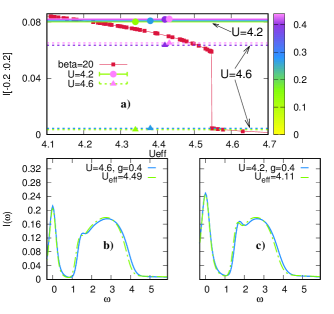
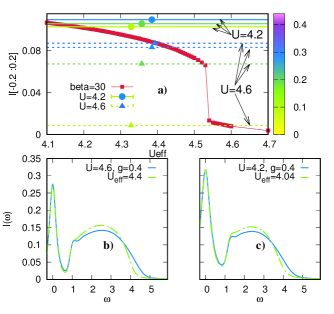
In Fig. 6 and Fig. 7 we present the analysis for SR-WC and OCA-WC, respectively. The interaction strengths in the Hubbard-Holstein case are , corresponding to the Mott insulating phase without el-ph coupling, and , which is a strongly correlated metal without el-ph coupling. The increase of the el-ph coupling leads to an enhanced integral over the quasi-particle, see Fig. 6(a) and Fig. 7(a). The effective electronic interaction is then determined by matching the low-energy integral from the Hubbard-Holstein problem with the one obtained from the Hubbard model As can be seen from Fig. 7(a) this condition is not always fulfilled since for the Mott state the low-energy integral from the Hubbard-Holstein model can lie within the jump induced by the first order MIT. A direct comparison of the PES is presented in subplots b), c) of Fig. 6 and Fig. 7 for the SR-WC and OCA-WC methods, respectively. These panels confirm the main result of Ref. Sangiovanni et al., 2005 that the low-energy spectrum of the two models is practically identical. This serves as a confirmation that the integral over the quasi-particle peak is a reliable matching condition for the low-energy physics of the Hubbard-Holstein and Hubbard model. In the following section, we will use this insight for an analysis of the non-equilibrium dynamics to see how the low-energy physics can be modulated by an external perturbation and to check if one can always find a purely electronic system that matches the low-energy physics of the Hubbard-Holstein problem.
V Non-equilibrium
We now turn to the study of non-thermal IMTs, by investigating the temporal response of the system after a sudden quench of the el-ph coupling in the adiabatic limit (). We abruptly increase the coupling parameter from to a nonzero final value. Using this protocol, we investigate the transient properties of systems close to the metal-to-insulator transition and in the coexistence regime.
V.1 Double occupation and kinetic energy
We will first consider the time evolution of the double occupancy and kinetic energy for initial states in the correlated metallic () or insulating () phase. After switching on the el-ph coupling, the phonons screen the Hubbard repulsion, see Eq. (3), and consequently, the effective repulsion is reduced. The nontrivial question is whether the system relaxes into a new thermal state and whether the screening can induce an IMT.
V.1.1 Correlated metal -
The dynamics after a quench to is shown for OCA-WC and SR-WC in Fig. 8. As expected from the reduction of the effective interaction, the double occupation increases, and the kinetic energy is suppressed as the system evolves towards a putative metastable state. The transient evolution is characterized by strong oscillations which can be linked to the following two processes:
a) Creation of holon-doublon pairs by the quench. In particular, for the initial metallic state, the oscillation frequency is determined by the energy difference between the quasi-particle band and the Hubbard bands, and thus the oscillations can be associated with excitations between these bands. This picture is also confirmed by the occupation dynamics, which exhibits long-lived oscillations on these two energy scales, namely from the lower to the upper Hubbard band and from the quasi-particle peak to the upper Hubbard band. This scenario is further supported by the fact that the spectral function is almost fixed for .
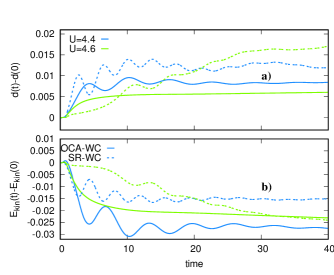
b) The creation of holon-doublon pairs leads to enhanced fluctuations of the phononic field and increases the polaronic tendencies of the system.
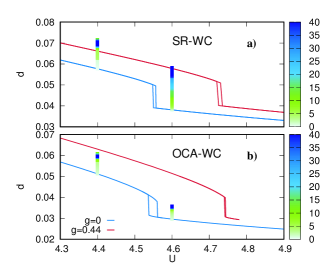
In order to compare the non-thermal state after the quench to the associated equilibrium states we present the time evolution of the double occupancy as a function of time (bars) together with a plot of the equilibrium hysteresis region of the double occupancy in the Hubbard (initial Hamiltonian, solid blue line) and Hubbard-Holstein model (final Hamiltonian, red solid line), see Fig. 9. The latter correspond to equilibrium results at (SR-WC) and (OCA-WC) and the final . In both SR-WC and OCA-WC, the initial trend is an increase of the double occupancy and an approach to the equilibrium value of the final el-ph coupled Hamiltonian after the quench. In the initial metallic phase (), the two methods also agree for longer times, where the double occupancy is slightly enhanced and the quasiparticle peak in the spectral function is reduced, see Fig. 10. However in the long time limit the SR exceeds the equilibrium value in contrast to the OCA results. For the initial insulating phase at longer times these two methods start to quantitatively deviate: SR-WC shows a stronger increase in the double occupancy than OCA-WC and the transient value even exceeds the equilibrium reference. Note that the solid red line in Fig. 9 is the reference system at or and not the expected final thermal state of the system. While this implies that the associated thermal states have higher effective temperatures, further validation of this scenario requires longer simulation times. The difference in the double occupancy for long times is not so surprising since the time evolution is governed by a subtle interplay of various factors, like the reduction of the effective el-el interaction, the increase in the charge fluctuations and the renormalization of the phonon frequency. The two approximations represent a different competition between these effects and therefore it is hard to give a quantitative description of the expected final thermal state and the effective temperature. Nevertheless, the qualitative behavior is consistent: the non-adiabatic switching of the el-ph coupling reduces the effective interaction of the system which thus relaxes into a more metallic state. In Sec. V.2 we will show that the quasi-equilibration of our transient state survives at low energies and we consequently will associate an effective temporal temperature to this energy range. Our results will show that the reduction of the static el-el repulsion in systems which are initially in the correlated metal phase is not dramatic, see Sec. V.3. Therefore in strongly correlated metals, we identify the largest contribution as coming from the charge fluctuations and the renormalized phonon frequency.
V.1.2 Mott insulator
If we start in the insulating phase of the el-ph uncoupled system (), the transient evolution exhibits an increase in the double occupancies, both within the OCA-WC and SR-WC description, see Fig. 8 a) and Fig. 9. In the OCA-WC simulation this enhancement is gradual and monotonic, which can be explained by the small reduction of the Hubbard interaction as a result of the coupling to phonons, see Sec. V.3. In contrast, for SR-WC the increase of the double occupancy is accompanied by shallow oscillations which are a consequence of two processes: a) the build-up of the coherent quasiparticle peak, and b) a pronounced renormalization of the phonon frequency due to the appearance of conducting electrons. The double occupation increases almost to the reference value of the Hubbard-Holstein model with , see Fig. 9 a), and indicates that the evolution of the system is towards the correlated metallic phase. In the absence of el-el interactions Murakami et al. (2015) a roughly similar timescale governs the coherent oscillations of local observables which thermalize in less than ten cycles. In the Hubbard-Holstein system, however, investigating the full thermalization is numerically demanding, and will not be attempted here.
V.2 Time-dependent spectral function
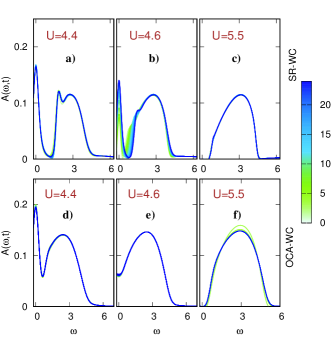
As we have discussed in Sec. IV.4, in equilibrium, the height of the quasiparticle peak can be reproduced by a purely electronic system by introducing a properly renormalized interaction. We now apply an equivalent protocol also out of equilibrium to investigate the time dependence of the effective interaction. Figure 10 plots the time-dependent spectral functions at various Hubbard interactions for the SR-WC and OCA-WC approximations.
Initial metallic phase
Figures 10 a) and d) present the temporal evolution of the spectral functions for and final el-ph interaction . The initial spectrum has a three-peak structure and the relative weight of the quasi-particle band and the Hubbard bands change weakly after the quench. This redistribution of spectral weight is accompanied by an enhancement of the quasiparticle peak as the static Coulomb repulsion is effectively reduced. At the phonon cloud dresses the formed polarons, and subsequently, the height of the quasiparticle peak is decreasing. This is also accompanied by slow oscillations of the double occupancy as seen in Figs. 8 a) and 9. Whether the polaron dressing effect dominates the reduced interaction at longer times is an interesting question which we leave to future investigations.
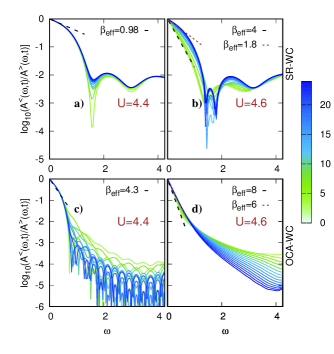
The non-thermal nature of the transient state is further evidenced through the ratio between the non-equilibrium spectral functions of the occupied () and unoccupied () states as shown in Fig. 11. For a thermal state the fluctuation-dissipation theorem Weber (1956) requires that
| (6) |
where is the effective temperature of the equilibrated system. In Fig. 11 a) and c) we plot this ratio at for SR-WC and OCA-WC, respectively. At low energies, both the SR-WC and OCA-WC exhibit an almost negligible transient response and the linear fits to Eq. (6) yield (SR-WC) and (OCA-WC). Both approximations consistently have substantially higher low-energy effective temperatures than in the initial state, where (SR-WC) and (OCA-WC). Figure 11 furthermore shows that at the energy distribution function is non-thermal. In the case, OCA-WC exhibits a time-dependent distribution which is consistent with cooling of doublons in the energy region of the Hubbard bands. In contrast, the SR-WC distribution changes mainly in the quasi-particle region and around the edges of the Hubbard bands, and shows a rather robust partial inversion of the population in the Hubbard band region.
In the following, we will classify the initial insulating states of the Hubbard model into two categories which are distinguished by whether or not their el-el repulsion is lager (smaller) than the critical interaction of the thermal electron-phonon coupled system ( for SR-WC and for OCA).
Initial deep Mott insulating phase
As a representative of the first category () we show the time-dependent spectral function at in Figs. 10 c) and f) for the OCA-WC and SR-WC, respectively. It is evident that due to the small charge fluctuations in this Mott insulating phase, the transient modulation of the el-ph coupling can hardly mediate low-energy excitations. On energy scales of the order of , OCA-WC yields a redistribution of the band which is quickly damped. This response is not significant in SR-WC, being barely noticeable in Fig. 10 c). This can be partially traced back to the shortcomings of the SR-WC in capturing the correct Hubbard bands.
Initial Mott insulating phase close to MIT
The closer the Hubbard interaction is to the more the low-energy density varies. For () we present results at in Figs. 10 b), and e). In this parameter regime, the two-peak insulating spectrum of the Mott insulator gives way to the formation of a quasiparticle peak which grows more dramatically in SR-WC than in OCA-WC. In this regime, the band renormalization is recognizable in both SR-WC and OCA-WC. While in the former approximation the major redistribution of the spectral density occurs at the band edges, in the latter approach the middle of the Hubbard band exhibits the strongest renormalizations. The renormalization of the spectral function in SR-WC facilitates the build-up of the quasiparticle peak as even small el-ph excitations can assist the process. In OCA-WC the transferred energy to accumulate low-energy spectral densities should be of order since we have to excite holon/doublon pairs to enhance the phonon fluctuations. In the adiabatic regime, this amount of energy is mainly accessible through multi-phonon processes with a low probability of excitations as the charge-fluctuations in OCA-WC are suppressed, see also discussions in Sec. IV.
The ratio between occupied and unoccupied states provides information about the non-thermal pathway of the IMTs at , see Fig. 11 b) and d). Both the OCA-WC and the SR-WC results exhibit exponential behaviors at low-energies and their associated effective temperatures vary in time. This change of the effective temperature is stronger in SR-WC than in OCA-WC as the growth of the quasi-particle height is more pronounced in the former approximation, see also Fig. 10. At higher-energies, SR-WC presents drastic changes around the band-edge reflecting the strong redistribution of the spectral weight to the quasi-particle peak, while OCA-WC exhibits considerable changes at resembling the cooling and doublon/holon recombination dynamics expected in a metallic system.
V.3 Quasi-particle weight and effective static interaction
To further investigate the low-energy excitations of the system, we employ the matching condition introduced in Sec. IV.4 to analyze the transient effective el-el interaction. The generalization of the PES to the nonequilibrium condition is given by
| (7) |
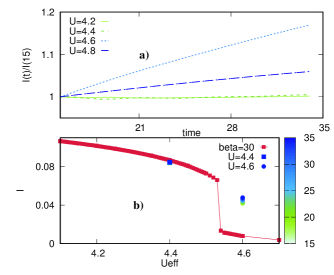
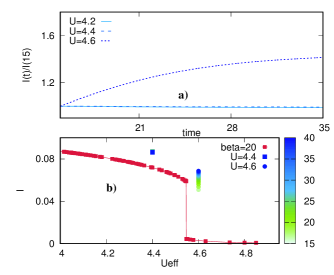
The lower panels of Figs. 12,13 present the time-dependent integral over the low-energy PES as a function of time (bars). In the strongly correlated metal () the change in the quasiparticle weight is small after and the matching condition suggests a very slow evolution of the effective Hubbard interaction towards the thermal value. However the non-thermal trajectories are very distinct especially for short times in both approximations. Within OCA-WC the quasi-particle weight increases and therefore the effective Hubbard interaction is reduced as a function of time, which demonstrate the dominant role of screening of the Coulomb repulsion due to the formation of the phonon cloud. Within SR-WC the effective el-el repulsion is reduced considerably at short times and the later time evolution exhibits a small but gradual decrease of the quasiparticle weight, which can be related to the dressing of the quasi-particles.
In the Mott-insulating phase, , at the picture is quite different for SR-WC and OCA-WC. In the former, the quasi-particle weight is strongly modified suggesting a strong reduction of the effective el-el interaction as a function of time. In this regime, the system traverses the first-order phase transition on a non-thermal path. In this regime, the phonon screening is the dominant process leading to a strong redistribution of spectral weight to a metal-like PES. The OCA-WC shows a similar trend, but without a complete switching from insulator to metal and in fact a rather small increase in the quasi-particle weight. We have checked that within the OCA-WC approximation on the reachable timescales the full transition cannot be achieved no matter how close the initial state is to the critical interaction. The overestimation of the insulating nature of the state is a well-known artifact of the NCA and OCA approximation in equilibrium and the above behavior might be a non-equilibrium manifestation of this artifact.
In addition, comparing the ratio of both SR-WC and OCA-WC, see upper panels of Figs. 12,13, also suggests that the increase of the quasi-particle weight is more pronounced for Hubbard interactions , where is the critical interaction in the Hubbard (Hubbard-Holstein) model. We thus conclude that transitions from Mott insulators to non-thermal correlated metals are achievable in this range of interactions. Note however that the relative change is significantly larger in the SR-WC approach than in the OCA-WC (different -axis scale on both plots).
VI Conclusions
We have employed the DMFT framework to investigate electron-phonon coupled systems described by the Hubbard-Holstein model in the weak el-ph coupling regime, both in and out of equilibrium. One purpose of this work was the comparison between different impurity solvers: OCA-WC, SR-WC, and NRG. In equilibrium, we have used the NRG results as reference data to assess the validity of the OCA-WC and SR-WC solvers in various parameter regimes and to reveal the equilibrium properties of the spectral function.
We have found that in the Mott insulating regime the spectral properties obtained within OCA-WC are in excellent agreement with the NRG counterparts, while SR-WC exhibits shortcomings in capturing the shape of the Hubbard bands. We have pointed out that this drawback is a consequence of employing the non-crossing approximation in the auxiliary Hilbert space of the problem. Nevertheless, the presented SR-WC diagram features a more accurate metal-Mott insulator phase boundaries than the result obtained with OCA-WC. Here, we have to note that the fudge parameter is determined to have the correct MIT at and the remaining phase boundary is calculated without further adjustment. The underestimation of the critical Hubbard interactions in the OCA-WC approach is a feature of the perturbative strong-coupling (hybridization) expansion on which OCA-WC is based. In the correlated metallic phase as well as in the vicinity of the Mott transition, the interplay between various degrees of freedom and the approximations inherent in the impurity solvers results in nontrivial effects on the spectral function. We have shown that as a consequence of the self-consistent electron-phonon interaction, the electronic charge fluctuations effectively reduce the vibrational frequency of the phonons almost proportionally to in the weak electron-phonon coupling regime. We furthermore studied the low-energy physics of the system and determined a purely-electronic static interaction which reproduces the low-energy spectral properties of the Hubbard-Holstein model in the adiabatic regime.Sangiovanni et al. (2005)
In an initially uncoupled system (), we have switched on the electron-phonon coupling to a moderate value and investigated the temporal evolution of the system in various parameter regimes. We have shown that in the correlated metallic phase of the uncoupled system, the initial dynamics produces a spectral-density reduction of the Hubbard-bands and an enhancement of the quasi-particle peak which continues, at most, until the phonon characteristic time () and is accompanied by an increase in the double occupancy. These quasi-particles are later dressed by the phonon cloud with the electron-mediated reduced frequency which results in a reduction of the low-energy spectral density. For the Mott insulating initial phase with a large el-el interaction, due to the very small charge fluctuations as well as negligible thermal excitations, the system does not show a dramatic redistribution of spectral weight. Close to the metal-to-insulator transition, where the gap size is small, however, the initially uncoupled insulating state develops a quasiparticle peak along a nonthermal trajectory. In this regime, spectral weight is transiently transferred from the Hubbard bands to low energies and starts forming a quasi-particle peak. The build-up of this peak is much more pronounced within SR-WC than in OCA-WC. We have discussed that this distinct response is a result of the associated energy of the transferred spectral densities in these two approximations. While within SR-WC the spectral weight loss at the inner edge of Hubbard bands constructs the quasiparticle peak, in OCA-WC the accumulated low-energy spectral densities are mostly originating from the middle of the Hubbard bands. By assessing the quasi-equilibrium condition we have shown that the transient state is following a non-thermal pathway with distinguishable behavior at low and high energies. We have also discussed that the quasi-particle weight (approximated via the integrations of the PES spectrum) suggest a static Hubbard interaction which gradually decreases toward the correlated metallic phase. Questions concerning the long-time thermalization of these induced non-thermal metallic states, as well as their associated lifetimes, may be the subject of future investigations. The overall investigation of the out-of-equilibrium dynamics revealed considerable discrepancies between the different methods, which illustrates the uncertainties associated with the use of the current state-of-the-art nonequilibrium impurity solvers.
Experiments on light-induced IMT transitions typically observe the formation of a bad-metallic phase after ultra-fast laser excitations of Mott insulators.Perfetti et al. (2006); Tobey et al. (2008); Hu et al. (2016); Kaiser (2017); Iwai et al. (2003); Lysenko et al. (2007) Due to the energy injected by the pumping pulse, hot electron carriers will be created and the role of the electron-lattice coupling, amplified by the larger induced charge fluctuations, is mainly to cool down these charge carries, which results in a slow reduction of the in-gap density of states.Eckstein and Werner (2013) This observation is very much consistent with our presented picture in the large regime. Investigations of the relaxation dynamics of heavy fermions, on the other hand, highlight the importance of the low-energy physics in determining the thermalization timescale.Demsar et al. (2003) This is indeed one of our main conclusions regarding the possibility of enhancing the metallic tendencies in an insulating system with a small gap. But whether the slow long time dynamics due to phonon dressing is the dominating factor in addressing the long electron-phonon relaxation time is an intriguing question which requires extending our formalism to the study of Kondo-lattice type problems. It would also be very interesting to study multi-band systems to understand the interplay between charge, orbital and phonon degrees of freedom in inducing nontrivial metallic behaviors near the Mott transition.
Acknowledgements.
We thank Y. Murakami for helpful discussions. The calculations have been performed on the PhysNET cluster at the University of Hamburg, the REIMS cluster at the Institute for Solid State Physics, and on the Beo04 cluster at the University of Fribourg. Sh. S. is supported by the ImPACT Program of the Council for Science, Technology and Innovation, Cabinet Office, Government of Japan (Grant No. 2015-PM12-05-01) from JST. RŽ acknowledges the support of the Slovenian Research Agency (ARRS) under P1-0044 and J1-7259. DG and PW were supported by ERC Consolidator Grant 724103 and Swiss National Science Foundation Grant 200021-165539. The Flatiron Institute is a division of the Simons Foundation.Appendix A Equilibrium spectral functions
In order to illustrate the evolution of the spectral functions for increasing electron-phonon interaction strengths within a given approximation we rearranged the data from Sec. IV.2. The adiabatic cases for are presented in Fig. 14 and those for the high phonon frequency in Fig. 15. The spectral features are discussed in Sec. IV.2.
Appendix B Renormalized phonon frequency
To determine the relationship between the renormalized phonon frequency and other physical parameters of the system, we will consider the SR-based formalism. Within DMFT, the major contribution of the phonon softening for local electron-phonon interactions is conveyed by space-local terms. The associated effective action can be written as
| (8) |
where denotes the Keldysh contour, stands for the spin index, is the phonon displacement operator given by , and is the noninteracting phonon propagator defined as . Here we have dropped the site indices for simplicity. Within the slave-rotor decomposition Florens and Georges (2002); Sayyad and Eckstein (2016) the above action can be rewritten as
| (9) |
where is the canonical angle of the rotor angular momentum (), and is the Lagrange multiplier to maintain the charge-conservation. Performing the functional integral over the rotor angular momentum yields
| (10) |
Incorporating the quadratic terms in from the second term of into its first term, we would obtain a renormalized phonon Green’s function satisfying
| (11) | ||||
| (12) |
In the limit where , we therefore estimate the phonon softening as
| (13) |
Away from this regime, the associated charge fluctuations induced by produce nonlinear effects.
Appendix C Strong coupling expansion combined with the Lang-Firsov transformation
In the hybridization expansion, an alternative to the weak coupling expansion in the electron-phonon coupling (e.g. NCA-WC and OCA-WC), is to apply a Lang-Firsov (LF) Lang and Firsov (1963) decoupling of the electron-phonon interaction, i.e., a transformation to polaron operators. In combination with the hybridization expansion this transformation enables numerically exact simulations of the Hubbard-Holstein model in DMFT,Werner and Millis (2007) using continuous time quantum Monte Carlo (CTQMC).Werner and Millis (2006) Out of equilibrium, it has been used in combination with NCA and OCA to study doublon relaxation in the single band Hubbard-Holstein model.Werner and Eckstein (2013)
We have implemented NCA-LF and OCA-LF in the simplest approximation, described in detail in Ref. Werner and Eckstein, 2013, which effectively amounts to dress each pair of fermionic creation-annihilation operators in the perturbation theory with an additional bosonic factor, see Eq. (30) in Ref. Werner and Eckstein, 2013, and a phonon induced shift of the Hubbard interaction. The resulting approximation is different from the weak coupling expansion in the electron-phonon coupling , since it captures the Mott to bipolaronic transition at large .Werner and Eckstein (2013) However,
as we will show, it gives qualitatively correct results only in the large- and large- regime.
The Monte-Carlo sampling of the bare strong coupling expansion is exact and accounts for all bosonic contributionsWerner and Millis (2007) by connecting all fermionic operators in the partition function expansion with the bosonic “weight” factors generated by the Lang-Firsov transformation. The dressed strong coupling approach, however, performs an expansion where the atomic propagator is dressed with low order self-energy expansions in the hybridization function, re-summed to infinite order using the Dyson equation. The bosonic weight factors of operator pairs are only accounted for within each strong-coupling self-energy diagram. This is an approximation since the bosonic weight factors associated with pairings of fermion operators between self-energy insertions in the Dyson equation are neglected. This is also the case in the diagrams for the single-particle Green’s function. For this reason, NCA-LF and OCA-LF are accurate only if the bosonic weight factors decay fast, or oscillate rapidly, which is the case in the limit of large .
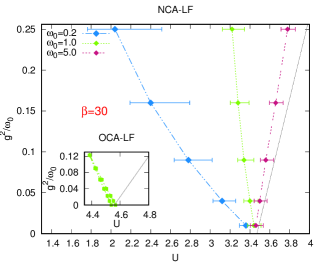
To demonstrate the limitations of NCA-LF and OCA-LF we map out the metal-insulator phase boundary at low , see Fig. 16. In NCA-LF the transition is a crossover, whose center is determined here by the maxima of the second order derivative in the double occupancy, i.e. , while the extent of the crossover region is determined by the corresponding width at half maximum. Small phonon frequencies () yields a decreasing with increasing , while at large frequencies approaches the expected high frequency limit, , having the opposite slope in . We note that the reduction in upon increasing at low is qualitatively different from the exact Monte Carlo result in Fig. 1.
While all NCA based approximations under-estimate , this is improved when using OCA. The hysteresis region of OCA-LF at is shown in the inset of Fig. 16. However, while is closer the CTQMC result, the dependence on remains qualitatively wrong as for NCA-LF. We conclude that LF based second order strong coupling approximation (OCA-LF) does not qualitatively capture the metal to Mott phase boundary in the weak electron-phonon coupling and small- regime.
Although the behavior near the MIT is not correctly described in OCA-LF we find that the results of this method are qualitatively correct in the strong coupling regime and for large enough . Since it is the only real-time non-equilibrium approach that captures the Mott to bipolaronic transition, a comparison of its equilibrium spectral function with NRG is of interest.
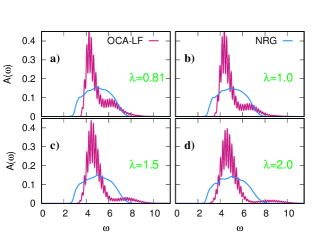
Due to the strong electron-phonon interaction, sharp polaronic features are expected in the spectrum, which can be smeared out by NRG broadening of the raw spectra. Therefore, in the following, we present spectra in Fig. 17 and 18 for the reduced broadening averaged over six different discretization parameters , in order to distinguish sharp features.
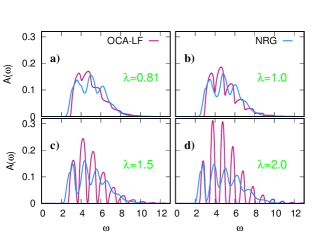
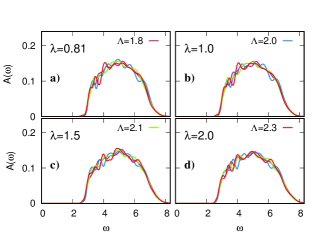
At and and large phonon frequency , the NRG spectral function shows a fine structure of the Hubbard band and a broad tail at high energies, in qualitative agreement with the OCA-LF result. For weaker electron-phonon interaction the separation between the peaks is larger than the phonon frequency , see for instance in Fig. 17, while for the strongest electron-phonon interaction the separation between the peaks is clearly given by the phonon quanta . Reducing the phonon frequency to yields stronger discrepancies between NRG and OCA-LF, see Fig. 18. Phonon peaks can be observed in the OCA-LF spectral function, while in the NRG result they are completely washed out. For weak broadening the position of the peak depends on the discretization parameter and it is hard to obtain discretization-parameter independent results, see also Fig. 19 for the comparison of the spectra for different discretization parameters . The main reason for the discrepancy is, however, the expected inaccuracy of the OCA-LF method in the adiabatic regime, where the bosonic weight factors are slowly-varying so that the approximations inherent in the perturbative approach become more severe, independent of the value of .
References
- Morin (1959) F. J. Morin, Phys. Rev. Lett. 3, 34 (1959).
- Qiu et al. (2017) R. Qiu, E. Bousquet, and A. Cano, Journal of Physics: Condensed Matter 29, 305801 (2017).
- Gavriliuk et al. (2012) A. G. Gavriliuk, I. A. Trojan, and V. V. Struzhkin, Phys. Rev. Lett. 109, 086402 (2012).
- Perfetti et al. (2006) L. Perfetti, P. A. Loukakos, M. Lisowski, U. Bovensiepen, H. Berger, S. Biermann, P. S. Cornaglia, A. Georges, and M. Wolf, Phys. Rev. Lett. 97, 067402 (2006).
- Tobey et al. (2008) R. I. Tobey, D. Prabhakaran, A. T. Boothroyd, and A. Cavalleri, Phys. Rev. Lett. 101, 197404 (2008).
- Hu et al. (2016) W. Hu, S. Catalano, M. Gibert, J.-M. Triscone, and A. Cavalleri, Phys. Rev. B 93, 161107 (2016).
- Kaiser (2017) S. Kaiser, Physica Scripta 92, 103001 (2017).
- Eckstein and Werner (2013) M. Eckstein and P. Werner, Phys. Rev. Lett. 110, 126401 (2013).
- Sayyad and Eckstein (2016) S. Sayyad and M. Eckstein, Phys. Rev. Lett. 117, 96403 (2016).
- Werner and Millis (2007) P. Werner and A. Millis, Physical Review Letters 99, 146404 (2007).
- Koller et al. (2004a) W. Koller, D. Meyer, Y. Ono, and A. C. Hewson, Europhysics Letters 66, 559 (2004a).
- Werner and Millis (2010) P. Werner and A. J. Millis, Phys. Rev. Lett. 104, 146401 (2010).
- Golež et al. (2015) D. Golež, M. Eckstein, and P. Werner, Phys. Rev. B 92, 195123 (2015).
- Jeon et al. (2004) G. S. Jeon, T.-H. Park, J. H. Han, H. C. Lee, and H.-Y. Choi, Phys. Rev. B 70, 125114 (2004).
- Sangiovanni et al. (2005) G. Sangiovanni, M. Capone, C. Castellani, and M. Grilli, Phys. Rev. Lett. 94, 026401 (2005).
- Sangiovanni et al. (2006) G. Sangiovanni, M. Capone, and C. Castellani, Phys. Rev. B 73, 165123 (2006).
- Kapcia et al. (2017) K. J. Kapcia, S. Robaszkiewicz, M. Capone, and A. Amaricci, Phys. Rev. B 95, 125112 (2017).
- Schüler et al. (2018) M. Schüler, E. G. C. P. van Loon, M. I. Katsnelson, and T. O. Wehling, Phys. Rev. B 97, 165135 (2018).
- Gao and Wang (2009) J. Gao and J. Wang, Journal of Physics: Condensed Matter 21, 485702 (2009).
- Babadi et al. (2017) M. Babadi, M. Knap, I. Martin, G. Refael, and E. Demler, Phys. Rev. B 96, 014512 (2017).
- Murakami et al. (2017) Y. Murakami, N. Tsuji, M. Eckstein, and P. Werner, Phys. Rev. B 96, 045125 (2017).
- Kennes et al. (2017) D. M. Kennes, E. Y. Wilner, D. R. Reichman, and A. J. Millis, Nature Physics 13, 479 (2017).
- Sentef (2017) M. A. Sentef, Phys. Rev. B 95, 205111 (2017).
- Werner and Eckstein (2013) P. Werner and M. Eckstein, Phys. Rev. B 88, 165108 (2013).
- Murakami et al. (2015) Y. Murakami, P. Werner, N. Tsuji, and H. Aoki, Phys. Rev. B 91, 045128 (2015).
- Schüler et al. (2016) M. Schüler, J. Berakdar, and Y. Pavlyukh, Phys. Rev. B 93, 054303 (2016).
- Sentef et al. (2013) M. Sentef, A. F. Kemper, B. Moritz, J. K. Freericks, Z.-X. Shen, and T. P. Devereaux, Phys. Rev. X 3, 041033 (2013).
- Rameau et al. (2016) J. Rameau, S. Freutel, A. Kemper, M. A. Sentef, J. Freericks, I. Avigo, M. Ligges, L. Rettig, Y. Yoshida, H. Eisaki, et al., Nature communications 7, 13761 (2016).
- Kemper et al. (2013) A. F. Kemper, M. Sentef, B. Moritz, C. C. Kao, Z. X. Shen, J. K. Freericks, and T. P. Devereaux, Phys. Rev. B 87, 235139 (2013).
- Werner and Eckstein (2015) P. Werner and M. Eckstein, EPL (Europhysics Letters) 109, 37002 (2015).
- Grewe and Keiter (1981) N. Grewe and H. Keiter, Phys. Rev. B 24, 4420 (1981).
- Coleman (1984) P. Coleman, Phys. Rev. B 29, 3035 (1984).
- Eckstein and Werner (2010) M. Eckstein and P. Werner, Phys. Rev. B 82, 115115 (2010).
- Florens and Georges (2002) S. Florens and A. Georges, Phys. Rev. B 66, 165111 (2002).
- Wilson (1975) K. G. Wilson, Rev. Mod. Phys. 47, 773 (1975).
- Krishna-murthy et al. (1980) H. R. Krishna-murthy, J. W. Wilkins, and K. G. Wilson, Phys. Rev. B 21, 1003 (1980).
- Bulla et al. (2008) R. Bulla, T. A. Costi, and T. Pruschke, Rev. Mod. Phys. 80, 395 (2008).
- Murakami et al. (2013) Y. Murakami, P. Werner, N. Tsuji, and H. Aoki, Phys. Rev. B 88, 125126 (2013).
- Murakami et al. (2014) Y. Murakami, P. Werner, N. Tsuji, and H. Aoki, Phys. Rev. Lett. 113, 266404 (2014).
- Georges et al. (1996) A. Georges, G. Kotliar, W. Krauth, and M. J. Rozenberg, Rev. Mod. Phys. 68, 13 (1996).
- Aoki et al. (2014) H. Aoki, N. Tsuji, M. Eckstein, M. Kollar, T. Oka, and P. Werner, Rev. Mod. Phys. 86, 779 (2014).
- Assaad and Lang (2007) F. F. Assaad and T. C. Lang, Phys. Rev. B 76, 035116 (2007).
- Haule et al. (2003) K. Haule, A. Rosch, J. Kroha, and P. Wölfle, Phys. Rev. B 68, 155119 (2003).
- Chen et al. (2016) H.-T. Chen, G. Cohen, A. J. Millis, and D. R. Reichman, Phys. Rev. B 93, 174309 (2016).
- Lang and Firsov (1963) I. G. Lang and Y. A. Firsov, Sov. Phys. JETP 16, 1301 (1963).
- Hewson and Meyer (2002) A. C. Hewson and D. Meyer, J. Phys. - Condens. Mat. 14, 427 (2002).
- Meyer et al. (2002) D. Meyer, A. C. Hewson, and R. Bulla, Phys. Rev. Lett. 89, 196401 (2002).
- Jeon et al. (2003) G. S. Jeon, T.-H. Park, and H.-Y. Choi, Phys. Rev. B 68, 045106 (2003).
- Cornaglia et al. (2004) P. S. Cornaglia, H. Ness, and D. R. Grempel, Phys. Rev. Lett. 93, 147201 (2004).
- Koller et al. (2004b) W. Koller, D. Meyer, and A. Hewson, Physical Review B 70, 155103 (2004b).
- Koller et al. (2004c) W. Koller, D. Meyer, Y. Ono, and A. C. Hewson, Europhys. Lett. 66, 559 (2004c).
- Cornaglia et al. (2005) P. S. Cornaglia, D. R. Grempel, and H. Ness, Phys. Rev. B 71, 075320 (2005).
- Koller et al. (2005) W. Koller, A. C. Hewson, and D. M. Edwards, Phys. Rev. Lett. 95, 256401 (2005).
- Cornaglia et al. (2007) P. S. Cornaglia, G. Usaj, and C. A. Balseiro, Phys. Rev. B 76, 241403(R) (2007).
- Bauer (2010) J. Bauer, Europhysics Letters 90, 27002 (2010).
- Bauer and Hewson (2010) J. Bauer and A. C. Hewson, Physical Review B 81, 235113 (2010).
- Golež et al. (2012) D. Golež, J. Bonča, and R. Žitko, Phys. Rev. B 86, 085142 (2012).
- Žitko and Pruschke (2009) R. Žitko and T. Pruschke, Phys. Rev. B 79, 085106 (2009).
- Žitko (2009) R. Žitko, Comp. Phys. Comm. 180, 1271 (2009).
- Anders and Schiller (2005) F. B. Anders and A. Schiller, Phys. Rev. Lett. 95, 196801 (2005).
- Peters et al. (2006) R. Peters, T. Pruschke, and F. B. Anders, Phys. Rev. B 74, 245114 (2006).
- Weichselbaum and von Delft (2007) A. Weichselbaum and J. von Delft, Phys. Rev. Lett. 99, 076402 (2007).
- Mahan (2000) G. Mahan, Many-particle physics (Springer, 2000).
- Freericks et al. (2009) J. K. Freericks, H. R. Krishnamurthy, and T. Pruschke, Phys. Rev. Lett. 102, 136401 (2009).
- Weber (1956) J. Weber, Phys. Rev. 101, 1620 (1956).
- Iwai et al. (2003) S. Iwai, M. Ono, A. Maeda, H. Matsuzaki, H. Kishida, H. Okamoto, and Y. Tokura, Phys. Rev. Lett. 91, 057401 (2003).
- Lysenko et al. (2007) S. Lysenko, A. Rúa, V. Vikhnin, F. Fernández, and H. Liu, Phys. Rev. B 76, 035104 (2007).
- Demsar et al. (2003) J. Demsar, R. D. Averitt, K. H. Ahn, M. J. Graf, S. A. Trugman, V. V. Kabanov, J. L. Sarrao, and A. J. Taylor, Phys. Rev. Lett. 91, 027401 (2003).
- Werner and Millis (2006) P. Werner and A. J. Millis, Phys. Rev. B 74, 155107 (2006).