Results of a systematic search for outburst events in 1.4 million galaxies
Abstract
We present an analysis of nine years of Catalina Surveys optical photometry for 1.4 million spectroscopically confirmed SDSS galaxies. We find 717 outburst events that were not reported by ongoing transient surveys. These events have timescales ranging from weeks to years. More than two thirds of these new events are found in starforming galaxies, while such galaxies only constitute of our sample. Based on the properties of the hosts and events, we find that almost all of the new events are likely to be associated with regular supernovae. However, a small number of long-timescale events are found among the galaxies containing AGN. These events have similar properties to those recently found in the analyses of light curves of large samples of AGN. Given the lack of such events among the more than a million passive galaxies in the sample, we suggest that the long outbursts are associated with super-massive black holes or their environments.
keywords:
galaxies: general – galaxies: active – galaxies: photometry – (stars:) supernovae: general1 Introduction
Our understanding of the nature and range of variability in galaxies has evolved significantly over the past decade. These advances are largely due to the long-term monitoring of millions of galaxies by wide-field transient surveys, such as the Catalina Real-time Transient Survey (CRTS, Drake et al. 2009, Djorgovski et al. 2012), the Panoramic Survey Telescope and Rapid Response System (PS1, Chambers et al. 2016), and the Palomar Transient Factory (PTF, Law et al. 2009).
The most common cause for rapid, transient variations in the brightness of galaxies is supernovae. These objects provide insight into the final stages of stellar evolution, and, in the case of type-Ia supernovae, provide uniform standard candles for measuring cosmological distances (Sandage and Tammann 1982). To date, more than 25,000 supernova candidates have been discovered***http://www.rochesterastronomy.org/snimages/.
In the past five years supernova discovery rates have climbed from hundreds to thousands of events per year. This increase is almost exclusively due to the advent of modern transient surveys. This increase has been so dramatic that it far outstrips our ability to spectroscopically confirm the nature of most transient discoveries. Even with new spectroscopic surveys, such as the Public ESO Spectroscopic Survey for Transient Objects (PESSTO; Smartt et al. 2015), less than 20% of new supernova candidates are confirmed. This situation has become known as the “follow-up problem”.
Aside from supernovae, it is well known that many galaxies harbor massive black holes that undergo accretion processes that are often observed as nuclear variability. The variations of these sources are usually a few tenths of a magnitude, but can become compounded to variations of more than a magnitude on long timescales (MacLeod et al. 2012, Graham et al. in prep.). In very rare cases, these Active Galactic Nuclei (AGN) have recently been found that appear to turn-on or off over timescales of years (MacLeod et al. 2016, Gezari et al. 2017, Stern et al. 2018.). This so called ”changing-look” type behaviour have been observed at low levels in target studies of Seyfert galaxies for decades (e.g. Tohline & Osterbrock 1976; Osterbrock & Shuder 1982; Goodrich 1989), but has only recently been observed in luminous quasars. The advent of large surveys has confirmed this as a wide spread phenomenon.
A moderately large number (72 as of Jan. 2018)†††https://tde.space/ of transient events have also been associated with the tidal disruption of stars by massive nuclear black holes (Rees 1988, Gezari et al. 2003, Auchettl et al. 2017). Still further events temporal variability associated with AGN continue to have an unclear origin (e.g. Meusinger et al. 2010; Drake et al. 2011a). The possible causes of these AGN-related events are believed to include microlensing events, stellar mass black hole mergers, and superluminous supernovae (Lawrence et al. 2016, Graham et al. 2017).
The increased photometric monitoring of millions of galaxies by transient surveys has resulted in a significant increase in the number of transients found in galaxies. This increase has resulted in a smaller fraction of transients being spectroscopically confirmed. This is a trend that will almost certainly continue with even larger transient surveys, such as the Zwicky Transient Facility (ZTF; Bellm 2014) and the Large Synoptic Survey Telescope (LSST; Ivezic et al. 2008). The fact that we are unable to spectroscopically confirm the nature of most transients greatly increases the importance of any prior information that can be garnered from existing data.
Archival information from large spectroscopic surveys, such as the Sloan Digital Sky Survey (SDSS; Albareti et al. 2017), can aid our understanding of the nature of current and past transient events. For example, the spectroscopic redshift of a galaxy gives us a distance estimate for events that appear associated with it. The combination of this distance with extinction values and a lightcurve enable us to estimate the energetics of an event. Furthermore, the presence of emission lines in the host spectrum can be used to estimate the star formation rate and metallicity of the host. In turn, these pieces of information can often be used to constrain the type of event. For example, type-Ia supernovae have a well constrained set of lightcurve shapes and are found in all types of galaxies. In contrast, core collapse supernovae (hereafter CCSNe) are generally believed to be the product of massive stars with short lifetimes and are observationally very rare in ellipticals (van den Bergh & Tammann 1991).
In this paper we investigate what can be learnt about the variability in galaxies by combining existing photometry and spectra for more than a million galaxies. We specifically search for significant flares and outburst events that may have been missed in large surveys due to selection biases or assumptions about galaxy variability. We investigate the general nature of the galaxies hosting significant outbursts. We pay particular attention to the presence of flaring events like those found by Lawrence et al. (2016) and Graham et al. (2017) in AGN. Finally, we consider how archival data may help mitigate the follow-up problem in current and future large transient and variability surveys. We adopt , , and Vega magnitudes through out.
2 Data
In order to investigate the general nature of flaring phenomena in galaxies it is necessary to begin with a large, clean, sample of sources. Detection sensitivity requires that the sources have been monitored with the timespan and cadence required to discern such events from other types of variability and noise sources. The combination of photometry from the Catalina Surveys with SDSS spectroscopy provides us with this for more than a million galaxies.
2.1 Catalina Photometry
The Catalina Surveys consist of two separate surveys that use the same data for different purposes. These consist of the Catalina Sky Survey‡‡‡http://www.lpl.arizona.edu/css/ that focuses on the discovery of Near-Earth Objects (NEOs, Larson et al. 2003), and the Catalina Real-time Transient Survey (CRTS§§§http://crts.caltech.edu/) which searches for optical transients (Drake et al. 2009).
The NEO survey began taking observations with three telescopes in 2003. Each telescope was run as a separate sub-survey. These consisted of the 0.7m Catalina Schmidt Survey (CSS¶¶¶Note: CSS in this work only relates to this telescope) and the 1.5m Mount Lemmon Survey (MLS), both in Tucson, Arizona, and the 0.5m Siding Spring Survey (SSS) at Siding Spring, Australia. CRTS began by processing data from CSS in 2007 and later added data from MLS and SSS.
Each of the Catalina telescopes takes observations using a grid of fields that tile the sky. These surveys, when combined, cover most of the sky between declinations and +65 degrees. However, regions within 15∘ of the Galactic plane are generally avoided due to crowding.
The original MLS and CSS cameras have recently been upgraded to increase their field-of-view. However, here we only consider data taken in the original configuration, where MLS and CSS survey images covered 1.2 and 8.2 , respectively. We do not consider SSS data since this generally does not overlap with the SDSS footprint.
Almost all Catalina observations are taken in sequences of four images covering the same field each 10 minutes. Isophotal photometry is obtained for all sources in each observation using the SExtractor photometry program parameter ”MAG_ISOCOR” (Bertin & Arnouts 1996). All of the Catalina images are taken without a filter and are calibrated to a pseudo- magnitude () using a few dozen pre-selected standard stars in each field. Further details of the photometric calibration and transformations to standard systems are given in Drake et al. (2013).
Within the Catalina photometric dataset we concentrate on photometry taken between 2007 January 1 and 2016 April 28. We do not consider earlier Catalina photometry since some of it was measured using a larger aperture that caused inaccurate photometry when neighbouring sources were present.
Most of the photometry used in this work is publicly available as part of Catalina Surveys Data Release 2 (CSDR2)∥∥∥http://catalinadata.org. However, some additional more recent photometry is also included, which will soon be made available as part of CSDR4 (Drake et al., in prep.).
2.2 SDSS Spectra
The SDSS has operated for well over a decade and undertaken multiple spectroscopic surveys. For this analysis we selected spectroscopic data from SDSS DR13 (Albareti et al. 2017) as our reference set. This was the most recent SDSS data release at the time of the analysis and contains 4.4 million optical spectra of QSOs, galaxies, and stars. This dataset includes spectra from the SDSS legacy survey (York et al. 2000), as well as those from the new spectrograph used for the Baryon Oscillation Spectroscopic Survey (BOSS) (Dawson et al. 2016), and the Sloan Extended Quasar, ELG, and LRG Survey (SEQUELS) program (Albareti et al. 2017 and references therein).
The original SDSS legacy survey spectra have a wavelength range of 380-920 nm with resolution and fibres, while the BOSS spectra cover 360-1000 nm with and fibres. The legacy survey targeted what is known as the Main Galaxy Sample (MGS). This consists of bright galaxies with Petrosian magnitude (Strauss et al. 2002), a Luminous Red Galaxies (LRG) sample out to , and a QSO sample (Schneider et al. 2010). The more recent BOSS survey targeted fainter, more distant galaxies () and QSOs () than the SDSS Legacy survey (Dawson et al. 2016).
2.3 Galaxy Sample Selection
Among the full sample of SDSS spectra available in DR13, 2.6 million sources are classified as galaxies. A small number of the SDSS spectra are repeat observations of the same source. Of the SDSS galaxies, we select the 1.7 million sources with redshifts . We specifically limit our sample to the nearer sources since we are insensitive to most outbursts in more distant galaxies. For example, a magnitude galaxy at has (ignoring extinction). Thus, to detect an outburst in such a galaxy, the event would need to be among the few brightest known superluminous supernovae. Additionally, since more distant galaxies are, on average, fainter, they tend to have lower signal-to-noise ratio spectra.
The detection of flaring events in the presence of AGN has already been addressed for CSS data for 900,000 source by Graham et al. (2017). That work revealed many AGN undergoing large flaring events. Here we aim to test whether similar outbursts also occur in quiescent galaxies. However, we do not remove the small fraction () of SDSS galaxies that are also spectroscopically classified as containing AGN.
Matching the locations of the SDSS DR13 spectroscopic galaxy sample to those among the 200 million sources in the CSS catalog, we find million matches within . Since our aim is to find outbursts in the lightcurves of these sources, we sub-select the galaxies with 20 or more nights of CSS photometric observations. This selection reduces the total number of SDSS galaxies with CSS lightcurves to 1.43 million. Some of the matched galaxies are duplicates due to overlap between CSS fields. In the final dataset there are million unique CSS sources having SDSS spectra.
We also matched the nearby () SDSS galaxy sample to sources from the MLS survey. This data only covers objects near the ecliptic, where there are only 377,000 matches with SDSS. The MLS photometry is also much sparser than CSS. Among these matches only 152,000 have more than 20 nights of MLS observations. Since the number of SDSS galaxies with MLS lightcurves is only % that of the CSS set, we will primarily concentrate our analysis on the CSS sample.
3 Candidate Selection
In order to select a set of photometric outbursts, among the sample of 1.4 million spectroscopically confirmed galaxies with significant CSS photometry, we must first understand the range of photometric uncertainty and the extent of individual object variability. Once we understand these, we can then identify and remove sources of noise to minimize any impact they might have on the results.
3.1 Determining Photometric Uncertainties


Our main goal in this work is to find galaxies exhibiting flaring events among the SDSS sample of spectroscopically confirmed galaxies. Such events may be due to supernovae, tidal disruption events (Rees 1988), AGN activity, microlensing (Lawrence et al. 2016), or other hitherto unknown sources. Since our aim was to find outbursts in general, we decided to minimize assumptions about the shapes of the events. Thus, our initial selection of candidates was based on statistical significance rather than model fitting.
In order to select galaxies exhibiting significant changes in brightness it is necessary to understand the underlying degree of scatter in the photometric data. Based on reduced values for fits to periodic variable lightcurves, Drake et al. (2014) showed that the photometric uncertainties given for CSS photometry in CSDR2 are generally overestimated for bright sources and underestimated for fainter sources. Graham et al. (2017) further quantified the values required to correct the average magnitude-dependent effect. Nevertheless, since these corrections are averaged over million objects distributed across most of the sky, they fail to fully represent the low level variations in individual lightcurves due to differences in crowding, airmass, weather, etc. Thus in this work, rather than correcting the uncertainties using the values in Graham et al. (2017), we instead measure the scatter in the photometry for each lightcurve as an initial estimate of the true uncertainty.
As a starting point, we assume the uncertainties are normally distributed and use the standard deviation for each source as the measure of scatter. In the left panel of Figure 1, we plot the distribution of CSS photometric uncertainties for a sub-sample of 200,000 of the SDSS galaxies. Evidently, galaxies brighter than typically have mags and at galaxies have mags.
We note that the presence of real underlying variability, such as due to AGN, will tend to skew or broaden the observed distributions as will outliers due to noise sources. To mitigate the effect of outliers we perform a clipping on the measurements. We then recalculate the scatter from the clipped distribution. The clipping process typically only removes a few outliers from each lightcurve. The outliers themselves are mainly bright points caused by artifacts, such as saturated columns, internal reflections and satellite trails, as discussed in the next section.
We do not expect that long-timescale variability will be significantly affected by the clipping process. For example, the long-timescale variability typical of AGN (Macleod et al. 2012) will tend to broaden the distribution beyond the true photometric uncertainties, but few if any points will be removed.
3.1.1 Sources of Photometric Outliers
As noted above, our simple statistical selection of outbursts is only dependent on the distribution of photometric measurements. The lightcurves can be affected by both real outbursts as well as noise sources within the images. These two sources both generally produce a long positive tail in the measurement distributions. It is therefore necessary to separate the noise sources from the actual outbursts.
One of the main sources of photometric outliers are image artifacts due to very bright stars. Such stars can cause saturated lines, blooms and halos that can affect the measurements of both nearby and distant sources. Additionally, the effects caused by bright stars can occur intermittently, since a bright star may not saturate an image taken in poor seeing, or when the sky background level is low.
As part of the CRTS transient search processing, all CSS data is run through a pipeline that automatically masks objects in close proximity to very bright stars (Drake et al. 2009). The values used to veto transient candidates near bright stars are the same as those used to cull AGN flare candidates near bright stars as presented in Graham et al. (2017). That process was also adopted to veto flare candidates in this work. In the right panel of Figure 1, we show the scatter for the small fraction of galaxies that are in close proximity to saturated stars. This small group () of galaxies contributed a large fraction of all sources having significant scatter. In addition, the brightest stars also introduce noise into the lightcurves of much more distant sources via line-bleeds. Indeed, since the field-of-view of the Catalina CSS camera spans more than two degrees, these line-bleeds also can affect lightcurves of sources that are very far from the saturated stars.
Inspecting a number of the full Catalina images we found that the line-bleeds are generally contained to within tens of arcseconds along right ascension (even for stars with ). A smaller effect was also measured along declination for saturated stars. By using the known locations of bright stars in the Tycho catalog we compiled a list of galaxies within our sample that could be affected by bleeds from saturated stars lying anywhere within their field. This list contains only 17,000 galaxies among the 1.4 million CSS-SDSS galaxy sample.
Considering the full observational situation it is self-evident that this list would not contain all affected galaxies. For example, the degree of saturation-induced bleeding alone depends on the colour of the star as well as changes in the background sky level, etc. In fact, the complexity and diversity of the effects caused by bright stars limits our ability to algorithmically mitigate the sources of all outliers. Inspection of the lightcurves and images showed us that many additional lightcurves were affected by related effects as well as unrelated noise sources. Specifically, there were many cases where galaxies were not in close proximity to a very bright star, but rather multiple moderately bright sources. There were also lightcurves with photometry that was affected by reflections, cosmic rays and satellite trails. Thus, rather than simply removing galaxies that were potentially affected by neighbour saturated stars, we concluded that it would eventually be necessary to inspect the images for every single outburst candidate.
The need for the final by-eye image verification was not surprising, since even modern transient surveys employing machine learning classification techniques still require human scanners as the final step in transient confirmation. This is due to the fact that both transients and artifacts are generally rare (sometimes unique). Their scarcity often places them in the same poorly defined region of the detection parameter space, where the measured observables are insufficient for a unique classification without the addition of contextual data (such as can be gained from the images, historical lightcurves, multi-wavelength data, etc.).
3.2 Initial candidate selection
3.2.1 Information from Known Events
In order to investigate the methods and thresholds that might be appropriate for finding outbursts, we decided to extract the lightcurves for every galaxy with an SDSS spectrum and a known supernova candidate. Although we are not specifically searching for supernovae, such sources clearly provide the largest and most well understood population of outburst events within galaxies.
We matched the online Rochester SN catalog (Gal-Yam et al. 2013), consisting of 25,000 known SN candidates, with the spectroscopically confirmed SDSS galaxies in our sample. In total, this dataset consisted of 3,131 unique SDSS galaxies with SN candidates and CSS lightcurves. Due to repeated spectroscopic observations, there are actually 3,464 individual SDSS spectra for these hosts. Additionally, due to overlap between CSS fields, these galaxies match 3,207 separate CSS lightcurves.
Of the 3,131 supernova candidates, a large fraction are undetectable within the Catalina lightcurves as they occurred before the galaxy was monitored, or during observing gaps. Overall, only 1,732 of the SN candidates in SDSS confirmed galaxies were discovered within the range of dates analyzed here.
For each of these galaxies we extracted the CSS lightcurve. We then plotted and inspected each. Many of the SN candidates show no sign within CSS lightcurves since they are well offset from the cores of their hosts. Nevertheless, even when there is no evidence for the supernova candidates in the CSS lightcurves, these galaxies can still provide a useful sample for testing and understanding the properties of SN host galaxies. The set of hosts where the SN candidates were clearly present within the CSS lightcurves provided us with a means for determining whether our detection method and threshold was actually selecting the events.
3.2.2 Filtering candidates
Overall, based on our sigma clipping we know that outliers occur at a rate of around 1% of the data. Nevertheless, in some cases there can be dozens of outliers. Thus, with more than a million lightcurves, the selection of outburst candidates based on a single night is impractical. Significant additional evidence would be required to believe the validity of any such candidates. Likewise, the expected false positive rate due to two consecutive nights of high measurements is also too high to have confidence in candidates. However, the probability of a third night containing an outlier in a sequence of between 20 and 200 nights is highly unlikely (, assuming their occurrence is uncorrelated). Thus, our initial criterion for selecting outburst candidates was to require that each candidate was detected on at least three contiguous nights of observations.
This selection enables us to mitigate most of the problems due to random artifact occurrences. Nevertheless, in some cases outliers due to spurious sources are also correlated in time –for example, due to lunar cycles, seasonal variations in observational airmass, weather patterns, etc. Thus, rather than, for example, simply selecting sources that are outliers based on the presence of, for example, three contiguous detections, we decided to estimate the likelihood of each detection based on a normal distribution. To simplify the process we only calculate the probabilities for sequences of measurements where there are at least three values above the median brightness. Such sequences occur in a random sequence of normally distributed data of the time.
3.2.3 Modeling Coincidences
We carried out simple numerical simulations involving the production of a few hundred thousand lightcurves with purely Gaussian deviates. We found that of these lightcurves meet our initial selection criteria. Such a low threshold enables us to potentially retain some sensitivity to selecting events with long timescales when the individual nights have only marginal significance. However, it was obvious that much more stringent criteria were required to remove the coincidental detections.
The initial selection process was run on the known SN candidates as well as on the full set of 1.4 million galaxy lightcurves. In total, 400,000 of the lightcurves had at least three contiguous deviations (in good agreement with our expectations). For all the lightcurves meeting the initial threshold, we then estimated the probabilities, , of each set of high points randomly occurring. In each case the combined nightly average magnitudes were assumed to be normally distributed.
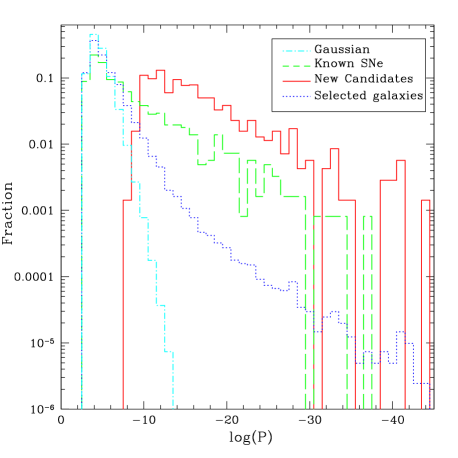
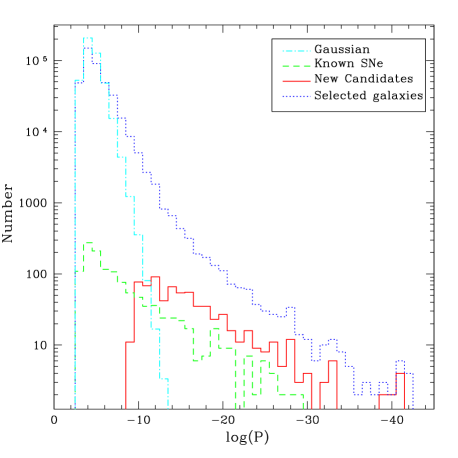
In Figure 2, we plot the distribution of expected probabilities for each of the candidate outbursts in the initial selection as well as those for the 1,232 previously known SNe candidates that meet our initial selection criteria. This plot also shows the number of objects and probabilities expect based on our simple numerically simulated lightcurves with pure normally distributed data. One can see that for events with , the number of candidates selected is consistent with that expected from our simulated normally distributed data. However, the actual distribution of probabilities for the initial 400,000 selected sources is very different from the pure Gaussian simulation. The observed distribution shows a strong tail. This is due to a combination of real variability, the presence of outliers, and the heteroscedastic nature of photometric uncertainties.
3.3 Final Candidate Selection
As noted above, based on our initial investigation there was a clear need to inspect the data relating to each candidate. To decrease the number of spurious outbursts, we decided to inspect both the lightcurves and the images of each candidate.
3.3.1 Lightcurve Inspection
To select good candidates from the initial large set, we firstly inspected the lightcurves of a few hundred random galaxies as well as all 3,207 galaxies containing previously known SN candidates. We payed particular attention to the lightcurves of galaxies where the SN candidate were know to occur during our analysis period.
This initial inspection led us to select only candidates where the chance of random occurrence was . This threshold was determined based on requiring that known SN candidates should be selected via the presence of the actual outburst. We determined that events with peaks occurring within 100 days of the candidate’s discovery date were likely due to that event. In such cases there is only a 6% chance of any of these events occurring randomly given that span of the observations is 3,500 days. We found that most of the known SN candidates that were among the initial 400,000 objects, though a number were missed by the selection as they did not exhibit significant sign of the SN in the lightcurve.
Having decided on our probability threshold, we inspected the lightcurves of every source with . Of these, of the candidates were rejected simply by considering the presence of variability (due to real sources or noise artifacts) in the lightcurves. We selected a refined set of candidates by further considering the shapes of each outburst candidate, additional measurements surrounding each candidate event and event coincidence in MLS data. Overall, this process led to an initial set of 1,090 new outburst candidates.
3.3.2 Image Inspection
After our initial selection of candidates based on lightcurve data, we inspected the images associated with the peak for each candidate. This process enabled us to remove candidates due to image artifacts (such as saturated columns and blending).
For every candidate we extracted cutouts across for the images taken within 10 days of the photometric peak. For the initial set of 1,090 CSS outburst candidates this consisted of 7,638 separate images. After removing events due to image artifacts we were left with a final set of 692 outburst candidates.
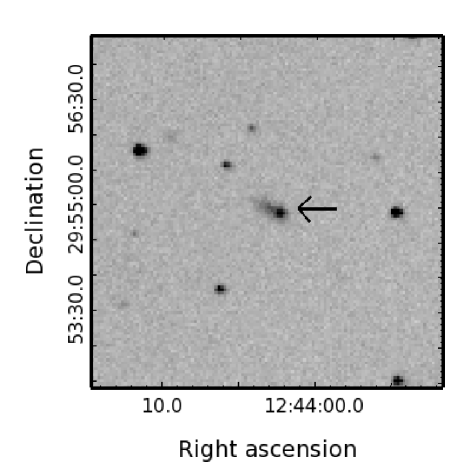
While examining the images of the outburst candidates we noted that a small fraction (%) clearly showed the presence of a new source that was separated from the core of the host galaxy. We were able to verify that these were indeed real objects by comparing the outburst images with the deeper, higher resolution, images of the hosts from SDSS. We note that all of the SDSS images were taken prior to the CSS data, so the presence of new sources gives us very high confidence that these detections are genuine. Furthermore, since TDEs and AGN flares are only expected in the cores of galaxies, these particular sources are all likely to be supernovae. In Figure 3, we show an example of likely supernova CRTS_OBC_341. Here the new source is clearly seen offset from the core of the galaxy KUG 1241+301.
For the bulk of the outburst candidates, the lack of a new source is expected since sources that are resolved from their host galaxies should be detected as separate new sources. It may be possible to resolve additional outbursts from their hosts using image subtraction. However, since most of the host galaxies with new candidates appear relatively compact, and the CSS pixels are large (), this is unlikely to lead to many with statistically significant offsets.
4 Outburst Candidates
| ID | RA (J2000, deg) | Dec (deg) | length (d) | Signif | log(P) | Nights | Quality | |||
|---|---|---|---|---|---|---|---|---|---|---|
| CRTS_OBC_1 | 139.3122 | 4.1337 | 18.01 | -15.55 | 54038.5 | 174 | 70.91 | -30.91 | 10 | I |
| CRTS_OBC_2 | 163.2952 | 27.7206 | 19.02 | -16.53 | 54062.5 | 272 | 33.41 | -18.69 | 8 | I |
| CRTS_OBC_3 | 165.9949 | 26.3342 | 18.37 | -20.37 | 54062.5 | 405 | 49.36 | -32.95 | 12 | Ib |
| CRTS_OBC_4 | 24.7624 | 6.4963 | 18.78 | -18.98 | 54108.1 | 246 | 14.08 | -13.05 | 4 | II |
| CRTS_OBC_5 | 131.8185 | 31.8859 | 18.99 | -20.04 | 54117.3 | 235 | 44.67 | -39.27 | 13 | I |
| CRTS_OBC_6 | 175.2558 | 5.2601 | 17.95 | -17.73 | 54124.5 | 102 | 24.11 | -15.78 | 5 | Ia |
| CRTS_OBC_7 | 146.3246 | 34.0959 | 18.85 | -17.48 | 54127.2 | 82 | 17.27 | -10.22 | 4 | III |
| CRTS_OBC_8 | 155.7226 | 33.3855 | 19.25 | -17.20 | 54127.2 | 113 | 13.57 | -12.31 | 6 | Ib |
| CRTS_OBC_9 | 213.9948 | 2.7104 | 17.70 | -19.94 | 54128.5 | 140 | 31.70 | -24.89 | 7 | I |
| CRTS_OBC_10 | 172.4056 | 14.4719 | 18.99 | -18.44 | 54139.4 | 87 | 29.32 | -15.63 | 6 | Ia |
The full table will be available online.
Column 1: CRTS outburst candidate ID.
Columns 2 and 3: Source coordinates.
Columns 4 and 5: Apparent and absolute magnitudes for the peak of the outburst, respectively.
Columns 6: MJD of the outburst peak.
Column 7: Timespan over which the candidate outburst was detected about .
Column 8: Total significance in sigma of the detections during the outburst timespan.
Column 9: Probability of false detection assuming normally distributed data.
Column 10: Number of nights when the outburst was detected above .
Column 11: Quality of the outburst candidate based the inspection of lightcurves and images as well as the presence of detections in MLS data. The values are as follows: — high confidence event; — moderate confidence event; —- low confidence event.
a outburst is also detected in MLS observations.
b source is resolved from the host galaxy.
c long timescale event.
In Table 1, we present the parameters for each of the 692 new CSS outburst candidates. This table includes the length and significance of each outburst candidate as well as an assessment of the quality of each candidate based on the inspection of the lightcurve and images. Most of the 80 candidates with a quality value of have and are thus potentially statistical coincidences. In some cases a candidate is deemed of higher quality than the probability would suggest because it is also seen in MLS photometry.
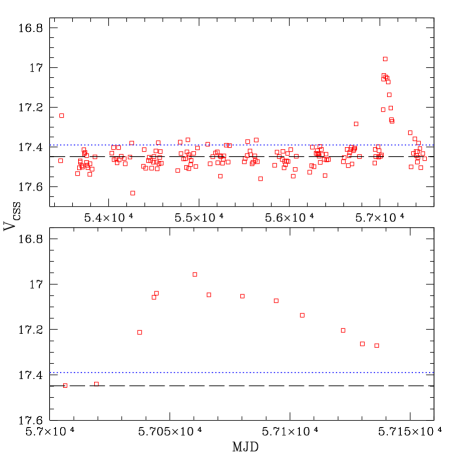
Nightly-averaged lightcurves for CRTS_OBC_613 (left) and CRTS_OBC_451 (right). The host galaxies are SDSS J102352.98+292333.4 () and SDSS J084904.74+342045.3 (), respectively.
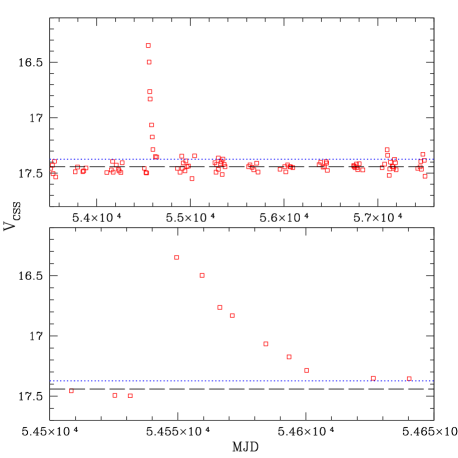
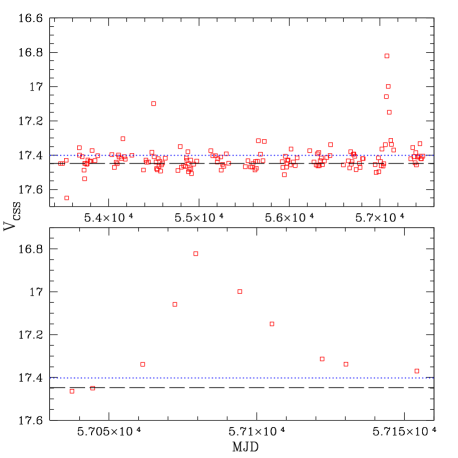
Nightly-averaged lightcurves for CRTS_OBC_436 (left) and CRTS_OBC_102 (right). The host galaxies are SDSS J111452.35+362516.6 () and SDSS J143345.61+344831.9 (), respectively.
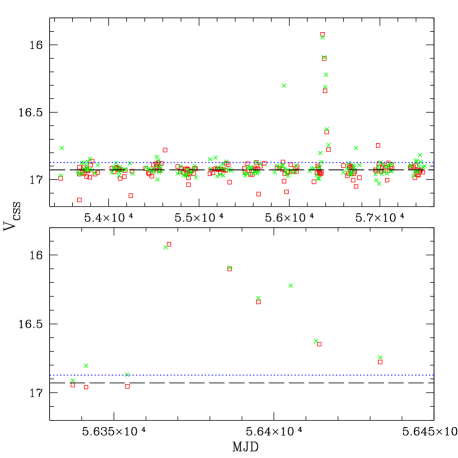
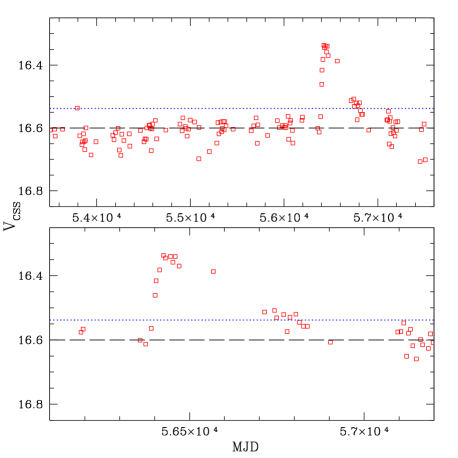
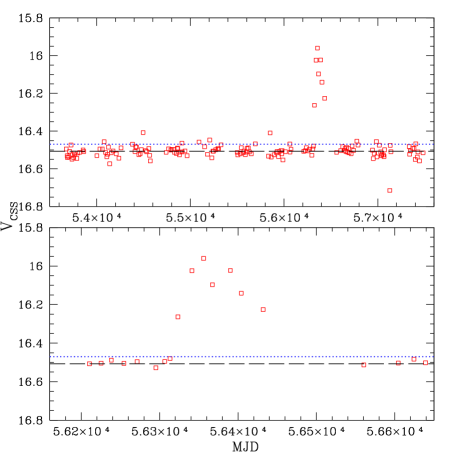
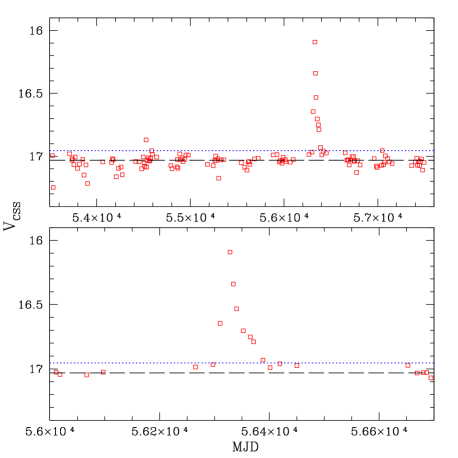
Nightly-averaged lightcurves for CRTS_OBC_454 (left) and CRTS_OBC_481 (right). CRTS_OBC_454 is in overlap between two fields, providing an additional set of measurements shown as green crosses. The host galaxies are KUG 0930+304 (aka SDSS J093332.30+301342.8, ) and SDSS J155045.39+201454.0 (), respectively.
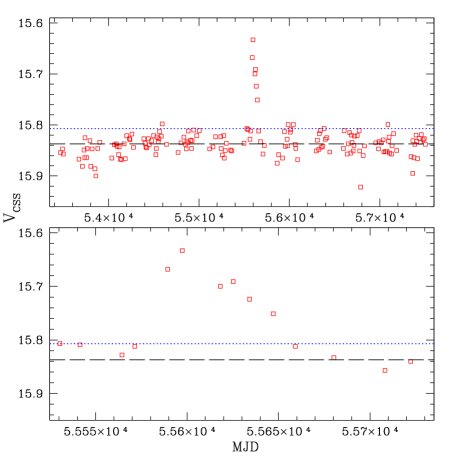
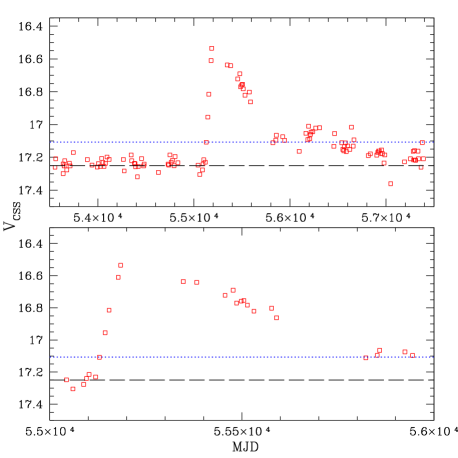
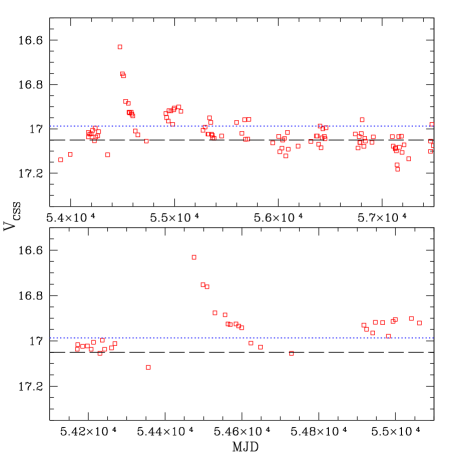
In Figure 4, we present the full CSS lightcurves and a zoomed outburst region for a sample of the new outburst candidates that passed both lightcurve and image inspection. In each case we include the lower limit used to detect outbursts. We do not include individual measurement uncertainties since our selection method is based on the distributions rather than individual uncertainties.
In most cases the events are seen to last around 100 days in the observed frame. This timescale is completely consistent with expectations for supernovae. However, in a few cases the events are significantly longer. For example, the outburst of CRTS_OBC_454 (Figure 4, set 4) appears to have lasted for at least 400 days. Such events are not consistent with most types of supernovae. However, they are consistent with some type-IIn supernovae that can have outbursts that last for years (e.g. Smith et al. 2010, Rest et al. 2011).
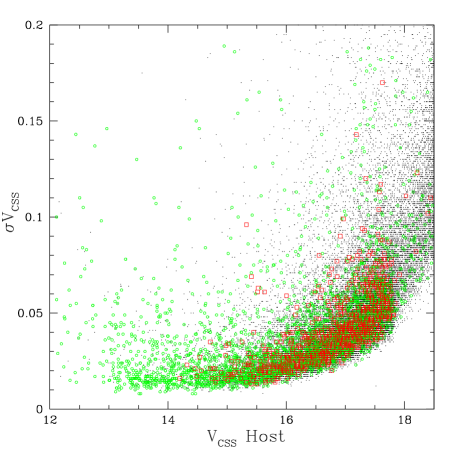
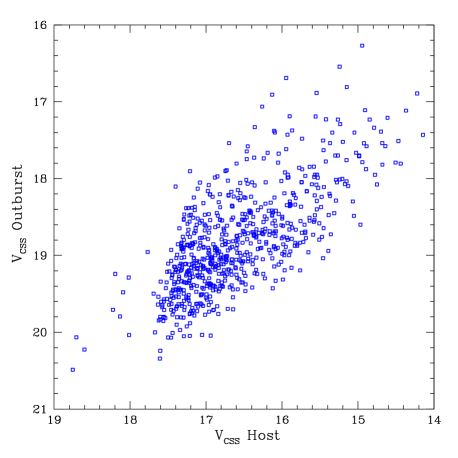
In Figure 8, we show the scatter of the newly selected outburst candidates compared to the previously known SN candidates. Interestingly, the new candidates are generally found to exhibit smaller photometric scatter than those galaxies with known SN candidates. Also, as expected, the scatter among the new candidates is far smaller than the objects expected to be affected by nearby bright stars (as previously shown in Figure 1). That is to say, almost all of the new candidates have mag, while many of the galaxies affected by nearby saturated stars have mag.
By subtracting the median host magnitudes from the peak observed magnitudes for each event, we derived estimates for the brightness of each outburst. By using distances derived from the known host redshifts we also determined the peak absolute magnitude. However, these estimates are lower limits since, while we have corrected for foreground extinction (using Schlegel et al. 1998 reddening maps), the amount of extinction the outbursts suffer within the hosts is unknown.
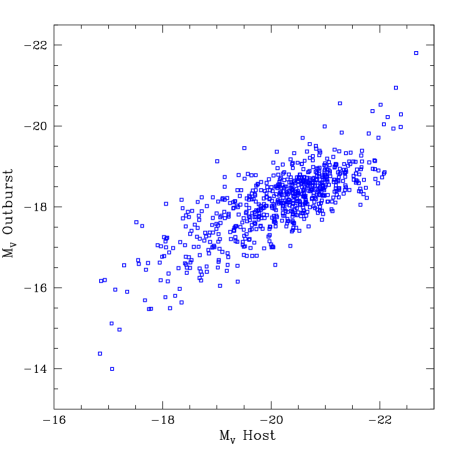
In Figure 9, we plot the magnitude distributions for the outbursts and their hosts. As expected, the outburst absolute magnitudes generally range from to . This is completely consistent with the brightness distribution for regular supernovae (Richardson et al. 2002). However, there are a few brighter events that we will discuss later. Overall, the outbursts are found to be asymmetrical. Those events where the outburst shape is well defined all have much shorter rise times than declines. Such features are a general feature of all types of SNe lightcurves, even though there is significant diversity in the exact shapes. In contrast, Graham et al. (2018) found a several examples of QSO flares where the rise and decline times were similar.
5 Nature of the Host Galaxies
| SDSS ID | RA (J2000) | Dec | SFR | Metallicity | Age | Mass | ||||
|---|---|---|---|---|---|---|---|---|---|---|
| (deg) | (deg) | () | (Gyr) | (log() | ||||||
| SDSS_J002316.49-101850.2 | 5.8187 | -10.3139 | 0.0282 | 16.10 | -19.31 | 52145 | 0 | 0.004 | 0.4042 | 8.64 |
| SDSS_J003042.78-085502.5 | 7.6782 | -8.9174 | 0.1397 | 16.92 | -22.15 | 52146 | 0 | 0.01 | 1.1391 | 10.44 |
| SDSS_J003159.53-103646.0 | 7.9981 | -10.6128 | 0.0545 | 16.04 | -20.85 | 52146 | 0.4 | 0.01 | 1.2781 | 9.79 |
| SDSS_J004310.40-090324.8 | 10.7933 | -9.0569 | 0.0577 | 15.46 | -21.56 | 52162 | 0 | 0.02 | 4.75 | 10.75 |
| SDSS_J004701.14-085811.5 | 11.7547 | -8.9698 | 0.1134 | 17.22 | -21.36 | 52148 | 0.9 | 0.02 | 1.2781 | 10.12 |
| SDSS_J004844.33-092643.3 | 12.1847 | -9.4454 | 0.0958 | 16.95 | -21.23 | 52148 | 0 | 0.02 | 5.5 | 10.73 |
| SDSS_J005516.14+000542.0 | 13.8172 | 0.0950 | 0.0433 | 15.95 | -20.42 | 51783 | 0 | 0.02 | 4.25 | 10.22 |
| SDSS_J010921.02+154406.6 | 17.3376 | 15.7352 | 0.0603 | 17.15 | -19.97 | 51878 | 0.1 | 0.04 | 1.9 | 9.86 |
| SDSS_J011050.82+001153.3 | 17.7118 | 0.1981 | 0.0176 | 14.71 | -19.65 | 51816 | 0.2 | 0.01 | 1.2781 | 9.36 |
The full table will be available online.
Column 1: SDSS ID of the outburst host galaxies.
Columns 2 and 3: Source coordinates.
Column 4: Redshift of the galaxies from SDSS.
Columns 5 and 6: Apparent and absolute magnitudes of the host based on CSS photometry after correcting for foreground extinction using the Schlegel et al. (1998) reddening maps.
Column 7: Date that the SDSS spectrum was obtained.
Columns 8, 9, 10 and 11: Star formation rate, metallicity (model values 0.004, 0.01, 0.02, 0.04), age and host mass for the best fit model to the SDSS spectrum.
a denotes whether a galaxy is an AGN based on the spectrum and/or WISE.
SDSS DR13 provides details such as age, metallicity, starformation rate and mass for most of the galaxies with spectra. In Table 2 we present the known properties for each of the galaxies containing an outburst candidate.
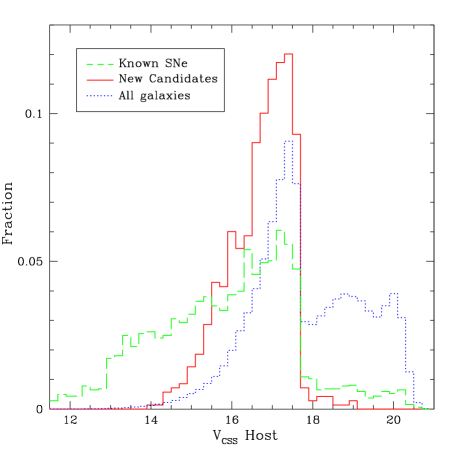
In Figure 10, we plot the distribution of the apparent magnitudes of all SDSS galaxies with CSS matches along with those containing new CSS outburst candidates. The galaxies with new outburst candidates are clearly peaked at bright magnitudes. This peak coincides directly with that seen in the distribution of SDSS galaxy magnitudes. The strong peak in SDSS galaxy magnitudes is due to the spectroscopic target selection. Fainter spectroscopically confirmed SDSS galaxies come from the BOSS survey as well as other later generation SDSS surveys. Our selection is clearly not uncovering new outbursts in the fainter galaxies. However, Figure 10 does show that the hosts with new outburst candidates are generally fainter than those with previously known SN candidates. We believe this is predominately because the nearby bright galaxies are better monitored and the bright SNe that they contain have already been discovered.
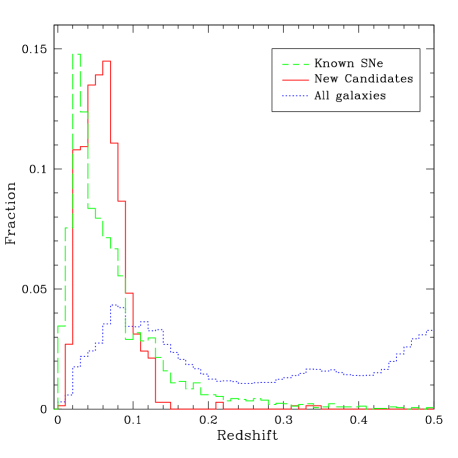
The redshift distributions of the 1.4 million matched SDSS galaxies is shown in Figure 11. Here we note that the SDSS BOSS galaxies generally have redshifts . Thus, we find that the lack of new outburst candidates in the faint SDSS BOSS galaxies relates to them being generally more distant. This agrees with the idea that most of the new outbursts are due to supernovae. That is, SNe in general have peak magnitudes (the peak luminosity for type-Ia SNe). At regular SNe have peaks with . Thus, such events are undetectable in the CSS data. However, superluminous SNe can be much brighter and are detectable to .
5.1 Emission line galaxies
SDSS DR13 provides an assessment of the nature of each spectrum by way of an assigned class. This parameter has values of “STAR”, “QSO” and “GALAXY”, and is determined on the basis of the chi-squared value of the data with respect to a model (Bolton et al. 2012). Galaxies with narrow emission lines are sub-classified into AGN and star-forming types based upon measurements of and line ratios. The resulting subclasses are noted as “Starforming”, “Starburst” and “AGN”. An additional separate assessment of “Broadline” is appended for spectra having emission lines with width .
| Subclass | All % (total) | SN Hosts % (total) | Outbursters % (total) |
|---|---|---|---|
| Starforming | 16.8 (238299) | 47.0 (1474) | 57.2 (396) |
| Starburst | 4.4 (62829) | 9.8 (308) | 15.7 (109) |
| AGN | 1.7 (24579) | 2.7 (120) | 2.3 (16) |
| Broadline | 1.6 (22421) | 7.0 (220) | 1.0 (7) |
Column 1: Subclasses defined by SDSS.
Column 2: Number of emission line galaxies in each subclass as fraction of the full 1.4 million sample.
Column 3: Fraction of all SN hosts in the respective SDSS subclass.
Column 4: Number of new outbursters in each respect SDSS subclass.
In Table 3, we present the percentage of the total sample for each of the galaxy subclasses having emission lines. Interestingly, while only of the 1.4 million SDSS are classified as starforming, 47% of the known SNe hosts and 57% of the hosts with newly outbursts are starforming. Higher numbers of CCSNe are expected in starforming galaxies than passive ones since they are due to massive stars with short lives. In contrast, type-Ia supernovae are known to occur in galaxies regardless of recent star formation. Nevertheless, the fact that we observed times as many new outburst candidates in starforming galaxies is larger than expected since our sample is mainly magnitude-limited by the SDSS legacy survey follow-up limit. For that limit Li et al. (2011a) show that the number of type-Ia’s far exceeds CCSNe, since type-Ia’s are significantly brighter on average. In contrast, Li et al. (2011a) found that for their volume-limited sample, of their SNe were core-collapse.
An important difference between our galaxy sample and that of Li et al. (2011a,2011b), is that the latter may have missed a larger fraction of nearby faint dwarf galaxies since most such galaxies were uncatalogued at the time their survey began. Thus, it is very unlikely that their volume-limited sample was as complete as ours at the low-mass end. Dwarf galaxies often have very high specific star formation rates (SSFR, Li et al. 2011b, Huang et al. 2012). Furthermore, our selection of candidates from lightcurves naturally introduces a bias toward detecting outbursts in intrinsically faint galaxies (since the variation in such a galaxy’s lightcurve will be larger). This effect is balanced slightly by the fact that fainter local galaxies are missing from the SDSS spectroscopic sample because of the magnitude limit. Indeed, dwarf galaxies do not seem to play a significant role since the new outburst hosts generally have , and are thus as much as magnitudes brighter than the faintest dwarf galaxies where SNe have been discovered (Williams et al. 2008, Drake et al. 2011b).
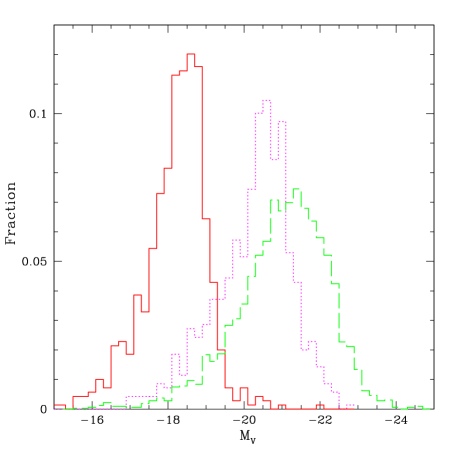
As a more complete test, we consider the combination of the known and new outburst hosts since many of the SNe in intrinsically bright galaxies were already known. Figure 12, shows that the host galaxies of the new outbursts are mag less luminous (on average) than those with previously known SN candidates. In the combined known plus new outburst case we see that 49% of the galaxies are starforming. When we add the starburst host galaxies to the starforming ones we see that of the new outburst plus known SN candidates are in active starforming galaxies. Thus, overall most of host galaxies with outbursts are undergoing significant star formation.
We also note that the number of new outbursts associated with broad-lined hosts is much lower than those of previous SN candidates. This may suggest that some of the previously discovered and unconfirmed SN candidates were due to AGN activity. It is also possible that some of the galaxies contain broad lines due to supernovae rather than a super-massive black hole (SMBH). Indeed, a number of SNe have already been found within the SDSS spectroscopic galaxy sample (Graur et al. 2015). However, significant contamination seems unlikely since spectra with SN represent of the SDSS galaxies analysed by Graur et al. (2015).
Although only a small fraction of the new outbursts are associated with hosts that are noted by SDSS as either AGN or having broad lines, it is worth considering AGN as a possible source for the new events. In particular, it is possible that a number of AGN have not been identified due to the weakness of visible narrow lines (Koss et al. 2017).
5.1.1 Active Galactic Nuclei
AGN are responsible for the bulk of the optical variability observed in galaxies. Their presence is almost guaranteed when searching for variability within galaxies. However, the nature of AGN variability itself is known to be quite well modeled as a damped random walk process (Kelly, Bechtold, & Siemiginowska 2009, MacLeod et al. 2012). Flaring events that appear to be associated with AGN have only been found in the last decade as samples of hundreds of thousands of AGN are regularly monitored by transient surveys (MacLeod et al. 2016, Graham et al. 2017). In some cases these events are believed to be due to phenomena such as microlensing, superluminous SNe, tidal disruption events (e.g., Lawrence et al. 2016), or changes in the accretion or dust environment that might cause an AGN to appear to turn on (e.g., LaMassa et al. 2015, Gezari et al. 2017, Stern et al. 2017).
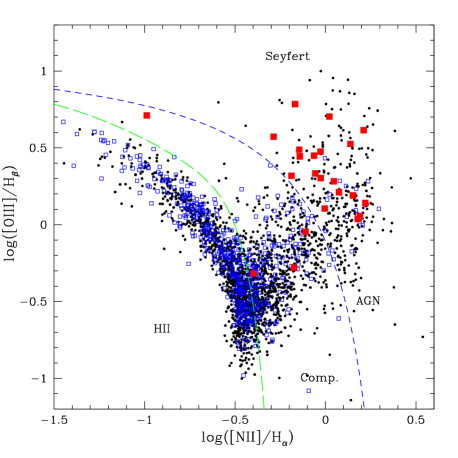
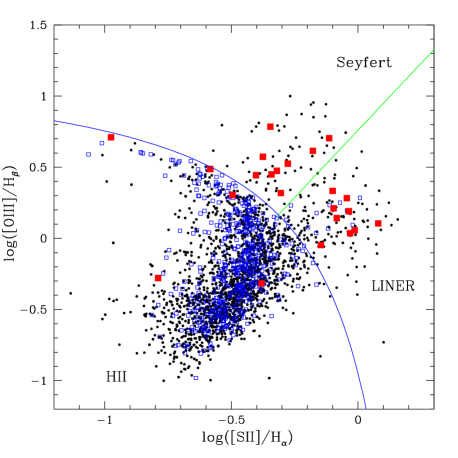
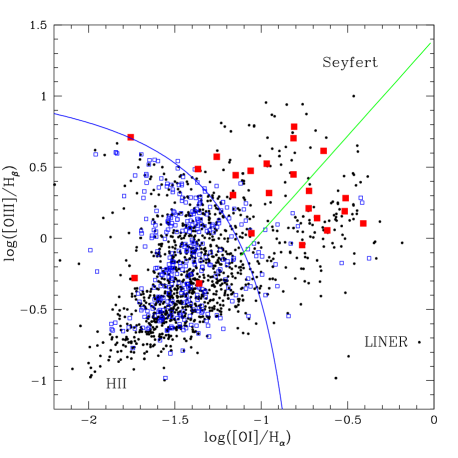
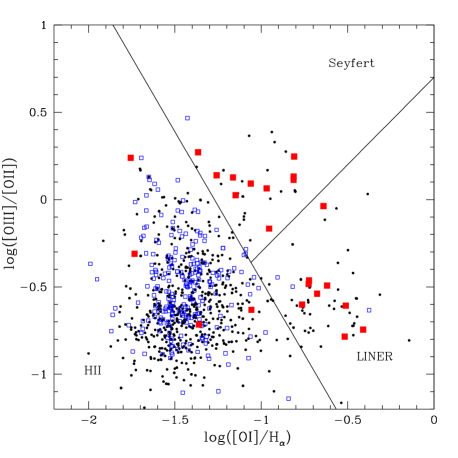
To understand how many of the newly detected outbursts might be due to AGN variability, we decided to investigate the nature of the host galaxies. The SDSS AGN classifications are based solely on the ratios of , and lines. Since the selection of AGN via a single set of criteria is subject to uncertainties and the presence of individual lines and accuracy of their measurements, we decided to calculate the four sets of line ratio diagnostics given by Kewley et al. (2006) for each galaxy with narrow emission lines. The four diagnostic diagrams are presented in Figures 13 and 14 for the hosts of both previously known SN candidates and new outburst candidates. In addition to the lines used by SDSS, these include measurements for , and . Such line diagnostics have been widely adopted for the purpose of AGN classification.
The measurements we use are based on Thomas et al. (2013) and come from SDSS DR13, where they are known as the Portsmouth values. SDSS DR13 provides line measurements for each galaxy with a spectrum. However, while inspecting the fits to the SDSS spectra we found that some of the emission line measurements provided by SDSS DR13 were spurious. In particular, we found that galaxies lacking emission lines still included as positive values with very large relative errors. Thus, rather than simply adopting the SDSS fit values, we limited our selections to galaxies where the measured fluxes were at least twice their assigned uncertainties. This reduces the number of galaxies with new outburst candidates with line measurements by in the case of the generally weak line as seen in Figure 14.
Since many of the galaxies do not have measurements passing our criteria, we decide to only require that each AGN candidate met three of the four AGN diagnostics. Furthermore, since some AGN with noisy spectra may not meet even this selection, we also inspected each spectrum for the presence of broad lines that would also indicate the presence of an AGN (rather than pure star formation). As expected, we found very good agreement between the objects we selected as AGN and those noted as AGN in SDSS DR13.
Clearly a small number of the galaxies with outbursts are indeed classified as AGN based on emission line diagnostics. Yet overall the bulk of the galaxies are not AGN, but are instead star-forming. Nevertheless, a number of the hosts also fall in the composite AGN-starforming region shown in Figure 13. This indicates that the number of AGN identified in this way is only a lower limit. Many additional AGN could be highly obscured and thus not exhibit strong emission lines. We do not observe any significant difference in the distribution of the hosts of our new outburst candidates and those of previously known SN candidates.
In addition to investigating line diagnostics, we also matched our candidates with AGN candidates selected based on AllWISE IR data by Secrest et al. (2015). This catalog consists of million AGN candidates. Only four of the host galaxies with new outbursts had matches with this catalog.
In total, 23 of the galaxies with outbursts were found to be in hosts that were likely AGNs. These galaxies are marked in Table 2. It is quite clear that only a small number of the outburst candidates can be attributed to either regular stochastic AGN variability or rare AGN flares. Of course, SNe also occur in galaxies with AGN. So the fact that a candidate occurs in a host with an AGN does not mean that an outburst is due to an AGN. Indeed, the rate of SNe in galaxies with AGN is expected to be similar to that in non-AGNs (Cappellaro, Evans, & Turatto 1999). Since our sample of outbursting events in AGN is so small. It is not possible to judge whether the AGN with broad lines (type-1 AGNs) is different than the rate in type-2’s where the broad lines are obscured. Nevertheless, the presence of AGN variability would certainly increase the threshold required to detect outbursts in AGN. Thus SNe are expected to be under-represented in AGN
5.1.2 Starforming Galaxies
The rate of CCSNe is expected to be highest in galaxies with active star formation (Petrosian et al. 2005). This clearly is borne out by the very high fraction of new outbursts that we found to be in starforming galaxies. To better understand this link, we extracted masses and star formation rates for each galaxy with values given by DR13, based on Maraston et al. (2006). This set consists of values for million of the galaxies in the full sample of SDSS galaxies. Thus, only of the galaxies in our CSS-SDSS sample do not have star formation measurements.
In addition to star formation rates, the SDSS galaxies also have mass determinations. In order to have reasonable confidence in the mass estimates, which are based on fits to the SDSS spectra, we decided to only include those hosts where the goodness-of-fit value was .
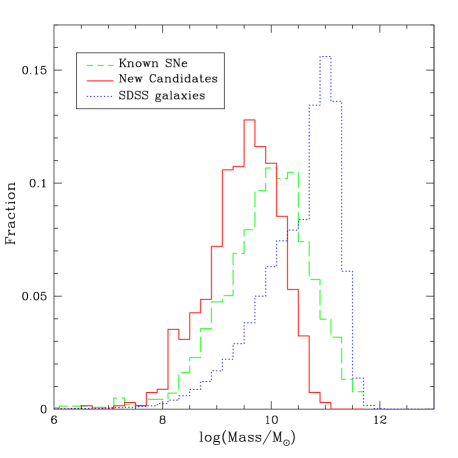
In Figure 15, we plot the host masses and star formation rates for the full sample of SDSS galaxies as well as those with previously known SN candidates and the new outbursts. Overall, we see that the new outbursts have lower mass hosts than the previously known candidates and the overall galaxy population. This effect is most likely due to the fact that the low-mass hosts are less luminous. Thus, the outbursts can be more easily detected. Additionally, as noted above, many low-mass hosts have high star formation rates.
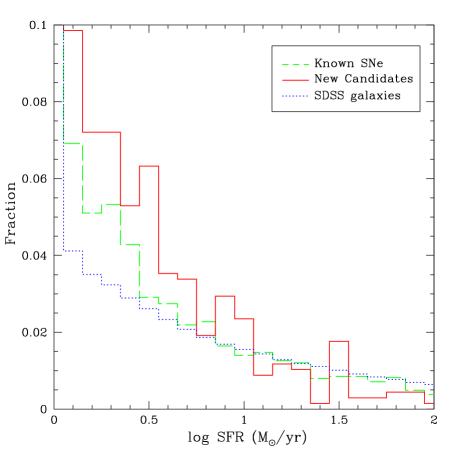
As expected, most of the galaxies in the full SDSS sample have low star formation rates. We see that the hosts of new outbursts and previously known SN candidates generally have higher rates than the full sample. This is consistent with the high fraction of events in starforming galaxies noted above. These starforming galaxies tend to have rates of 0.1 to 0.6 . Intriguingly, the fraction of galaxies with is the same for the full SDSS galaxy sample as for the hosts of known SN candidates (). It is not clear is this a real effect, or inaccurate star formation rates due to the presence of flux from contaminants (such as AGN).
6 Event Timescales
As noted earlier, the bulk of the new outbursts are almost certainly due to SNe. In cases where a new source is seen offset from the core of a galaxy, this is almost a certainty. However, strong evidence for the SN origin of the events also comes from their timescales.
For each outburst candidate we measured the timespan over which the event was continuously brighter than the median. Since the outbursts are not very well sampled in general, this provides only a rough estimate for the timescale for each event.
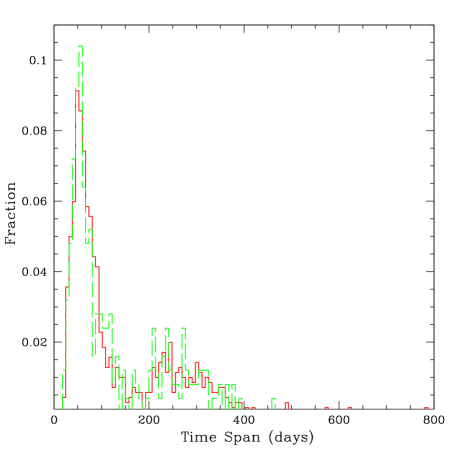
Figure 16 shows the distribution of outburst timescales along with the timescales for the previously known SN candidates that are present in the CSS photometry. Clearly, the two timescale distributions are an excellent match, and both are strongly peaked near a time span of 50 days.
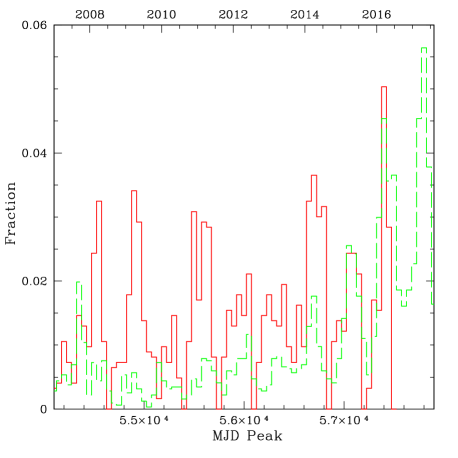
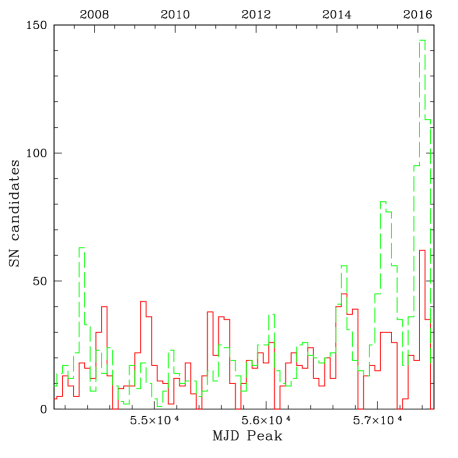
In Figure 17, we show the temporal distribution of event peaks for both previously known SN candidates and new outbursts. This figure shows that the new detections are generally clustered in time (due to the fact that the SDSS fields are only visible for part of the year). It also shows that the rate of SN discovery, in spectroscopically confirmed SDSS galaxies, has increased dramatically in over the past few years.
In general, we expect the true timespan of the events to be longer since sparse sampling and observing gaps evident in Figure 17 often cause the beginning or end of an event to be missed. In addition to the main peak, the timescale distributions exhibit a second broad feature.
The longest events in the timescale distributions are inconsistent with those of most common SNe. That is to say, regular SNe typically last for around one to two hundred days and have rise times of less than days. Longer timescale types of SNe consist of type II-Ps and type IIns. Type II-Ps are often detectable for a couple of hundred days (Li et al. 2011a), while in exceptional cases type-IIns can last for many years (Rest et al. 2011, Fox et al. 2015). However, both type-IIPs and long-timescale IIns have been found to comprise of SNe in the Li et al. (2011a) magnitude-limited SN sample, although II-Ps comprise 40% of SNe in a volume-limited sample (Li et al. 2011a). Note however that some of the outburst timescales are likely errant due to uncertain start and end times.
In contrast to our outburst candidates, Graham et al. (2017) found 51 large amplitude ( mag) outburst events with typical timescales of 900 days from a sample of 900,000 QSOs. In our analysis we only find a few long timescale events in our sample of 1.4 million galaxies. This strongly suggests a real difference in the number of long timescale events between normal galaxies and AGN, since only of our input galaxy sample are known AGN. Nevertheless, it is worth considering how other selection effects might caused a difference in the observed timescales.
For the bulk of events that occur in galaxies that lacking evidence for an AGN, it is unlikely that our selection process misses events lasting hundreds of days with amplitudes mags. This is because the scatter in the lightcurves is generally mags and most lightcurves span more than 3000 days. However, events lasting a few thousand days could be missed since the event itself would increase the photometric scatter and thus in increase the detection threshold. In the case of AGNs, events could also be missed due to the increased scatter from intrinsic variability. Searches based on lightcurve fits, such as carried out in Graham et al. (2017), are preferable for such sources.
7 MLS Sources
Of the 1.7 million SDSS DR13 galaxies with spectra and , 380,000 overlap with the Catalina MLS survey. Since MLS has a much smaller field-of-view than CSS, the coverage is sparse away from the ecliptic. Only about half (152,000) of the matches between MLS and SDSS have 20 or more nights of observations. Thus, the full sample of MLS-SDSS matches is only that of the CSS set.
Applying the same selection criteria as with the CSS data, we found 561 initial candidates. After inspecting the lightcurves, and removing the previously known SNe candidates, this number is significantly reduced to just 70 candidates. We then inspected 400 image cutouts associated with the peaks detected for these candidates. This reduced the number of MLS outburst candidates to just 38.
| ID | RA (J2000, deg) | Dec (deg) | length | Signif | log(P) | Nights | Quality | |||
|---|---|---|---|---|---|---|---|---|---|---|
| CRTS_OBM_1 | 0.8805 | 1.2243 | 19.39 | -17.90 | 55130.2 | 399 | 36.00 | -15.39 | 4 | Ib |
| CRTS_OBM_2 | 1.8685 | 0.7770 | 19.44 | -17.69 | 55090.4 | 68 | 17.20 | -12.66 | 5 | I |
| CRTS_OBM_3 | 19.3826 | 8.7039 | 20.87 | -17.07 | 54760.2 | 371 | 12.38 | -12.36 | 4 | I |
| CRTS_OBM_4 | 26.7793 | 13.9415 | 19.31 | -17.67 | 55486.2 | 367 | 33.27 | -9.75 | 3 | Ia |
| CRTS_OBM_5 | 116.1534 | 22.3044 | 19.93 | -17.98 | 55601.2 | 82 | 11.11 | -9.09 | 3 | Iab |
| CRTS_OBM_6 | 117.7806 | 16.6848 | 18.91 | -17.94 | 54833.5 | 89 | 18.66 | -16.28 | 6 | Ia |
| CRTS_OBM_7 | 118.4133 | 20.9226 | 19.97 | -18.73 | 56188.5 | 361 | 36.29 | -33.04 | 14 | Ib |
| CRTS_OBM_8 | 119.2773 | 21.2713 | 19.76 | -18.86 | 55578.3 | 38 | 18.23 | -16.68 | 5 | I a |
| CRTS_OBM_9 | 120.2549 | 21.1292 | 20.47 | -18.03 | 55602.2 | 37 | 12.00 | -9.31 | 3 | I ab |
| CRTS_OBM_10 | 122.5167 | 18.9427 | 19.68 | -16.78 | 55505.5 | 96 | 10.61 | -9.83 | 4 | I a |
| CRTS_OBM_11 | 128.4806 | 17.4051 | 20.12 | -18.18 | 56213.5 | 84 | 16.31 | -11.58 | 4 | I ab |
| CRTS_OBM_12 | 131.2395 | 19.1262 | 19.71 | -18.15 | 54138.3 | 245 | 24.55 | -12.04 | 4 | I a |
| CRTS_OBM_13 | 138.2021 | 15.4437 | 20.05 | -18.79 | 55988.2 | 78 | 13.32 | -10.97 | 4 | II |
| CRTS_OBM_14 | 141.8882 | 13.8358 | 20.07 | -17.44 | 55981.2 | 232 | 19.17 | -13.05 | 4 | Iab |
| CRTS_OBM_15 | 150.3220 | 15.1010 | 19.02 | -18.15 | 54530.3 | 300 | 16.77 | -12.00 | 3 | Ia |
| CRTS_OBM_16 | 151.7186 | 10.9784 | 19.72 | -19.09 | 56371.2 | 72 | 12.90 | -11.63 | 3 | Ia |
| CRTS_OBM_17 | 155.2287 | 9.8550 | 19.90 | -18.37 | 56297.5 | 42 | 8.72 | -8.80 | 3 | III |
| CRTS_OBM_18 | 159.5800 | 6.7474 | 18.71 | -18.67 | 54554.3 | 218 | 27.87 | -18.69 | 5 | Ia |
| CRTS_OBM_19 | 161.7155 | 6.6385 | 19.48 | -17.92 | 55893.5 | 272 | 17.92 | -10.21 | 4 | Ib |
| CRTS_OBM_20 | 167.8902 | 7.3996 | 19.74 | -17.37 | 55981.4 | 320 | 21.51 | -16.95 | 5 | Ia |
| CRTS_OBM_21 | 168.9025 | 5.7472 | 19.59 | -18.45 | 57162.2 | 440 | 25.57 | -21.65 | 10 | Ia |
| CRTS_OBM_22 | 170.8991 | 3.7309 | 21.08 | -20.62 | 55649.2 | 242 | 13.54 | -10.89 | 3 | II |
| CRTS_OBM_23 | 175.9182 | 1.5518 | 19.51 | -18.10 | 55648.3 | 61 | 13.04 | -11.72 | 3 | Iab |
| CRTS_OBM_24 | 177.7692 | 0.2482 | 19.03 | -17.52 | 54197.3 | 227 | 11.03 | -10.37 | 4 | Ia |
| CRTS_OBM_25 | 181.8560 | 0.8423 | 20.05 | -16.61 | 55327.2 | 301 | 41.73 | -12.00 | 3 | II |
Column 1: CRTS outburst candidate IDs.
Columns 2 and 3: Source coordinates.
Columns 4 and 5: Apparent and absolute magnitudes for the peak of the outburst, respectively.
Columns 6: MJD of the outburst peak.
Column 7: Timespan over which the candidate outburst was detected about .
Column 8: Total significance in sigma of the detections during the outburst timespan.
Column 9: Probability of false detection assuming normally distributed data.
Column 10: Number of nights when the outburst was detected above .
Column 11: An assessment of quality of the outburst candidate based the inspection of lightcurves and images as well as the presence of detections in CSS data. The values are as follows: — high confidence events, — moderate confidence events, — low confidence events.
a outburst is also detected in CSS observations.
b source is resolved from host galaxy.
c long timescale event.
The MLS data has much better resolution than CSS data since the original camera had pixels (compared to ). For 13 of the 38 outburst candidates we noted the presence of new source offset from the core of the host galaxy in the MLS images. These events are all likely to be SNe. Of the 38 candidates, 12 had already been found in our analysis of the CSS data. The remaining 25 new MLS candidates are presented in Table 4.
Since the CSS survey covers all of the area of MLS, we extracted and inspected the CSS lightcurves for each of the MLS outburst candidates. Among the 25 new MLS outbursts, 16 showed some brightening in CSS data taken during the event. Thus, these 16 events are all considered to be very strong outburst candidates. The other MLS candidates generally lacked good CSS coverage during the events.
As with CSS candidates, we extracted the lightcurves of all of the previously known SNe candidates in the MLS-SDSS sample. Inspecting the MLS lightcurves we found five events that were visible in the MLS data, yet missed initial selection due to low significance. Five more were missed since their lightcurves actually exhibited a decrease in flux during the outburst. This decrease is due to the aperture of the SN sequestering some of the host galaxy’s flux when it is detected as a separate source offset from the host.
Comparison of the rate of new outbursts per galaxy for the MLS data and CSS data shows that the rate for MLS is only half that of CSS. This difference is due to two factors. Firstly, the MLS data has far fewer observations per object on average than CSS. Specifically, during our analysis period the MLS dataset has an average of 43 nights of observations per galaxy, while CSS has 99. Secondly, the MLS has higher resolution and better average observed seeing than in CSS. Thus any SNe that are offset from their hosts are more likely to be detected as a new source in MLS data than in CSS data. This means that the MLS galaxy lightcurves are less likely to include the flux of an offset SNe.
8 Events of Interest
8.1 CRTS_OBC_204
Although almost all of the new outbursts detected in CSS and MLS are likely to be regular SNe, there are a few that clearly are not. One of the unusual events we discovered in our analysis is CRTS_OBC_204, occurring in the confirmed AGN containing galaxy SDSS J233454.07+145712.8.
The lightcurve for this galaxy is presented in Figure 18. The source exhibits a very strong outburst that appears to have taken days to reach a peak of (after subtracting flux from the galaxy) in mid-December 2009. Overall, this event appears to have lasted at least 1,700 rest frame days. The shape of the lightcurve is inconsistent with that of any known type of SN. However, the peak brightness is consistent with superluminous SNe. The host for this event is clearly extended in SDSS images.
A low signal-to-noise ratio () radio source is seen in the NVSS survey (Condon et al. 1998) at the location of the host. However, the flux appears extended and the source does not appear in the NVSS catalog. This suggests that the flux may simply be due to noise. Furthermore, no radio source is seen in VLSS (Perley et al. 2007) or TGSS survey data (Intema et al. 2017).
The lightcurve of CRTS_OBC_204 is similar to that of CRTS transient CSS120103:002748-055559, which was noted by Breedt, Gaensicke, & Parsons (2012) as being due to a blazar at . However, Breedt et al. (2012) based their blazar classification on the detection of broad lines and a radio detection in NVSS data. Our own analysis of NVSS data suggests that the significance of the radio detection is . Furthermore, CSS120103:002748-055559 does not appear in deeper FIRST survey radio data (Becker, White & Helfand 1995), nor in TGSS or VLSS radio data. We suggests that neither CRTS_OBC_204, nor CSS120103:002748-055559, are blazar outbursts. Rather they are flares from radio-quiet QSOs. The lightcurve of CRTS_OBC_204 also resembles the QSO flares found by Graham et al. (2017).
We obtained follow-up spectra of CRTS_OBC_204 with the Palomar 5m and Double Beam Spectrograph (DBSP) on UT 2017 July 27 and 2017 August 29. The new spectra were not significantly different from the original SDSS spectrum. However, since our spectra were both taken many years after the peak of the event, when the source appears to have returned to quiescence, this is not unexpected.
While this paper was in preparation CRTS_OBC_204 was identified as a potential AGN flare by Kankare et al. (2017) based on the shorter lightcurves available in our public CSDR2 release.
8.2 CRTS_OBC_62
In Figure 19, we present the lightcurve of the long-timescale outburst candidate CRTS_OBC_62 (15:45:43.55, 08:58:01.3 J2000). This event was found in known Lyman alpha emitting blue dwarf galaxy 1543+091 (Meier & Terlevich 1981). As with CRTS_OBC_204, after peak this event initially fades and then rises again slightly to form a plateau that lasts for hundreds of days.
Interestingly, Izotov, Thuan & Privon (2012) noted that the host galaxy displays the presence of and which they attribute to hard ionizing radiation. They also note that, although the spectrum shows the presence of , it lacks the bump signature associated with Wolf-Reyet (WR) stars. They suggest that the source of the hard radiation is either an AGN or fast radiative shocks, such as caused by SNe.
Sartori et al. (2015) selected this galaxy as a very rare ( of their 50,000 galaxy sample) example of an AGN in a low mass galaxy () based on mid-IR data. However, Senchya et al. (2017) suggest that such hard-ionizing spectral features with the lack of a WR bump are consistent with massive O-stars in a low metallicity environment (as is observed in 1543+091). Given the unclear nature of both the event and the galaxy, this object is worthy of further study.
8.3 Other interesting events
A number of the new outburst candidates in this analysis were found in the same hosts as previously known SN candidates. For example, CRTS_OBC_9 is a long event that occurred in 2007 and resides in the same galaxy that hosted SN candidate AT2016gbz. Likewise, CRTS_OBC_324 occurred in the galaxy that hosted AT2017io. CRTS_OBC_331 occurred in the same galaxy as SN 1955Q, and CRTS_OBC_127 occurred in the galaxy that hosted SN 2017me. The occurrence of multiple SN within the same host is not unexpected since there are many examples of active SN hosts. For example, five SNe were detected in NGC 309 over the span of 15 years******http://www.rochesterastronomy.org/snimages/snhnameall.html.
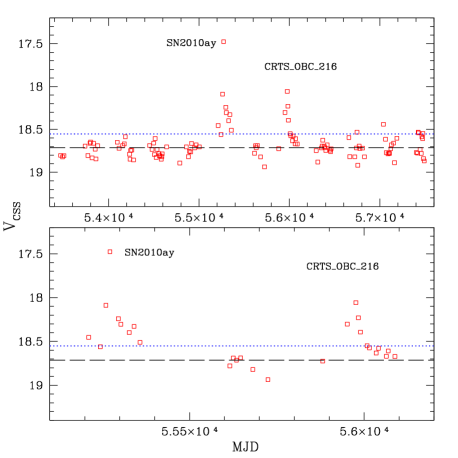
One of the more interesting outburst candidates is CRTS_OBC_216 (Figure 20). This event occurred in the same host galaxy as known SN 2010ay. SN 2010ay was a rare broad line type-Ic SN discovered by CRTS (Drake et al. 2010). Such SN have long been known to be associated with long-timescale Gamma Ray Bursts (GRBs, Galama et al. 1998). In this case, the host galaxy has low metallicity and exhibits rapid star formation. These features have also been observed for many GRB-associated SN (Modjaz et al. 2010). However, SN 2010ay was noteworthy for lacking any radio or -ray emission (Sanders et al. 2012). The CSS lightcurve shows that SN 2010ay is seen to peak in CSS data around UT 2010 March 17, while CRTS_OBC_216 occurred just two years later. Surprisingly, this second event was not noted by transient surveys or groups performing follow-up of SN 2010ay.
Inspection of the SDSS images for this galaxy shows minimal extension. The locations of the two events are not resolved from each other, nor from the core of the host in CSS images. Thus, it is not clear whether or not the two events are related.
9 Discussion
9.1 Supernovae as a source of outbursts
The new outburst candidates that we have identified are predominantly consistent with SNe based on their lightcurve shapes and timescales. In some cases this is confirmed by the presence of a new source within the images. The host galaxies of the outburst candidates are predominantly starforming galaxies. This latter feature also matches the hosts of most previously discovered SN candidates in this same sample. Very few of the new outbursts are detected in galaxies with known AGN, suggesting few are likely to be associated with variable black hole accretion.
In comparison to this work, Graur et al. (2015) found 91 SN in the SDSS spectra of 740,000 galaxies. Among their detections only 23 SN were new discoveries. Additionally, Drake et al. (2014) serendipitously discovered 42 likely SNe from lightcurves while searching for periodic variables in CSS data. Of those, only six were in galaxies having SDSS spectra. Assuming that the fraction new SNe in galaxies from Drake et al. (2014) is representative of the fraction of the full sample, we expect that there should be roughly six times as many outbursts (4,200) in CSS galaxies photometry without SDSS spectra. This number is close to the total number of SN candidates that have been discovered by CRTS. Thus, a very large number of additional outbursts should be present within the CSS data. Additionally, it is likely that the number of detections could be increased by using image subtraction.
Considering what could be learnt from our new outburst candidates, we note that Kelly & Kirshner (2012) studied a sample of 519 nearby CCSNe with SDSS spectra. They suggested that there was evidence for differences in the metallicity, the rate of star formation and host offset between the different types of CCSNe. Such an analysis is not possible with most of the new outbursts since in most cases the events are not well enough sampled for type classification. However, the presence of these new likely-SNe in galaxies shows that the Kelly & Kirshner (2012) sample was incomplete. The events missing from the Kelly & Kirshner (2012) could well change their conclusions. For example, since most events are not clearly offset from their hosts in CSS images, we expect many of the new events are near the cores of their hosts. These events could clearly affect the distribution of SN offsets from their hosts.
Our discovery of new likely-SNe near galaxy nuclei is not surprising. Past SN surveys are well known to miss SNe occurring within the cores of galaxies. The main reasons for this are the higher detection threshold required (due to surface brightness generally being higher), and the expectation that events occurring in galaxy cores could be due to AGN activity. This AGN bias is compounded by the increased difficulty of extracting faint SN spectra in the vicinity of a bright nuclear core.
Although our analysis has selected hundreds of new outburst candidates it is quite likely that additional candidates could be found via a model fitting process –for example, by searching for events fitting SN templates. However, as Li et al. (2011a) note, no type of SN can be well represented by a single lightcurve. Thus, the combination of poorly sampled lightcurves, and a lack of colour information means that template fitting is unlikely to constrain the types for most of the candidates.
9.2 AGN as an outburst source
In our current analysis we specifically chose an outburst search technique that was model-free in order to minimize assumptions about the form the outbursts might take. In comparison to recent outbursts found in the Catalina lightcurves of QSOs (Graham et al. 2017), the hosts of our outbursts generally do not exhibit underlying variability. This makes the interpretation of our outbursts clearer than in the case of those with AGN. Furthermore, this enables us to use a much lower effective detection threshold than Graham et al. (2017), or the searches of Lawrence et al. (2016) and Kankare et al. (2017).
With this in mind, it is interesting to note that we only find evidence for large-amplitude long-timescale flares in a small number of galaxies that clearly include AGN. The general lack of such events in quiescent galaxies strongly suggests that the events that have been found in AGN are in some way associated with the presence of a SMBH and associated accretion disk. Nevertheless, we cannot strongly constrain whether the AGN-related events in Lawrence et al. (2016) and Graham et al.(2017) are in fact lensed by sources in foreground galaxies. The results do suggest that, if the flares seen in AGN are associated with luminous SNe, as suggested for CSS100217 (Drake et al. 2012) and PS16dtm (Blanchard et al. 2017) which both reside in NLS1 galaxies, they could well be associated with the black hole accretion disk.
9.3 TDEs as an outburst source
With the large number of new outburst candidates, it is worth considering the possibility that some of the events are associated with TDEs. TDEs were originally predicted to characteristically decline with time as (Evans & Kochanek 1989). However, more recently, widely varying estimates of the decline rate have been suggested (for example, see Lodato & Rossi 2011). The current data for TDE candidates show that they do indeed exhibit a wide range of decline timescales (Auchettl et al. 2017). Thus, the sparsely sampled CSS lightcurves are far from ideal for separating TDEs with poorly constrained decline rates from SNe that are also well known to have diverse decline rates.
Considering other methods for identifying TDEs, Hung et al. (2017) recently undertook an analysis of iPTF data observed as part of their TDE search. In their work they suggested that high precision astrometry is essential for finding TDEs, their reasoning being that type-Ia SNe have similar colours and are far more common than TDEs (even within the cores of galaxies, i.e. from the center). However, we note that a truly definitive separation requires optical spectra and ideally an X-ray signature. The spectroscopic signature of TDEs is predominately considered to be the presence of strong, broad helium lines (Gezari et al. 2012).
In their survey, Hung et al. (2017) required outbursts reaching a threshold of mag. This is a higher threshold than many of the events we have found in this analysis. We note that both our work and the Hung et al. (2017) TDE survey are necessarily biased against the discovery of events in intrinsically bright galaxies.
Unlike our current analysis, Hung et al. (2017) concentrated their analysis solely on red galaxies. They reasoned that most known TDEs have so far been found is such galaxies. However, it seems likely that this is at least partly due to the fact that prior searches included a strong selection bias against other types of galaxies. That is to say, like SN surveys, many past searches for TDEs specifically avoid galaxies where an AGN might be present due to the difficulty of disentangling the signature of a TDE from an AGN. Thus galaxies with blue continua (due to the presence of AGN or star formation), are under represented in the search samples. Indeed, Blanchard et al. (2017) suggest that AGN flares may be due to TDEs, and that these may be more common in AGN than previously believed. In addition, Tadhunter et al. (2017) suggest that the rate of TDEs in ultra-luminous infrared galaxies may be much higher than in normal galaxies. Indeed, the numerous flaring events that have recently been found within AGN (Drake et al. 2011, Lawrence et al. 2016, Graham et al. 2017, Blanchard et al. 2017) appear to be roughly consistent with a TDE origin. On the other hand, Lawrence et al. (2016) suggests, the amount of energy released by a TDE is far less than seen in many of the observed AGN flaring events.
Overall, it is possible that some of the new outbursts are due to TDEs. In particular, CRTS_OBC_204 is clearly not a regular SN, and occurred within a host containing an AGN. However, since predicted TDE rates are so much lower than SN rates, we do not expect many of the outbursts to be due to TDEs.
9.4 Considerations for the future
As we look forward to larger transient surveys that are coming (such as ZTF and LSST), we expect an ever growing number of transient discoveries. As with current surveys, a very large fraction of the transients will undoubtedly be SNe. It is therefore worth considering what may be learnt from such objects when there are already far more SN being discovered than can be spectroscopically confirmed.
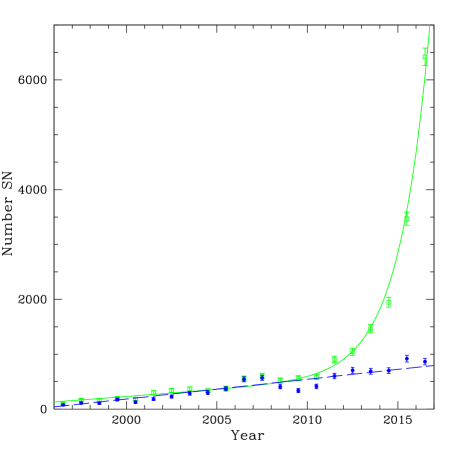
In Figure 21, we plot the number of discovered SN candidates and the number of confirmed SN over the past 22 years. Encouragingly, this figure shows that the amount of SN follow-up has increased at an approximately linear rate over this time. However, in contrast, the SN candidate discovery rate appears well modeled by an exponential increase in addition to the linear confirmation-rate trend.
Examining the SN confirmation data we find that the shortfall in SN confirmation is highly magnitude dependent. Specifically, based on historical SN data, only 10 to 20% of the SN discovered since 1950 with have been spectroscopically confirmed, while roughly 80% of SN candidates brighter than have been spectroscopically confirmed.
In the near term, surveys such as ZTF and LSST will almost certainly increase the SN discovery trend by introducing many more transients with luminosities that have not been historically followed. The very faint events discovered by LSST will be particularly difficult to confirm spectroscopically. Characterisation will be further hindered by the fact that LSST lightcurves will not be as well sampled as many existing transient surveys. For brighter events, it is possible to mitigate the follow-up problem to some extent by using historical information. However, a better understanding of fainter events should also make use of the data for the tens of thousands of brighter transients that have been already been found by existing transient surveys. These should be used to glean a fuller understanding of the event parameter space.
As new transients are discovered in future surveys, the existence of better sampled lightcurves and colour information (in the case of ZTF), combined with accurate astrometry (from Gaia), will undoubtedly aid our ability to classify optical transients. Nevertheless, a significant amount of additional characterization work is required now since spectroscopic follow-up resources are unlikely to have a significant impact on the overall fraction of characterised events. Classification and follow-up also remain crucial for determining the nature of long timescale AGN-associated events as well as other very rare types of transients such as GW170817 (Abbott et al. 2017) and 2018cow (Perley et al. 2018).
10 Summary
In this work we have taken a step towards understanding the types of extra galactic transients that were missed by existing transient surveys. We used lightcurves from the Catalina Surveys to find them, and archival spectra to help characterise their hosts.
The main discovery of this work has been the discovery of more than 700 new outbursts among more than 1.4 million spectroscopically confirmed SDSS galaxies. As expected, we find that most of these events are consistent with SNe. However, we cannot exclude the presence of rare transient types since specific classifications are only possible for a small number of the sources. Nevertheless, we find a small number of long timescale events that are associated with galaxies containing AGN. These outbursts appear relatively consistent with the events discovered in AGN-containing galaxies by Lawrence et al. (2016) and Graham et al. (2017). Importantly, we do not find these long-timescale events among the of galaxies in our sample that lack a significant evidence of AGN. This strongly suggests that the long timescale events are in some way associated with AGN. As yet we are unable to determine whether the source of the long outbursts are intrinsic to AGN or their environment, or are due to an extrinsic effect such as microlensing of the AGN.
Acknowledgments
CRTS, CSDR1 and CSDR2 are supported by the U.S. National Science Foundation under grant NSF grants AST-1313422, AST-1413600, and AST-1518308. The CSS survey is funded by the National Aeronautics and Space Administration under Grant No. NNG05GF22G issued through the Science Mission Directorate Near-Earth Objects Observations Program. AJD and MC acknowledge partial support by CONICYT’s PCI program through grant DPI20140066. MC is additionally supported by the Ministry for the Economy, Development, and Tourism’s Iniciativa Científica Milenio through grant IC 120009, awarded to the Millennium Institute of Astrophysics; by Proyecto Fondecyt Regular #1171273; and by Proyecto Basal PFB-06/2007. AllWISE makes use of data from WISE, which is a joint project of the University of California, Los Angeles, and the Jet Propulsion Laboratory/California Institute of Technology, and NEOWISE, which is a project of the Jet Propulsion Laboratory/California Institute of Technology. WISE and NEOWISE are funded by the National Aeronautics and Space Administration.
References
- [] Abbott B.P., et al. 2017, Phys. Rev. Lett. 119, 161101
- [] Albareti F.D. et al., 2017, ApJS, 233, 25,
- [] Auchettl K., Guillochon J., Ramirez-Ruiz E., 2017, ApJ, 838, 149
- [] Becker R.H., White R.L., Helfand D.J., 1995, ApJ, 450, 559
- [] Bellm E.C., in proceedings of the Third Hot-Wiring the Transient Universe Workshop, ed. P.R. Wozniak et al., p. 27 (arXiv:1410.8185)
- [] Bertin E., Arnouts S., 1996, A&AS, 117, 393
- [] Blanchard P.K. et al., 2017, ApJ, 843, 106
- [] Bolton A.S. et al., AJ, 2012, 144, 20
- [] Breedt E., Gaensicke B.T., Parsons S.G. ATel, 2012, 4606
- [] Cappellaro E., Evans R., Turatto M., 1999, A&A, 351, 459
- [] Chambers K.C. et al., 2016, arXiv:1612.05560
- [] Condon J.J., Cotton W.D., Greisen E.W., Yin Q.F., Perley R.A., Taylor G.B., Broderick, J.J., 1998, AJ, 115, 1693
- [] Dawson K.S. et al., 2013, AJ, 145, 10
- [] Dawson K.S. et al., 2016, AJ, 151, 44
- [] Drake A.J. et al., 2009, ApJ, 696, 870
- [] Drake A.J. et al., 2010, CBET, 2224, 1
- [] Drake A.J. et al., 2011a, ApJ, 705, 136
- [] Drake A.J. et al., 2011b, ATel, 3118
- [] Drake A.J. et al., 2013, ApJ, 763, 32
- [] Drake A.J. et al., 2014, ApJS, 213, 9
- [] Djorgovski, S.G. et al., 2012, in The First Year of MAXI: Monitoring Variable X-ray Sources. Mihara T. & Serino M., eds. Special Publ. IPCR-127, 263. Tokyo:RIKEN.
- [] Evans, C.R., & Kochanek, C. S. 1989, ApJL, 346, L13
- [] Fox O.D. et al., MNRAS, 2015, 454, 4366
- [] Galama, T.J. et al., 1998, Nature, 395, 670
- [] Gal-Yam A., Mazzali P., Manulis I., Bishop D. 2013, PASP, 125, 749
- [] Gezari S. et al., 2012, Nature, 485, 217
- [] Gezari S. et al., 2017, ApJ, 835, 144
- [] Goodrich R.W., 1989, ApJ, 340, 190
- [] Graham M.J., Djorgovski S.G, Drake, A.J., Stern D., Mahabal A.A., 2017, MNRAS, 470, 4112
- [] Holoien T.W.-S. et al., 2015, MNRAS, 455, 2918
- [] Huang S., Haynes M.P., Giovanelli R., Brinchmann J., Stierwalt S., Neff S.G., 2012, AJ, 143, 133
- [] Hung T. et al., 2017, arXiv:1712.04936
- [] Intema H.T., Jagannathan P., Mooley K.P., Frail D.A., 2017, A&A, 598, 78
- [] Ivezic Z. et al., 2008, arXiv:0805.2366
- [] Izotov Y.I., Thuan T.X., Privon G. 2012, MNRAS, 427, 1229
- [] Kankare E. et al., 2017, Nature Astronomy, 1, 865
- [] Kelly B.C., Bechtold, J., Siemiginowska A., 2009, ApJ, 698, 895
- [] Kelly P.L., Kirshner R.P., ApJ, 2012, 759, 107
- [] Kewley L.J., Groves, B., Kauffmann G., Heckman T., 2006, MNRAS, 372, 961.
- [] Koss M. et al., 2017, ApJ, 850, 74
- [] Kormendy J., 1985, ApJ, 295, 73
- [] LaMassa, S.M. et al. 2015, ApJ, 800, 144
- [] Larson S., et al. 2003, DPS, 35, 3604
- [] Law N.M., Kulkarni S.R., Dekany R.G., Ofek, E.O., Quimby, R.M., 2009, PASP, 121, 1395
- [] Lawrence A., Bruce A.G, MacLeod C., Gezari S., Elvis M., et al. 2016, MNRAS 463, 296
- [] Li W., et al. 2011a, MNRAS, 412, 1441
- [] Li W., et al. 2011b, MNRAS, 412, 1473
- [] Lodato, G., & Rossi, E. M. 2011, MNRAS, 410, 359
- [] MacLeod C.L. et al., 2012, ApJ, 753, 106
- [] MacLeod C.L. et al., 2016, MNRAS, 457, 389
- [] Maraston C., Daddi E., Renzini A., Cimatti A., Dickinson M., Papovich C., Pasquali A., Pirzkal N., 2006, ApJ, 652, 85
- [] Meier D. L., & Terlevich R. 1981, ApJ, 246, 109
- [] Meusinger H., et al. 2010, A&A, 512, 1
- [] Modjaz M., Filippenko A.V., Silverman J.M., Kleiser I.K.W., Morton A.J.L., 2010, ATel, 2503
- [] Osterbrock, D.E., Shuder, J.M. 1982, ApJS, 49, 149O
- [] Perley D.A., et al. 2018, MNRAS, submitted
- [] Perley R.A., Condon J.J., Cotton W.D., Cohen A.S., Lane W.M., Kassim N.E., Lazio T.J.W., Erickson W.C. 2007, AJ, 134, 1245
- [] Petrosian A. et al., 2005, AJ, 129, 1369
- [] Rees M.J., 1988, Nature, 333, 523
- [] Rest A. et al., ApJ, 2011, 729, 88
- [] Richardson D., Branch D., Casebeer D., Millard J., Thomas R.C., Baron E., 2002, AJ, 123, 745
- [] Sandage A., Tammann G.A., 2006, ARA&A, 44, 93
- [] Sanders N.E. et al., 2012, ApJ, 756, 184
- [] Sartori, L.F. et al. 2015, MNRAS, 454, 3722
- [] Schlegel, D.J., Finkbeiner, D.P., Davis M., 1998, ApJ, 500, 525
- [] Schneider D.P. et al., 2010, AJ, 139, 2360
- [] Secrest N.J., Dudik R.P., Dorland B.N., Zacharias N., Makarov V., Fey A., Frouard J., Finch C., 2015, ApJS, 221, 12
- [] Senchta P. et al. 2017, MNRAS, 472, 2608
- [] Smartt S. et al., 2015, A&A, 579, 40
- [] Smith, N., Chornock R., Silverman J.M., Filippenko A.V., Foley R.J. 2010, ApJ, 709, 856
- [] Stern D., et al. 2017, ApJ, 839, 106
- [] Stern D., et al. 2018, MNRAS, in press
- [] Strauss M.A. et al., 2002, AJ, 124, 1810
- [] Tadhunter C.N., Spence R., Rose, M., Mullaney J., Crowther P., Nature Astronomy, 1, 61
- [] Thomas D. et al., 2013, MNRAS, 431, 1383
- [] Tohline, J.E., Osterbrock, D.E. 1976, ApJL, 210, 117
- [] van den Bergh S., Tammann G.A., 1991, ARA&A, 29, 363
- [] Williams R. et al. 2008, ATel, 1856
- [] York D.G. et al., 2000, AJ, 120, 1579