Extreme background-rejection techniques for the ELROI optical satellite license plate
Abstract
The Extremely Low-Resource Optical Identifier (ELROI) is a concept for an autonomous, low-power optical “license plate” that can be attached to anything that goes into space. ELROI uses short, omnidirectional flashes of laser light to encode a unique ID number which can be read by a small ground telescope using a photon-counting sensor and innovative extreme background-rejection techniques. ELROI is smaller and lighter than a typical radio beacon, low-power enough to run on its own small solar cell, and can safely operate for the entire orbital lifetime of a satellite or debris object. The concept has been validated in ground tests, and orbital prototypes are scheduled for launch in 2018 and beyond. In this paper we focus on the details of the encoding scheme and data analysis that allow a milliwatt optical signal to be read from orbit. We describe the techniques of extreme background-rejection needed to achieve this, including spectral and temporal filtering, and discuss the requirements for an error-correcting code to encode the ID number. Worked examples with both simulated and experimental (ground test) data will illustrate the methods used. We present these techniques to describe a new photon-counting optical communication concept, and to encourage others to consider observing upcoming test flights.
I Introduction
The Extremely Low-Resource Optical Identifier (ELROI) is a low-power optical “license plate” that can be attached to anything that goes into space Palmer and Holmes (2018); Palmer (2016, 2015). ELROI is designed to help address the problem of space object identification (SOI) in the crowded space around the Earth, where over 19,000 objects—from active satellites to debris fragments—are currently tracked and monitored spa (2017). Tracking these objects is a multi-billion USD effort, and requires continuous knowledge of each object’s position and trajectory. Sudden orbit changes or interruption in tracking can lead to confusion about a tracked object’s identity, and multiple costly observations may be needed to re-identify it as a known satellite. SOI is easier if a satellite carries a continuous identifying beacon that can be read by anyone on the ground, but no suitable standard technology is currently used for this purpose IAD (2017); Peterson, Sorge, and Ailor (2018). ELROI is a new optical SOI technology which is currently at the prototype stage (Figure 1). The concept has been validated in ground tests Palmer and Holmes (2018), and orbital prototypes are scheduled for launch in late 2018 and beyond.
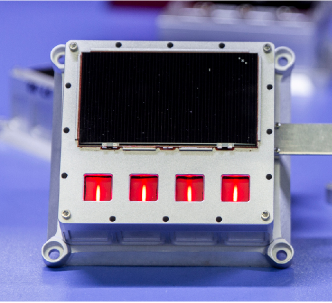
ELROI is an autonomous solar-powered optical beacon that uses short, diffused flashes of laser light at milliwatt average power to encode a unique ID number, which can be read by a small ground telescope during local night using a photon-counting sensor and innovative extreme background-rejection techniques. ELROI is smaller and lighter than a typical radio beacon, suitable for small satellites including CubeSats, and can safely operate for the entire orbital lifetime of a satellite without concern for radio-frequency interference (RFI). Autonomous solar power also allows ELROI to continue emitting after the end of a satellite’s operational lifetime, and makes ELROI suitable for non-powered debris objects such as rocket bodies. Space object identification is generally more challenging than tracking with current technology, and ELROI is designed to address the problem of objects that are tracked but not identified; thus, reading the ELROI ID number requires tracking information for the host satellite (such as the publicly available and regularly updated data in the SpaceTrack catalog spa (2017)).
This paper is not a comprehensive overview of the ELROI system, and additional details about the beacon hardware, ground station designs, link budgets, and the concept of operations may be found in Palmer and Holmes (2018). Here, we focus on the details of the encoding scheme and data analysis that allow a milliwatt optical signal to be read from orbit. We will describe the techniques of extreme background-rejection needed to achieve this, including spectral filtering and temporal filtering using a period- and phase-recovery algorithm, and discuss the requirements for an error-correcting code to encode the ID number. Worked examples with both simulated and experimental (long-range ground test) data will illustrate the methods used.
We encourage others to consider observing our test flights. Details about current flight prototypes, as well as practical considerations and necessary equipment for those interested in observing ELROI test flights from their own ground stations, may be found in Holmes et al. (2018).
I.1 Characteristics of the ELROI signal
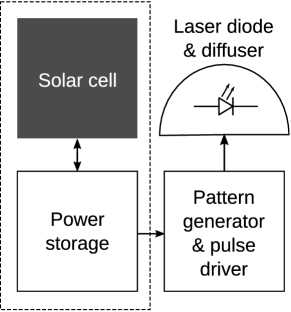
ELROI uses short, bright flashes of laser light at a fixed period to encode a unique binary ID number with an on-off keying (OOK) scheme (Figure 2). The approach builds on photon-counting laser optical communications techniques Farrell (2018a, b); Mendenhall et al. (2007); Boroson, Biswas, and Edwards (2004), but in a novel operating regime at much lower power, very low bandwidth, and without strict pointing requirements due to the very broad optical beam. The ID number repeats many times per second. The laser light is nearly monochromatic, with a spectral range of about 1 nm. The peak power of the laser is high ( 1 watt), but it is pulsed at a low duty cycle so that the average power is reduced to a few milliwatts.
This low average power requirement is essential for autonomous solar-powered operation in space, and allows the beacon to be “low-resource” in size and mass. Light from the beacon is diffused over a wide angle—approximately 145 degrees for current prototypes—to increase visibility from the ground without active pointing. At orbital distances, this combination of low optical power and large solid angle results in an extremely weak signal at a ground station. Link budget calculations for a typical design indicate that a ground station will detect 3-4 signal photons/s from a 2-mW ELROI beacon in low-Earth orbit (LEO) at 1000 km range Palmer and Holmes (2018). This is far below the 90 photons/s of background light (at the beacon wavelength) expected from a small sunlit CubeSat host. However, the spectral and timing characteristics of the signal enable extreme background-rejection techniques, introduced in Section I.2, which allow the beacon ID to be read reliably after a few minutes of accumulating data—i.e., in a single pass over a ground station for a typical LEO orbit.
Reading an ELROI ID requires a photon-counting sensor, such as a single-photon avalanche diode (SPAD) or photomultiplier. The sensor must, at minimum, register discrete signals for each detected photon with timing resolution better than the pulse width . (Due to read noise, conventional CCD or CMOS detectors are not suitable.) The sensor must receive light from a telescope, which may be relatively small, but must be able to accurately and precisely track objects across the sky. An imaging or position-sensitive detector is useful to reduce the pointing and tracking tolerance requirements on the ground station telescope, and our current ground station uses a LANL-developed photon-counting camera which combines a photocathode, microchannel plate (MCP), and multi-anode readout Thompson (2013). However, an imaging sensor is not required to read the ELROI ID. Further discussion of the design trade-offs between sensor, ground station, and beacon may be found in Palmer and Holmes (2018) and Holmes et al. (2018).
The data recorded from the ground station is a list of photon detection times. Some of these times correspond to signal photons, and many more are background photons, either from the environment or from noise in the sensor. The goal of data analysis is to isolate enough of the signal photons to determine the value of each ID bit with sufficient confidence to recover the ID number. Each step in this analysis can be done efficiently, so that a satellite can be identified in real time as it is tracked over the ground station.
I.2 Background rejection
The critical characteristics of the ELROI signal that enable extreme background rejection are the narrow spectral range of the laser light, the precise timing of the signal clock period, and the high peak power and narrow width of the signal pulses relative to the clock period.
I.2.1 Spectral filtering
The narrow spectral range of the beacon light allows most environmental background photons to be blocked with a narrow-band optical filter. Current prototypes use 638-nm laser diodes with a spectral width of less than 1 nm. (This wavelength was chosen to match the sensitivity of the LANL photon-counting camera; other wavelengths, particularly near-IR, may be more appropriate for future designs.) For an orbital beacon, the majority of background photons are sunlight reflected from the host satellite, with some sky background depending on environmental conditions (particularly moon phase) and tracking accuracy. A 10-nm filter centered at 638 nm blocks about 99% of reflected sunlight. The filter bandwidth is a compromise between background transmission and tolerance for thermal shifts in the central wavelength of the beacon. Spectral filtering is an important part of the ELROI system, but the rest of this paper will focus on background rejection in data analysis after spectrally filtered photons have been detected. All background photon rates will be assumed to be measured after appropriate spectral filtering.
I.2.2 Phase cut
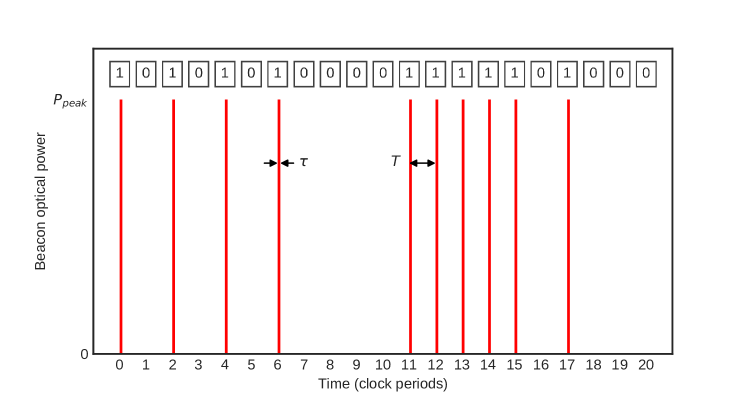
Because the ELROI signal consists of short, bright pulses that are clocked at a fixed period, all the signal photons are detected within short, precisely spaced time windows (recall Figure 2). The phase of signal photons in the range of [0,1) clock cycles is restricted to a narrow peak with width (Figure 3). In contrast, background photons are detected at random times. Thus, if the clock period is known, a phase cut can be used to reject any photons outside this narrow phase peak. This is analogous to “lock-in” detection methods. The phase cut reduces background counts by a factor of , which is between 1/1000 and 2/500 for typical signals. This is the advantage of using short pulses relative to the clock period.
Ignoring out-of-phase data is common in optical communications, but the ELROI data analysis requires much more accurate knowledge of the clock period than typical high-power applications where transitions between 0 and 1 bits can be used to continuously synchronize the receiver clock to the emitter. In the simple example of Section II, we will assume that the clock period is known to arbitrary precision. In practice, even if the nominal clock period is known, temperature variations and the tolerance of the beacon on-board clock will lead to small deviations from the nominal value, and even drift over time. To achieve full sensitivity, the true clock period must be recovered from the data to an accuracy of a few parts per million. This is possible for ELROI because an entire 2-3 minute observation can be used to determine the clock period in post-processing, with latency still short compared to the observation length. Efficient methods for clock detection and recovery are discussed in the more realistic example of Section III.
I.3 Decoding the ID number
A typical ELROI beacon will repeat its ID number 5-10 times per second, so an observation spanning several minutes contains many repetitions of the ID number. The data from each repetition must be combined to get the best estimate of the ID bit values. Thus, after out-of-phase background photons are removed with a phase cut, the remaining photon detection times are “folded” by the known ID length: the time data is divided into windows the length of the ID (the number of bits ), these windows are summed, and the result is binned by the clock period to get the total number of photons corresponding to each expected ID bit.
These photon detection totals must then be used to assign a 1 or 0 value to each bit to recover the ID. The bit value assignment must account for the fact that some background photons will remain even after the phase cut, so 0 bits may contain photons. The number of photons detected for 1 bits will also fluctuate significantly with Poisson statistics (shot noise), due to the very low signal count rate from orbit and the limited time available to accumulate photons during one pass over a ground station. Background is expected to be independent and identically distributed (i.i.d.) over short times. In most cases, the photon numbers of 1 and 0 bits will form clearly separate distributions, and a simple threshold procedure can be used to separate them (hard decision decoding). The hard decision method can also be extended to cases with poorer signal-to-noise ratios. The examples in this paper will use a hard decision method, but other possibilities are briefly discussed in Section V.
Error-checking and correction codes
Particularly for observations with very few signal photons, it is expected that some bits will be assigned the wrong value, and the recovered ID number may not exactly match the true ID. To provide tolerance for incorrect bits, an error-correcting code is used to generate the ID numbers. Error-checking and correction (ECC) codes are a proven strategy in modern digital communications, and can provide codeword error rates (the probability of incorrectly identifying an ID) orders of magnitude lower than the bit error rate (the probability of incorrectly identifying a bit). The error-correcting code used for ELROI restricts the ID numbers to a minimum Hamming distance from any other ID, so that up to some threshold number of bit errors, a single true ID will be significantly closer to the recovered ID than any other possible IDHamming (1950). Thus, the final step in reading an ELROI ID is to search the database of all active ID numbers for the ID with the fewest number of errors relative to the recovered ID.
For the examples in this paper, we use constant-weight 64-of-128-bit codes allowing cyclic permutation: the ID numbers are 128 bits long, 64 bits are 1 and 64 bits are 0, and two IDs that differ only by moving some bits from the start of the ID to the end of the ID are considered to be the same ID. The possible IDs are chosen such that any pair of IDs differs by at least 24 bits, which allows for millions of unique IDs while guaranteeing that up to 12 incorrect bits can be corrected. Because the start bit of the recovered ID is not known, it must be compared to each ID in the database with each of shifts, where is the number of bits in the code; however, the search can still be done quickly compared to the length of the observation. (While this example ECC scheme does not indicate the start bit of the ID number, other schemes can do so.) This scheme is sufficient to demonstrate the value of error-correcting codes for ELROI, and will be used on the current generation of orbital prototypes. There are several options for refining the final ECC code strategy for ELROI, but these are beyond the scope of this paper and are summarized only briefly in Section V.
II Example: Decoding simulated data
| Parameter | Value | |
|---|---|---|
| ID number (hexadecimal) | 0x8345f3ca6ca6f0e338f5d598e525a912 | |
| ID length | 128 bits | |
| Pulse width | 1 s | |
| Clock period | 1 ms | |
| Average signal photon rate | 5 photons/s (detected) | |
| Average background photon rate | 100 photon/s (detected) | |
| Clock phase | 0.50 cycles | |
| ID start bit | 10 | |
| Dataset length | 180 s |
This example will analyze a simulated ELROI dataset with signal and background photon rates comparable to a beacon in LEO. The simulation uses typical beacon signal characteristics (Table 1), and models a detector similar to the LANL photon-counting camera.
A three-minute simulated dataset was generated with a Monte Carlo method. The data is a list of simulated photon detection timestamps, and contains timestamps total, corresponding to signal photons from a beacon (spread over 180,000 pulses) and random background photons. The background photon rate is assumed to be detected after spectral filtering. Photon detection timestamps were generated to a resolution of 1 ns.
II.1 Phase cut
To apply the phase cut, we first compute the fractional phase of each photon in the dataset, relative to the clock period:
| (1) |
where is the time at which the photon was detected, is the clock period, and
| (2) |
is the fractional part function. is in the range [0,1) and has units of cycles. (In this example we have assumed the clock period is known exactly. The next example in Section III will demonstrate the more realistic process of determining the clock period from the data.)
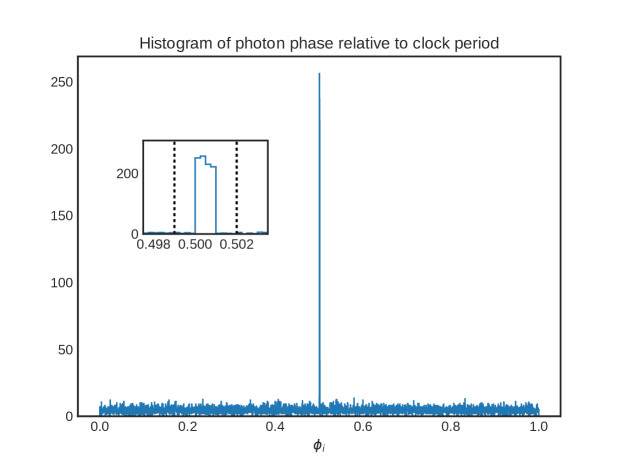
A histogram of is shown in Figure 4. The peak at cycles is due to the in-phase signal photons, while the background photons have random phases. (Note that in this example, the phase of the signal photons was fixed as a simulation parameter, but in general it could take any value between 0 and 1.) We will apply a phase cut of width 3 centered on this peak, and discard all photons outside the range of 0.499 cycles to 0.502 cycles. It is clear from the histogram that a narrower phase cut would be possible without losing any signal photons, but it is not necessary for this example. For automated processing of real data, the peak identification and phase cut is done by algorithm; this will be discussed in Section III.
After applying the phase cut, we are left with 981 photons, of which 931 are the original signal photons and 50 are remaining background photons. Thus, the number of background photons in the dataset has been reduced to 50/18,107 = 0.28% of the original number, without losing any of the signal photons. With this much more favorable signal-to-background ratio, we can now decode the ID number.
II.2 Decoding the ID number
To decode the ID number, the photon detections from each recorded repetition of the ID number must be combined. This is done by folding the remaining photon detection time data by the ID length:
| (3) |
where is the number of bits in the ID. Then the folded times are binned into 128 clock period windows to determine the number of photons detected for each bit of the recovered ID number:
| (4) |
where and the prime indicates that we do not yet know the shift between the first bit of the recovered ID number and the first bit of the registry ID number.
We now assign a binary value to each bit, using a simple hard decision decoding method determined by the number of photons in a bit:
| (5) |
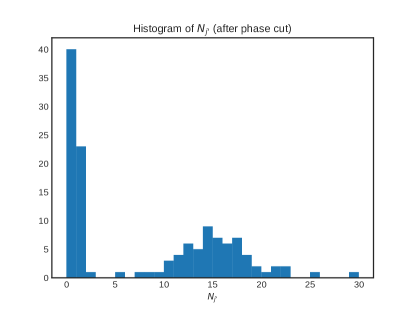
A histogram111Histograms are plotted with the left bin edge labeled, and bins are left-closed, right-open intervals. of is useful for visualizing where this threshold should be set (Figure 5). In this example, the phase-cut data shows two clearly different distributions of photon numbers, corresponding to 0 bits and 1 bits. A threshold of appears reasonable based on the histogram of , and also produces equal numbers of 0 bits and 1 bits, which matches our expectation for a 64-of-128-bit code (as discussed in the next example of Section III, this property of the ID numbers can be used to choose an appropriate value of when the distinction between 1 and 0 bits is less obvious).
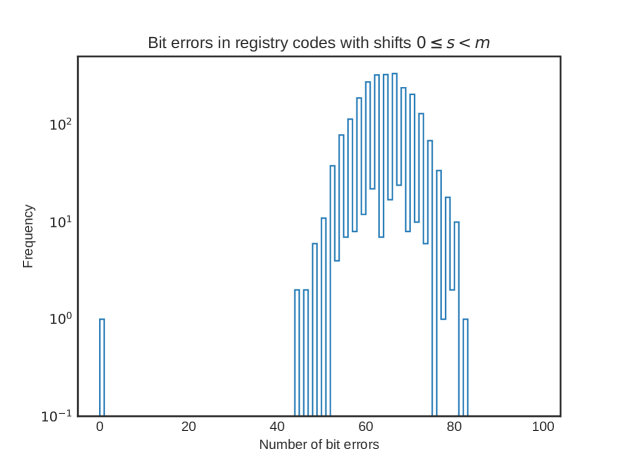
The final step is to compare the recovered ID number to the registry of known IDs (with each shift ) to find the best match. In this example we will simply find the matching ID with the smallest Hamming distance (number of bit errors) from the recovered ID. Because the ID numbers are generated with an error-correcting code, if all other IDs have a larger Hamming distance than the best match, this indicates with high confidence that our identification is correct. For this example, we will compare the recovered code to a test registry containing 20 ID numbers generated under the restrictions described in Section I.3. (An operational registry would contain at least as many ID numbers as there are satellites with ELROI beacons, and millions of unique IDs are possible.) The result of this comparison is shown in Figure 6. In this simulation, we were able to get a perfect match (zero bit errors) with a registry ID . The recovered ID matches registry ID number 16 with a shift .
III Example: Decoding experimental data
The ELROI concept has been demonstrated in a ground test over approximately 15 km. This test served both to validate link budget calculations, as discussed in more detail in Palmer and Holmes (2018), and to verify data analysis techniques for conditions similar to a LEO system. According to our link budget calculations, signal rates of 3 to 20 photons/s will be typical at our ground station for prototype ELROI beacons on LEO satellites, depending on the beacon power and rangePalmer and Holmes (2018); Holmes et al. (2018). To approximate the expected LEO link budgets, the ground test used laser diodes with lower peak power than the orbital beacons, a neutral density filter on one of the beacons to further reduce the outgoing light, and a smaller lens at a variety of apertures to replace the telescope that would be used for an orbital beacon. This allowed us to test reception at signal rates that were both higher and lower than expected for the nominal orbital case.
In this example, which uses a three-minute portion of ground test data with approximately 4.8 photons/second signal rate, we will illustrate more realistic elements of data processing, including determining the true clock period from the data, and using the known properties of the ID number to choose an appropriate bit value threshold for decoding.
ELROI ground test conditions
The ground test used a receiver stationed 15 km away from two beacon units. Each beacon consisted of a red laser diode (638 nm), optical diffuser, and driver electronics. The lasers were driven in a 64-of-128 pattern ID with a pulse duration and a nominal clock period (signal characteristics are summarized in Table 2). The two beacon units encoded different IDs. The time-averaged effective isotropic radiated power (EIRP) in the direction of the receiver was measured to be 0.3 mW, corresponding to a peak EIRP of 150 mW after adjusting for the 1:500 duty fraction. Unit 2 was attenuated by a 13%-transmission neutral density filter to 0.04 mW EIRP, while Unit 1 was left unfiltered. This example analyzes data from Unit 2.
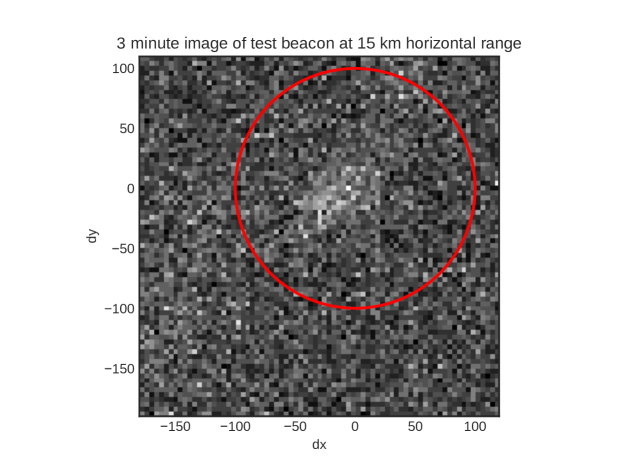
The receiver consisted of a LANL-developed photon-counting camera Priedhorsky and Bloch (2005); Thompson (2013) with an f = 400 mm lens and adjustable aperture (up to f/2.8 = 143 mm diameter). The camera has a quantum efficiency of about 3.9% at 638 nm, sub-nanosecond timing resolution, a dark count rate of a few thousand counts/second over the entire sensor, and it can detect approximately 500,000 photons/s. The receiver was equipped with a 10-nm bandpass filter centered on the transmitter laser wavelength to reduce background. The observations were made at night. Along with the adjustable sensor aperture, the beacon power and the range to the receiver were chosen to simulate predicted photon rates from typical ELROI beacons with a range of optical powers and orbital distances. Detailed link budget calculations may be found in Ref. 1. Radius cuts were applied to the camera data to isolate the photon detections from each beacon (Figure 7) and produce a list of photon detection times to analyze. Like the simulated data in Section II, the radius cut also contains background photons, both from the environment and from the dark count rate of the sensor.
| Parameter | Value | |
|---|---|---|
| ID number (hexadecimal) | 0x65b0278a7cad7b5c766f056a470f01cc | |
| ID length | 128 bits | |
| Pulse width | 2 s | |
| Nominal clock period | 500 s | |
| Sensor aperture | f/2.8 = 143 mm | |
| Measured signal photon rate | 4.8 photons/s (detected) | |
| Measured background photon rate | 50.7 photons/s (detected) | |
| Dataset length | 180 s |
III.1 Recovering the true clock period
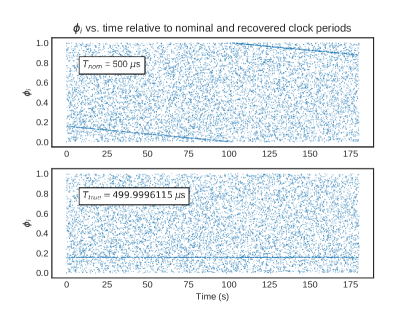
The nominal clock period of the ground test beacon is known (and programmed into the pulse generator that drives the laser), but in contrast with the the simulated data in Section II, we expect to observe some deviation from the nominal value. The fractional error tolerance of the beacon onboard clock determines the expected uncertainty range of : . For inexpensive crystal oscillators commonly used in integrated circuits, = 50–100 ppm is a typical value. Temperature changes, electromagnetic fields, radiation damage, and mechanical stress can also cause small deviations from the nominal period. As illustrated in Figure 9, even a small deviation from the nominal period destroys the stable fractional phase relationship between signal photons that is critical for the background-rejection phase cut. Therefore, it is necessary to determine the true clock period from the photon detection data before calculating .
III.1.1 The Fast Folding Algorithm
Given the nominal clock period and the expected value of , the true clock period can be recovered with computationally efficient techniques such as the Fast Folding Algorithm (FFA) Staelin (1969). Details on the FFA may be found in 15; what follows is a brief conceptual summary.
If a periodic signal is present in time series data, the fractional phase of the signal relative to the period (Equation 1) has a constant value over time. If the phase is measured relative to a period which is close to but not exactly the true period, the measured phase will change linearly with time (examples are shown in Figures 8a and 9a). The FFA determines the most likely slope of this linear relationship, and therefore the true period, using a sequence of shifting and adding steps on a two-dimensional histogram of the time series data binned by time and phase.
The FFA has advantages over the more familiar Fast Fourier Transform (FFT) for the ELROI clock period recovery task. The FFA concentrates the power of the non-sinusoidal ELROI signal, while the FFT disperses power at higher harmonics into other bins. The FFA can use the known value of to search for periodic signals in a specified frequency range with a specified frequency spacing, while the FFT must be calculated over all frequencies from zero to the highest frequency of interest with a fixed frequency spacing. Finally, unlike the FFT, the FFA can also be extended to measure slow changes in frequency over the duration of an observation (e.g., due to temperature drift).
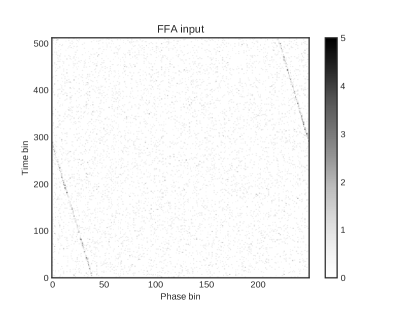
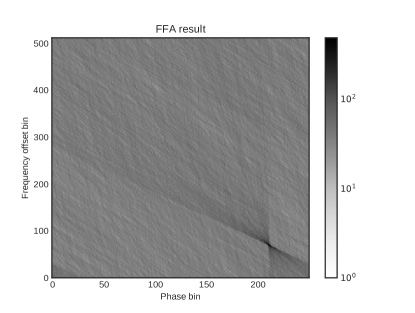
A Python implementation of the FFA was used to find the true clock period in this example Petigura . The inputs to the FFA are the photon detection times in bins of width , and the photon phases relative to the nominal period in bins of width (Figure 8a). The optimal width of is the approximate width of the phase peak . The width of is an integer number of nominal periods determined by , the maximum frequency deviation to be included in the search (larger requires more timebins). Using = 0.004, = 0.01 Hz, and = 0.352 s, the FFA found a peak period of s in our three-minute dataset, corresponding to a peak frequency of = 2000.001554 Hz (Figure 8b). The deviation from the nominal period ( = 500 s) is less than 0.8 ppm, but the correction is still critical in order to apply an efficient phase cut. The FFA also determines the phase of the periodic signal in the data (relative to the true period), = 0.16 cycles.
III.2 Phase cut
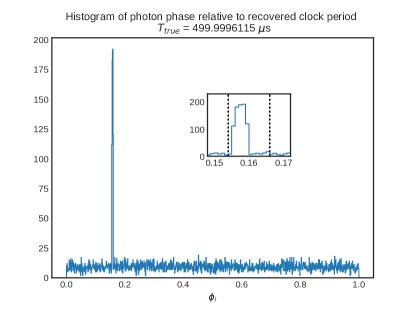
The true clock period, recovered using the Fast Folding Algorithm, can then be used to apply a phase cut to the photon time data. Because the FFA also determines the phase of the clock, the phase cut can now be applied given a desired tolerance around the peak phase. We use the same tolerance as in the example of Section II, and reject all photons outside a 3 phase window (Figure 9b).
The phase cut window is not perfectly centered on the phase peak, nor is the peak as narrow and tidy as in the simulated example of Section II. The phase peak is wider than , indicating that we still do not have exactly the correct clock period. The true location of the phase peak also appears slightly offset from the phase found by the FFA, which is due to the size of the phase bins and the uncertainty in the best period. If necessary, some additional sensitivity could be recovered by making small adjustments to and to maximize the height of the phase peak and allow the narrowest possible phase cut. However, this step is not needed to get good results in the current example.
After the phase cut, we are left with photon detections, out of the original in this three-minute dataset. Therefore, we can estimate that the background photon count rate in this dataset is
| (6) |
where is the width of the phase cut window in this example. The estimated signal photon count rate is
| (7) |
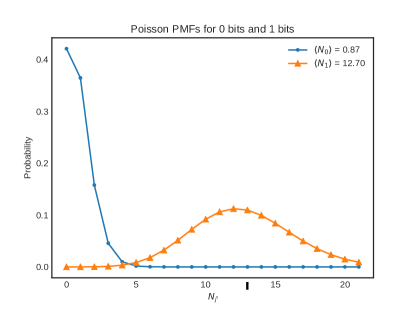
where is an estimate of the rate of background photons remaining after the phase cut. We can also calculate the expected values of for 0 bits and 1 bits after the phase cut:
| (8) |
| (9) |
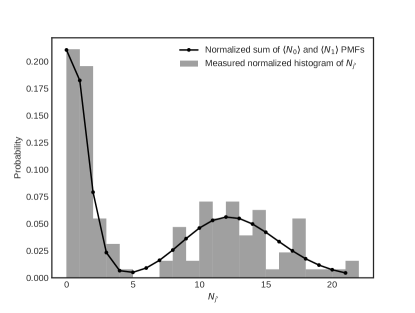
The values of for 0 bits and 1 bits are Poisson distributed, neglecting any saturation effects in the sensor. As shown in Figure 10, the measured distribution of is well described by the normalized sum of two Poisson distributions with means and .
III.3 Decoding the ID number
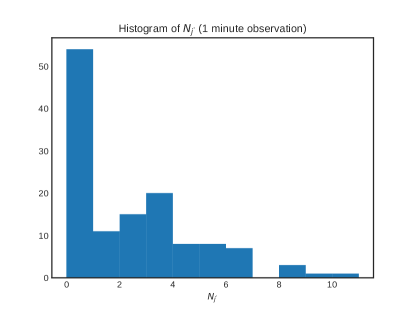
As in the example of Section II, the remaining photon detection times are folded by the code length and binned by the clock period to obtain a histogram of bit photon counts (Figure 10b). In this example, there are again two clear bit photon count distributions corresponding to 0 bits and 1 bits. This time we will use a quantitative method to determine the best bit value threshold for hard decision decoding.
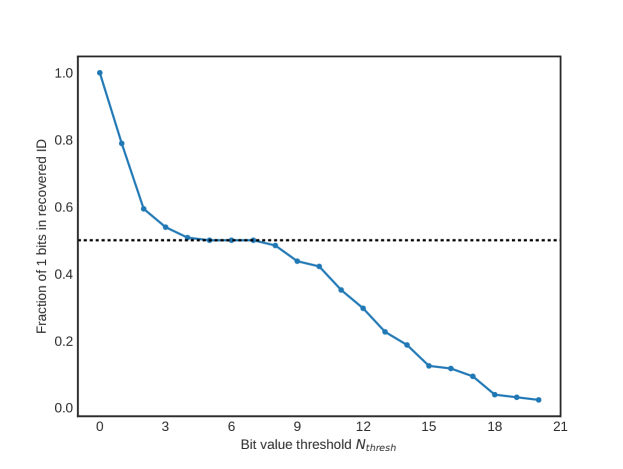
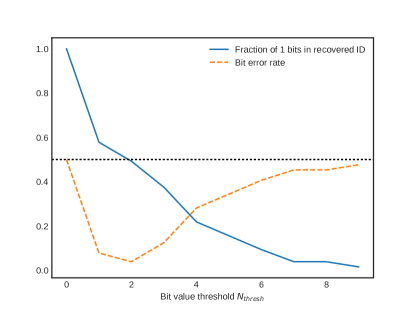
If constant-weight ID numbers are used, can be chosen to split the values into the expected number of zeros and ones. The ID number for this ground test data (and all others used in this paper) has a fraction of 1 bits = 0.50. As discussed further in Section III.4, choosing a threshold that results in as close as possible to the expected value minimizes the number of incorrect bits. (This method can also be extended to non-constant-weight codes if the fraction of 1 bits is restricted to some known range.) Figure 11a shows the fraction of 1 bits in the recovered ID as a function of the bit value threshold. Given several thresholds that result in = 0.5, we arbitrarily choose the lowest one and set . The value of each bit is then determined using the hard decision method described in Section II.2.
Finally, we compare the recovered ID number to all the IDs in the registry (with each shift ) to find the matching ID with the smallest Hamming distance. The recovered ID has zero errors compared to ID 3 in the registry (with a shift of 85), and indeed, ID 3 is the ID number used to program beacon Unit 2 in the ground test.
III.4 Data with reduced signal counts
The previous two examples, using simulated and experimental data, both showed a clear separation between the photon number distributions of 0 bits and 1 bits, and both recovered an ID that exactly matched an ID in the registry. The signal and background rates in these two examples were both within the expected range for an ELROI beacon on a small LEO object under good observing conditions, which demonstrates that the data analysis in that case is expected to be very straightforward. But by restricting our analysis to a shorter one-minute portion of the ground test data, we can see what happens when the number of signal photons detected is so low compared to the background that the distributions of 0 bits and 1 bits significantly overlap, and bit errors become inevitable.
The simple techniques of the previous two examples are still useful even with reduced counts. When each step in the data processing is identical to the analysis of the three-minute dataset, including recovering the clock period and phase with the FFA and applying a 3 phase cut, the resulting bit photon count histogram is shown in Figure 12a. Although there is no longer an obvious distinction between the distributions of 0 bits and 1 bits, the fraction of 1 bits may still be used to choose the best value of . Figure 12 shows that choosing a threshold that results in as close as possible to the expected value minimizes the number of incorrect bits. achieves = 0.5 for this dataset.
The best recovered ID has five bit errors compared to the true ID. However, all other IDs have significantly more errors (the second-best match has 45 bit errors) so even using this shortened dataset, we can confidently identify the ID number of the beacon. Because of the ECC scheme used to generate the registry IDs (Section I.3), all incorrect IDs are guaranteed to be larger Hamming distance from the recovered ID than the true ID, up to 12 bit errors in the recovered ID. As discussed in Sections IV and V, more sophisticated analysis techniques, improved ECC schemes, and operational context may be able to further improve our confidence that the recovered ID number is correct even for bit errors.
IV Error rates
As discussed in Section I.3, all the example ELROI IDs used in this paper are 128-bit binary sequences with a minimum 24-bit distance between a given ID and all other sequences (allowing cyclic permutation). This guarantees that for up to 12 incorrect bits, the true ID will be closer to the recovered ID than any other ID in the ELROI registry. Thus, if the bit error rate (frequency of individual bit errors) in a given recovered ID is 12/128 or lower, the codeword error rate (probability of incorrect beacon identifications) for that ID is zero. For more than 12 bit errors, the codeword error rate increases with the number of bit errors.
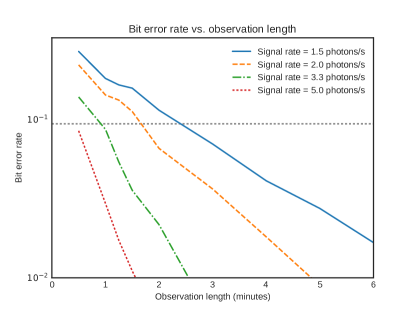
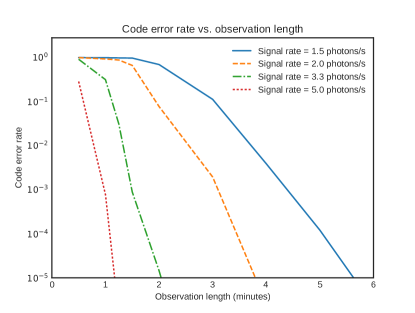
Figure 13 shows the results of a numerical simulation of bit error rates and codeword error rates in recovered IDs. Bit photon counts were randomly generated for 0 bits and 1 bits, and the hard decision decoding method described in Section III.4 was used to determine bit values, with the threshold chosen to achieve the fraction of 1 bits closest to 0.50 for each recovered ID. If the number of bit errors in an ID was 13 or more, it was counted as a codeword error. This is a conservative approach, as a recovered ID with more than 12 bit errors may still be closer to the true ID than any other ID in the registry.
The error rates in Figure 13 may appear high compared to typical optical communications applications, but they are acceptable for the ELROI application. Note that for a signal rate of 3.3 photons/s (comparable to our current LEO prototypes) the code error rate is 1 in 100,000 after only two minutes of observation. This means that the chance of mis-identification is 1 in 100,000 after two minutes if all ID numbers in the ECC scheme are in use. In practice, context will also give additional information, and not all possible IDs in the registry will be equally likely—for example, if 100 CubeSats are launched together into a known orbit, all carrying ELROI beacons, the codeword error rate for identifying one of these CubeSats will be greatly reduced compared to a complete registry of thousands or millions of IDs. Additional observation time also reduces the chance of mis-identification.
According to our link budget calculations, signal rates of 3 to 20 photons/s will be typical at our ground station for prototype ELROI beacons on LEO satellites, depending on the beacon power and rangePalmer and Holmes (2018); Holmes et al. (2018). We expect to be able to identify our current flight prototypes with codeword error rates of or lower, and under ideal conditions codeword error rates may reach .
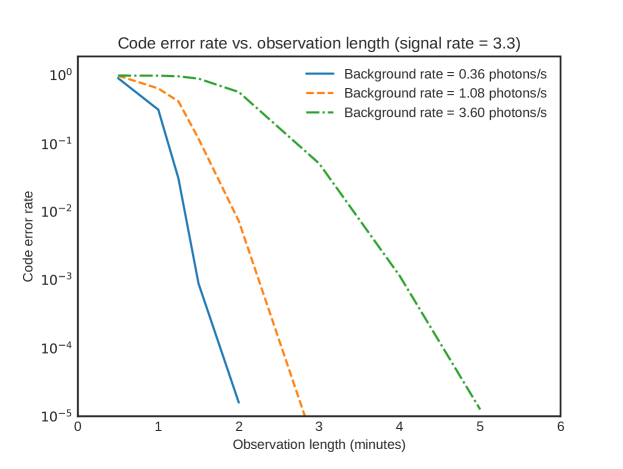
Figure 14 shows how codeword error rates vary with the background rate for a fixed signal rate of 3.3 photons/s. If the actual observed background rate is three times higher than expected, less than a minute of additional observation is needed to reach a codeword error rate of . If the observed background rate is ten times higher than expected, approximately three minutes of additional observation are needed to reach the same codeword error rate. In this case, the ID may not be able to be identified with the same level of confidence in a single pass over a ground station, but can still be identified with lower confidence. Higher-power beacons may be used to improve performance for large satellites with high background rates from reflected sunlight (further discussion of these design trade-offs may be found in Reference 1).
V Conclusions
We have described the basic data analysis techniques needed to recover the unique ELROI ID number for a space object, and we invite readers to consider observing our upcoming test flights. As we have shown with both simulated and ground test data, even the simple methods described here can easily recover the beacon ID for a small LEO satellite.
However, further optimization is possible and should be explored. Improvements to both the encoding and decoding schemes may be considered. The examples shown here have used a hard decision decoding method. Although Figure 12 suggests this method may be close to optimal, a registry search for the best ID after hard decision decoding weights all bit errors between the recovered ID and a registry ID equally, without considering the actual number of photons detected for each bit. A soft decision decoding approach might improve on this by weighting bit errors by the number of photons detected.
Although the simple ECC scheme presented here is sufficient for many practical use cases, there are codes that achieve substantially better Hamming distance (and therefore improved error tolerance) for the same code length and number of codes; for example, BCH codes Hocquenghem (1959); Bose and Ray-Chaudhuri (1960). There may also be an advantage to using forward error correction and Bayesan decoding with prior information, as implemented in (for example) turbo codes, LDPC codes, and, recently, polar codes Arikan (2009); Gallager (1962); Berrou, Glavieux, and Thitimajshima (1993). These types of ECC codes are frequently used in modern digital communications, including space communications, and have known optimal decoding techniques.
Funding
US Department of Energy through the Los Alamos National Laboratory (LANL) Laboratory Directed Research and Development (LDRD) program
Richard P. Feynman Center for Innovation at Los Alamos National Laboratory
Center for Space and Earth Sciences at Los Alamos National Laboratory
Acknowledgments
ELROI hardware and software was developed and tested at LANL by Louis Borges, Richard Dutch, Darren Harvey, Ryan Hemphill, David Hemsing, Alexandra Hickey, Lee Holguin, Zachary Kennison, Jim Lake, Joellen Lansford, and Charles Weaver. The ELROI long-range ground test was assisted by Amanda Graff, David Graff, Michael Rabin, and David Thompson.
References
- Palmer and Holmes (2018) D. M. Palmer and R. M. Holmes, “Extremely Low Resource Optical Identifier: A License Plate for Your Satellite,” AIAA Journal of Spacecraft and Rockets 55, 1014–1023 (2018).
- Palmer (2016) D. Palmer, “OPTICAL IDENTIFICATION BEACON, patent application 15/232,857,” (2016).
- Palmer (2015) D. Palmer, “OPTICAL IDENTIFICATION BEACON, provisional patent application 62/218,232,” (2015).
- spa (2017) “Space-Track.org,” (2017).
- IAD (2017) “IADC Statement on Large Constellations of Satellites in Low Earth Orbit: 4.3.5 Trackability,” Tech. Rep. IADC-15-003 (Inter-Agency Space Debris Coordination Committee Steering Group, 2017).
- Peterson, Sorge, and Ailor (2018) G. Peterson, M. Sorge, and W. Ailor, “Space Traffic Management in the Age of New Space,” Tech. Rep. (The Aerospace Corporation, 2018).
- Holmes et al. (2018) R. Holmes, D. M. Palmer, S. Gill, J. Z. Harris, R. Myers, A. P. Zucherman, A. M. Jorgensen, C. T. Weaver, and J. P. Lansford, “Progress on ELROI satellite license plate flight prototypes,” in Proc. SPIE 10659, Advanced Photon Counting Techniques XII, May, edited by M. A. Itzler and J. C. Campbell (SPIE, 2018) p. 23, arXiv:1804.00649 .
- Farrell (2018a) T. C. Farrell, “The performance of Geiger mode avalanche photo-diodes in free space laser communication links,” in Proc. SPIE 10641, Sensors and Systems for Space Applications XI, May, edited by K. D. Pham and G. Chen (SPIE, 2018) p. 23.
- Farrell (2018b) T. C. Farrell, “Quantum limited performance of optical receivers,” in Proc. SPIE 10641, Sensors and Systems for Space Applications XI, May, edited by K. D. Pham and G. Chen (SPIE, 2018) p. 21.
- Mendenhall et al. (2007) J. A. Mendenhall, L. M. Candell, P. I. Hopman, G. Zogbi, D. M. Boroson, D. O. Caplan, C. J. Digenis, D. R. Hearn, and R. C. Shoup, “Design of an Optical Photon Counting Array Receiver System for Deep-Space Communications,” Proceedings of the IEEE 95, 2059–2069 (2007).
- Boroson, Biswas, and Edwards (2004) D. M. Boroson, A. Biswas, and B. L. Edwards, “MLCD: overview of NASA’s Mars laser communications demonstration system,” in Proc. SPIE 5338, Free-Space Laser Communication Technologies XVI, June 2004, edited by G. S. Mecherle, C. Y. Young, and J. S. Stryjewski (2004) p. 16.
- Thompson (2013) D. C. Thompson, “Imaging One Photon at a Time,” Tech. Rep. LA-UR-13-22617 (Los Alamos National Laboratory, 2013).
- Hamming (1950) R. W. Hamming, “Error Detecting and Error Correcting Codes,” Bell System Technical Journal 29, 147–160 (1950).
- Priedhorsky and Bloch (2005) W. Priedhorsky and J. J. Bloch, “Optical detection of rapidly moving objects in space,” Applied Optics 44, 423 (2005).
- Staelin (1969) D. H. Staelin, “Fast folding algorithm for detection of periodic pulse trains,” Proceedings of the IEEE 57, 724–725 (1969).
- (16) E. Petigura, “https://github.com/petigura/FFA,” .
- Hocquenghem (1959) A. Hocquenghem, “Codes correcteurs d’erreurs,” Chiffres (in French) 2, 147–156 (1959).
- Bose and Ray-Chaudhuri (1960) R. C. Bose and D. K. Ray-Chaudhuri, “On A Class of Error Correcting Binary Group Codes,” Information and Control 2, 68–79 (1960).
- Arikan (2009) E. Arikan, “Channel Polarization: A Method for Constructing Capacity-Achieving Codes for Symmetric Binary-Input Memoryless Channels,” IEEE Transactions on Information Theory 55, 3051–3073 (2009).
- Gallager (1962) R. G. Gallager, “Low-density parity-check codes,” IEEE Trans. Info. Theory 8, 21–28 (1962).
- Berrou, Glavieux, and Thitimajshima (1993) C. Berrou, A. Glavieux, and P. Thitimajshima, “Near Shannon limit error-correcting coding and decoding: Turbo-codes. 1,” in Proceedings of ICC ’93 - IEEE International Conference on Communications, Vol. 2 (IEEE, 1993) pp. 1064–1070.