A near-infrared VISTA of the
Small Magellanic Cloud
Abstract
VISTA observed the Small Magellanic Cloud (SMC), as part of the VISTA survey of the Magellanic Clouds system (VMC), for six years (2010-2016). The acquired multi-epoch images have allowed us to probe the stellar populations to an exceptional level of detail across an unprecedented wide area in the near-infrared. This contribution highlights the most recent VMC results obtained on the SMC focusing, in particular, on the clustering of young stellar populations, on the proper motion of stars in the main body of the galaxy and on the spatial distribution of the star formation history.
keywords:
galaxies: Magellanic Clouds, surveys, techniques: photometric, astrometry.1 Introduction
The VISTA survey of the Magellanic Clouds system (VMC; [cioni11, Cioni et al. 2011]) is a near-infrared deep and wide-field study of the history and structure of the Magellanic Clouds. Observations are performed with the VIRCAM instrument mounted at the VISTA telescope, they began in late 2009 and are about to be completed. The VMC survey covers a total sky area of with a spatial resolution of in the filters reaching a sensitivity of about mag (S/N in the Vega system). The VMC survey comprises of multi-epoch observations, at least epochs in the and filters and at least epochs in the filter. More than thirty refereed journal papers have been published by the VMC survey team to-date and in this contribution we highlight the results from the three most recent ones.
2 Hierarchical star formation in the SMC
The distribution of young ( Myr old) upper main sequence stars across the SMC was studied using a cluster analysis technique in order to understand their formation mechanism ([Sun18, Sun et al. 2018]). Stars were selected from the VMC colour-magnitude diagram, versus , to lie within a box on the upper main sequence, while taking into account of possible shifts due to metallicity, extinction, and the SMC’s line-of-sight depth. They were used to identify separate over densities on significance levels (Fig. 1). These structures appeared to follow a hierarchical distribution such that larger structures on lower significance levels contain smaller ones on higher levels. Their properties (size, number of stars, and surface density) as well as their irregular morphologies (characterised by a perimeterarea dimension of ) are similar to those of the interstellar medium which is regulated by supersonic turbulence. This highlights the importance of turbulence in controlling star formation over a large scale range.

3 The proper motion of the SMC
The proper motions of the stellar populations in the centre of the SMC have been derived using multi-epoch VMC observations. Four VMC tiles were examined and the reflex motions of about background galaxies was measured with respect to about stars. The proper motions were measured from the pixel displacements in the x and y directions of the source centroids which were obtained from point-spread-function photometry on individual pawprint -band detector images. On average, independent epochs over a time baseline of months were available and each detector contained about stars and background galaxies. A median systemic proper motion of the SMC, mas yr-1 with systematic uncertainties of and mas yr-1 for the two components and a random uncertainty of mas yr-1, was found. This is consistent with previous studies. Furthermore, from the median-subtracted proper motion distribution (Fig. 2) we identified regions of non-uniform velocity, in the densest area and in the southeast of the galaxy, probably associated to tidal stripping events. While the latter feature points towards the Wing and the Bridge, the former might be associated to the Counter-Bridge ([Diaz & Bekki (2012), Diaz & Bekki 2012]).

4 The star formation history of the SMC
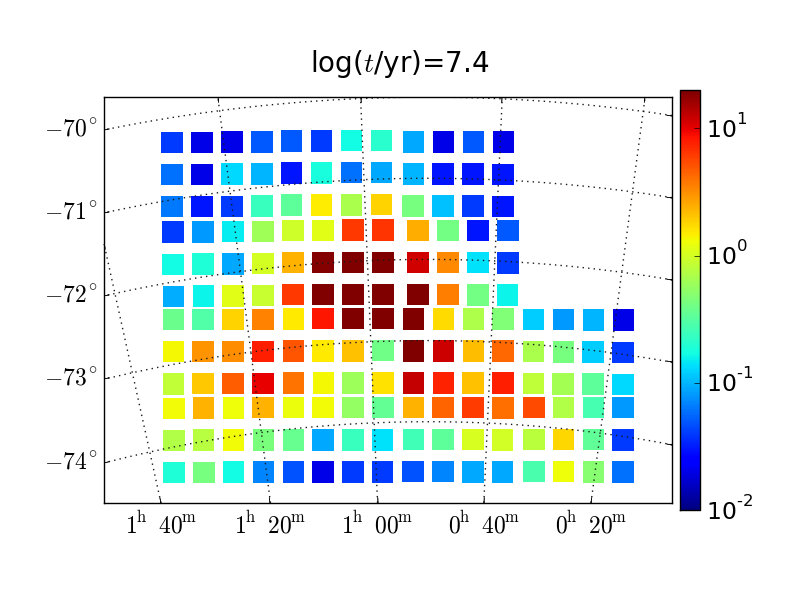
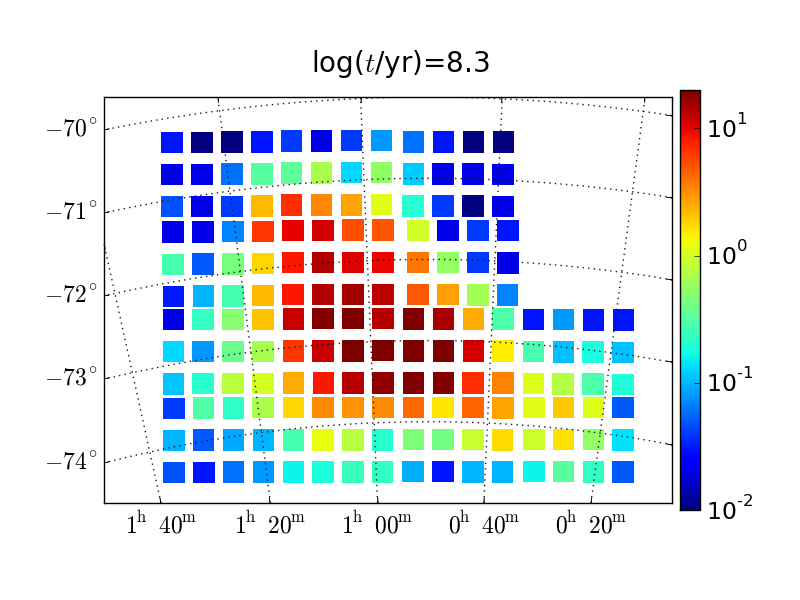
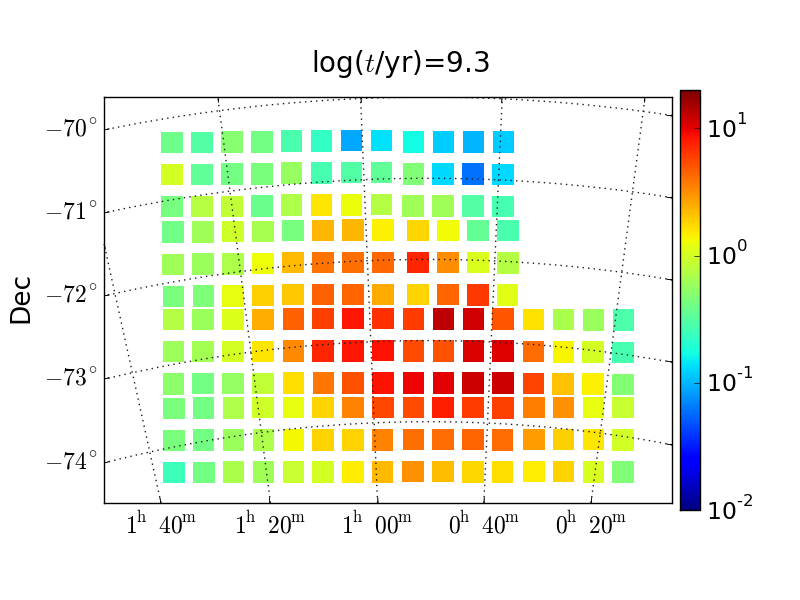
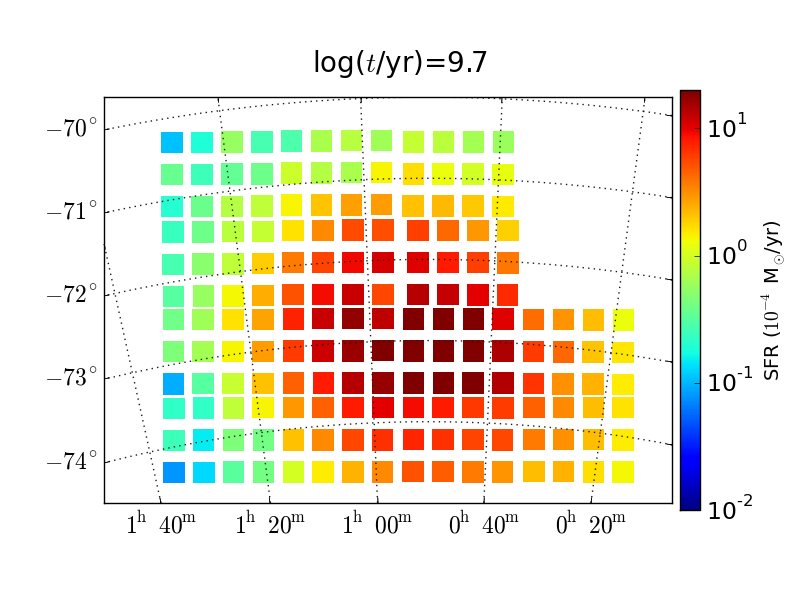
The star formation history across the central deg2 region of the SMC ( VMC tiles) has been derived from the reconstruction of the observed VMC colour-magnitude diagrams ( versus and versus ) by [Rubele et al. (2018), Rubele et al. (2018)]. The analysis was performed within individual subregions of deg2 in size. Figure 3 shows that at young ages ( or Myr) the star formation is concentrated in the Bar and Wing areas while the separation between these two substructures is less clear at older ages. A northwestern edge, possibly resulting from the dynamical interaction with the Large Magellanic Cloud ( or Myr ago), becomes well delineated. The distribution traced by old ( or Gyr old) stars is significantly rounder than that resulting from younger stars. We explored the age interval from Myr to Gyr and all maps are included in [Rubele et al. (2018), Rubele et al. (2018)]. In this study, we also derived the spatial distribution of the mean reddening and distance of the stellar populations as well as an estimate of the total stellar mass, M⊙, that the galaxy produced over its lifetime.


5 Conclusions
The VMC observations across the SMC area were completed in 2016 and the data are currently being reprocessed with the latest version of the CASU pipeline (v1.5) to adjust the zero points and to apply a correction to the distortion of tile images, more details are given in [Gonzalez-Fernandez et al. (2018), Gonzalez-Fernandez et al. (2018)]. Several works have resulted from the previous reductions (i.e. v1.3) and analysis of the data, e.g.: a study of the three-dimensional structure of the SMC using Cepheids ([Ripepi et al. (2017), Ripepi et al. 2017]) and RR Lyrae stars ([Muraveva et al. (2018), Muraveva et al. 2018]), the discovery of a bi-modality in the red-clump distribution ([Subramanian et al. (2017), Subramanian et al. 2017]) and of new star clusters ([Piatti et al. (2016), Piatti et al. 2016]), while in this contribution we focused on the three most recent publications. In future works, we will complement the star formation history and the proper motion analysis of the SMC with VMC tiles covering the external regions of the galaxy. We also plan to extend these studies, the study of the clustering of young stellar structures and that of the three-dimensional structure to the Large Magellanic Cloud.
References
- [Cioni et al. (2011)] Cioni, M.-R. L., Clementini, G., Girardi, L., et al. 2011, A&A, 527, A116
- [Diaz & Bekki (2012)] Diaz, J. D., & Bekki, K. 2012, ApJ, 750, 36
- [Gonzalez-Fernandez et al. (2018)] Gonzalez-Fernandez, C., Hodgkin, S. T., Irwin, M. J., et al. 2018, MNRAS, 474, 5459
- [Muraveva et al. (2018)] Muraveva, T., Subramanian, S., Clementini, G., et al. 2018, MNRAS, 473, 3131
- [Niederhofer et al. (2018)] Niederhofer, F., Cioni, M.-R. L., Rubele, S., et al. 2018, A&A, 613, L8
- [Piatti et al. (2016)] Piatti, A. E., Ivanov, V. D., Rubele, S., et al. 2016, MNRAS, 460, 383
- [Ripepi et al. (2017)] Ripepi, V., Cioni, M.-R. L., Moretti, M. I., et al. 2017, MNRAS, 472, 808
- [Rubele et al. (2018)] Rubele, S., Pastorelli, G., Girardi, L., et al. 2018, MNRAS, 478, 5017
- [Subramanian et al. (2017)] Subramanian, S., Rubele, S., Sun, N.-C., et al. 2017, MNRAS, 467, 2980
- [Sun et al. (2018)] Sun, N.-C., de Grijs, R., Cioni, M.-R. L., et al. 2018, ApJ, 858, 31
- [Zaritsky et al. (2002)] Zaritsky, D., Harris, J., Thompson, I. B., et al. 2002, AJ, 123, 855