A colloid approach to self-assembling antibodies
Abstract
Concentrated solutions of monoclonal antibodies have attracted considerable attention due to their importance in pharmaceutical formulations, yet their tendency to aggregate and the resulting high solution viscosity has posed considerable problems. It remains a very difficult task to understand and predict the phase behavior and stability of such solutions. Here we present a systematic study of the concentration dependence of the structural and dynamic properties of monoclonal antibodies using a combination of different scattering methods and microrheological experiments. To interpret these data, we use a colloid-inspired approach based on a simple patchy model, which explicitly takes into account the anisotropic shape and the charge distribution of the molecules. Combining theory, simulations and experiments, we are able to disentangle self-assembly and intermolecular interactions and to quantitatively describe the concentration dependence of structural and dynamic quantities such as the osmotic compressibility, the collective diffusion coefficient and the zero shear viscosity over the entire range of investigated concentrations. This simple patchy model not only allows us to consistently describe the thermodynamic and dynamic behavior of mAb solutions, but also provides a robust estimate of the attraction between their binding sites. It will thus be an ideal starting point for future work on antibody formulations, as it provides a quantitative assessment of the effects of additional excipients or chemical modifications on antibody interactions, and a prediction of their effect on solution viscosity.
Immunoglobulin gamma (IgG) constitutes the major antibody isotype found in serum and takes part in the immune response following an infection to the body. IgGs contain three structured domains: two antigen binding domains (FAB) and one so-called constant domain (FC) arranged in a Y shape via a flexible hinge region. The specific details of such a hinge region further classify the IgGs into four subclasses: IgG1, IgG2, IgG3 and IgG4. In the biopharmaceutical industry, monoclonal antibodies (mAb) based on IgGs are a major platform for potential drug candidates, with more than 20 mAb based drugs available on the market and more in development Nelson et al. (2010); Reichert (2012). The popularity of these macromolecules is due to a large flexibility in molecular recognition thanks to the variable portions of the FAB, a long half-life time in the body, and the possibility of humanization minimizing the risk of immunogenicity.
In order for mAbs to become a successful pharmaceutical product, not only a biological effect but also a high chemical and formulation stability of the solutions is required. Generally, for mAb based drugs, a high concentration formulation of the order of 100 g/L or more is desirable Narasimhan et al. (2012); Shire (2009). However, in many cases mAb solutions at these concentrations exhibit dramatically altered flow properties, resulting in serious challenges during production and when administering the drug.
The flow properties of protein solutions are primarily determined by the shape of the proteins and their mutual interactions. As the concentration increases, protein-protein interactions become increasingly significant. Despite the extensive experimental and theoretical work devoted to protein crowding and its effects on the resulting stability and flow properties at high protein concentration, our ability to predict for example the concentration dependence of the zero shear viscosity and the location of an arrest or glass transition is still limited Neergaard et al. (2013); Buck et al. (2014); Godfrin et al. (2016); Grimaldo et al. (2014); Yearley et al. (2014); Ando and Skolnick (2010); Bucciarelli et al. (2015, 2016); Foffi et al. (2014); Cardinaux et al. (2011). For antibody solutions this is a particularly difficult problem as attractive interactions often lead to reversible self-association between the antibody molecules Chari et al. (2009); Kanai et al. (2008); Yadav et al. (2010); Yearley et al. (2014); Godfrin et al. (2016), making the change in solution flow properties highly sensitive to the protein concentration Lilyestrom et al. (2013); Scherer Thomas M. and P. (2010); Connolly et al. (2012); Schmit et al. (2014).
A number of studies have made attempts to characterize cluster formation in mAb solutions, and to interpret antibody solution properties through analogies with colloids or polymers. In particular, scattering techniques were used to investigate protein interactions and self-association in antibody formulations Yadav et al. (2012); Yearley et al. (2013, 2014); Saito et al. (2012); Scherer (2013); Castellanos et al. (2014); Godfrin et al. (2016); Corbett et al. (2017). While investigations of the self-association behavior of various mAb formulations have frequently addressed mAb self-association and its effect on flow properties, we are far from having any predictive understanding and a generally accepted methodology and/or theoretical framework to detect antibody association and model mAb interactions quantitatively. A particular difficulty here is that while the non-spherical shape and internal flexibility has sometimes been addressed, interactions between proteins are frequently treated based on spherical approximations, and in particular the enormous effect that specific, directional interactions can have are generally not considered.
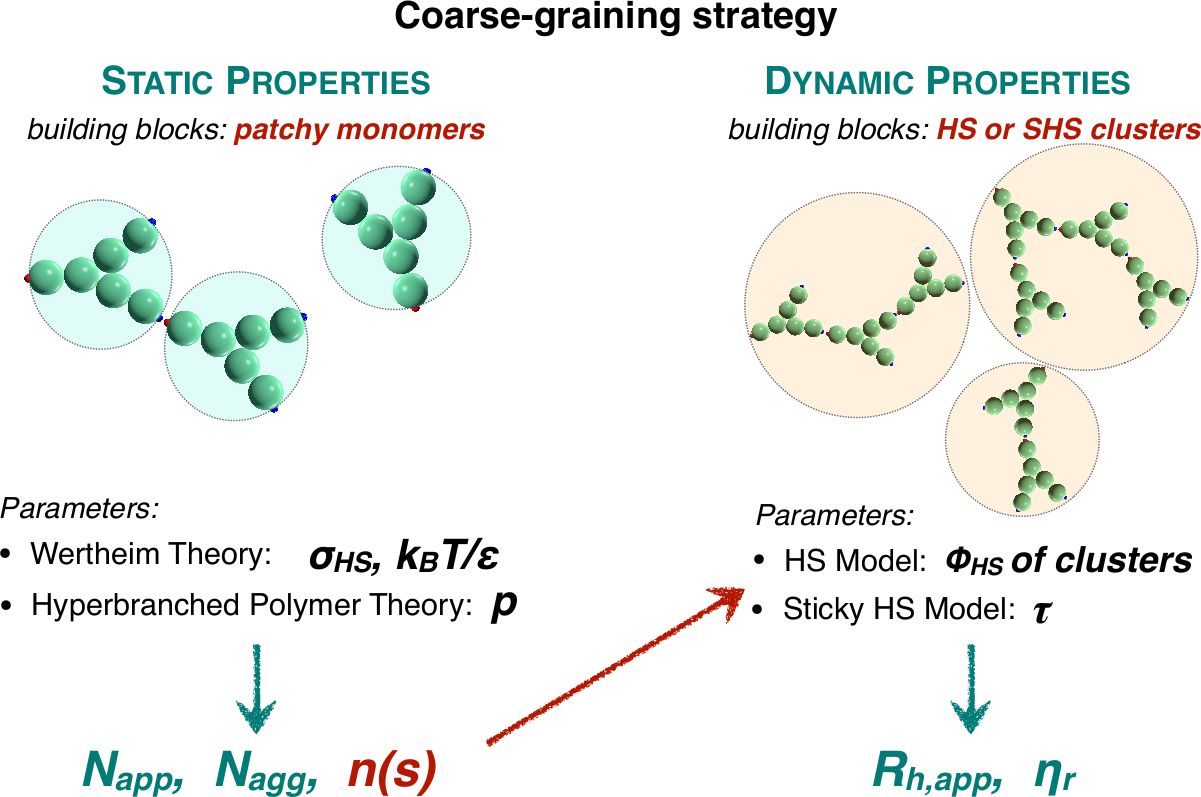
Here we present an investigation of the solution behavior of a monoclonal antibody varying the concentration, where we combine scattering methods and viscosity measurements with theoretical calculations and Monte Carlo (MC) simulations. We explicitly consider in our model the anisotropy of both the shape and the interactions of the antibody molecules. To this aim we focus on Y-shaped molecules interacting within a simple patchy model that is built from calculations of the electrostatic properties of the considered mAbs. The simplicity of the model allows for analytical treatment through Wertheim theory Wertheim (1984), yielding all thermodynamic properties of the solution and in particular the compressibility that can be directly compared to the experimentally determined osmotic compressibility or apparent molecular weight. In addition, we calculate the size distribution of mAb clusters using the Hyperbranched Polymer Theory (HPT) Rubinstein and Colby (2003), without introducing any additional free parameters. Finally, we use MC simulations to verify the results predicted theoretically. With the explicit cluster size distribution obtained by HPT at all concentrations investigated, and assuming that the dynamic solution properties (such as the apparent hydrodynamic radius or the relative viscosity , where is the zero shear viscosity and is the solvent viscosity) are primarily determined by excluded volume effects, we are able to make an additional coarse-graining step in which we model the mAb clusters as effective hard (HS) or sticky (or adhesive) hard (SHS) spheres, for which quantitative relationships for the concentration dependence of and exist. We find that the measured data are indeed well reproduced by this model, confirming that excluded volume interactions between the assembled clusters are at the origin of the strong increase of with increasing concentration. Hence, our simple model is capable of quantitatively predicting the measured concentration-dependence of the viscosity, solely based on static and dynamic light scattering experiments. Our results can be easily generalized to different types of mAbs, salt concentrations and temperature and may provide a crucial step for a proper description of self-association and dynamics of monoclonal antibodies.
Experimental Results
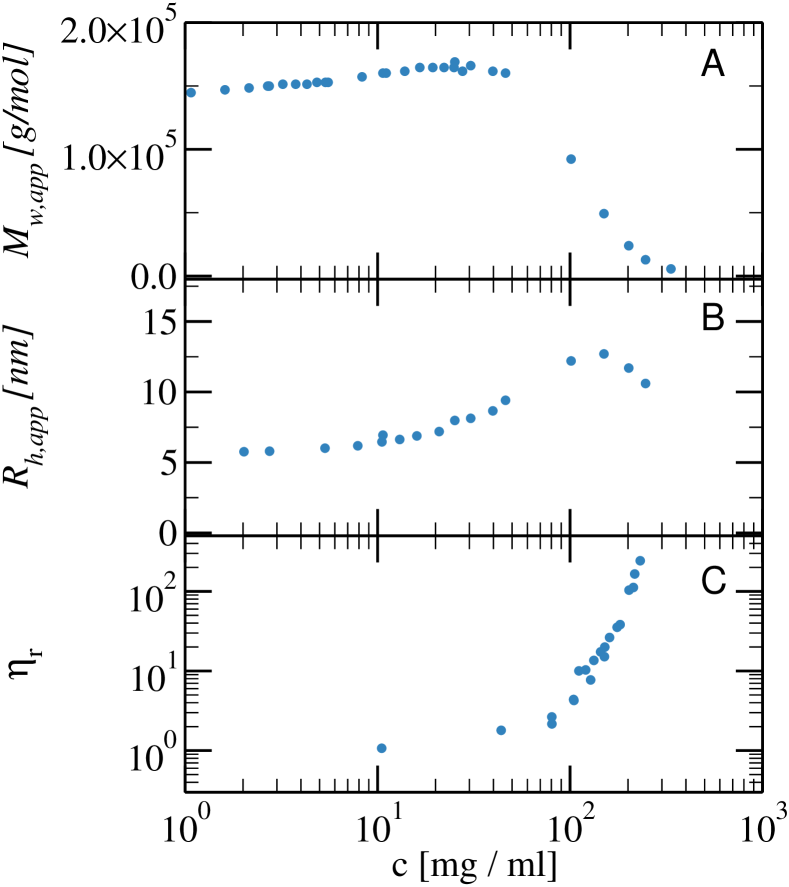
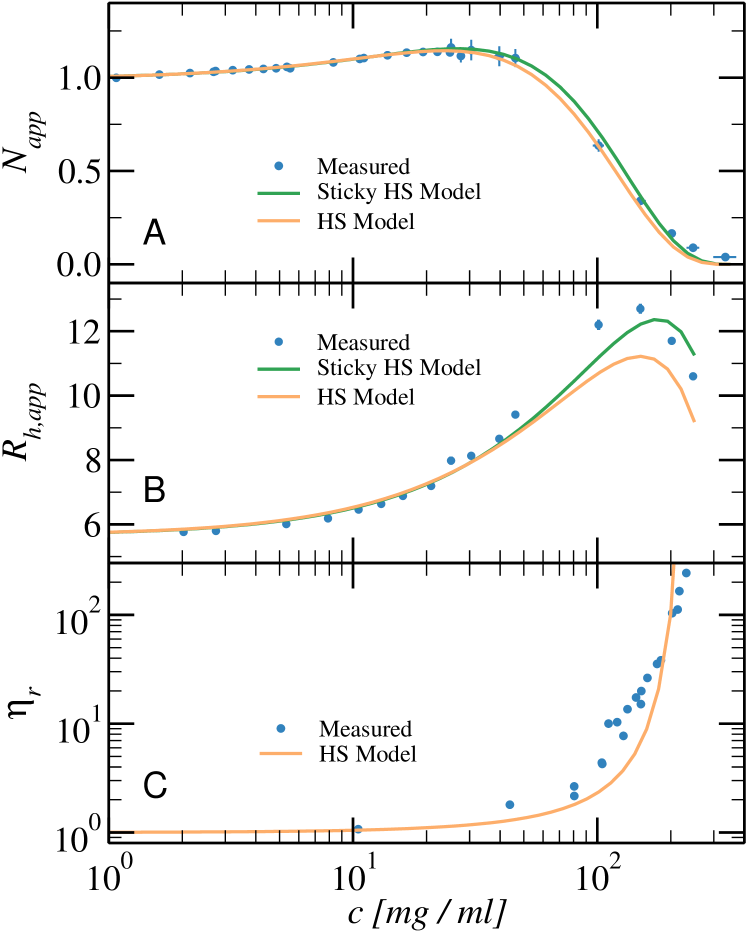
We have characterized the solution behavior of a monoclonal antibody (mAb) as described in Materials and Methods. The results from these experiments are summarized in Fig. 1. The static light scattering (SLS) data in Fig. 1A show that the apparent molecular weight initially increases with concentration from the known value of the molecular weight of the mAb monomer, i.e. g/mol, goes through a maximum at a concentration of around mg/ml, and then strongly decreases at higher concentrations. A similar trend can also be seen for the apparent hydrodynamic radius , reported in Fig. 1B, that is obtained by dynamic light scattering (DLS). We find that also initially increases from the monomer value of nm, reaches a maximum at mg/ml, and finally decreases at higher values of . In contrast, the reduced viscosity , shown in Fig. 1C, monotonically increases with concentration and appears to diverge for mg/ml. Qualitatively, the concentration dependence of the three key quantities , and is in agreement with a behavior where the mAb self-assemble into aggregates with increasing concentration. While this is visible in the SLS and DLS data at low concentrations, the influence of excluded volume effects on the scattering data becomes more prominent at higher concentrations and results in a decrease of the measured values for and . At the same time, these increasing interaction effects also result in a corresponding increase of the zero shear viscosity of the mAb solution.
While it is straightforward to qualitatively assess the existence of aggregation and intermolecular interactions, a quantitative interpretation of the experimental data would require knowledge of both the molecular weight distribution of the resulting aggregates as well as the interaction potential between antibodies. This situation is similar to the difficulties encountered when trying to analyze scattering and rheology data of surfactant molecules forming large polymer-like micelles Schurtenberger et al. (1996, 1989). Crucially, a qualitative comparison between the behavior normally encountered for polymer-like micelles and the data shown in Fig. 1 shows significant differences. Indeed, for polymer-like micelles the maxima in and are directly linked to the overlap concentration that marks the transition from a dilute to a semi-dilute concentration regime, and thus occur at approximately the same value. For the mAb data shown in Fig. 1, however, there exists a large difference between the concentrations related to the maxima in and , respectively. This clearly indicates that a simple application of polymer models, such as the wormlike chain model previously used successfully to for example describe SLS and DLS data for antigen-mAb complexes Murphy et al. (1988), does not work. We thus instead exploit analogies to patchy colloids in order to design a coarse-grained model for our system and investigate whether we can obtain with this approach a quantitative analysis of the experimental data.
Comparing theory and experimental results
Model: Antibodies as patchy particles
We model mAbs as patchy colloids and use a theoretical approach that has previously been applied successfully to such particles, in order to calculate their structural properties as a function of concentration. Patchy models are coarse-grained models which condense complex anisotropic interactions often of electrostatic origin in simple site-site aggregation, that have been applied in the past to several protein solutionsFusco et al. (2014); Roosen-Runge et al. (2014); Li et al. (2015); Quinn et al. (2015); McManus et al. (2016); Cai et al. (2017); Cai and Sweeney (2018), and other complex systems, including colloidal claysRuzicka et al. (2011) and DNA-based nanoconstructsBiffi et al. (2015); Bomboi et al. (2016).
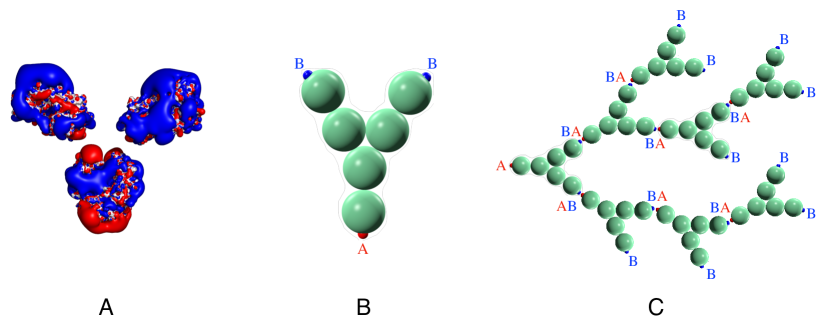
In order to build a meaningful model it is crucial to identify the key ingredients controlling the intermolecular interactions. A previous study of this antibody has shown that the viscosity is sensitive to the salt concentration, pointing towards electrostatic interactions as a main component of the intermolecular interactionsNeergaard et al. (2013). Therefore, we first carry out a study of the electrostatic isosurface of a single antibody molecule in the considered buffer solution, as described in Materials and Methods, in order to locate the active spots on the molecule surface that are involved in particle-particle aggregation. The resulting charge distribution is illustrated in Fig. 2A, which clearly shows that the considered mAbs have an overall positively charged surface on the two arms (FAB domains) and a largely negative charge on the tail (FC domain). This suggests that the main driving mechanism for mAbs aggregation has to be an attractive arm-to-tail interaction.
To take into account this result, we thus consider Y-shaped particles formed by six spheres of diameter and decorated with three patches, one of type on the tail and two of type on the arms, as illustrated in Fig. 2B. Interactions between patches are attractive and modeled with a square-well potential, while and interactions are not considered. To predict the behavior of our patchy model, which we call YAB model, we use a thermodynamic perturbation theory, introduced by Wertheim roughly 30 years ago, which describes associating molecules under the hypothesis that each sticky site on a particle cannot bind simultaneously to two or more sites on another particle Wertheim (1984). The Helmholtz free energy and the thermodynamic properties of the system, including for example the energy per particle, the specific heat at constant volume and the isothermal compressibility, can thus be predicted from the dependence of the bonding probability on the temperature and the number density , as explained in more details in Materials and Methods. We complement this approach with Monte Carlo simulations of the YAB model in order to validate the theoretical results. In addition, the YAB model belongs to the class of hyperbranched polymersRubinstein and Colby (2003), for which it is possible to calculate the equilibrium cluster size distribution of the clusters solely from the knowledge of the bonding probability (see Materials and Methods). As this parameter is directly an outcome of Wertheim theory, the YAB model is amenable to a full analytical treatment, allowing one to obtain simultaneously the thermodynamic and the connectivity properties of the solutions, to be directly compared with the experimental results.
Comparison between theory and MC simulations
The mAbs modeled as patchy Y-shaped colloids self-associate into clusters with increasing concentration through reversible bonds, as a result from the attraction between and patches. Their assembly can be monitored by focusing on the variation of the bonding probability and the distribution of clusters of size as a function of the two parameters controlling the assembly: the attractive strength , where is the well depth of the square-well attraction between and patches (see Materials and Methods), is the temperature and is the Boltzmann constant, and the mAb concentration .
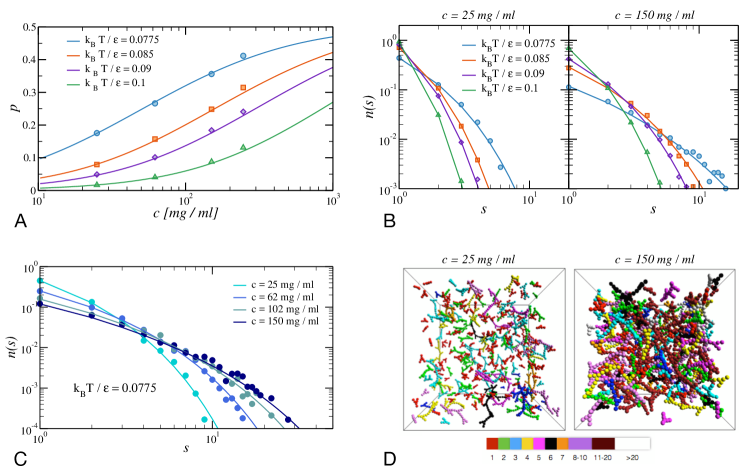
We report in Fig. 3 some representative results comparing theory and simulations, including the bond probability and the cluster size distributions for different concentrations and attraction strengths. In all cases, we find that there is quantitative agreement between theory and simulations for both thermodynamics and cluster observables. Thus, we can confidently use the results of the theoretical approach in order to compare with experimental results.
Structural Properties
In order to analyze the measured , we calculate the isothermal compressibility for our YAB model, since is related to the , the static structure factor at , as
| (1) |
which in turn is related to the experimentally determined apparent weight average molar mass by where is the molar mass of a monomer. In a solution where antibodies self-assemble into larger clusters described via Wertheim theory, static light scattering thus provides an apparent weight average aggregation number given simply by
| (2) |
where is the apparent aggregation number, with being the molar mass of a monomer.
When trying to understand self-assembly in mAb solutions, we need to be able to account for both the average aggregation number, , as well as the resulting interaction effects between the antibody clusters, given by . Using Wertheim theory, we can calculate the free energy and differentiate it twice in order to get . As described in more details in Materials and Methods, the free energy is the sum of a hard-sphere reference term plus a bonding term. The reference HS term is the Carnahan-Starling (CS) free energy of an equivalent HS system. Since mAbs are not spherical, we cannot directly use the actual volume fraction given by the number density of mAbs and the volume of a monomer, but we rather need to determine an equivalent hard sphere diameter of the Y-molecule. We thus calculate for different values of and and compare it to the measured data.
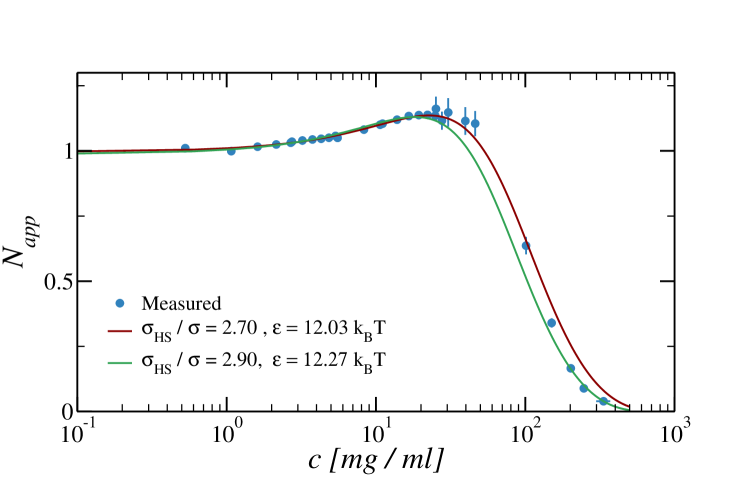
By fitting the theoretical results to the experiments as described in Materials and Methods, we determine the two unknown parameters: the strength of the interaction and the equivalent HS diameter. Fig. 4 compares for the YAB model to the SLS data and we find that the best fit of the data, particularly correctly describing the high concentration behavior which is most relevant for the viscosity to be discussed later, is obtained with an effective hard sphere diameter of and a strength of the AB patch-patch attraction given by . Note that the estimated value of is considerably smaller than the geometric diameter of the Y molecule, thus accounting for the penetrability of the Y-shaped antibodies. When converted in real units, an effective HS radius of is found, which also compares well with the measured radius of gyration of the antibody molecule .
Dynamic Properties
Having analyzed the SLS data using Wertheim theory, we now have a prediction for the effect of concentration on the self-assembling behavior of mAbs and we can thus calculate the cluster size distributions at all concentrations thanks to HPT. Next we make an attempt to test the consistency of these results with the data obtained using DLS for the same samples shown in Fig. 1B. Unfortunately, this is much less straightforward than the analysis of the SLS data and requires an additional coarse graining step, illustrated in Fig. 5. The main problem here is that we currently lack a theoretical model that would allow us to calculate the effective or apparent hydrodynamic radius of concentrated solutions of polydisperse antibody clusters. We thus propose an approach in which we use the self-assembled clusters of the patchy model and treat them as new interacting objects. Their dominant interaction is of course excluded-volume and, hence, we consider them as effective polydisperse hard spheres, each with its own radius resulting from its size in terms of monomers. To go one more step, we also consider them as sticky hard spheres.
Within this approach we first calculate the -average Schurtenberger and Newman (1993) hydrodynamic radius of the mAb solutions using the cluster size distributions obtained theoretically. Next we model the solutions at each concentration as dispersions of colloids with a size given by and an effective hard sphere volume fraction . The influence of interparticle interactions on the resulting collective diffusion coefficient, or , is calculated by treating the spheres either as hard or sticky hard spheres, for which accurate expressions exist.
First, we need to determine the hydrodynamic radius of mAb clusters of a given size . Clusters of mAbs of a given size were generated randomly, where the clusters also have to satisfy the criterion of self-avoidance and where each monomer in a cluster is allowed to have a maximum of 3 connections, i.e. reflecting the YAB structure imposed in Wertheim theory and HPT. For each individual cluster its hydrodynamic radius was then calculated using the program HydroproOrtega et al. (2011), and average values were calculated from 100 individual clusters. This resulted in a data set of vs that was well reproduced by the phenomenological relationship , where is given in .
With this relationship and assuming hard sphere-like interactions between the different clusters, we can now calculate the concentration dependence of both and . The expression for the measured apparent molecular mass in this coarse grained model is , where is the weight average molar mass of the clusters. Note that the static structure factor introduced here has a different definition than introduced in Eq. 1, and now corresponds to the effective structure factor of a solution of polydisperse spheres, reflecting the fact that the mAb clusters and not the individual antibodies are the new interacting objects. The apparent weight average aggregation number is then given bySchurtenberger and Newman (1993)
| (3) |
The only adjustable parameter introduced by this step is the conversion of the weight concentration into the effective hard sphere volume fraction of the clusters. For hard spheres, we can exploit the Carnahan-Starling expression for the low wavevector limit of the static structure factor,
| (4) |
as well as the weight average aggregation number , obtained with Wertheim theory and HPT, in order to calculate using Eq. 3. In doing these calculations we fix the effective diameter of each antibody molecule (Fig. 4).
The effective cluster HS volume fraction is calculated taking into account that the excluded volume contribution of an antibody in a cluster is equal to a sphere with a radius equal to the antibody radius of gyration and also that clusters are fractal, giving
| (5) |
where is the fractal dimension of the clusters and is the nominal antibody volume fraction () based on the geometric diameter of the molecule. Thus, in the coarse grained model we have an effective hard sphere volume fraction that is % higher than for the individual mAbs in the Wertheim analysis, which does not seem unrealistic because clusters cannot overlap as much as individual antibodies do. The resulting comparison of the model calculations with experiments provides a very good description of the data, as shown in Fig. 6 A.
In order to calculate we use the corresponding virial expression for the short time collective diffusion coefficient, which results in
| (6) |
where for hard spheres Banchio and Nagele (2008). Note that here we use the -average aggregation number in order to calculate . The agreement for with the results from the simple hard sphere model is quite good (Fig. 6B), except for the highest values of , where we expect Eq. 6 to fail and would instead need to include higher order terms. We also find that the apparent hydrodynamic radius obtained in DLS experiments is very sensitive to the interparticle interactions, and we can thus also look at a somewhat refined interaction model, where we also include the possibility of an additional weak attraction between different clusters. Here we use the so-called adhesive or sticky hard sphere model Piazza et al. (1998); Cichocki and Felderhof (1990), where we include an additional weak short-range attractive potential that could be due to the unbound attractive patches of the mAbs at the exterior of the clusters. In this model, Eqs. 4 and 6 then become
| (7) |
and
| (8) |
where is the stickiness parameter that is inversely proportional to the strength of the attractive interaction and is given by
| (9) |
The corresponding theoretical curves when is used as an additional fit parameter to the SLS and DLS data are also shown in Fig. 6A and B. In particular, a better description of the apparent hydrodynamic radius is obtained within the SHS model with , corresponding to a very weak additional attraction between the mAb clusters. While the approximations made in our coarse grained strategy may be too severe to say much about the exact nature of the effective interaction potential between the mAb clusters in solution, the experimental data are very well reproduced by our simple model. This indicates that the two chosen models, a pure hard sphere and an adhesive hard sphere interaction with moderate stickiness, likely bracket the true behavior of the self-assembling antibody investigated in this study.
Finally, as an ultimate test, we calculate the concentration dependence of the relative viscosity . We use the expression for developed by Mooney, which is often and successfully applied for mono- and polydisperse hard sphere colloidal suspensions Mooney (1951):
| (10) |
Here is a constant, which for hard spheres is 2.5, and is the maximum packing fraction, which depends on the polydispersity of the system. In order to estimate it, we have evaluated the polydispersity of our antibody clusters as a function of concentration and find that at the highest studied concentration it reaches about 45%. For such polydisperse hard spheres, the maximum packing fraction is Farr and Groot (2009). Using this value, we then should directly obtain the concentration dependence of from the previously determined relationship between and without any free parameter. The resulting comparison between the measured and calculated values of is shown in the bottom panel of Fig. 6, and the agreement is indeed quite remarkable given the lack of any free parameter. This clearly indicates that it is the excluded volume interactions between the self-associating clusters that is at the origin of the strong increase of the zero shear viscosity with increasing concentration, and our simple model is capable of predicting the measured -dependence based on static and dynamic light scattering experiments quantitatively.
Discussion and Conclusions
The self-assembly of monoclonal antibodies and its effect on the solution properties such as the viscosity is an important factor in determining our ability to develop high concentration formulations. However, there has been a lack of decisive experimental and theoretical approaches to obtain a quantitative and predictive understanding of antibody solutions. A recent theoretical study has proposed a patchy model for antibody moleculesKastelic et al. (2017), in which different types of patch-patch attractions were considered resulting in a large number of parameters to be adjusted to describe different experimental conditions. On the other hand, in the present work we define the simplest model based on electrostatic calculations for the specific type of immunoglobulin also studied experimentally within the same buffer and salt conditions. This very simple model is analytically solvable by well-established theories, in particular the combination of the Wertheim theory with hyperbranched polymer theory to predict the aggregation properties of the mAb solutions. We have also shown that both thermodynamic properties and cluster distributions are in quantitative agreement with MC simulations of the model, thus the theoretical predictions can be directly compared with experiments without suffering from numerical uncertainty. From the mAb self-assembly process built by the patchy interactions, we then employ a second coarse-graining step in which we consider our antibody clusters as the elementary units. We thus use the most basic description considering these clusters interacting essentially as hard spheres or sticky hard spheres with very moderate attraction, and apply available phenomenological descriptions to predict the dynamic properties of the system. This treatment does essentially not depend on any free parameter and is able to reproduce all measured data from SLS, DLS and microrheology. This simple model, based on very fundamental assumptions, thus provides an elegant way to consistently describe the thermodynamic and dynamical behavior of mAb solutions.
The patchy model that we have established also provides a robust estimate of the attraction between patchy binding sites through Wertheim theory, and thus will be an ideal starting point to investigate and quantitatively assess the effects of additional excipients or chemical modifications on the antibody interaction. Such information is vital for an advanced formulation strategy and attempts to predict antibody stability and the resulting viscosity from molecular information. Moreover, the combination of static scattering data and Wertheim/HPT to determine the interaction strength and the cluster size distribution as a function of concentration, and the subsequent test using DLS and (micro)rheology measurements without additional free parameters other than a rescaling of the volume fraction, allows us to critically test models for the type of interactions responsible for the self-association of a given mAb into clusters.
I Materials and Methods
Sample preparation
The mAb used in this study was a humanized IgG4 against trinitrophenyl , which was previously found to exhibit an increased viscosity at high concentrations Neergaard et al. (2013) (where it was labeled mab-C). It was manufactured by Novo Nordisk A/S and purified using Protein A chromatography, and subsequently concentrated to 100 mg/ml and buffer exchanged into a 10 mM Histidine buffer with 10 mM NaCl at pH 6.5.
For measurements, the sample was diluted and buffer exchanged to a 20mM Histidine pH 6.5 buffer containing 10 mM NaCl and subsequently concentrated using a 100 kD cutoff spinfilter (Amicon inc.). The concentrated sample was used as a stock solution for preparing the less concentrated ones. The concentration of each sample was determined by a series of dilutions followed by measurement of the absorption at 280nm using an extinction coefficient of . In order to assess the uncertainty of the concentration determination the dilution series was done in triplicates.
Light Scattering
The dynamic and static light scattering experiments were made using a 3D-LS Spectrometer (LS Instruments AG, Switzerland) with a 632nm laser, recording DLS and SLS data simultaneously. The measurements were conducted at scattering angle. Before measurement, the samples were transferred to pre-cleaned 5mm NMR tubes and centrifuged at 3000 g and 25 ∘C for 15 min, to remove any large particles and to equilibrate temperature. Directly after centrifugation, the samples were placed in the temperature equilibrated sample vat and the measurement was started after 5 minutes to allow for thermal equilibration. Additional low concentration SLS measurements were done using a HELIOS DAWN multi-angle light scattering instrument (Wyatt Technology Corporation, CA, USA), connected to a concentration gradient pump. Both instruments were calibrated to absolute scale using a secondary standard, allowing for direct comparison of the two data sets.
Microrheology
The zero shear viscosity was obtained using DLS-based tracer microrheology. Sterically stabilized (pegylated) latex particles were mixed with protein samples to a concentration of 0.01 v/v using vortexing and transferred to 5 mm NMR tubes. The sterically stabilized particles were prepared by cross-linking 0.75 kDa amine-PEG (poly-ethylene glycol) (Rapp Polymere, 12750-2) to carboxylate stabilized polystyrene (PS) particles (ThermoFischer Scientific, C37483) with a diameter of 1.0 m using EDC (N-(3-Dimethylaminopropyl)-N’-ethylcarbodiimide) (Sigma Aldrich, 39391) as described in detail in Garting and Stradner (2018). DLS measurements were performed on a 3D-LS Spectrometer (LS Instruments AG, Switzerland) at a scattering angle of 46-50∘ to stay away from the particle form factor minima and thus to maximise the scattering contribution from the tracer particles with respect to the protein scattering. Measurements were made using modulated 3D cross correlation DLS Block and Scheffold (2010) to suppress all contributions from multiple scattering that occur in the attempt to achieve conditions where the total scattering intensity is dominated by the contribution from the tracer particles. Samples were either prepared individually or diluted from more concentrated samples using a particle dispersion with the same particle concentration as in the sample as the diluent. The diffusion coefficient of the particles was then extracted from the intensity autocorrelation function using a 1st order cumulant analysis of the relevant decay. This diffusion coefficient is compared to that of particles in a protein-free buffer and the relative viscosity is extracted from the relationship between diffusion coefficient and viscosity in the Stokes-Einstein equation given by , where is the known hydrodynamic radius of the tracer particlesGarting and Stradner (2018); Furst and Squires (2017).
Isosurface calculations
The FAB domains were built using the antibody modeler tool in the Molecular Operating Environment (Chemical Computing Group Inc, Canada) computer programInc. (2011), whereas the FC domain was taken from a crystallographic structure with a similar FC domain found in the protein data bank (PDBID: 4B53) The electrostatic calculations were done in a two step process, using pdb2prq Dolinsky et al. (2007) and the automated poisson Boltzmann solverJurrus et al. (2018) (apbs) pymol plugin. The pdb2pqr server is hosted by the National Biomedical Computation Resource at http://nbcr-222.ucsd.edu/pdb2pqr_2.1.1/, and was used to calculate the protonation state of the FAB and FC domains at pH taking the local structure around the titratable residues into account. The prepared structures were then used by the apbs plugin to calculate an electrostatic map of the protein. The apbs was run using the default parameters, with the addition of Na+ and Cl- ions corresponding to a salt concentration of 10mM.
YAB Patchy model and MC simulations
The antibody molecule is represented as a symmetric -shaped particle, constructed from six hard spheres of diameter , as illustrated in Fig. 2B. Each mAb is decorated by 3 patches, one of type on the tail and two of type on the arms. Only interactions are taken into account based on the charge distribution on the surface of the mAb molecule in the studied buffer conditions, and are modeled as an attractive square well (SW) potential of range , which guarantees that each patch is engaged at most in one bond. For this model the geometric diameter of a single mAb molecule is that of the circle tangent to the external spheres: .
We perform standard MC simulations of YAB particles at different number densities where is the volume of the cubic simulation box. The unit of length is . To compare the experimental value of with simulations and theory, we consider the geometric radius of the Y-colloid equal to the hydrodynamic radius measured for a single mAb molecule, that is nm. With this choice we have that nm and, considering that the mass of a molecule is 150 kDa, an experimental concentration of 1 mg/ml corresponds to in simulation units.
Theory
In Wertheim theoryWertheim (1984); Tavares et al. (2010), the free energy of a system of particles in a volume , with number density , is calculated as the sum of a hard sphere reference term plus a bonding term. The bonding free energy per particle of the YAB model is
| (11) |
where and are the fractions of non-bonded patch of each species respectivelyJackson et al. (1988) and . For the model they are:
| (12) |
The reference HS system must be chosen according to the nature of the molecule. For non-spherical molecules, the HS reference system effective diameter is not known and needs to take into account correctly the excluded volume of the particles. This is established from the comparison to experiments. Once this is known, experimentally accessible quantities such as the osmotic compressibility of the system can be directly calculated from the expression of . From Eq. 12 we can calculate the expressions for the fractions of non bonded patches in terms of density and temperature, as
| (13) |
Instead of using these two variables, it is more convenient to refer to the so-called bond probability , defined as
| (14) |
While Wertheim theory directly provides overall quantities such as the compressibility or the fraction of bonded and groups as a function of , it does not yield the resulting cluster size distribution that would be needed for a comparison with other experimental quantities. We thus apply hyperbranched polymer theory (HPT) exploiting the fact that the YAB molecule is of the kind in HPT language with Rubinstein and Colby (2003). We consider to be the fraction of bonded groups (i.e. the bond probability of Wertheim theory defined above) and the fraction of bonded groups. There is one non-bonded group for each cluster, therefore the average number of monomers per cluster is the reciprocal of the fraction of unreacted groups. The only input then needed to evaluate the cluster size distribution is the bond probability , which we get from Wertheim theory. In the YAB model, calling () the fraction of () patchy sites, the cluster size distribution in the framework of hyperbranched polymer theory is finally given by
| (15) |
where is the probability of finding clusters of size for a system with bond probability . From the cluster size distributions calculated we then calculate the weight average, the -average and the polydispersity of the clusters for each concentration.
Finally in order to evaluate as a function of concentration, we simply perform a double derivative of the free energy in order to get the compressibility of the systemTavares et al. (2009).
Model fitting
All data are fitted using the orthogonal distance regression procedureBoggs and Rogers (1990); Boggs et al. (1992), which includes the experimental errors in both the x and y directions. The full set of fit parameters are given in table 1. For the hard sphere model fits shown in Fig. 6 two parameters are fitted: The bonding energy and a scaling factor of the SLS data. The scaling factor is introduced to correct for any errors in the calibration linking the scattering intensity to the apparent molecular mass, and should be close to one. For the sticky hard sphere model three parameters are fitted: The bonding energy, the stickiness parameter and a scaling factor for the SLS data. For the fits using the compressibility from Wertheim theory (figure 4), the first fit uses three free parameters, the bonding energy, a scaling factor of the SLS data and an effective hard sphere scaling factor. In the second fit the effective hard sphere scaling factor is locked to and only the bonding energy and scaling factor are fitted.
| Model fit | SLS scale | |||||
|---|---|---|---|---|---|---|
|
- | |||||
| Compressibility | - | |||||
| HS Model | - | |||||
| Sticky HS Model |
Generation of Antibody Clusters
The antibody clusters were generated using a molecular model of the antibody, from low concentration SAXS data [Article in preparation] constructed using the SAXS modeling software BUNCHPetoukhov and Svergun (2005). The FC and FAB domains (generated as described in the isosurface calculations section) were represented as rigid bodies, linked together with a flexible linker of dummy residues. The linker was further constrained by linking the dummy residues that represent the cysteine residues together to simulate the cysteine bridges in the hinge region of an IgG4.
To generate a self-associated antibody cluster containing N antibodies, the following procedure was used:
-
1.
An initial antibody was placed with its center of mass (CM) at the origin and oriented randomly.
-
2.
A new antibody is placed at a distance of 12.5 nm in a random direction from the initial antibody CM, and oriented randomly and a connection between them is recoded.
-
3.
From the already placed antibodies one is selected at random if it has less that 3 connections.
-
4.
A new antibody is now placed distance of 12.5 nm in random direction from the selected antibody, oriented randomly. The distance between the CM of the newly placed antibody and all other placed antibodies is calculated, and if it is 12.5 nm or more the connection is recorded. If not step 4 is repeated.
-
5.
Steps 3 and 4 are repeated until N antibodies have been placed.
For each association number, N, 100 clusters were produced using the method above.
Acknowledgments
This work was financed by the Swedish Research Council (VR; Grant No. 2016-03301), the Faculty of Science at Lund University, the Knut and Alice Wallenberg Foundation (project grant KAW 2014.0052), the European Research Council (ERC-339678-COMPASS and ERC-681597-MIMIC) and the European Union (MSCA-ITN COLLDENSE, grant agreement No. 642774).
References
- Nelson et al. (2010) A. Nelson, E. Dhimolea, and J. Reichert, Nat. Rev. Drug Discov. 9, 767 (2010).
- Reichert (2012) J. Reichert, MAbs 4, 413 (2012).
- Narasimhan et al. (2012) C. Narasimhan, H. Mach, and M. Shameem, Ther. Deliv. 3, 889 (2012).
- Shire (2009) S. Shire, Curr. Opin. Biotechnol. 20, 708 (2009).
- Neergaard et al. (2013) M. S. Neergaard, D. S. Kalonia, H. Parshad, A. D. Nielsen, E. H. Mller, and M. van de Weert, Eur. J. Pharm. Sci. 49, 400 (2013).
- Buck et al. (2014) P. M. Buck, A. Chaudhri, S. Kumar, and S. K. Singh, Mol. Pharmaceutics 12, 127 (2014).
- Godfrin et al. (2016) P. D. Godfrin, I. E. Zarraga, J. Zarzar, L. Porcar, P. Falus, N. J. Wagner, and Y. Liu, J. Phys. Chem. B 120, 278 (2016).
- Grimaldo et al. (2014) M. Grimaldo, F. Roosen-Runge, F. Zhang, T. Seydel, and F. Schreiber, J. Phys. Chem. B 118, 7203 (2014).
- Yearley et al. (2014) E. J. Yearley, P. D. Godfrin, T. Perevozchikova, H. Zhang, P. Falus, L. Porcar, M. Nagao, J. E. Curtis, P. Gawande, R. Taing, I. E. Zarraga, N. J. Wagner, and Y. Liu, Biophys. J. 106, 1763 (2014).
- Ando and Skolnick (2010) T. Ando and J. Skolnick, Proc. Natl. Acad. Sci. USA 107, 18457 (2010).
- Bucciarelli et al. (2015) S. Bucciarelli, L. Casal-Dujat, C. De Michele, F. Sciortino, J. Dhont, J. Bergenholtz, B. Farago, P. Schurtenberger, and A. Stradner, J. Phys. Chem. Lett. 6, 4470 (2015).
- Bucciarelli et al. (2016) S. Bucciarelli, J. S. Myung, B. Farago, S. Das, G. A. Vliegenthart, O. Holderer, R. G. Winkler, P. Schurtenberger, G. Gompper, and A. Stradner, Sci. Adv. 2, e1601432 (2016).
- Foffi et al. (2014) G. Foffi, G. Savin, S. Bucciarelli, N. Dorsaz, G. M. Thurston, A. Stradner, and P. Schurtenberger, Proc. Natl. Acad. Sci. USA 111, 16748 (2014).
- Cardinaux et al. (2011) F. Cardinaux, E. Zaccarelli, A. Stradner, S. Bucciarelli, B. Farago, S. U. Egelhaaf, F. Sciortino, and P. Schurtenberger, J. Phys. Chem. B 115, 7227 (2011).
- Chari et al. (2009) R. Chari, K. Jerath, A. Badkar, and D. Kalonia, Pharm. Res. 26, 2607 (2009).
- Kanai et al. (2008) S. Kanai, J. Liu, T. Patapoff, and S. Shire, J. Pharm. Sci. 97, 4219 (2008).
- Yadav et al. (2010) S. Yadav, J. Liu, S. Shire, and D. Kalonia, J. Pharm. Sci. 99, 1152 (2010).
- Lilyestrom et al. (2013) W. Lilyestrom, S. Yadav, S. Shire, and T. Scherer, J. Phys. Chem. B 117, 6373 (2013).
- Scherer Thomas M. and P. (2010) S. S. J. Scherer Thomas M., Liu J. and M. A. P., The Journal of Physical Chemistry B 114, 12948 (2010).
- Connolly et al. (2012) B. Connolly, C. Petry, S. Yadav, B. Demeule, N. Ciaccio, J. Moore, S. Shire, and Y. Gokarn, Biophys. J. 103, 69 (2012).
- Schmit et al. (2014) J. Schmit, F. He, S. Mishra, R. Ketchem, C. Woods, and B. Kerwin, J. Phys. Chem. B 118, 5044 (2014).
- Yadav et al. (2012) S. Yadav, S. Shire, and D. Kalonia, J. Pharm. Sci. 101, 998 (2012).
- Yearley et al. (2013) E. Yearley, I. Zarraga, S. Shire, T. Scherer, Y. Gokarn, N. Wagner, and Y. Liu, Biophys. J. 105, 720 (2013).
- Saito et al. (2012) S. Saito, J. Hasegawa, N. Kobayashi, N. Kishi, S. Uchiyama, and K. Fukui, Pharm. Res. 29, 397 (2012).
- Scherer (2013) T. Scherer, J. Phys. Chem. B 117, 2254 (2013).
- Castellanos et al. (2014) M. Castellanos, J. Pathak, W. Leach, S. Bishop, and R. Colby, Biophys. J. 107, 469 (2014).
- Corbett et al. (2017) D. Corbett, M. Hebditch, R. Keeling, P. Ke, S. Ekizoglou, P. Sarangapani, J. Pathak, C. F. V. D. Walle, S. Uddin, C. Baldock, C. Avendano, and R. A. Curtis, J. Phys. Chem. B 121, 8276 (2017).
- Wertheim (1984) M. S. Wertheim, J. Stat. Phys. 35, 19 (1984).
- Rubinstein and Colby (2003) M. Rubinstein and R. Colby, Polymer Physics (Oxford University Press, 2003).
- Schurtenberger et al. (1996) P. Schurtenberger, R. Scartazzini, and P. Luisi, Rheol. Acta 12, 2894 (1996).
- Schurtenberger et al. (1989) P. Schurtenberger, C. Cavaco, F. Tiberg, and O. Regev, Langmuir 28, 372 (1989).
- Murphy et al. (1988) R. Murphy, H. Slayter, P. Schurtenberger, R. Chamberlin, C. Colton, and M. Yarmush, Biophys. J. 54, 45 (1988).
- Fusco et al. (2014) D. Fusco, J. J. Headd, A. De Simone, J. Wang, and P. Charbonneau, Soft matter 10, 290 (2014).
- Roosen-Runge et al. (2014) F. Roosen-Runge, F. Zhang, F. Schreiber, and R. Roth, Scientific reports 4, 7016 (2014).
- Li et al. (2015) W. Li, B. A. Persson, M. Morin, M. A. Behrens, M. Lund, and M. Zackrisson Oskolkova, The Journal of Physical Chemistry B 119, 503 (2015).
- Quinn et al. (2015) M. Quinn, N. Gnan, S. James, A. Ninarello, F. Sciortino, E. Zaccarelli, and J. McManus, Physical Chemistry Chemical Physics 17, 31177 (2015).
- McManus et al. (2016) J. J. McManus, P. Charbonneau, E. Zaccarelli, and N. Asherie, Current Opinion in Colloid & Interface Science 22, 73 (2016).
- Cai et al. (2017) J. Cai, J. Townsend, T. Dodson, P. Heiney, and A. Sweeney, Science 357, 564 (2017).
- Cai and Sweeney (2018) J. Cai and A. M. Sweeney, ACS central science 4, 840 (2018).
- Ruzicka et al. (2011) B. Ruzicka, E. Zaccarelli, L. Zulian, R. Angel ini, M. Sztucki, A. Moussaïd, T. Narayanan, and F. Sciortino, Nat. Mater. 10, 56 (2011).
- Biffi et al. (2015) S. Biffi, R. Cerbino, G. Nava, F. Bomboi, F. Sciortino, and T. Bellini, Soft Matter 11, 3132 (2015).
- Bomboi et al. (2016) F. Bomboi, F. Romano, M. Leo, J. Fernandez-Castanon, R. Cerbino, T. Bellini, F. Bordi, P. Filetici, and F. Sciortino, Nature Communications 7 (2016).
- Schurtenberger and Newman (1993) P. Schurtenberger and M. E. Newman, “Characterization of biological and environmental particles using static and dynamic light scattering,” in Environmental Particles, Vol. 2 (Lewis Publishers, 1993) pp. 37–115.
- Ortega et al. (2011) A. Ortega, D. Amoros, and J. G. de la Torre, Biophys. J. 101, 892 (2011).
- Banchio and Nagele (2008) A. J. Banchio and G. Nagele, The Journal of Chemical Physics 128, 104903 (2008).
- Piazza et al. (1998) R. Piazza, V. Peyre, and V. Degiorgio, Phys. Rev. E 58, 2733 (1998).
- Cichocki and Felderhof (1990) B. Cichocki and B. U. Felderhof, J. Chem. Phys. 93, 4427 (1990).
- Mooney (1951) M. Mooney, J. Colloid Interface Sci. 6, 162 (1951).
- Farr and Groot (2009) R. S. Farr and R. D. Groot, J. Chem. Phys. 131, 244104 (2009).
- Kastelic et al. (2017) M. Kastelic, K. A. Dill, Y. V. Kalyuzhnyi, and V. Vlachy, Journal of Molecular Liquids (2017).
- Garting and Stradner (2018) T. Garting and A. Stradner, Small (2018), 10.1002/smll.201801548.
- Block and Scheffold (2010) I. D. Block and F. Scheffold, Rev. Sci. Instrum. 81, 123107 (2010).
- Furst and Squires (2017) E. Furst and T. Squires, Microrheology (Oxford University Press, 2017).
- Inc. (2011) C. C. G. Inc., “Molecular Operating Environment (MOE), 2011.10,” (2011).
- Dolinsky et al. (2007) T. J. Dolinsky, P. Czodrowski, H. Li, J. E. Nielsen, J. H. Jensen, G. Klebe, and N. A. Baker, Nucleic Acids Research 35, 522 (2007).
- Jurrus et al. (2018) E. Jurrus, D. Engel, K. Star, K. Monson, J. Brandi, L. E. Felberg, D. H. Brookes, L. Wilson, J. Chen, K. Liles, M. Chun, P. Li, D. W. Gohara, T. Dolinsky, R. Konecny, D. R. Koes, J. E. Nielsen, T. Head-Gordon, W. Geng, R. Krasny, G.-W. Wei, M. J. Holst, J. A. McCammon, and N. A. Baker, Protein Science 27, 112 (2018), https://onlinelibrary.wiley.com/doi/pdf/10.1002/pro.3280 .
- Tavares et al. (2010) J. Tavares, P. Teixeira, M. T. de Gama, and F. Sciortino, J. Chem. Phys. 132, 234502 (2010).
- Jackson et al. (1988) G. Jackson, W. Chapman, and K. Gubbins, Mol. Phys. 65, 1 (1988).
- Bianchi et al. (2006) E. Bianchi, J. Largo, P. Tartaglia, E. Zaccarelli, and F. Sciortino, Phys. Rev. Lett. 97, 168301 (2006).
- Bianchi et al. (2008) E. Bianchi, P. Tartaglia, E. Zaccarelli, and F. Sciortino, J. Chem. Phys. 128, 144504 (2008).
- Tavares et al. (2009) J. Tavares, P. Teixeira, and M. T. de Gama, Mol. Phys. 107, 453 (2009).
- Boggs and Rogers (1990) P. T. Boggs and J. E. Rogers, in Statistical analysis of measurement error models and applications: proceedings of the AMS-IMS-SIAM joint summer research conference held June 10-16, 1989, with support from the National Science Foundation and the US Army Research Office, Vol. 112, edited by P. J. Brown and W. A. Fuller (American Mathematical Soc., 1990) p. 186.
- Boggs et al. (1992) P. Boggs, R. Byrd, J. Rogers, and R. Schnabel, Software for weighted orthogonal distance regression, Natural Institute of Standards and Technology, Gaithersburg (1992).
- Petoukhov and Svergun (2005) M. V. Petoukhov and D. I. Svergun, Biophysical Journal 89, 1237 (2005).