Atomistic Mechanism of the Nucleation of Methylammonium Lead Iodide Perovskite from Solution
Abstract
In the ongoing intense quest to increase the photoconversion efficiencies of lead halide perovskites, it has become evident that optimizing the morphology of the material is essential to achieve high peformance. Despite the fact that nucleation plays a key role in controlling the crystal morphology, very little is known about the nucleation and crystal growth processes. Here, we perform metadynamics simulations of nucleation of methylammonium lead triiodide (MAPI) in order to unravel the atomistic details of perovskite crystallization from a -butyrolactone solution. The metadynamics trajectories show that the nucleation process takes place in several stages. Initially, dense amorphous clusters mainly consisting of lead and iodide appear from the homogeneous solution. These clusters evolve into lead iodide (PbI2) like structures. Subsequently, methylammonium (MA+) ions diffuse into this PbI2-like aggregates triggering the transformation into a perovskite crystal through a solid-solid transformation. Demonstrating the crucial role of the monovalent cations in crystallization, our simulations provide key insights into the evolution of the perovskite microstructure which is essential to make high-quality perovskite based solar cells and optoelectronics.
Introduction
Hybrid organic-inorganic perovskites with the generic formula ABX3 (where A is a monovalent cation, i.e. methylammonium(MA+), formamidinium(FA+) or Cs+, B is a divalent cation such as Pb2+ or Sn2+, and X stands for I-, Br- or Cl-) have shown remarkable optoelectronic properties with applications ranging from highly efficient low-priced solar cells [1, 2, 3] to light-emitting diodes [4] and photodetectors [5]. Over the last years, it has been established that the performance of perovskite solar cells [6, 7, 8, 2][9], perovskites based LEDs and optoelectronics[10, 11] depends crucially on the morphology of the material[12, 13, 14, 15]. Various processing techniques[16, 17, 18] have been developed to obtain optimal results. These involve the use of additives [19, 8], anti-solvents[20], variations in the reaction temperature[21] or the use of visible light [22][23] during nucleation. However, due to the lack of understanding of the crystallization process, these attempts have been confined to purely empirical trial-and-error strategies.
Some experimental studies have been able to elucidate few features of the crystallization mechanism. Several reports [24, 25, 26, 27] have highlighted the importance of the lead halide coordination chemistry. In particular, based on the Tyndall effect, Yan et al. [28] found that nucleation takes a non-trivial route through the formation of colloids of various Pb-X complexes namely [PbX3]-, [PbX4]2-, [PbX5]3- and [PbX6]4-. Furthermore, the x-ray diffraction (XRD) and dynamic light scattering analysis by McMeekin et al. [29] suggested that such colloidal clusters serve as nucleation sites. Recently, Hu and co-workers [30] investigated the crystallization mechanism of perovskites with in-situ synchrotron-based grazing incidence XRD. They found an intermediate phase containing [PbI6]4- that precedes the formation of the perovskite crystal. Moreover, several experimental studies[31, 8] have demonstrated that the structural evolution of the intermediate adducts plays a key role in determining the ultimate performance of perovskites[27].
All of these studies suggest that crystallization proceeds via the formation of different complex intermediates. However, the nature and formation of these intermediate phases and their conversion into the perovskite structure have not been established. Knowledge about these fundamental aspects of crystallization would likely allow for a more rational control over the perovskite microstructure and thereby to materials with improved photoconversion efficiencies.
Molecular dynamics (MD) simulations can in principle provide in-depth atomistic level details of nucleation processes[32][33]. However, simulating the nucleation of organic-inorganic lead halide perovskites from solution is a very challenging problem. In fact, MD simulations on nucleation of such a complex hybrid organic-inorganic system have never been performed before. For one thing, due to the presence of several species, competing crystalline phases may exist and the nucleation pathway can be highly non-trivial. For another, nucleation is a rare event and the time scales of this process typically exceed the affordable times in standard MD simulations. To overcome the time scale limitation, in this work we employ well-tempered metadynamics (WTMetaD)[34][35].
Methylammonium lead triiodide (MAPI) has been the champion of halide perovskite materials and is the current most studied among this class of materials. We perform WTMetaD simulations to study the nucleation mechanism of MAPI from a -butyrolactone (GBL) solution which is one of the most commonly used solvents for the crystallization of lead halide perovskites [36, 20, 37, 17, 38, 39]. Our WTMetaD simulations demonstrate that nucleation of MAPI from solution is a multi-step process. In this work, we describe the mechanism of the individual stages and present the atomistic details about the formation of intermediate phases and their conversion to the perovskite crystal.
Results
We start from a well equilibrated solution where the MA+, Pb2+ and I- ions are initially homogeneously distributed in GBL. We have prepared two diferent simulation setups and will refer to them as simulation (A) and simulation (B). Simulation (B) has a lower concentration of solute species as compared to simulation (A). Further details are provided in the Methods section. In both cases different Pb-I complexes, such as [PbI2], [PbI3]- and [PbI4]2- are formed spontaneously in these solutions with a uniform distribution over the solution. These inital configurations are shown in Fig. 1a and the Supplementry Fig. S8a for simulation (A) and simulation (B), respectively.
As expected, during the course of standard (unbiased) MD simulations, no formation of a perovskite phase is observed due to the presence of a high free energy barrier. This free energy barrier can be rationalized on the basis of classical nucleation theory, which portrays the formation of crystalline clusters as an interplay between volume and surface contributions. In a macroscopic system, this leads to a free energy barrier for the formation of a cluster of a critical size. Before the critical cluster forms, the system undergoes order and density fluctuations that can be descibed as clusters of relatively small size. Eventually, a critical cluster is formed and the system is able to surmount the barrier. Further increase in the cluster size is spontaneous. At variance with this picture, in a confined system as the one used in our simulations, the solution becomes depleted of solute atoms as the cluster grows thus decreasing the supersaturation with time. As a consequence, a finite size cluster is not stable. However, this unwanted effect does not distort the crystallization path as previous experience has shown [32][33].
To accelerate the rare nucleation process in such a way that it can be observed within our limited simulation time of the order of microseconds, we employ well-tempered metadynamics (WTMetaD) in order to enhance the thermal fluctuations. WTMetaD constructs an external bias potential as a function of a few collective coordinates also known as collective variables (CVs). This bias potential discourages frequently visited configurations thus enhancing the fluctuations of the CVs and helping the system to overcome free energy barriers.
An appropriate choice of CVs is essential to the success of WTMetaD simulations. We have chosen two CVs to describe the nucleation process. The first (SP) is the number of MA+ ions that have a coordination with MA+, Pb2+ and I- which is compatible with the perovskite phase. We also use SP to represent the degree of crystallinity in the system. The second one (SPbI6) is the number of Pb2+ ions coordinated by six I-. Further details about the CVs are described in the Methods section.
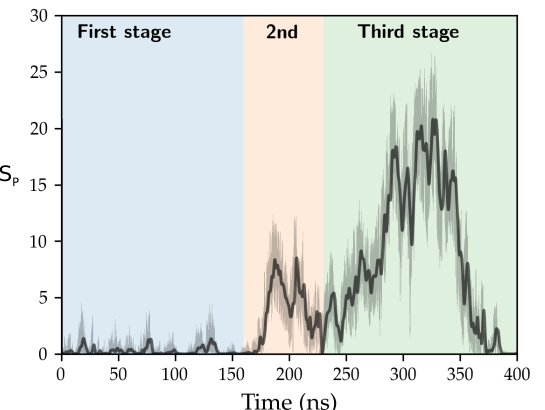
During the course of the WTMetaD simulations, perovskite crystals ultimately form in both simulations. This is also shown in Supplementary movies 1 and 3 for simulations (A). The formation of these large crystals is shown in Fig 1f for simulation (A), in the Supplementary Fig. S8d for simulation (B). We have identified three different stages of the simulation trajectories that correspond to different steps during the nucleation and crystallization process as depicted in Fig 2 for simulation (A). At the first stage, amorphous clusters of Pb-I complexes emerge from the solution. In the second stage, the amorphous clusters partially transform into the perovskite structure. In the last stage of our trajectories, the crystal grows by sequential addition and arrangement of ions around the initial nucleus. In the next paragraphs, we describe each stage in detail for simulation (A). We have observed a similar qualitative nucleation mechanism in simulation (B) and the results of the latter are presented in the Supplementary Information (SI).
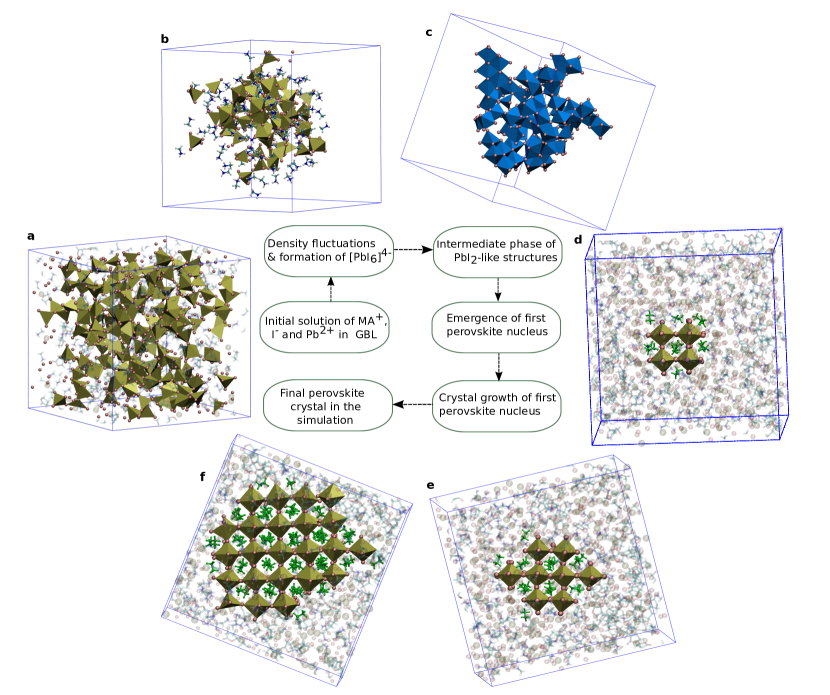
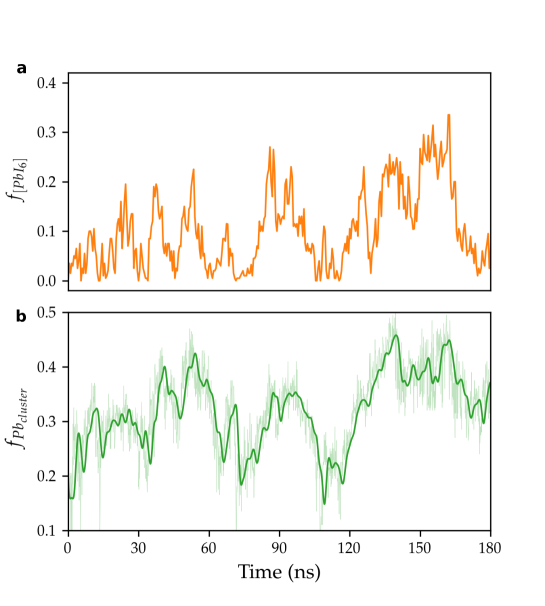
At the first stage, we observe increased fluctuations in the number of [PbI6]4- octahedra as shown in Fig. 3a. The relative increase in the coordination of Pb2+ with I- is achieved by two or more Pb2+ sharing the same I-. As a result, clusters made from face or edge-sharing [PbI6]4- octahedra are formed. The time evolution of edge-sharing octahedra is presented in Supplementary Fig. S4. This is in contrast to the network of corner sharing [PbI6]4- octahedra that is characteristic for the final perovskite structure. MA+ ions surround the [PbI6]4- clusters to compensate the large negative charge. These processes increase the local density of solute species. From Fig. 3, we observe that eventually [PbI6]4- can transform back to lower order iodoplumbates but the high local density of solute species is preserved. In order to quantify the local density fluctuations, we have performed a clustering of Pb2+ ions that are coordinated by at least three I- ions within a radial cutoff of 0.40 nm. Further details on the calculations of the size of these clusters are presented in the SI. At the end of this stage, after 140 ns, Pb2+ and I- ions have formed relatively large amorphous clusters as depicted in Fig. 1b.
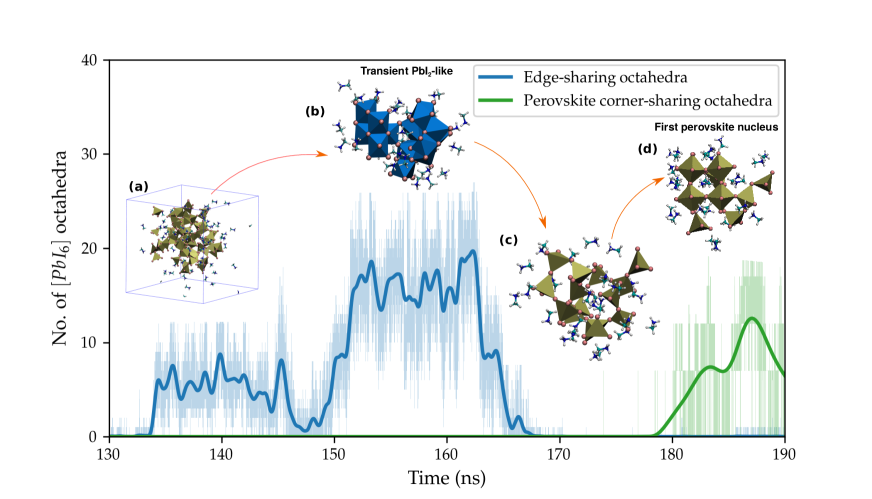
In the next stage, a part of the amorphous clusters transforms into perovskite. It has been shown that PbI2-like structures can be important intermediates (or byproducts) in the crystallization of MAPI [31, 20, 41]. Therefore, we quantify the formation of PbI2-like structures in terms of the number of edge-sharing [PbI6]4- octahedra that share at least three edges with neighbouring [PbI6]4- octahedra. We also assess the amount of perovskite formed in the solution. To do so, we calculate the number of corner-sharing [PbI6]4- octahedra that share all six corners with neighbouring [PbI6]4- and Pb-I-Pb angles between them that are consistent with the cubic perovskite structure of MAPI at high temperature. Further details on selecting the angle cutoff and calculations of corner-sharing octahedra are provided in the SI. In Fig. 4, we show the number of edge-sharing and corner-sharing pervovskite octahedra as a function of simulation time. Initially, we observe that the number of edge-sharing octahedra increases and attains a maximum value at 161 ns. The configuration of edge-sharing octahedra at this time is shown in Fig. 4, Fig. 1c and the Supplementary Fig. S3.
From Supplementary Fig. S3 one can see that individual parts of these configurations show a remarkable resemblance to the rocksalt crystalline structure. However, these clusters are not big and are arranged in a way that leaves adequate space between them, therefore we qualitatively name the whole structure a PbI2-like structure. Moreover, in the SI we show a detailed pictorial distribution of the clusters of PbI2-like structures of edge-sharing octahedra. From the analysis presented in the Supplementary Fig. S1, it is evident that 95% of the edge-sharing octahedra later convert to the perovskite structure. In the snapshots of Fig. 4, the time evolution of the ions that form the first perovskite structure is shown.
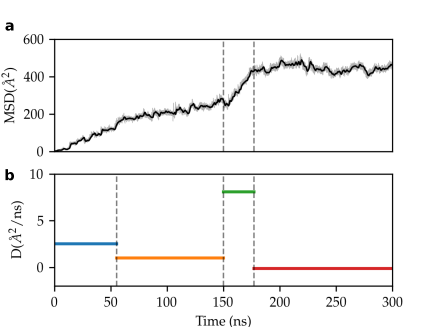
Moving further along the trajectory the PbI2-like structure starts to transform into [PbI4]2- tetrahedra. This can be seen in Fig 4 where the number of edge-sharing octahedra decreases. Since the PbI2-like structure opens up, space is created between Pb-I complexes. During this process, MA+ ions diffuse into these spaces between them. This mechanism can be observed in the snapshots of Fig. 4. To quantify the diffusion of MA+ ions, we have calculated the selfdiffusion coefficient (D) of the subset of MA+ ions that form the first perovskite crystal. From Fig. 5, a sharp increase in the diffusion of the MA+ ions from 155 to 177 ns can be noticed. The sharp increase in D of MA+ ions takes place during the time interval where PbI2-like structures are the most abundant. This suggests that the formation of PbI2 seems to be correlated with the diffusion of MA+ ions inside the Pb-I clusters. From snapshot (c) in Fig. 4, one can see that MA+ ions are located in the vicinity of [PbI4]2- tetrahedra.
Around 180 ns this structure rearranges into perovskite corner-sharing [PbI6]4- octahedra with MA+ ions in the center of cubo-octahedral cages. A snapshot of the first born perovskite crystal is shown in Fig.4. It can also be seen in Fig. 4 that there is an increase in the number of perovskite corner-sharing octahedra compatible with the formation of a perovskite phase. Also, as seen in Fig.5, the diffusion diminishes substantially implying that the MA+ ions have become part of the newly formed perovskite crystal. This whole process is also shown in Supplementary movie 2.
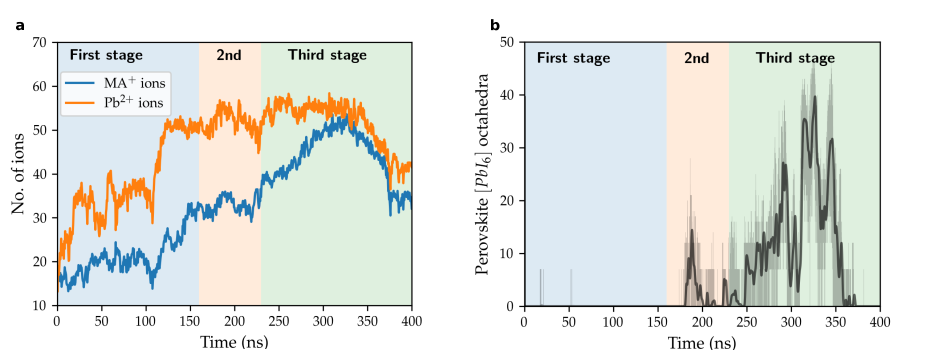
At the final stage, the initial perovskite crystal grows as shown in Fig. 2. Snapshots illustrating this process are displayed in Fig. 1d-f. During this process, MA+ ions from solution come to the surface of the perovskite crystal. To quantify this, we select the MA+ and Pb2+ ions that form the largest perovskite crystal shown in Fig. 1f and calculate the concentration of these ions in a specific region around the center of the first perovskite nucleus. The dimensions of this region are selected based on the size of the largest observed crystal corresponding to simulation time 327ns. We find that the concentration of Pb2+ ions at this stage remains approximately the same after the first stage. However, it can be observed from Fig. 6a that there is a continuous increase in the concentration of MA+ ions around the center of the nucleus and that reaches a maximum at 327ns. This strongly suggests that MA+ ions have a fundamental role in the nucleation process. As the MA+ ions reach the surface of the crystal, a simultaneous formation of perovskite corner-sharing octahedra around these MA+ ions occurs. This can be seen from the increase in the number of corner-sharing octahedra in Fig. 6b and the increase in in Fig. 2. Around 327 ns, the crystal attains its maximum size and afterwards it gradually dissolves due to the above mentioned depletion effect in a finite size system.
Discussion
From these results, the following qualitative description of the nucleation process of MAPI perovskite from solution is emerging: Nucleation starts from the formation of aggregates of Pb2+ and I-. This result is in general agreement with the experimental studies from Yan et al.[28] and Kadro et al.[38] where colloids of Pb-I complexes display the Tyndall effect even at higher temperatures.
Afterwards, these aggregates evolve into clusters of edge-sharing [PbI6]4- octahedra and a PbI2-like intermediate phase is formed. Here we present the configuration of these intermediates and find that rocksalt type structure of edge-sharing octahedra dominate the PbI2-like intermediate phase. Eventually, MA+ ions diffuse inside the Pb-I clusters and the PbI2-like intermediate phase transforms into perovskite. In addition, we have identified that the continuous diffusion of MA+ ions into Pb-I clusters is key to the nucleation and growth of perovskite. Furthermore, our results suggest that the formation of a PbI2-like phase might facilitate the diffusion of MA+ ions into the Pb-I clusters.
These insights leads us to some generalized rules for controlling the nucleation process to optimize the shape and size of perovskite crystals. Perovskite thin films with larger grains are known to have high efficiency. From our simulations, we have found that controlling the diffusion of MA+ ions can in principle control the nucleation process. Therefore, by selecting typical solvents or additives that form strong intermediate interaction with MA+ ions, one can slow down the nucleation process to make larger grains or single crystals. Furthermore, lowering the concentration of MA+ ions in precursor solutions may result in larger nucleus size. Moreover, from our simulations, we can anticipate that the shape of perovskite crystals strongly depends on the structures of intermediate PbI2-like phases. Although, our simulations does not clearly outline the different metastable structures of edge-sharing [PbI6]4- octahedra, however aggregates with rocksalt structure of these edge-sharing octahedra emerge as one of the main configuration. The evolution of intermediate structure formation might depend on solvents and additives, which can be further explored in future studies based on the methodology presented in this work.
Conclusions
To conclude, in this work we employ WTMetaD simulations to uncover the salient atomistic features of the nucleation of MAPI from solution. This work constitutes a significant advancement in the field of MD simulations of nucleation of complex multicomponent systems from solution. These simulations reveal that a PbI2-like phase appears from the clusters of Pb2+ and I- before the onset of nucleation. This is followed by the diffusion of MA+ ions into PbI2-like aggregates triggering the transformation into a perovskite. In this study, the relevant intermediate steps of the entire process were characterized with atomic detail. This mechanistic understanding of the nucleation process might help in the design of improved strategies to better control perovskite morphology to produce highly efficient perovskite based solar cells, LEDs, and photodetectors. Furthermore, our work lays the foundations to study the atomistic details of nucleation and crystal growth of different perovskites.
Methods
MD simulations
Simulation (A) discussed in this work was prepared with 200 units of PbI2 and 200 units of MAI, which are randomly distributed in 112 GBL molecules by using the insert-molecule utility of the gromacs simulation package. Simulation (B) was prepared in the same way with 180 units of PbI2 and 180 units MAI randomly distributed in 368 GBL molecules. A fixed point charge force field was chosen for MAPI [44] that is known to reproduce the high temperature cubic phase and the generalized amber force field (GAFF)(http://virtualchemistry.org/) was used for GBL. The heterogeneous solute-solvent Van der Walls (VdW) parameters were calculated based on the mixing rules. In the force field for MAPI from Mattoni at el.[44], the VdW parameters of Pb2+ and I- are modelled with a Buckingham-type potential. Therefore to calculate the heterogeneous solute-solvent parameters with mixing rules, we used the lennard-jones parameters of Pb2+ and I- from Gutierrez-Sevillano at el.[45]. We have chosen a 1.0 nm cutoff for nonbonded interactions and three-dimensional periodic boundary conditions were applied for each simulation. Long range electrostatic interactions are treated with the particle-particle-particle-mesh Ewald method. We employ the SHAKE algorithm[46] to constrain the bond length of hydrogen atoms. The time step used in all of the simulations is 2 fs. All simulations are performed with the Large-scale Atomic/Molecular Massively Parallel Simulator(LAMMPS) code (31 Mar 2017)[47]. The systems were first minimized with a conjugate gradient algorithm with a tolerance of maximum residual force of 10-3 kcal/mole-Å. After minimization, the systems were relaxed with a 100ps NVT equilibration run. All production run simulations presented in this work were carried out in the isothermal-isobaric ensemble. We use a velocity rescaling thermostat [48] with a relaxation time of 0.1 ps. The Parrinello-Rahman barostat [49] was used to keep the pressure equal to the standard atmospheric pressure. The relaxation time of the barostat was set to 10ps. With this setup, at first we equilibrate the fully solvated simulations for 500 ps. In this way, the ions are uniformly dispersed in the solvent and density inhomogeneities are eliminated. After completing the equilibration run, the production WTmetaD run was started for longer time scales, typically up to 400 ns. WTmetaD simulations were performed with a set of CVs which are described in detail in the next section.
Collective variables
The choice of the CVs is critical to be able to describe the crystallization from enhanced sampling simulations such as WT-MetaD. It is essential to carefully select the appropriate collective variables (CVs) which can enhance the fluctuations in the local order of crystalline species that form in solution. A multitude of CVs have been used to study crystallization, however most of them can only force the system to crystallize in specific crystalline structures. In this work, we propose a new CV named SP, that does not presume a specific crystalline phase of MAPI. Thus, it enables us to observe all complexes that form before the onset of nucleation and reveal important details about the early stages of nucleation. This CV describes the local order of the species as a product of the individual local densities of MA+, Pb2+ and I- centers around MA+. Here, we represent MA+ with the position of the center of C-N axis of the MA+ ion. At first, we represent the local densities in the form of coordination numbers () of individual species MA+, Pb+ and I- surrounding the position i in the center of C-N axis of MA+ within a defined cutoff radius ().
| (1) |
Where is the distance between positions of i and j. The values for are selected based on the first minium of the radial distribution function (g(r)) of MA+ in the perovskite structure. To calculate the local densities, , we define another switching function in the space of coordination numbers.
| (2) |
Where is the lower threshold of the coordination number. The values for are chosen equal to the number of MA+, Pb2+ and I- in the first coordination sphere of MA+ in the perovskite structure of MAPI. The local order around i is calculated by multiplying the individual local densities of each species.
| (3) |
The final expression for the CV becomes the following:
| (4) |
Where is the number of MA+ ions around which the variables are defined. We have implemented this CV in PLUMED-2.4[50]. The values for and that are used in our simulation are shown in the following table.
Table 1: Values for the switching functions used in SP
o 0.8 | X[c] | X[c] | X[c] |
Species
MA+ - MA+
0.75nm
6.0
MA+ - Pb2+
0.70nm
8.0
MA+ - I-
0.55nm
12.0
The second CV, SPbI6 is defined as the number of Pb2+ ions that have a coordination of six with I- within a certain threshold. At first, we calculate the coordination number of Pb2+ with I-.
(5)
Where is the distance between positions of i and j. Here i and j represent the indices of Pb2+ and I-. Then we define another switching function in the space of coordination number of Pb-I.
(6)
The values for rPb-Icut and fPb-Icut are taken as 0.39 nm and 6. The height of the Gaussian bias potentials is set to 2kBT. The width of the Gaussian bias potentials is set to 0.5 and 1.0 for SP and SPbI6 respectively. The Gaussian hills are deposited after every 1 ps. We have chosen a bias factor of 300 that allows for an extensive exploration of hundreds of solute molecules contained in a typical simulation box. More theoretical details on WTmetaD can be found in references[35][34].
Code availability
All of the codes used in this study such as the calculations of the reaction coordinate , edge-sharing octahedra, perovskite corner-sharing octahedra and plumed input files, are freely available from the corresponding author upon request. In future, these codes will be made available in a new release of the PLUMED software.
Data availability
The simulation data that support the findings of this study is available from the corresponding author upon request.
References
Acknowledgements
P.A. thanks Michele Ceriotti, Omar Valsson, Claudio Perego and Simone Meloni for useful discussions. P.A. thanks in particular to Michele Ceriotti for highly insightful conversation and criticism of the work. P.A. is greately thankful to Claudio Perego and Omar Valsson for their support, encouragement and precious advice. M.P. acknowledge funding from European Union Grant No. ERC-2014-AdG-670227/VARMET. This research is funded by Swiss National Science Foundation through the NCCR MUST and individual grant 200020-165863. The computational time for this work was provided by the Swiss National Supercomputing Center (CSCS) under project s672. All calculations were performed in CSCS clusters Piz Daint.
Author information
Affiliations
Laboratory of Computational Chemistry and Biochemistry, Ecole Polytechnique Fédérale de Lausanne, CH-1015 Lausanne, Switzerland;
Paramvir Ahlawat & Ursula Rothlisberger
Department of Chemistry and Applied Biosciences, Eidgenossische Technische Hochschule (ETH) Zurich c/o Università della Svizzera Italiana Campus, 6900 Lugano, Switzerland;
Michele Parrinello
Facoltà di Informatica, Instituto di Scienze Computationali, and National Center for Computational Design and Discovery of Novel Materials (MARVEL), Università della Svizzera Italiana, 6900 Lugano, Switzerland;
Pablo Piaggi & Michele Parrinello
Theory and Simulation of Materials, École Polytechnique Fédérale de Lausanne, c/o Università della Svizzera Italiana Campus, 6900 Lugano, Switzerland;
Pablo Piaggi
Laboratory of Photonics and Interfaces, Ecole polytechnique Fédérale (EPFL) de Lausanne, Lausanne, Switzerland
Michael Graetzel
Contributions
M.G., M.P. and U.R. conceived the research and contributed to the interpretation of the results. P.A. perfomed all the simulations. P.A. and P.P. developed new analytical tools and analyzed the data. All authors discussed the results and wrote the manuscript.
Competing interests
The authors declare no competing financial interests.
Corresponding author
Correspondence to Ursula Rothlisberger