HST STIS UV Spectroscopic Observations of the Protoplanetary Nebula Hen 3-1475∗,∗∗\ast,**∗,∗∗\ast,**footnotemark:
Abstract
We present UV spectra of the protoplanetary nebula (pPN) Hen 3-1475 obtained with the Space Telescope Imaging Spectrograph (STIS) on board the Hubble Space Telescope (HST). Our deep, low-dispersion spectroscopy enables monochromatic imaging of Hen 3-1475 in UV nebular emission lines, the first of such attempt ever made for a pPN. The high spatial resolution of STIS imaging allows an unprecedentedly sharp view of the -shaped jet, especially the inner NW1 knot, which is resolved into four components in Mg ii 2800. Through critical comparison with HST optical narrowband images, we found a negative radial velocity gradient in NW1, from 1550 km s-1 on its innermost component to 300 km s-1 on the outermost. Despite their high radial velocities, these components of NW1 mostly show no obvious (or very small) proper motions, indicating that they might be quasi-stationary shocks near the tip of the conical flow along the collimated jet of Hen 3-1475.
Subject headings:
stars: AGB and post-AGB – ISM: jets and outflows – ISM: planetary nebulae: individual (Hen 3-1475)1. Introduction
Planetary nebulae (PNe) exhibit a great variety of morphologies. The low occurrence of spherical symmetry is perplexing because most AGB envelopes are spherical (e.g., Neri et al., 1998; Mauron et al., 2013). The transformation from a spherical AGB envelope to an aspherical PN begins at the protoplanetary nebula (pPN) phase, when the stellar temperature is still too low to photoionize the nebula. Collimated outflows as fast as 400 km s-1 have been detected in pPNe (Bujarrabal et al., 2001), and play a major role in PN shaping (Sahai & Trauger, 1998). An even faster jet (630 km s-1) was found in the young PN MyCn 18 (Miszalski et al., 2018). Binarity is believed to be responsible for jet formation, as recently observed in the symbiotic star R Aqr (Schmid et al., 2017) and the AGB star Y Gem (Sahai et al., 2018).
Hen 3-1475 (a.k.a. the “Garden Sprinkler Nebula”), was first recognized as a transition object in the post-AGB phase (Parthasarathy & Pottasch, 1989) and later found to have fast bipolar outflows (Riera et al., 1995). Since its nature as a pPN was settled, Hen 3-1475 has been imaged on several occasions (Bobrowsky et al., 1995; Borkowski et al., 1997; Ueta et al., 2000; Borkowski & Harrington, 2001). It has a highly collimated bipolar structure with an -shaped string of point-symmetric, [N ii]-bright knots extending over 17″ along the main axis (Figure 1). High-dispersion spectroscopy revealed high-velocity jets (1200 km s-1, Borkowski & Harrington, 2001) and ultra-fast (up to 2300 km s-1) winds very close to the central star (Sánchez Contreras & Sahai, 2001). To date, Hen 3-1475 is the only pPN with detected diffuse X-ray emission, a signature of stellar winds interactions (Sahai et al., 2003); this X-ray emission comes mostly from its brightest NW1111Following Borkowski et al. (1997), we hereafter refer the inner, middle, and outer pairs of knots in Hen 3-1475 as NW1/SE1, NW2/SE2, and NW3/SE3, respectively. See also Figure 1. knot, whose emission is shock excited (Borkowski & Harrington, 2001; Riera et al., 2003, 2006). Its outflows are being collimated into jets far away from the central star (Borkowski et al., 1997), but the collimation mechanism is not well understood. A time-dependent ejection velocity model with a period of 1500 yr was proposed to explain its morphology and kinematics (Velázquez et al., 2004).
IUE detection of UV emission lines in Hen 3-1475 was only marginal due to dust obscuration (Gauba & Parthasarathy, 2003); but the effects of shocks can be studied in the UV. Here we report on UV spectroscopy of Hen 3-1475 obtained with the Hubble Space Telescope (HST). After briefly revisiting jet propagation in Section 2, we introduce our HST observations in Section 3. Data analysis and discussion are presented in Section 4, and summary and future plan in Section 5.
2. Jet Propagation of Hen 3-1475
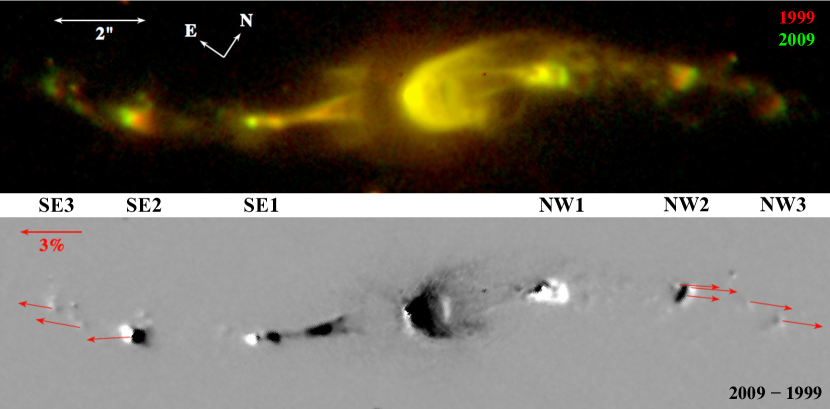
Jet propagation of Hen 3-1475 was studied by Borkowski & Harrington (2001) based on 1996/1999 observations. We now investigate it using the F658N images obtained on 1999 September 9 (WFPC2/PC; prop. 7285, PI: J. P. Harrington) and 2009 August 6 (WFC3; prop. 11580, PI: B. Balick). The WFPC2/PC (0050 pixel-1) image was aligned, rebinned and scaled to WFC3 (00396 pixel-1) following the procedure described in Fang et al. (2014). The two images displayed together show obvious proper motion of the outer knots (NW2/SE2 and NW3/SE3), but it is not obvious in NW1/SE1 whose outer parts are much brighter in 2009 than in 1999 (Figure 1 top). This brightening may cause apparently large (but false) proper motion of NW1/SE1 (Figure 1 bottom). Proper motions of the outer knots are 10–15 mas yr-1, corresponding to sky-projected velocities of 230–360 km s-1 (at a distance of 5 kpc, Riera et al. 1995; hereafter adopted); these are consistent with the measurements of Borkowski & Harrington (2001). The outer knots move almost tangentially along the -shaped arms of Hen 3-1475 (Figure 1 bottom), unlike the purely radial (from the core) motions usually expected for the knots ejected from a precessing nozzle as proposed by Riera et al. (2003). The possible mechanism of such tangential motion is discussed in Section 4.2. Figure 1 also shows very small motion of the two inner cones (i.e., the limb-brightened edges of conical shocks; Borkowski et al., 1997) that originate from the central torus and “converge” at NW1/SE1.

3. STIS Observations
Long-slit UV spectra of Hen 3-1475 were obtained with the Space Telescope Imaging Spectrograph (STIS) on board the HST on 2015 June 11, under the GO program #13838 (PI: X. Fang, Cycle 22). First-order gratings G140L and G230L were used to obtain the FUV and NUV spectra, respectively. The STIS 52″2″ long slit was placed on the central core (R.A.=, Decl.=) of Hen 3-1475 with a position angle (PA) of 12465 along the nebular axis. All knots lie within the slit (Figure 2a). The observations were in the TIME-TAG mode that allows us to scrutinize the data for periods of high airglow level. The instrument parameters and exposures are all summarized in Table 1, where we also present the actual angular resolutions (in arcsec) for the two grating modes as provided by the STIS Instrument Handbook.
The data were reduced and calibrated with the HST STIS pipeline. The long-slit low-dispersion spectroscopy enables monochromatic imaging of Hen 3-1475 on UV nebular emission lines (see description in Section 4.1), whilst reducing the impact of the bright geocoronal Ly emission. Several emission lines of the fully calibrated spectra are demonstrated in Figure 2. The FUV spectrum includes N v 1239,1242 (all wavelengths in Å), C iv 1550 (a blend of 1548,1551), He ii 1640, and O iii] 1661,1666. In NUV we detected C iii] 1908, C ii 2326, [O ii] 2470 and Mg ii 2800 (a blend of 2795,2803). No fine-structure transition lines in any doublet detected in our low-dispersion spectra are spectroscopically resolved.
| Detector | Grating | Spectral Range | Spectral Res. | Dispersion | Spatial Scale | Angular | ||
| (Å) | (Å) | () | (Å pixel-1) | (pixel-1) | Resolution | (s) | ||
| STIS/FUV-MAMA | G140L | 1425 | 1150–1730 | 960–1440 | 0.58 | 00246 | 007 | 2800 |
| STIS/NUV-MAMA | G230L | 2376 | 1570–3180 | 500–1010 | 1.55 | 00248 | 006 | 2100 |
| NOTE. – Instrument parameters are adopted from http://www.stsci.edu/hst/stis/design/gratings. | ||||||||
4. Results and Discussion
4.1. UV Morphology
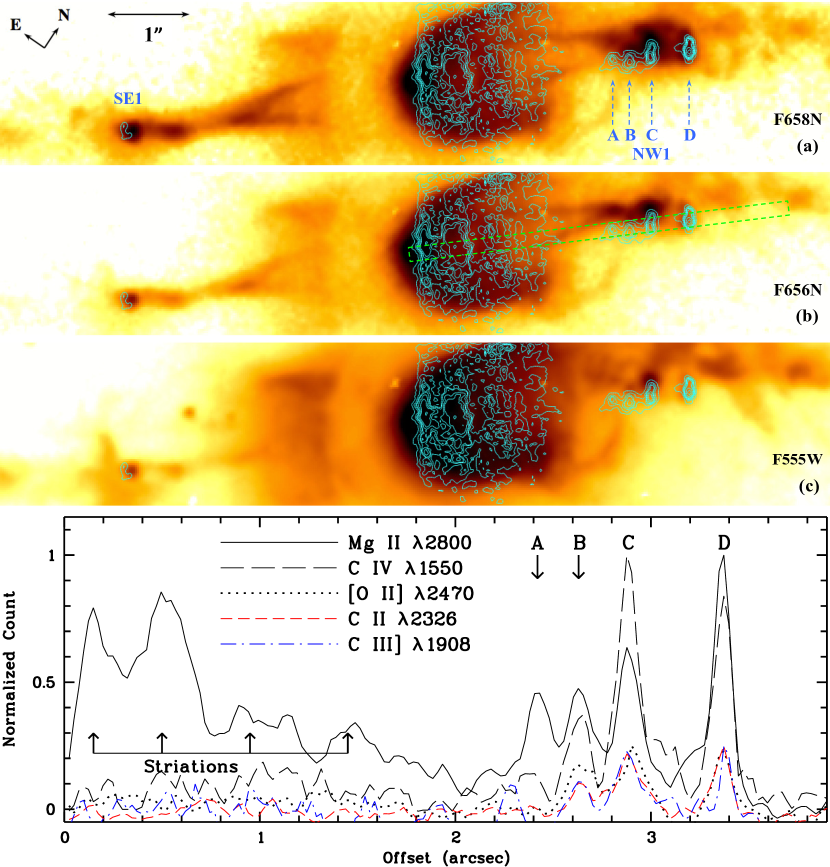
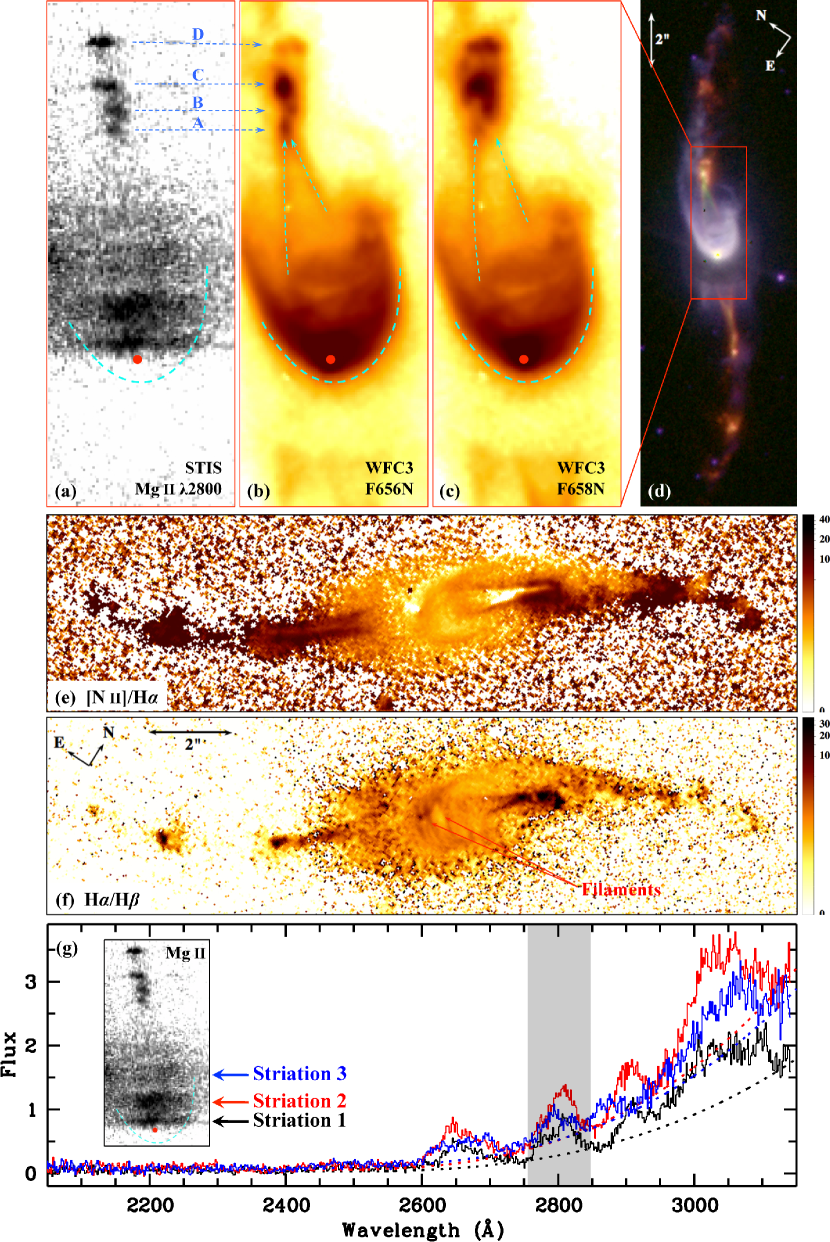
The UV morphology of Hen 3-1475 is studied in conjunction with HST WFC3 images in the F656N and F658N filters that show the H and [N ii] 6583 emission, mostly from the jets and knots, which are presumably shock excited (Borkowski & Harrington, 2001); the broadband images (e.g., F555W and F814W) show the continuum radiation, mostly scattered starlight. We created UV monochromatic images by first selecting in the STIS 2D spectrum regions centered on UV emission lines, and then carefully registered them with WFC3 images. The overall morphology of Hen 3-1475’s brightest regions (NW1/SE1 and the central reflection nebula), as outlined in optical emission, is visible in several UV lines (Figure 2). In the Mg ii 2800 spectral-line image, the NW1 knot is resolved into four components, hereafter named A, B, C, and D from the inside out (Figure 3a, b), with angular sizes of 012–014 along the jet axis; in the other UV lines, generally fainter than Mg ii, only the three outer components B, C, and D are seen (Figure 2b–f). The SE1 knot seen in the UV could be the counterpart of the outermost D component.
The optical counterparts (in H) of the four UV components A, B, C, and D are located 249 (173-W, 179-N), 267 (193-W, 185-N), 291 (207-W, 204-N), and 330 (247-W, 219-N) from the central star, respectively. B, C and D are elongated (in the dispersion direction) in Mg ii; this elongation is obvious in B and C, which are compact in H. D comprises two subcomponents in H that are 015 apart and stretch by 032, similar to the size in the UV. The NW conical shock “converges” on A (Figure 4a, b), the most compact (radius006) among the four UV components of NW1. Elongation of the NW1 components in the UV may be caused by large, internal negative radial velocity gradients (Borkowski & Harrington, 2001).
Along the (spectral) dispersion direction, the four components of NW1 seem to be displaced with respect to their optical counterparts; we discuss this in Section 4.2. Along the slit direction, positions of A, B, and C in the UV are unchanged compared to their counterparts in H, which is consistent with the very little expansion of NW1 we found through comparison of the 1999/2009 F658N images (see Section 2). Component D and SE1 in the UV are slightly outside their H counterparts (Figure 3b) due to jet expansion/propagation since 2009. The position of D in Mg ii is shifted outward (i.e., towards NW) by 0069 from its position in H, which corresponds to a proper motion of 11.8 mas yr-1, or 280 km s-1. Similarly, SE1 in Mg ii is displaced from its position in H by 0091, corresponding to 15.5 mas yr-1, or 360 km s-1.
In the UV spectrum, 2″ from the central star, there are four “stripes” (or striations) that are more prominent near the red end of the STIS NUV-MAMA spectrum (Figure 2b). These striations are only detected in the NW lobe, and seem to spatially align with the optical features at corresponding locations: the hollow -shaped “bowls” near the nucleus of Hen 3-1475 also seem striated in the optical (Figure 4b, c). The central region of Hen 3-1475 is dominated by the scattered stellar light as shown in the HST STIS G750M spectrum (Borkowski & Harrington, 2001, Figure 2 therein). Along the jet axis, the four UV striations in the NW lobe are 013, 05, 095 and 143 from the central star (Figure 3 bottom).
4.2. Jet Kinematics and Shocks
Whereas the positions of components A, B, and C in UV emission along the slit direction are consistent with those of their counterparts in H, there is a noticeable shift along the dispersion direction of the UV spectrum (Figure 3b). Given that the NW jet of Hen 3-1475 has high approaching speeds (Borkowski & Harrington, 2001; Riera et al., 2003), it is plausible to attribute these displacements to Doppler shift.222In [N ii] emission there are NW1 components that seem to spatially coincide better, along the SW edges, with the corresponding Mg ii ones than H does; this indicates that the offsets of these UV components with respect to H might be, at least partially, due to Mg ii emission arising from the [N ii]-emitting gas toward the SW from the H emission. An in-depth analysis of the UVoptical data is needed to confirm this. Indeed, A, B, and C are shifted blueward in the UV spectrum by 9.4, 7.2, and 6.7 pixels which, if entirely due to Doppler shift, correspond to radial velocities of 1550160, 1200330 and 1100400 km s-1, respectively. The systemic radial velocity of Hen 3-1475 (40 km s-1, Borkowski & Harrington, 2001) is within the velocity errors. Although the outermost component D, as well as SE1 in the UV, seems to align with its optical counterpart along the spectral direction, we cannot rule out the possibility that D also has a high approaching speed, given its extension and the low spectral resolution of G230L. This sets an upper limit of 310 km s-1 for the approaching speed of D. Adopting this radial speed and the sky-projected velocity of D (280 km s-1, see Section 4.1), we deduce a jet inclination (, with respect to the line of sight) 42°, which is consistent with the estimate of Borkowski & Harrington (2001, =40°). Adopting =40°, we corrected the velocities of A, B, C, and D to be 2000, 1600, 1400, and 400 km s-1, respectively.
Both the [N ii] and H emission lines in the HST STIS G750M optical spectroscopy (in 1999; Borkowski & Harrington 2001) show an increase in radial velocity from the base region of the NW conical shock, reaching a maximum blueshift of 910 km s-1 at the cone tip (i.e., component A), and followed by a small drop (by 110 km s-1) near the cone tip, and continuous decrease in velocity through C to D. This small drop in velocity near the cone tip is reflected by the velocity difference between A and B in the UV. Our radial velocities derived for the UV components of NW1, although higher than those found in the STIS G750M spectrum, generally follow the same trend (i.e., decreasing from the inside out), indicating a sequence of negative speed changes within NW1. The jet might have been accelerated since 1999 possibly because the central star has become hotter.
If the NW1 components are moving clumps along the jet, the sky-projected velocities of A, B, C, and D should be 1300, 1000, 900, and 260 km s-1 (adopting the above radial velocities and =40), corresponding to proper motions of 55, 42, 38 and 12 mas yr-1, respectively. However, A, B, and C are actually unchanged in positions, whereas D and SE1 show small radial displacements from their positions in the 2009 H image (Figure 3b; see Section 4.1). Such a spatio-kinematic pattern of NW1 seems to resemble quasi-stationary shocks: A, B, C, and D may actually be shock interfaces where the outflowing gas moves through with high speeds, and have no (or very small) measurable proper motions; each of these clumpy shocks may brighten or fade in time owing to variations in density or speed of the gas flow. If A, B, C, and D are indeed the locations of shocks, the gas flow should be slowed down at each of these shocks as some kinetic energy is converted into heat that locally excites line emission (B. Balick 2018, private communication). The negative radial velocity gradient in NW1 may thus be explained as a series of speed losses of the (possibly unstable) flow as it propagates outward along the jet. This interpretation, although plausible, is still speculative and needs careful assessment with comprehensive hydrodynamic simulations.
The outer pair of knots (NW2/SE2 and NW3/SE3) in Hen 3-1475 was previously proposed to be fast-moving “bullets”; but their almost tangential motion along the -shaped arms (Figure 1 bottom; see also Section 2) suggests that this is probably not the case. One sensible interpretation is that these outer knots are actually bright spots along the curved arms, which may be faint lobe walls projected on the sky; these bright spots are produced due to the Kelvin–Helmholtz instabilities as excited by the fast streamlines flowing over the surface of lobe walls.
We analyzed the archival HST STIS G750L spectrum and found that the optical line ratios (e.g., [O ii]/H, [O iii]/H, [S ii]/H) from the NW1 knot are roughly consistent with the predicted values of a bow-shock model at 200 km s-1 (Hartigan et al., 1987); this analysis will be presented separately (X. Fang et al. 2018, in preparation). The high-velocity jet impinges on the slower AGB wind, creating shocks as delineated by the [N ii]/H ratio (Figure 4e): the three pairs of knots, as well as the two limb-brightened inner cones, are enhanced in [N ii] emission (although we are aware that at least for SE1, the F658N filter may be contaminated by redshifted H). Within the NW lobe, there are filaments enhanced in the H/H ratio (Figure 4f); they may not be due to higher local extinction but actually related to variation in shock speed that causes locally enhanced temperature and/or density, which results in departure from the Case B recombination of hydrogen. The NW conical shock is slightly curved before it converges (Figure 4b, c), an effect possibly due to interaction with the lobe walls, which are bright in scattered lights as seen in F555W (Figure 4d). The SE conical shock is also curved in optical line emission.
For each of the four striations within the NW lobe, its 1D NUV spectrum is composed of a smooth continuum overlaid by several emission features, one of them being Mg ii 2800 (see Figure 4g for 1D spectra of the inner three, namely Striations 1, 2 and 3). The smooth continuum could be the scattered starlight, while the broad UV emission features may come from fast stellar outflows. The innermost UV striation is not located exactly on the central star, but offset by 013 (probably due to obscuration by the central dusty torus), corresponding to 9.71015 cm; the half-width (FWHM/2) of Mg ii emission is 22 Å, corresponding to a radial velocity gradient up to 2360 km s-1. These two quantities are consistent with both location (1016 cm) and velocity (2300 km s-1) of the ultra-fast “pristine” post-AGB outflow found by Sánchez Contreras & Sahai (2001). We cannot rule out the possibility that such UV spread/broadening might also be (at least partially) due to spatial extent; but the broadening of emission features on the innermost layer (Striation 1) can be due to kinematics because its Mg ii emission seems to extend beyond the -shaped boundary of the NW lobe (Figure 4a).
4.3. Physical Conditions within the NW1 Knots
The exact location of X-ray emission in NW1 is still unclear; although it seems to peak around the cone tip (Figure 2a), this might be an effect of heavy smoothing of the low-photon counting Chandra data. If X-ray emission comes from the component A, the simultaneous presence of X-ray, UV, and optical emission suggests that A is a cooling region of shocked gas with very strong temperature gradients. However, A is spatially unresolved in our UV monochromatic imaging, given that its angular size is comparable to the angular resolution of the STIS/NUV-MAMA detector (006; Table 1). The physical conditions within the NW1 knots will be assessed by a re-analysis of the X-ray data and substantiated with the UV and optical emission line ratios to derive shock properties (J. A. Toalá et al. 2018, in preparation).
Using equation 1 of Gruendl et al. (2004) and the observed Mg ii 2800 line flux (5.210-14 erg cm-2 s-1), we estimate a density of 105 cm-3 for component A. Here an extinction of 3.7 magnitude (Riera et al., 1995) and the solar abundance (Mg/H=3.9810-5, Asplund et al., 2009) were adopted; we also assume a maximum ionization fraction Mg+/Mg=0.69 at 15 800 K in ionization equilibrium (Shull & Steenberg, 1982), and a filling factor of 1. Using the same assumptions above, we estimate densities of 50 000–60 000 cm-3 in B, C, and D. These estimates of the density from the UV-emitting region in NW1 are much higher than the electron density derived from the [S ii] 6716/6731 ratio (3000 cm-3, Riera et al., 2006), suggesting different physical conditions in the UV, optical, and X-ray emission regions (especially in component A).
5. Summary and Future Work
We report on monochromatic imaging of Hen 3-1475 in UV nebular emission lines obtained through the HST STIS UV long-slit spectroscopy; this is the first of such attempt ever made for a pPN. We have analyzed the UV morphology of Hen 3-1475, in conjunction with archival HST optical data. The high spatial resolution of STIS UV imaging resolves the NW1 knot near the tip of the inner conical shock in Hen 3-1475 into four components in the Mg ii 2800 spectral-line image. These four UV components are distributed roughly along the jet axis with slight curvature; similar configuration also seems to exist near the SE cone. Compared to their optical counterparts, the four components of the NW1 knot are mostly blueshifted due to their high (approaching) radial velocities, from 1550 km s-1 on the innermost component to 300 km s-1 on the outermost one. Despite of their high radial velocities, the four components of NW1 show no obvious proper motions through the period of two-decade HST observations, indicating that they might be quasi-stationary shocks where fast gas flows through. Given this interpretation, the negative radial velocity gradient found in NW1 might be explained as successive speed losses of the fast jet as it propagates outward, losing kinetic energy at the shock sites that are now identified as the four UV components of NW1. Moreover, through proper motion studies we found that the outer pairs of knots (NW2/SE2 and NW3/SE3) of Hen 3-1475 are moving almost tangentially along the -shaped arms, which indicates that they may not be fast-moving “bullets” as previously suggested, but bright spots induced by Kelvin–Helmholtz instabilities.
The extremely fast conical outflow with the knotty structure near its vertex makes Hen 3-1475 unique from all other pPNe and young PNe so far observed. This Letter is mostly descriptive. Follow-up studies of this object, in particular jet collimation and interaction with the ambient outflowing AGB gas, based on multi-wavelength (X-ray, UV, optical, infrared) observations and utilizing state-of-the-art (magneto)hydrodynamic simulations, will be carried out (X. Fang et al. 2018, in preparation). Given that Hen 3-1475 is in rapid evolution, which causes drastic change in morphology and physical conditions, close monitoring of this pPN with high spatial resolution is essential in order to better understand its jet formation/collimation and more interestingly, nature of the central star (possibly a binary) and the circumstellar/circumbinary environment, such as dust, the disk, and the magnetic field.
References
- Asplund et al. (2009) Asplund, M., Grevesse, N., Sauval, A.-J., & Scott, P. 2009, ARA&A, 47, 481
- Bobrowsky et al. (1995) Bobrowsky, M., Zijlstra, A. A., Grebel, E. K., et al. 1995, ApJ, 446, L89
- Borkowski et al. (1997) Borkowski, K. J., Blondin, J. M., & Harrington, J. P. 1997, ApJ, 482, L97
- Borkowski & Harrington (2001) Borkowski, K. J., & Harrington, J. P. 2001, ApJ, 550, 778
- Bujarrabal et al. (2001) Bujarrabal, V., Castro-Carrizo, A., Alcolea, J., & Sánchez Contreras, C. 2001, A&A, 377, 868
- Fang et al. (2014) Fang, X., Guerrero, M. A., Marquez-Lugo, R. A., et al. 2014, ApJ, 797, 100
- Gauba & Parthasarathy (2003) Gauba, G., & Parthasarathy, M. 2003, A&A, 407, 1007
- Gruendl et al. (2004) Gruendl, R. A., Chu, Y.-H., & Guerrero, M. A. 2004, ApJ, 617, L127
- Hartigan et al. (1987) Hartigan, P., Raymond, J., & Hartmann, L. 1987, ApJ, 316, 323
- Mauron et al. (2013) Mauron, N., Huggins, P. J., & Cheung, C.-L. 2013, A&A, 551, A110
- Miszalski et al. (2018) Miszalski, B., Manick, R., Mikołajewska, J., et al. 2018, PASA, 35, 27
- Neri et al. (1998) Neri, R., Kahane, C., Lucas, R., et al. 1998, A&AS, 130, 1
- Parthasarathy & Pottasch (1989) Parthasarathy, M., & Pottasch, S. R. 1989, A&A, 225, 521
- Riera et al. (2006) Riera, A., Binette, L., & Raga, A. C. 2006, A&A, 455, 203
- Riera et al. (2003) Riera, A., García-Lario, P., Manchado, A., Bobrowsky, M., & Estalella, R. 2003, A&A, 401, 1039
- Riera et al. (1995) Riera, A., García-Lario, P., Manchado, A., Pottasch, S. R., & Raga, A. C. 1995, A&A, 302, 137
- Sahai et al. (2003) Sahai, R., Kastner, J. H., Frank, A., Morris, M., & Blackman, E. G. 2003, ApJ, 599, L87
- Sahai et al. (2018) Sahai, R., Sánchez Contreras, C., Mangan, A. S., et al. 2018, ApJ, 860, 105
- Sahai & Trauger (1998) Sahai, R., & Trauger, J. T. 1998, AJ, 116, 1357
- Sánchez Contreras & Sahai (2001) Sánchez Contreras, C., & Sahai, R. 2001, ApJ, 553, L173
- Schmid et al. (2017) Schmid, H. M., Bazzon, A., Milli, J., et al. 2017, A&A, 602, A53
- Shull & Steenberg (1982) Shull, J. M., & Van Steenberg, M. 1982, ApJS, 48, 95
- Ueta et al. (2000) Ueta, T., Meixner, M., & Bobrowsky, M. 2000, ApJ, 528, 861
- Velázquez et al. (2004) Velázquez, P. F., Riera, A., & Raga, C. 2004, A&A, 419, 991