Extremely Dense Cores associated with Chandra Sources in Ophiuchus A: Forming Brown Dwarfs Unveiled?
Abstract
On the basis of various data such as ALMA, JVLA, Chandra, Herschel, and Spitzer, we confirmed that two protostellar candidates in Oph-A are bona fide protostars or proto-brown dwarfs (proto-BDs) in extremely early evolutionary stages. Both objects are barely visible across infrared (IR, i.e., near-IR to far-IR) bands. The physical nature of the cores is very similar to that expected in first hydrostatic cores (FHSCs), objects theoretically predicted in the evolutionary phase prior to stellar core formation with gas densities of 1011-12 cm-3. This suggests that the evolutionary stage is close to the FHSC formation phase. The two objects are associated with faint X-ray sources, suggesting that they are in very early phase of stellar core formation with magnetic activity. In addition, we found the CO outflow components around both sources which may originate from the young outflows driven by these sources. The masses of these objects are calculated to be from the dust continuum emission. Their physical properties are consistent with that expected from the numerical model of forming brown dwarfs. These facts (the X-ray detection, CO outflow association, and FHSC-like spectral energy distributions) strongly indicate that the two objects are proto-BDs or will be in the very early phase of protostars which will evolve more massive protostars if they gain enough mass from the surroundings. The ages of these two objects are likely to be within years after the protostellar core (or second core) formation, taking into account the outflow dynamical times ( 500 yrs).
Subject headings:
stars:formation — stars:brown dwarfs — ISM:individual (Oph-A) —ISM:jets and outflow — X-rays: stars – submillimeter: stars1. Introduction
How a star forms is a long-standing basic question in astronomy that has been investigated extensively during the past five decades (Hayashi, 1966; Larson, 1969; Shu et al., 1987; McKee & Ostriker, 2007; André et al., 2009). The widely-accepted standard scenario of the formation of stars ( 0.08 ) is the gravitational collapse of a molecular cloud core, or so-called “prestellar core”. Prior to the protostellar phase, the central densest part of the collapsing cloud becomes adiabatic as its density reaches g cm-3 and its temperature becomes high enough to pause the collapse (Larson, 1969). At this point, with the collapsed object in hydrostatic equilibrium, it is referred to as a first hydrostatic core or first core in short (Larson, 1969; Masunaga et al., 1998). Its mass and radius are, respectively, and 4 au with no rotation (Masunaga et al., 1998) and up to 100 au with rotation (Bate et al., 2002; Matsumoto & Hanawa, 2003; Saigo et al., 2008). Its predicted luminosity, 0.010.1 (Larson, 1969; Bate et al., 2002), is defined by its radius and the mass accretion rate onto its surface (Bate et al., 2002). When the core gains enough mass by accreting the surrounding gas, it evolves into a protostar. This standard scenario is sometimes called “core accretion” model. The core accretion model assumes that a protostar is located at the center of a dense core from which the protostar obtains its mass, determining the final mass of a star formed. Another well-discussed scenario of the formation of stars is the competitive accretion model (Bonnell et al., 2000). In this model, an initially very low-mass compact core called a stellar seed is created from the parent molecular clouds and it gains additional mass from the surroundings through Bondi-Hoyle accretion.
On the other hand, substellar-mass objects such as brown dwarfs (BDs) and planetary-mass objects (PMOs) (i.e., 0.08 ) have no widely accepted scenario for their formation (Bate et al., 2002; Basu & Vorobyov, 2012; McKee & Ostriker, 2007). Two possibilities are presently under debate, i.e., the same formation pathway as stars or dynamical ejection in the star-forming disk. In the latter scenario, substellar objects can be formed in disks via gravitational fragmentation if the disks are massive and unstable; the substellar objects are then ejected through many-body interaction. Ejected objects do not accrete much material because the timescale of fragmentation and ejection is short ( 103-4 yrs), hence less massive objects are born. Ejected dense clumps could also form BDs or PMOs if they can survive tidal disruption by being extremely dense like first cores (Basu & Vorobyov, 2012; André et al., 2009). Concrete examples of forming BDs are needed for discriminating between these two scenarios.
However, the formation processes of protostars and substellar-mass objects in the earliest stage remains uncertain because there are not enough observational examples. Thus, it is important to observationally identify protostars and proto-BDs that are in the very early evolutionary stages.
The Ophiuchi star-forming region is one of the best places for the study of formation of protostars and substellar-mass objects because of its proxmity. Recent VLBA observations have provided an accurate distance to the Oph star-forming region (Lynds 1688) of 137 1.2 pc (Ortiz-Leon et al., 2017). Previous distance estimates to Oph fall into the range of 120 140 pc (Kunde & Hog, 1998; Luhman et al.,, 2007; Loinard et al., 2008; Lombardi et al., 2008). Hereafter, we adopt 137 pc. Given Oph’s close proximity, we can easily achieve spatial resolution comparable to the size of our solar system ( 100 au) using currently available state-of-the-art facilities.
We observed the densest part of the Ophiuchus molecular cloud, the -Ophiuchi A region (Di Francesco et al., 2004), using ALMA in 2015 and JVLA in 2012. Oph A was first observed by Ward-Thompson et al. (1989) in submillimeter continuum with UKIRT, and they named the brightest submillimeter core SM1. Later, André et al. (1993) revealed that Oph A contains several dust condensations along the filamentary ridge with JCMT and IRAM 30-m telescopes. On the basis of the Nobeyama Millimeter Array (NMA) observations at 2 mm and 3 mm, Kamazaki et al. (2001) found that SM1 includes 1′′ (100 au) scale bright condensations. They named the brightest condensation Source A. Source A is also identified in 850 m and 1.3-mm by Friesen et al. (2014) and Nakamura et al. (2012), respectively. It is also identified in N2H+ () as N3 by Di Francesco et al. (2004). Hereafter, we refer to source-A as SM1-A, taking into account the previous identifications based on the dust emission.
In the present paper, we discuss the physical properties of two protostellar candidates in Oph-A from the ALMA and JVLA observations toward the region and also X-ray, IR and radio data of the Ohpiuchi star-forming region. The two are SM1-A and a dust continuum source (hereafter, referred to as Source-X) located between SM1-A and VLA 1623 which is an archetypal Class-0 protostar (André et al., 1993). The former was identified with a protostellar candidate with faint X-ray emission (Friesen et al., 2014). The latter source was recently detected in 3-mm with ALMA by Kirk et al. (2017) as core No. 10. Its compactness indicates that it is a protostellar candidate. It is worth noting that Source-X is visible as local peaks in the 350 m and 450 m maps of André et al. (1993). Here we propose that these two protostellar candidates are bona fide protostars or proto-brown dwarfs.
2. Observations and Data Analysis
We used the (sub)millimeter, infrared and X-ray observation data to identify the substellar-mass objects. The millimeter and submillimeter data were mainly obtained by our ALMA Band-6 mosaic observations in Cycle-2 and JVLA 41 GHz observations. We also analyzed ALMA archive data, which were Cycle-0 Band-7 and Cycle-2 Band-6 data, for high angular resolution imaging and determining spectral energy distribution (SED) of the candidates. At the wavelengths of NIR, Spitzer IRAC and MIPS data were retrieved to search for IR counterparts. Furthermore, we reanalyzed Chandra X-ray data taken in 2000 and merged the new data taken in 2014 to improve the signal-to-noise ratios and attempt to identify deeply embedded young stellar and substellar objects that cannot be seen even at infrared wavelengths. In the following, we describe details of these observations. Parameters of (sub)millimeter observations are summarized in Table 1.
2.1. SMA Observations
SM1-A was observed with the SubMillimeter Array (SMA)111The SMA is a joint project between the Smithsonian Astrophysical Observatory and the Academia Sinica Institute of Astronomy and Astrophysics and is funded by the Smithsonian Institution and the Academia Sinica. on 2007 July 29 in its compact-north configuration over the hour angle coverage of -1.4h to 4.2h. Details of the SMA are described by Ho et al. (2004). These SMA data were originally taken for polarimetric measurements (S.P. Lai, private communication). The continuum data were first published in our previous paper (Nakamura et al., 2012), which describes the details of the observing parameters. Seven out of the eight SMA antennas were used, providing projected baseline lengths from 6.8 m to 125.5 m. The atmospheric transparency was good, with the 225 GHz opacity ranging from 0.05 to 0.09 measured at the nearby Caltech Submillimeter Observatory (CSO). The double sideband (DSB) receivers were tuned with a local oscillator (LO) frequency of 340.8 GHz. The IF frequency is 5 GHz, and in each sideband the correlator covers the 2 GHz bandwidth. Observations of NRAO 530 were interleaved with the target for gain calibration, whose absolute flux density at 340 GHz was measured to be 1.4 Jy by bootstrapping from observations of Uranus. The absolute flux accuracy is 15 . Strong quasars 3C273 and 3C454.3 were adopted as the passband calibrators. The raw visibility data were calibrated with an IDL-based reduction package, MIR (Scoville et al., 1993), and the calibrated visibility data were Fourier-transformed and CLEANed with MIRIAD (Sault et al., 1995).
After the normal calibration and imaging processes, a very bright compact source was identified, which enabled us to perform self-calibration. The phase-only self-calibration improved the signal-to-noise ratio of the continuum image by 30 and sharpened the image.
2.2. JVLA 41 GHz Observations
SM1-A was also observed at 41 GHz ( = 7.3 mm) with the Karl G. Jansky VLA (JVLA), which consists of the 27 25-m antennas. The observations were conducted on 2012 September 3 in the B configuration, covering projected baseline lengths from 80 m to 7.4 km. The correlator was configured to have 16 spectral windows with 128 MHz bandwidth each, providing in total 2 GHz bandwidth from 39.998-0.064 GHz to 41.884+0.064 GHz. J1256-0547, J1625-2527, and 3C286 were used for bandpass, complex gain, and flux scale calibrations, respectively. In the observing sequence, the fast switching mode between the target and the gain calibrator J1625-2527 separated at 1∘ was adopted. The total on-source integration time was 2880 seconds. The 7.3 mm continuum image was made with natural weighting to maximize the signal-to-noise ratio, yielding a synthesized beam size of 032 015 (P.A.=11.4). The FOV of the JVLA 25-m antennas at 41 GHz is 73, and hence VLA 1623, separated by 35 from SM1 SM1-A, was observed simultaneously. VLA 1623 and knot-a (or VLA 1623B) were clearly detected in our observations together with SM1-A, and knot-b (or VLA 1623W) was also detected above a 3 level.
2.3. ALMA Observations and Data Reduction
2.3.1 Band-7 Observations in Cycle-0
The 810 m and 835 m (372.4 GHz and 359.2 GHz, respectively) continuum and N2H+ (372 GHz) observations toward SM1-A were performed on 2012 August 2425 in ALMA Cycle-0 (see Friesen et al., 2014). The array was in the Cycle-0 Extended configuration with projected baseline lengths between 26 m and 500 m and sensitive to maximum angular scales of . The field of view (FOV) was in diameter. Using the 26 12-m antennas, the total on-source integration time was 2400 seconds (4 hours including the overheads). The weather conditions were good during the observations, and the system noise temperature was in the range of 400 K to 550 K at 372 GHz, and 200 K at 359 GHz. The 810 m and 835 m continuum data were taken from the upper- and the lower sidebands of the Band-7 receivers, respectively, with four sets of 128 MHz spectral windows of the ALMA baseline correlator. The line-free channels were summed to form continuum visibility data of 256 MHz in bandwidth each from the 810 m and 835 m data. J1517-243, J1625-254, and Titan were used for bandpass, complex gain, and flux scale calibrations, respectively.
Data reduction was conducted on the Common Astronomy Software Applications package (CASA) version 4.2.2. In addition to the standard calibration procedure for ALMA data, we tried self-calibration for each of the 810 m and 835 m continuum datasets, since SM1-A, located near the center of the FOV, is bright enough for such calibration to work well. Only phase self-calibration was done for the data set. For the 835 m image, the self-calibration was quite successful, and a signal-to-noise ratio of more than 600 was achieved. In the original image by Friesen et al. (2014) who applied the uniform weighting to the data to create the image, the achieved rms noise level was 2.0 mJy beam-1 with the FWHM beam size of . By applying the self-calibaration with natural weighting, we could achieve the rms noise level of 0.39 mJy beam-1, which is very close to the theoretical thermal noise expectation.
2.3.2 Band-6 Observations in Cycle-2
We obtained 219 GHz continuum data from the ALMA archive. The 219 GHz continuum observations toward VLA 1623 were obtained in 2015 for ALMA Cycle-2 program (project code: 2013.1.01004.S; S.-P. Lai). The continuum data were analyzed in the same way as the above 810 m and 835 m data with self-calibration. The obtained beam size is 06 and the rms noise achieved is 0.084 mJy beam-1 at the center of the FOV. Uncertainty of the absolute flux density scale is 10 .
2.3.3 Cycle-2 Mosaic Observations
We obtained ALMA Cycle-2 observations at 226 GHz using the 12-m Array with 150 pointings and ACA with 58 pointings to cover 2 3 region of Oph-A. We successfully obtained the combined images for the continuum and three isotopic CO () lines, i.e, 12CO(), 13CO (), and C18O (). The details of the observed continuum and molecular lines are summarized in Table 2. The observation parameters are the same as those of the Oph B2 observations (Kamazaki et al., 2018). The reference position of the 12-m Array and the 7-m Array was set to (, ) = (16h27m26507, 24°31′2863), which is the same as that of Kamazaki et al. (2018). The ranges sampled in the 12-m Array and 7-m Array data were 12.5 348 k and 8.1 48 k, respectively. The minimum distance of the combined data corresponds to 25″. We used quasars, J1517-2422 and J1733-1304, for the bandpass calibrators adopted for the 12-m Array and 7-m Array observations, respectively. We observed a quasar J1625-2527 as the phase calibrator for both arrays. We used Titan and Mars for the flux calibrations of the 12-m Array and the 7-m Array observations, respectively. For the absolute flux scale of the solar system objects (i.e., flux calibrators), we used the Butler-JPL-Horizons 2012 model.
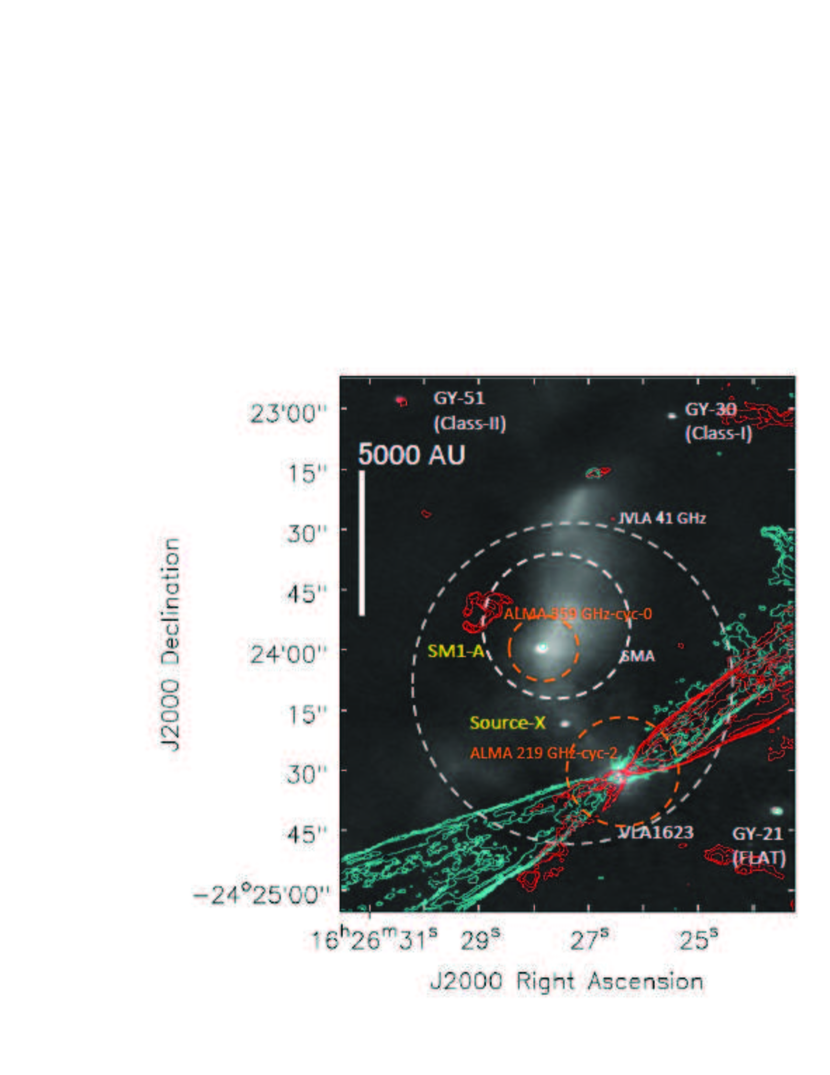
The 12-m Array and 7-m Array data were calibrated and imaged using the CASA pipeline version 4.2.2 and version 4.5.3, respectively. We modified the scripts prepared by the ALMA observatory in which the shadowing criterion for the bandpass data was reduced from 7 m to 6 m to recover some data flagged by the original scripts. Then we conducted the calibration by ourselves. In this paper, we will describe briefly a combined continuum map at 226 GHz and 12CO () detection toward two sources of interest for comparison purposes. The synthesized beams and the sensitivities of the dust continuum and 12CO data are summarized in Table 2. In Figure 1, we present the combined 12-m Array and 7-m Array 1.3-mm continuum image of Oph A with contours of blue-shifted and red-shifted 12CO () emission. We also indicate the FOVs of the SMA, ALMA Cycle-0, ALMA 218 GHz Cycle-2, and JVLA observations with circles in Figure 1.
2.4. Chandra Observations
The Chandra X-ray observations were performed in May 2000 (Obs ID = 637) and in December 2014 (Obs ID = 17249), both of which include the Oph A region. The comprehensive reports for the former dataset have been given by Imanishi et al. (2003) and Gagné et al. (2004). Both datasets have exposure of 100 ks. The Oph A region was observed with the ACIS-I imaging array, which is comprised of four charge-coupled devices (CCDs) that are front-side illuminated (I0, I1, I2, and I3).
After downloading both of the datasets from the Chandra X-ray Center (CXC), we did the data processing and analysis using the Chandra Interactive Analysis of Observations (CIAO) software, developed by the Chandra Science Center. We started the analysis of the latter dataset (Obs ID = 17249) simply using the Level 2 events list provided by the Chandra Science Center, which was filtered on the good time intervals (GTIs), cosmic ray rejection, and position transformation to celestial coordinates (RA, Dec) from the more primitive Level 1 outputs (see more detail in the Chandra Analysis Guide (http:cxc.harvard.edu/ciao/guides/). As for the former dataset (Obs ID = 637), we generated a new Level 2 events list by reprocessing the Level 1 output by ourselves, with updated calibration data. We merged the data taken in 2000 and 2014 to improve the signal-to-noise ratios, using the CIAO software, “reproject_obs”.
2.5. IR Data Analysis and Photometry
2.5.1 Spitzer IRAC/MIPS Data and Herschel Data
We retrieved 3.6 m, 4.5 m, 5.8 m, 8.0 m, 24 m, and 70 m images obtained with the Infrared Array Camera (IRAC; Fazio et al. 2004) and the Multiband Imaging Photometer for Spitzer (MIPS) (Rieke et al., 2004) from the NASA/IPAC Infrared Science Archive to search for the infrared counterparts of the submillimeter sources and measure the corresponding flux densities. The basic calibrated data (BCD) of IRAC and MIPS are processed through masking, flat fielding, background matching, and mosaicing using the MOPEX (MOsaicker and Point source EXtractor) software, which is a package developed at the Spitzer Science Center for astronomical image processing. We have also analyzed the recent Herschel 70 m data from the Herschel Science Archive, which has a higher signal-to-noise ratio than the Spitzer 70 m image.
2.5.2 Analysis of J, H, and Ks Band Data
We observed the 7 7 field toward SM1-A in the near-infrared , , and bands simultaneously with the near-infrared camera SIRIUS on the InfraRed Survey Facility (IRSF) 1.4 m telescope at the Sutherland South African Astronomical Observatory on 2004 July 7, 9, 11, 16, and October 17 and 2005 March 15, April 30, May 17, and July 6. The total integration time was 7485 sec. We used NOAO’s Imaging Reduction and Analysis Facility (IRAF) software package to carry out the data reduction. We applied standard procedures of near-infrared array image reduction, including dark current subtraction, sky subtraction, and flat fielding. Photometric calibration was done with the 2MASS point sources in the same field. Identification and photometry of point sources in all frames were performed with using the DAOPHOT packages in IRAF. The upper limit for source detection was 19.5 mag (3 upper limit).
3. Results
3.1. Photometry
We measured flux densities of SM1-A and Source-X using interferometric data available, Spitzer, and Herschel data, and have summarized them in Table Extremely Dense Cores associated with Chandra Sources in Ophiuchus A: Forming Brown Dwarfs Unveiled? together with number of counts by Chandra. The flux densities are measured in the 2 2 regions of spatially resolved cases to exclude extended emission which can be seen in the SMA visibility distribution (see also Section 3.4). Peak flux densities in units of mJy beam-1 are given for unresolved cases. Upper limits of 3 in mJy beam-1 are given for non-detections.
SM1-A was not detected at 70 m in either Spitzer or Herschel data. It was marginally detected at 4.5 and 5.8 m. SM1-A is also associated with X-ray emission with Chandra, which is already pointed out by Friesen et al. (2014). Source-X was detected only at 219 GHz, 3-mm (Kirk et al. 2017), and X-ray with Chandra. The 3 upper limits at , IRAC, MIPS, and Herschel bands are almost identical to those obtained for SM1-A.
3.2. Detection of Compact Cores Associated with Chandra Sources
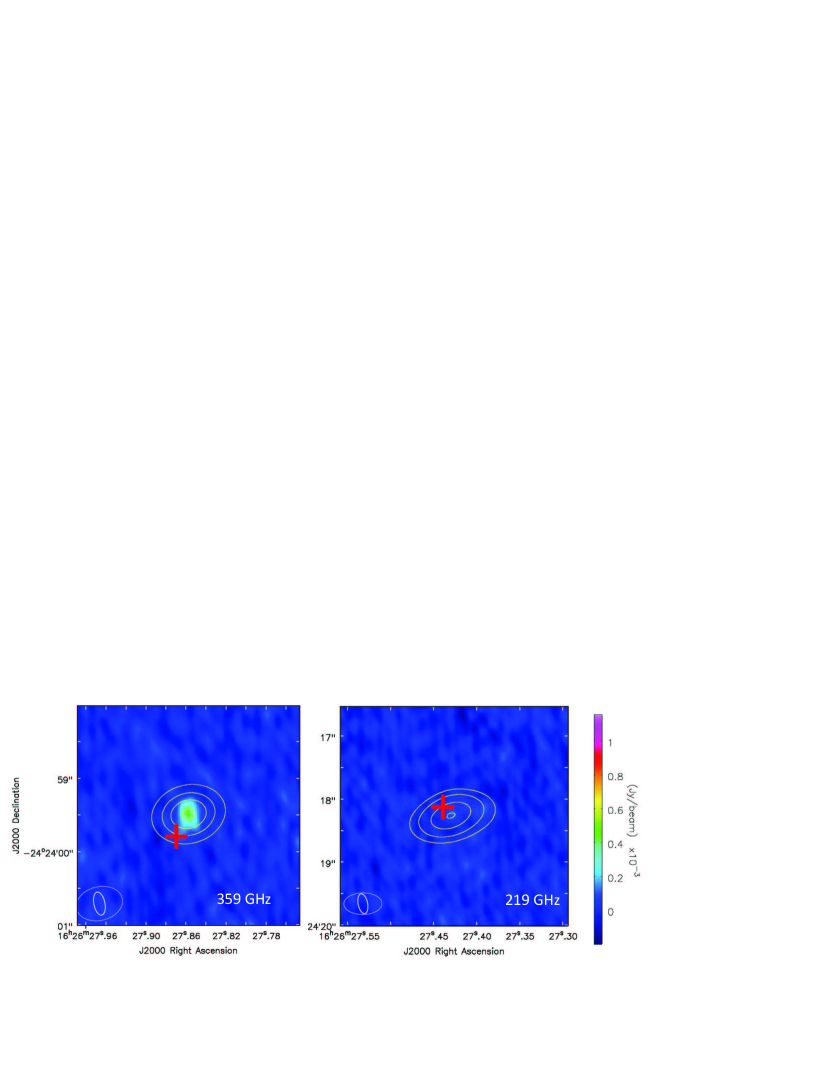
In Figure 1, we present the combined 12-m Array and 7-m Array 1.3-mm continuum image of Oph A obtained in ALMA Cycle-2. In the image, we detected two very compact and bright 1.3 mm cores, SM1-A and Source-X which is located between VLA 1623 and SM1-A, together with a number of less bright sources. The positions of the two cores and some other young stellar objects are also shown in Figure 1. We will describe the details of the image in a separate paper (Hara et al. in prep.). In the present paper, we focus on the two compact, bright cores. The JVLA 41 GHz images of the individual cores are shown in Figure 2 with contours of the ALMA 359 GHz continuum emission. We detect 41 GHz continuum emission toward SM1-A, whereas we do not detect 41 GHz continuum emission above a 3 level from Source-X.
Detection of SM1-A with ALMA has already been reported by Friesen et al. (2014). SM1-A and Source-X were also identified from the 3-mm ALMA Cycle-2 observations (Kirk et al., 2017). However, both SM1-A and Source-X are more prominent in our 1.3-mm image observed with the higher angular resolution.
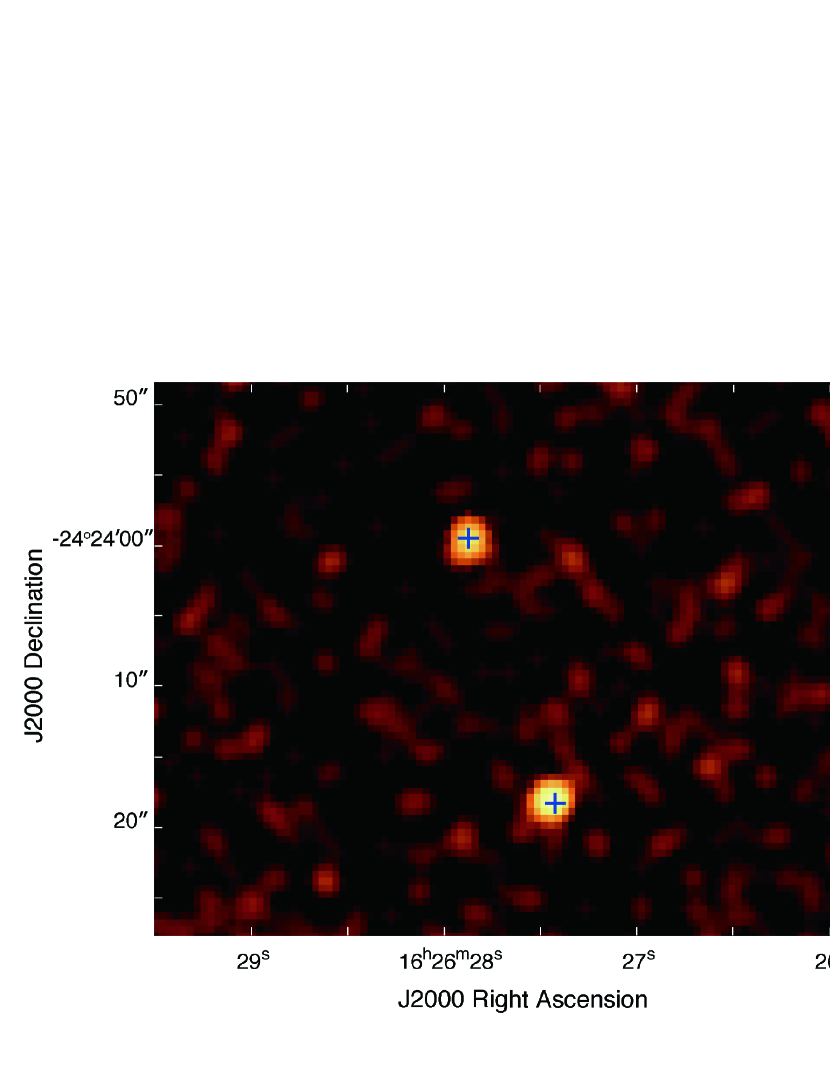
The Chandra data merged for the data-set taken in 2000 and that in 2014 revealed that both SM1-A and Source X are significantly detected in X-ray; the significance levels of SM1-A and Source-X are 13 and 19, respectively, in the 2–10 keV band as shown in Figure 3. The positions of Chandra X-ray sources are shown as red crosses in Figure 2. Both of the X-ray detections agree well with the ALMA sources within the Chandra positional accuracy of 0.5 1. Analysis of available NIR-FIR/Chandra data unveiled the following nature of both sources:
-
(1)
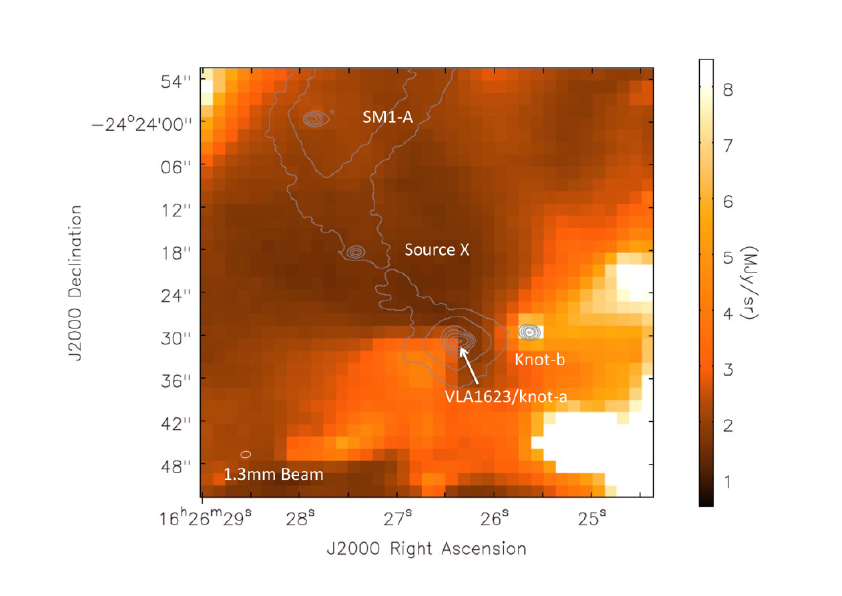
Both sources are very dim in NIR to FIR. SM1-A is marginally detected only at IRAC 4.5/5.8 m at a 3 level. Source-X is not detected in all NIR-FIR bands. Although various NIR to FIR data toward these two sources have been available, clear signatures of emission from the central objects have not been previously obtained. In Figure 4, we present 4.5 m Spitzer images of the region including SM1-A and Source-X.
-
(2)
Both sources are detected in the Chandra merged map above a 13 level in the 2–10 keV band. As Imanishi et al. (2003) has already reported, source X had an X-ray flare once with a timescale of a few hours. This clearly indicates the magnetic activity on low-mass stellar/sub-stellar core, or a (proto-)BD.
Together with the above IR behaviour, these facts indicate “stellar” cores (i.e., –size central sources which have already experienced the second core collapse) have already formed at the centers of both sources, but the central objects are still extremely young and embedded. Hereafter, we call such young objects “extremely-young Class 0 objects”.
3.3. Detection of Molecular Outflows
Another important evidence for protostellar sources to distinguish between prestellar and protostellar cores is the presence of molecular outflows and jets. In the following we search for high velocity components of molecular outflows from SM1-A and Source-X using the ALMA 12CO data.
3.3.1 SM1-A
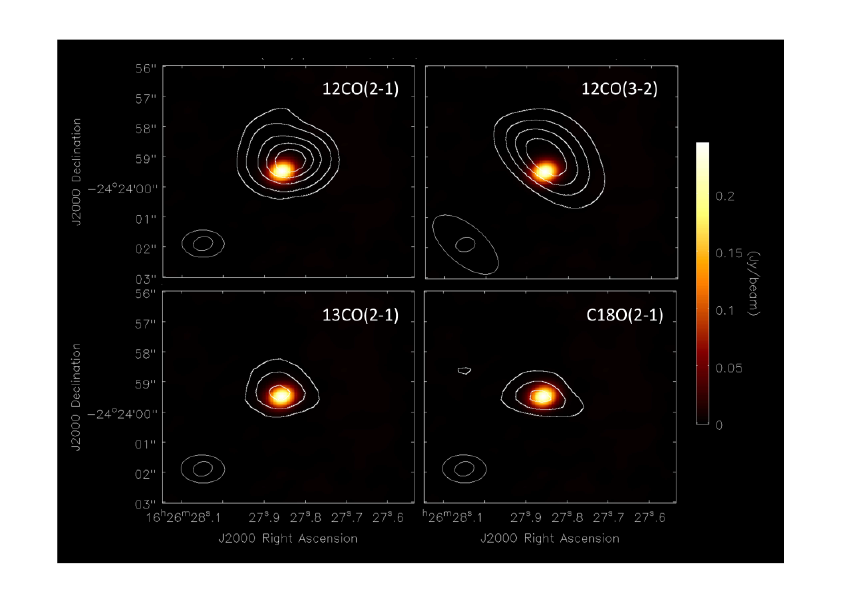
Very compact 12CO () and 12CO () emission was detected in four channel maps with central velocities of = km s-1 to 1.6 km s-1 ( = 0.7 km s-1) and km s-1 to 2 km s-1 ( 1.0 km s-1), respectively. The total integrated intensity maps are shown in Figure 5 together with those in 13CO () and C18O(), which were integrated over = 0.5 km s-1 to 2.0 km s-1. The emission is point-like and the peaks are very close to the continuum source position. For example, both 12CO peaks are located 0.7 north of SM1-A. Since the systemic velocity of the SM1 core is known to be 3.8 km s-1 from observations of optically thin molecular lines such as N2H+ () (e.g., Di Francesco et al., 2004), the CO emission is blue-shifted by 2 4 km s-1. There is no other significant 12CO emission in the ALMA and SMA maps in the 20 30 region around SM1-A although redshifted CO emission located 20 NE of SM1-A is seen in the SMA maps (near the edge of the FOV). This emission likely corresponds to the red-shifted part of an outflow from a NIR source, GY 30, found by a past CO outflow search (Kamazaki et al., 2003). The total integrated intensities of the blueshifted 12CO () and 12CO () emission are 26 0.55 Jy km s-1 and 7.34 0.28 Jy km s-1, as summarized in Table 5. The beam de-convolved size and the brightness temperature were measured to be 1.2 0.6 and 60 100 K, respectively. The simple interpretation of the blue-shifted CO emission is a very compact and low velocity outflow from the stellar core. The lack of a redshifted counter part is puzzling and might be due to the asymmetry in velocity structure or distribution of the molecular outflow itself. In addition, surrounding/ambient molecular material that potentially could have some influence (absorption) on the outflow, especially around the systemic velocity. The mass of the outflow was estimated to be between 1.3 10-4 and 1.3 10-5 where the lower and upper boundaries are for the optically thin and thick wing emission cases, respectively. (For the wing, we obtained based on unpublished single-dish 12CO () and 13CO () data.) Here, we assumed LTE condition, the CO fractional abundance of , and the excitation temperature of 20 K. The dynamical time is roughly 430 yr assuming the outflow length is roughly au and the velocity is km s-1 ( is measured from the plane of sky) and = 45. Note that even if = 75, the time is still as short as 550 yr. This outflow would be one of the most compact molecular outflows known. The inferred mass loss rate, 10 yr-1, is consistent with that expected from a typical low-mass protostar.
3.3.2 Source-X
The 12CO () integrated intensity contours superimposed on the 219 GHz continuum image are shown in Figure 6. We detected faint blue- and red-shifted emission in 12CO () to the 4 north-east of Source-X, roughly perpendicular to the elongation of dust emission at 219 GHz. Although there is no southwestern counterpart in the 12CO () emission components, a possible interpretation of these components is that they are the high-velocity outflow components from Source-X, and the outflow axis is almost parallel to the plane of sky. If this emission is indeed a low-velocity outflow, then we could compute the outflow parameters of Source-X which are listed in Table 5. The total integrated intensity of the 12CO () emission is estimated to be 1.14 0.097 Jy km s-1, which is smaller than that of SM1-A. The outflow mass is only and the mass loss rate is evaluated to be about yr-1.
3.4. SED
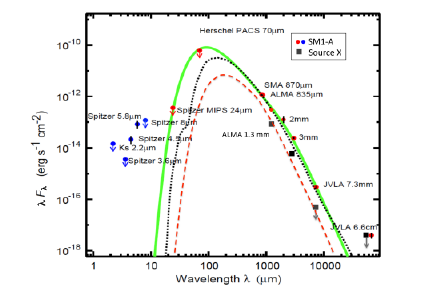
Figure 7 shows the SEDs of SM1-A and Source-X. There are several detections of cm to submm emission toward SM1-A, but only two detections at 219 GHz and 226 GHz toward Source-X. The 3 upper limits to NIR to FIR flux densities in Source-X are the same as those in SM1-A. The tentative detections in 4.5 m and 5.8 m are only 3 upper limits in SM1-A.
We compare the SED of SM1-A with the theoretical model of the first core in Figure 7. The SED of SM1-A looks similar to that of the first core, indicating that SM1-A is in the extremely early phase close to the first core formation phase.
3.5. Source Size Analysis
The source size can be derived from the beam-deconvolved size of the millimeter and submillimeter continuum emission. For SM1-A and Source-X, the beam-deconvolved sizes derived from the 359/219 GHz images (Figure 2) are 03 03 and 06 03, respectively. The beam deconvolved size is also derived to be 0.2 0.2 from the 41GHz image for SM1-A. Another method to determine size is visibility fitting assuming that the source intensity has an axisymmetric Gaussian distribution. For the assumption, we adopt the following relation;
| (1) | |||||
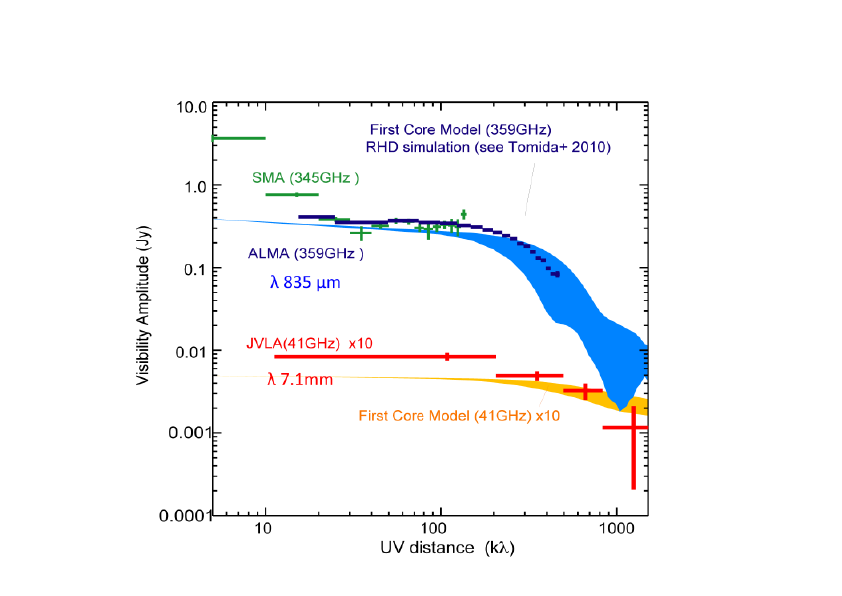
where is the distance where the visibility amplitude is a half of the peak, and is the source size (FWHM) in the image plane. In Figure 8, we show the visibility plots of SM1-A. We also compared the 359 GHz and 41 GHz visibility distributions with those expected for the first core model (Tomida et al. 2010). The 3D radiative hydrodynamics (RHD) calculation started from critical Bonnor-Ebert (BE)-like spheres as an initial condition, which have 10 K, and densities increased by a factor of 1.6 to make them unstable. The calculations were done for initial clouds with masses of 0.1 and 1.0 . The SEDs and visibility distributions were calculated for inclination angles of 60∘, and those for the 0.1 M⊙ model giving the better fits to the observations are shown in Figures 7 and 8.
The obtained source diameters from the visibility amplitude fitting of SM1-A are 0.3′′ (= 41 au) and 0.17′′ (= 23 au) for 359 GHz and 41 GHz, respectively. The source diameters derived from the visibility analysis agree well with the beam-deconvolved sizes in the image domain at the same frequencies. There is a large discrepancy between the diameters derived from 359 GHz and 41 GHz, which is likely to originate from the different optical depths (The 359 GHz emission of SM1-A is likely to be optically thick, whereas the 41 GHz emission is optically thin. See Section 4.1.1 for more detail.) The source size is a half that of Friesen et al. (2014), who derived the effective radius of 42 au, where we corrected the difference in the assumed distance.
For Source-X, we do not have enough visibility data to do the same analysis as done for SM1-A. We adopt the geometric mean of the beam-deconvoled size, 0.4 (= 55 au), as the source size of Source-X. Kirk et al. (2017) measured the deconvolved size of for Source-X, which is slightly larger than our estimate.
3.6. X-ray Properties; and
From the merged data, we made averaged source spectra, the response files, and the background files, for SM1-A and Source X, using the CIAO software “combine_spectra”. Both of the source regions are a circle with radius of 3 arcsec, centered at the respective sources. A common background region was used for both sources, taken from a source-free region in a circle with radius of 37 arcsec, centered at (, ) = (16h26m29390, 24°24′5294). The background region is located at the same CCD chip which both sources are on.
We fitted the spectra using the thin thermal plasma model (the Astrophysical Plasma Emission Code, Smith et al. 2001) along with the photoelectric absorption model (WABS: Balucinska-Church & McGammon 1992). In the photoelectric absorption model, we adopted the Wisconsin cross-sections (Morrison & McCammon 1983) and the Anders & Ebihara (1982) relative abundances. The metal abundances and the plasma temperatures were fixed to 0.3 solar and 5 keV, respectively, based on the previously derived values for Young Stellar Objects (e.g. Imanishi et al. 2001). The best-fit values of the absorbing columns and the absorption-corrected X-ray luminosities in the 0.5–10 keV band, with the errors for them in 90% confidence level, are cm-2, erg s-1) and cm-2, erg s-1) for SM1-A and Source-X, respectively.
4. Discussion
4.1. SED Fit and Derivation of Physical Properties
4.1.1 SM1-A
The most remarkable new finding is that SM1-A is extremely dense and has an optically thick surface at 359 GHz with a radius of r 21 au as derived below. Firstly, the SED fit with a uniform dust temperature () source model with a radius 0.′′15 ( = 21 au) was taken to derive , the optical depth at 7.3 mm (41 GHz) , and the dust opacity index . The 7.3-mm continuum emission is assumed to arise from the thermal dust emission, without free-free contamination. These parameters allow us to infer the luminosity, mass, and density of the core. We fit the observed SED using the following equations to estimate ,
| (2) |
where is the temperature of the cosmic background radiation and set to 2.7 K. is the source solid angle for SM1-A, which is assumed to be 2.4 10-12 (corresponding to a source diameter of 41 au) at both 41 GHz and 359 GHz for simplicity. The function is the Planck function and the opacity is expressed as
| (3) |
The fit to its SED, i.e, the obtained flux densities at 7.3 mm and 835 m (359 GHz) together with the 24 m and 70 m 3 upper limits, gives us K, = 1.5 2, and 0.18. The optical depth at 835 m is expressed as = (7.3/0.835)β , hence = 5 14. This value indicates that SM1-A has an optically thick surface at submillimeter wavelengths, i.e., a submillimeter photosphere, at = 40 K. On the other hand, the optical depth at 41 GHz is much smaller than unity, i.e., SM1-A is optically thin. The object presumably has the centrally-condensed density distribution. The optically-thin 41 GHz emission can trace the inner denser region which cannot be seen at the optically-thick 359 GHz. This would be the reason why the estimated source size at 41 GHz is smaller than that at 359 GHz.
Secondly, we estimate the luminosity and density of the core, where we assume a uniform-density spherical core with the opaque surface at 21 au and a temperature of 40 K. The luminosity of SM1-A calculated so is 0.035 , directly using
| (4) |
where is the Stefan-Boltzmann constant. The opacity-corrected mass is given as
| (5) |
and we estimate to be 0.0540.27 for 40 K, 1.5 2, and pc. This is in good agreement with that of Friesen et al. (2014). Assuming spherical symmetry, the mean number density and volume density are estimated to be cm-3 and g cm-3, respectively, which meet those expected for a first core (Masunaga et al., 1998; Bate et al., 2002; Saigo et al., 2008; Tomida et al., 2010, 2013). In addition, the luminosity, 0.035 , is mostly in the range of that predicted for a first core ( 0.06 ). For comparison, we list the physical quantities of the first core predicted from numerical simulations in Table 4 (Larson, 1969; Masunaga et al., 1998; Saigo et al., 2008). This similarity in physical quantities between SM1-A and the first core models indicates that SM1-A is extremely young object. Taking into account the fact that molecular outflows and X-ray emission are detected, SM1-A is likely to be an extremely-young proto-brown dwarf or protostar which already has a second core inside (i.e., an extremely-young Class 0 object).
4.1.2 Source-X
Source-X is lacking data to constrain its physical nature due to its limited detection at 100/219/226 GHz. Instead of modelling, we assume = 20 K ( 12 K is obtained for the source at 218 GHz, and should be higher than that if the emission at 218 GHz is not optically thick.) In addition, we assume since the spectral index between 218 GHz and 41 GHz is larger than 3.4. These assumptions and the observed properties yield a mass range of and a number density of cm-3. Kirk et al. (2017) derived the mass of 0.071 in 3 mm, somewhat larger than our estimation, but it is consistent with each other, taking into account the effects of the different parameters. These values are also consistent with those predicted by the first core model. This indicates that Source-X is in the similar evolutionary phase as SM1-A.
The derived physical parameters of Source-X are listed in Table 5.
4.2. Comparison of X-ray Properties among YSOs in Oph
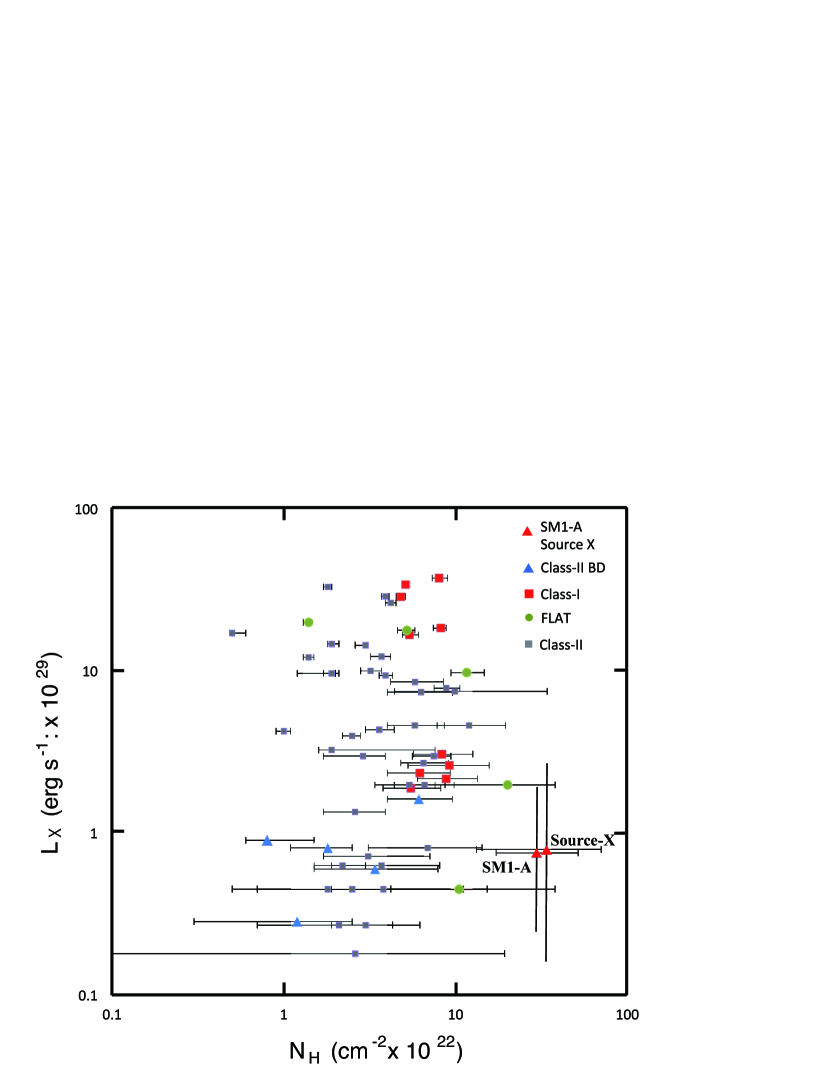
The absorbing column densities () and absorption-corrected X-ray luminosities () for SM1-A and Source-X are plotted in Figure 9. The values for YSOs in Oph reported by Imanishi et al. (2003) are also plotted, after conversion of the X-ray luminosity using updated distance of 137 pc. The errors for the X-ray luminosities of the YSOs are not indicated, because Imanishi et al. (2003) did not provide the errors of the X-ray luminosities. Interestingly, the derived X-ray luminosities of SM1-A and source X are almost the same level of those for Class-II type BDs, although they are not inconsistent with the other types (e.g. Class-II non-BDs).
The column density of absorbing material derived from the X-ray emission is cm-2, the highest among Class-I Chandra sources in the Oph region. This is more evidence that the sources are extremely young Class 0 objects. On the other hand, column densities are estimated to be an order of cm-2 from the obtained masses or number densities assuming the cores are spherically symmetric and uniform in density: e.g., a core density of cm-3 and a core radius of au ( 1014 cm) produce the column density to the central stellar core, 1025-26 cm-2. This discrepancy between X-ray and mm/sub-mm estimates will be reconciled if the cores have not spherically symmetric but disk-like structures where column densities decrease rapidly as viewing angles changing from edge-on to pole-on. In fact, Source-X seems to have a disk-like structure perpendicular to the outflow since the beam decomvolved size of the 219 GHz image is with PA=124 deg as noted in Section 3.5. According to theoretical studies (e.g., Saigo et al. 2008), a centrifugally supported disk as a remnant of the first core remains even after the stellar core formation in a rotating core. The extremely dense cores in SM1-A and Source-X would be such remnants of the first cores surviving in extremely-young Class-0, which can be detected in X-ray due to preferable viewing angles with less absorbing column densities.
4.3. SM1-A and Source-X are proto-BDs?
As we showed above, we discovered two extremely-young Class 0 objects with substellar masses. The fates of these low-mass objects remain uncertain. Taking into account the masses derived from the dust continuum emission, they can potentially evolve into brown dwarfs unless they gain significant masses from the surroundings. There are at least two widely-discussed scenarios for brown dwarf formation (Machida et al. 2009, Basu & Vorobyov 2012). One is the gravitational contraction of a very low-mass core. This scenario considers that brown dwarfs form similarly to low-mass stars. Starting from a spherical magnetized core with 0.22 M⊙, Machida et al. (2009) demonstrated that brown dwarf can form from such a low-mass dense core. Another scenario is the dynamical ejection from multiple systems (e.g., Reipurth & Clarke 2001) or circumstellar disks (e.g., Basu & Vorobyov 2012). Here, we briefly discuss the possibility that these objects evolve into brown dwarfs on the basis of the two scenarios.
4.3.1 Comparison with Machida et al. (2009)
Machida et al. (2009) performed 3D MHD simulations of the brown dwarf formation. Their initial condition was a critical Bonner-Ebert sphere of masses of 0.22 . For SM1-A and Source-X, the dynamical times of the outflows are estimated to be yrs. In the model by Machida et al. (2009), the outflow mass and mass loss rate are derived to be and yr-1, respectively, at the evolution time of 500 yrs from the first core formation epoch. The luminosity is estimated to be with a radius of 2 . This is somewhat smaller than the values derived from the observations. The outflow mass and mass loss rate are significantly smaller than those obtained from the observations. If SM1-A and Source-X formed from compact dense cores, their evolution seems to be consistent with this numerical simulations.
4.4. Ejection from VLA1623A protostellar binary?
According to the dynamical time of the molecular outflow detected, the ages of two sources are likely to be 500-1000 yrs or less after the central stellar core formation. Such very young sources should be very rare even in the Oph star-forming region, hence it will be very unusual that two are independently formed and located closely in the small 5000 au region. It should be noted that similar types of sources are not detected with the similar ALMA 149-pointing imaging in the Oph-B2 region (Kamazaki et al 2018). One possible common origin of the two sources would be ejections from the VLA1623 region.
Reipurth & Clarke (2001) proposed that a possible observational test of the ejection scenario is brown dwarf searched in the vicinity of Class-0 sources with an age of years. If stellar embryos or first core like dense gas cores are ejected from the Class-0 object in the phase of disk/envelope fragmentation, one might expect to detect one or more (proto) brown dwarfs around the Class 0 object. The apparent separations from the Class-0 object VLA1623A to SM1-A and Source-X are 5000 au and 2600 au, respectively. The two sources, SM1-A and Source-X, are located at PA= 30 to 50 deg. measured from VLA1623A, and mostly aligned with the orbital plane of the disk-like envelope seen in C18O (PA= 32 deg; Murillo et al. 2013). If we assume their ejection velocity to be roughly 3 km s-1, a factor of 1.5 higher than the rotating velocity of the innermost in the envelope, 2 km s-1, and also assume the travels are along the plane of sky, the dynamical times to travel to the current locations are estimated to be 8000 yrs and 4000 yrs for SM1-A and Source-X, respectively. For that two are moving at 60 deg to the plane of sky, the timescale is doubled but still roughly consistent with the age of the Class-0 object.
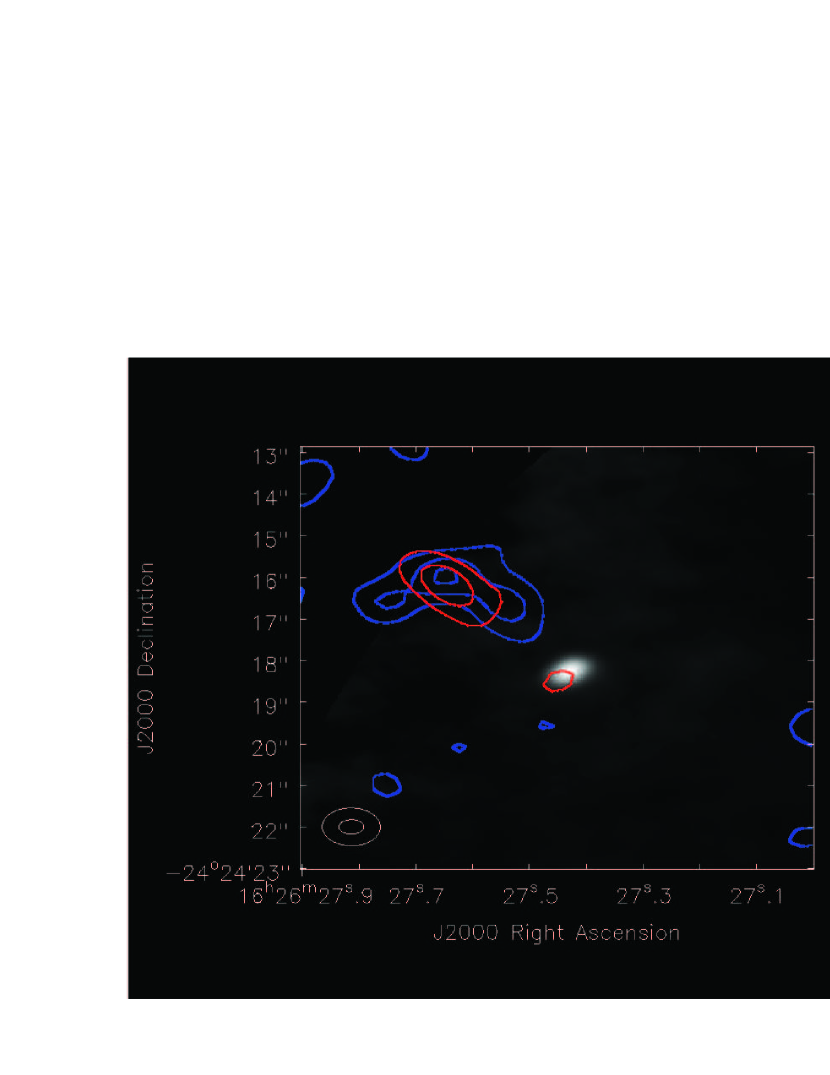
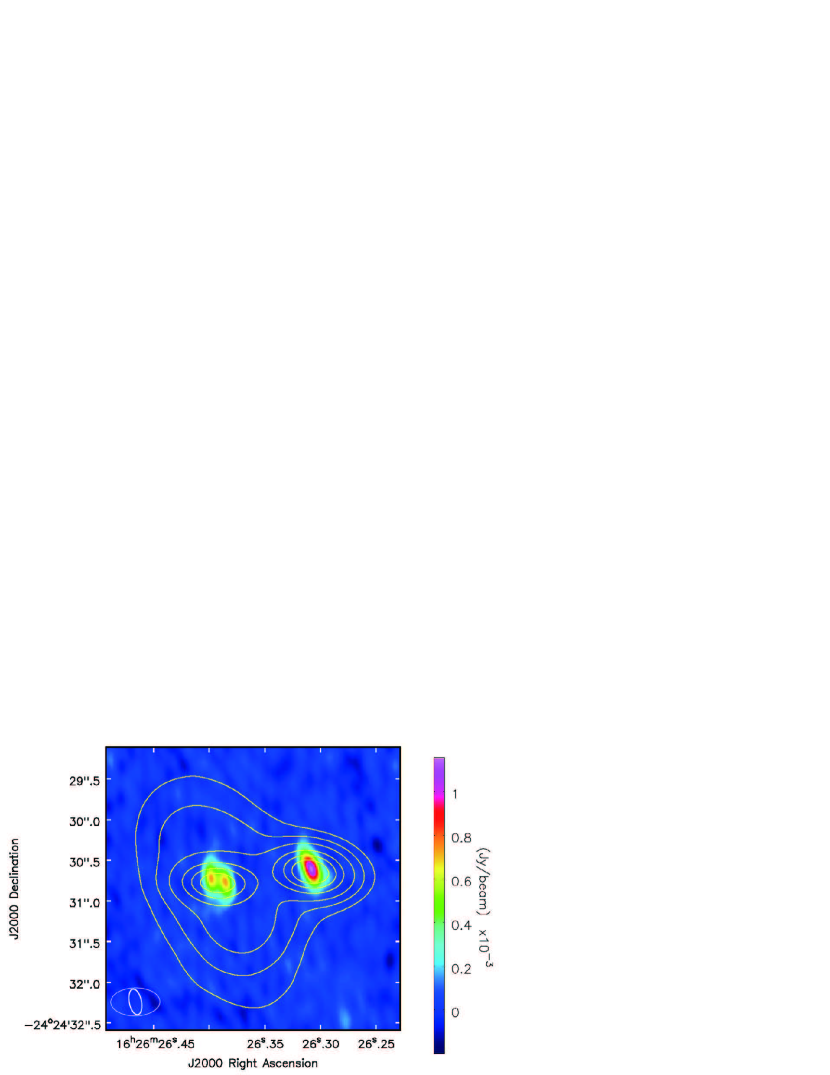
Unexpectedly, VLA1623A was resolved to two sources separated by 0.2 (25 au) with the recent ALMA observations (Harris et al. 2018) and our JVLA 7mm observations (see Figure 10) suggesting an equal-mass ( 0.050.1 M⊙) protostellar binary. The disk-like structure in C18O is likely to be common envelope of the binary. The binary would be evidence for disk fragmentation. Each mass of the binary seems to be larger than SM1-A and Source-X, hence the binary could eject the 3-rd less mass object in the system (e.g., Reipurth & Clarke, 2001). These observations seem to be consistent with the ejection scenario, especially hybrid scenario (Basu & Vorobyov 2012); first core like dense clumps are ejected, and the ejected clumps formed very low mass stars afterward. It is noted that the discrepancy between the traveling times of SM1-A and Source-X and the dynamical timescales of the outflow would be reconciled with the hybrid scenario, i.e., recent (1000 yrs) second collapses in ejected first core like clumps triggered outflow and X-ray activity. Furthermore, Tomida et al. (2011) showed with radiation hydrostatic simulations that first cores formed in very low-mass cores lives longer than yrs. If ejected cores evolve similarly such first cores, they can travel 6000 au at 3 km s-1 in yr.
However, further observations should be required to pursue the ejection scenario more quantitatively and carefully. Some of clumps may be tidally disrupted during ejection and disperse according to the simulation (e.g., Basu & Vorobyov 2012, Stamatellos & Whitworth 2009). Such failed cores may be found around VLA1623A, and tidally formed arms as fossil of interaction may be also detected even around SM1-A and Source X in the further more sensitive observations. Since the eastern area of VLA 1623 has no significant dense gas, the other ejected objects might be found from future high-angular resolution, high sensitivity observations.
5. Summary
Based on SMA, ALMA, JVLA, and Spitzer data, we have discovered two candidates of forming brown dwarfs or low-mass stars in the Ophiuchus A region. Detections of small outflow lobes and X-ray emission imply that they are in the extremely early formation phases of protostars or proto-BDs. The similarity in the physical nature to the FHSCs indicates that they just passed the FHSC formation phase.
We summarize the primary results of the present paper as follows:
-
1.
We analyzed submillimeter, infrared, and X-ray data of two bright and compact dust continuum sources in Oph A, and compiled their SEDs. One, SM1-A, is located in the densest part of the Oph A ridge, and previously named SM1. We call the core SM1-A. The other, Source-X, is located south of SM1-A.
-
2.
Both objects are mostly invisible in infrared, but are seen in X-ray, with time-variability in Source-X. This detection indicates that these objects have already experienced second core collapse.
-
3.
We detected possible CO outflow lobes for both cores. For SM1-A, we detected high velocity blue-shifted components in 12CO (), 12CO (), 13CO (), and C18O (). For Source-X, we detected faint blueshifted and redshifted lobes in 12CO (). The dynamical timescales of the outflows was estimated to be several hundred years for both sources.
-
4.
From the SED fits, we derived masses of 0.0280.14 and 0.0140.03 for SM1-A and Source-X, respectively. The number densities are estimated to be cm-3 and cm-3, for SM1-A and Source-X, respectively. The masses of these objects are substellar ( ). These values are consistent with those predicted by the first core model. Taking into account the fact that these sources show the protostellar signatures, i.e., outflows and X-ray emission, these objects presumably passed only several hundred years from the the first hydrostatic core formation. We call such object “extremely-young Class 0 objects.
-
5.
From their SEDs, X-ray activity, and CO outflow lobes, we speculate that two cores are proto-brown dwarfs if they gain more mass only from remnants of the first cores or will evolve into protostars after they gain more masses from surroundings. For the latter case, these two objects might be stellar seeds in the competitive accretion scenario.
References
- Alves et al. (2001) Alves, J. F., Lada, C. J. & Lada E. A. 2001, Nature, 409, 159
- Alves de Oliveira et al. (2013) Alves de Oliveira, C., Ábrahám, P., Marton, G., et al. 2013, A&A, 559, A126
- Anders & Ebihara (1982) Anders, E. & Ebihara, M., 1982, , Geochimica et Cosmochimica Acta 46, 2363
- André et al. (1993) André, F., Ward-Thompson, D., & Barsony, M. 1993, ApJ, 406, 122
- André et al. (2009) André, F., Basu, S., & Inutsuka, S. 2009, Structure Formation in Astrophysics, G. Chabrier, Cambridge: Cambridge Univ., 254
- Balucinska-Church & McGammon (1992) Balucinska-Church, M. & McGammon, D. 1992, ApJ, 400, 699
- Basu & Vorobyov (2012) Basu, S., & Vorobyov, E. 2012, ApJ, 750, 30
- Bate et al. (2002) Bate, M., Bonnell, I. & Bromm, V. 2002, MNRAS, 322, L65
- Bate (2010) Bate, M. 2010, MNRAS, 404, 79
- Bjerkeli et al. (2012) Bjerkeli, P. et al. 2012, A&A, 549, A29
- Bonnell et al. (2000) Bonnell, I. A., Bate, M. R., Clarke, C. J., & Pringle, J. E. 2000, MNRAS, 323, 785
- Di Francesco et al. (2004) Di Francesco, J., André, P. & Myers, P. C., 2004, ApJ, 617, 425
- Chen et al. (2010) Chen, X. et al., 2010, ApJ, 715, 1344
- Dzib et al. (2013) Dzib, K. et al. 2013, ApJ, 755, 63
- Enoch et al. (2010) Enoch, M. L. et al., 2010, ApJ, 722, L33
- Gagné et al. (2004) Gagné, M., Skinner, S., & Daniel, K. 2004, ApJ, 613, 392
- Fazio et al. (2004) Fazio, G.G. et al. 2004, ApJS, 154, 10
- Friesen et al. (2014) Friesen, R., Di Francesco, J., Bourke, T. L. et al. 2014, ApJ, 797, 27
- Hara et al. (2013) Hara, C. et al. 2013, ApJ, 771, 128
- Haris et al. (2018) Haris, R. et al. 2018, ApJ, 861, 91
- Hayashi (1966) Hayashi, C. 1966, ARA&A, 4, 171
- Hildebrand (1983) Hildebrand, R. H. 1983, Q. J. R. Astron. Soc. 24, 267
- Ho et al. (2004) Ho, P.l T. P., Moran, J. M., Lo, K. Y., 2004, ApJ, 616, 1
- Imanishi et al. (2001) Imanishi, K. et al. 2001, ApJ, 557, 747
- Imanishi et al. (2003) Imanishi, K. et al. 2003, PASJ, 55, 653
- Inutsuka et al. (2010) Inutsuka, S., Machida, M., & Matsumoto, T. 2010, ApJ, 718, L58
- Kamazaki et al. (2001) Kamazaki, T. et al., 2001, ApJ, 548, 278
- Kamazaki et al. (2003) Kamazaki, T. et al., 2003, ApJ, 584, 375
- Kamazaki et al. (2018) Kamazaki, T. et al., 2018, submitted to ApJ
- Kirk et al. (2017) Kirk, H., Dunham, M. M., Di Francesco, J., et al. 2017, ApJ, 838, 114
- Kunde & Hog (1998) Knude, J., & Hog, E. 1998, A&A, 338, 897
- Larson (1969) Larson, B. R. 1969, MNRAS, 145, 271
- Loinard et al. (2008) Loinard, L., Torres, R. M., Mioduszewski, A. J., & Rodriguez, L. F. 2008, ApJ, 675, L29
- Lombardi et al. (2008) Lombardi, M., Lada, C. J., & Alves, J. 2008, A&A, 480, 785
- Luhman et al., (2007) Luhman, K.L. et al. 2007, Protostar and Planets V, B. Reipurth, D. Jewitt, and K. Keil, Arizona: The university of Arizona Cambridge Press, 443
- Machida et al. (2008) Machida, M., Inutsuka S., & Matsumoto, T. 2008, ApJ, 676, 1088
- Machida et al. (2009) Machida, M., Inutsuka S., & Matsumoto, T. 2009, ApJ, 699, L157
- Matsumoto & Hanawa (2003) Matsumoto, T. & Hanawa, T. 2003, ApJ, 595, 913
- Masunaga et al. (1998) Masunaga, H, Miyama, S., & Inutsuka S. 1998, ApJ, 495, 346
- Morrison & McCammon (1983) Morrison, R. & McCammon, D. 1983, ApJ, 270, 119
- McKee & Ostriker (2007) McKee, C. F. & Ostriker, E. C., 2007, araa, 45, 565
- Murillo et al. (20133) Murillo, N. M., Lai, S.-P., Bruderer, S. et al. 2013, A&A, 560, 103
- Nakamura et al. (2012) Nakamura, F., Takakuwa, S. & Kawabe, R. 2012, ApJ, 758, L25
- Ortiz-Leon et al. (2017) Ortiz-Leon, G. N., Loinard L., Kounkel, M. A., et al. 2017, ApJ, 834, 141
- Pineda et al. (2011) Pineda, et al. 2011, ApJ, 743, 2011
- Reipurth & Clarke (2001) Reipurth, B., & Clarke C., 2001, AJ, 122, 432
- Rieke et al. (2004) Rieke, G.H. et al. 2004, ApJS, 154, 25
- Sault et al. (1995) Sault, R. J., Teuben, P. J., & Wright, M. C. H. 1995, Astronomical Data Analysis Software and Systems IV, ASP Conference Series, Vol. 77, R. A. Shaw, H. E. Payne, & J. J. E. Hayes, eds., p.433
- Saigo et al. (2008) Saigo, K., Tomisaka, K. & Matsumoto, T. 2008, ApJ, 674, 997
- Saigo & Tomisaka (2011) Saigo, K. & Tomisaka, K. 2009, ApJ, 728, 78
- Scoville et al. (1993) Scoville, N. Z., Carlstrom, J. E., Chandler, C. J., et al. 1993, PASP, 105, 1482
- Shu et al. (1987) Shu, F. H., Adamas, F. C. & Lizano, S., 1987, ARA&A, 25, 23
- Smith et al. (2001) Smith, R., K., Brickhouse, N. S., Liedahl, D. A. et al., 2001, ApJ, 556, L91
- Stamatellos, & Whitworth (2009) Stamatellos, D., & Whitworth, A. 2009, MNRAS, 392, 413
- Tomida et al. (2010) Tomida, K. et al. 2010, ApJ, 725, L239
- Tomida et al. (2013) Tomida, K. et al. 2013, ApJ, 763, 6
- Tomisaka (2002) Tomisaka, K., 2002, ApJ, 575, 306
- Ward-Thompson et al. (1989) Ward-Thompson, D., Robson, E. I., Whittet, D. C. B. et al. 1989, MNRAS, 241, 119
| Freq. | Array | date | RA (J2000) | decl (J2000) | FOV | Beam Size (PA) | rmsa | Comment |
|---|---|---|---|---|---|---|---|---|
| [GHz] | [h:m:s] | [°: ′: ″] | [″] | arcsecarcsec (∘)] | [mJy] | |||
| 41 | JVLA | 2012 Sep 03 | 16:26:27.4 | 24:24:08 | 73 | 0.32 0.15 (11.4) | 0.038 | |
| 219 | ALMA | 2014 Aug 17 | 16:26:26.39 | 24:24:30.688 | 29 | 0.6 0.34 (89.27) | 0.084 | Cycle-2c |
| 226 | ALMA | 2015 Mar 01 | 16:26:27.6 | 24:23:55.0 | 180 120b | 1.4 0.92 (81.1) | 0.024 | Cycle-2d |
| 345 | SMA | 2007 July 29 | 16:26:27.6 | 24:23:55.0 | 36 | 2.6 1.26 (49.3) | 10.5 | e |
| 359.2 | ALMA | 2012 Aug 24 | 16:26:27.83 | 24:23:59.2 | 17.3 | 0.64 0.46 (76.7) | 0.39 | Cycle-0f |
| 372.4 | ALMA | 2012 July 02 | 16:26:27.83 | 24:23:59.2 | 16.7 | 0.59 0.42 (75) | 1.15 | Cycle-0f |
| Continuum & Line | Rest frequnecy | Beam Size (PA) | noise levelb | |
|---|---|---|---|---|
| (GHz) | (km s-1) | arcsecarcsec (∘) | ||
| continuum | 226a | 1.4 0.92 (81.1) | 0.024 (mJy beam-1) | |
| 12CO () | 230.538000 | 0.096 | 1.39 0.91 (89.0) | 0.02 (Jy beam-1 km s-1) |
| 13CO () | 220.398684 | 0.096 | 1.45 0.94 (88.0) | 0.02 (Jy beam-1 km s-1) |
| C18O () | 219.560358 | 0.096 | 1.45 0.94 (88.0) | 0.015 (Jy beam-1 km s-1) |
| source | telescope | wavelength | Total Flux Density | Peak Flux Density | Beam Size (PA) | reference/comment |
|---|---|---|---|---|---|---|
| [] | [mJy] | [mJy beam-1] | [″(°)] | |||
| SM1-A | Chandraa | (2–10 keV) | 23 counts; 13 | – | 1.5 | this paper |
| IRTFSIRIUS | 2.2 | – | 0.011 | 0.5 | ||
| SpitzerIRAC | 3.6 | – | 0 .0044 | 1.66 | upper limit | |
| SpitzerIRAC | 4.5 | – | 0.0310.01 | 1.72 | marginal detection | |
| SpitzerIRAC | 5.8 | – | 0.160.05 | 1.88 | marginal detection | |
| SpitzerIRAC | 8.0 | – | 0.31 | 1.98 | upper limit | |
| SpitzerMIPS | 24 | – | 2.9 | 6 | upper limit | |
| HerschelPACS | 70 | – | 1460 | 5.86 | upper limit | |
| ALMA/B7 | 810 | 3664.6 | 264 1.15 | 0.59 0.42 (75) | ||
| ALMA/B7 | 835 | 3271.4 | 245 0.39 | 0.64 0.46 (77) | ||
| SMA | 870 | 35010b | 336 10.5b | 2.8 0.9 (50.3) | ||
| ALMA/B6 | 1300 | 118.32.0c | 116.0 0.11c | 1.4 0.92 (81.1) | ||
| NMA | 2000 | – | 84 24 | 5.2 13.4 (–) | 3 | |
| NMA | 3000 | – | 24 1.8 | 6.2 3.2 (–) | 3 | |
| JVLA | 7300 | 0.6080.065 | 0.443 0.038 | 0.32 0.15 (11.4) | ||
| JVLA | 40000 | 0.1250.056 | 0.081 0.017 | 1.24 0.66 (7.6) | 4 | |
| JVLA | 66000 | 0.1010.046 | 0.089 0.022 | 2.0 1.0 (4.8) | 4 | |
| Source-X | Chandraa | (2–10 keV) | 35 counts; 19 | – | 1.5 | this paper |
| ALMA/B6 | 1300 | 36.00.78 | 21.2 0.29 | 0.6 0.34 (89.27) | 219 GHz | |
| ALMA/B6 | 1300 | 37.9 1.1 | 35.8 0.29 | 1.4 0.92 (81.1) | 226 GHz | |
| ALMA/B3 | 3000 | 7.56 0.86 | 7.100.44 | 3.5 1.8 (71) | 107 GHz, 5 | |
| JVLA | 7300 | – | 0.114 | 0.32 0.15 (11.4) | upper limit | |
| JVLA | 40000 | - | 0.051 | 1.24 0.66 (7.6) | 4, upper limit | |
| JVLA | 66000 | - | 0.066 | 2.0 1.0 (4.8) | 4, upper limit |
Note. — Integrated and peak flux densities for images with ALMA and JVLA were obtained with Gaussian fitting to the sources.
References. — (1) Imanishi et al. (2003), (2) Gagné et al. (2004), (3) Kamazaki et al. (2001), (4) Dzib et al. (2013), (5) Kirk et al. (2017)
| property | unit | SM1-A | Source-X | First Corea |
|---|---|---|---|---|
| Mean gas density | cm-3 | (2.2 – 8.4) 1011 | 6.0 1010 | |
| Density | g cm-3 | (5.2 – 33) 10-13 | 2.4 10-13 | 10-13 |
| Radius | au | 21 | 27 | 4 – 100 |
| Mass | 0.028 – 0.14 | 0.018 – 0.039 | 0.1 | |
| Temperature | K | 40 | 20 | 100 |
| Dust Opacity index | – | 1.5 – 2 | 1.4 | 2 |
| Luminosity | 0.035 | ( 0.01) | 0.01-0.1 |
| property | unit | SM1-A | Source-X | BD modela |
|---|---|---|---|---|
| 12CO(2-1) Intensity | Jy km s-1 | 7.34 0.28 | 1.14 0.097 | |
| 13CO(2-1) Intensity | Jy km s-1 | 2.7 0.14 | 0.1 | |
| C18O(2-1) Intensity | Jy km s-1 | 0.26 0.02 | 0.15 | |
| 12CO(3-2) Intensity | Jy km s-1 | 26 0.55 | – | |
| 12CO(2-1) peak | K | 62 1.6 | 11.5 1.1 | |
| 12CO(3-2) peak | K | 104 8.1 | – | |
| Outflow Velocity | km s-1 | 3 | (5 – 10)b | 2 km s-1 |
| Size | au | 274 | 571 | 350 aud |
| Dynamical Time | yr | 434 | (285–628)b | 500d |
| Outflow Mass | (1.3-3.9) 10-4 | (1.6–2.5) 10-5c | 2 10-3 | |
| Mass Loss Rate | yr-1 | (0.3-0.7) 10-6 | (0.2 – 0.7) 10-7 | 4 10-6 |
Note. — 13CO image around Source-X is rather affected by the strong emission in the vicinity of VLA 1623 and SM1 especially at 2km s-1, and the upper limit to the 13CO intensity of the outflow component seen in 12CO is a tentative value obtained from the rms noise at 7 km s-1.