September 27, 2018
Galaxies: clusters: individual: Abell2399 — Galaxies: clusters: intracluster medium — X-rays: galaxies: clusters
High entropy and evidence for a merger in the low surface brightness cluster Abell 2399
Abstract
We present results of the X-ray analyses of the nearby cluster of galaxies Abell 2399 () using the XMM-Newton and Suzaku satellites. This cluster is classified as a low surface brightness (LSB) cluster. It has a bimodal structure in X-rays, and the X-ray-emission peaks are significantly offset from the peaks in gas temperature. By de-projecting the annular spectra, the temperature and electron density in the central region are measured to be 3.6 keV and , respectively. This yields a very high gas entropy, , in the central region, comparable to the values observed in other LSB clusters. The scaled entropy of Abell 2399 is the highest among the REXCESS cluster sample. The spatial distribution of the member galaxies exhibits multiple substructures, the locations of which are significantly different from those in the X-ray image. We discovered a clear discontinuity in the X-ray brightness and temperature distributions in the western gas clump, which provides evidence of the presence of a cold front. Therefore, our results strongly suggest that A2399 has experienced a merger and that the high central entropy originates from the merger activity.
1 Introduction
A low surface brightness cluster of galaxies (hereafter an LSB cluster) is a type of cluster that has an extremely low X-ray surface brightness and a highly irregular morphology. Several LSB clusters have been identified in the REXCESS cluster sample, which make up 5–10% of the cluster sample detected by the ROSAT All-Sky Survey (Böhringer et al. 2013, 2017). One requires deep observations to investigate the detailed gas properties of such clusters because of their extremely low brightness (typically in the 0.1–2.4 keV band) and diffuse gas distribution without a prominent core. Hence their evolution remains a puzzle. Since upcoming cluster surveys–by, e.g., eROSITA on the SRG satellite–are expected to detect a large number of clusters including faint ones (Merloni et al. 2012), it is important to understand the properties of LSB clusters, which may not follow the mass-scaling relations of bright clusters.
The Suzaku satellite (Mitsuda et al. 2007) has been used to analyze a few LSB clusters in detail. A76 is an archetype LSB cluster; it has the lowest surface brightness among the ROSAT clusters studied by Neumann & Arnaud (1999) and an irregular morphology. Ota et al. (2013) reported that A76 has an exceptionally high gas entropy in the central region, , and a low electron density, of the order of , for the observed mean gas temperature of 3 keV. This result is not explained either by gravitational heating or by preheating. A similar trend has been found in other LSB clusters, such as A548W (Nakazawa et al. 2016) and A1631 (Babazaki et al. 2018). Babazaki et al. (2018) noted that the central entropy of A1631 is one of the highest () among known nearby clusters, while the X-ray luminosity is lower by a factor of 3 than that expected from the luminosity-temperature relation for relaxed clusters. In addition, they found that the spatial distribution of the gas is significantly different from that of the member galaxies and they proposed a post-merger scenario to explain the production of high entropy gas in this irregular cluster.
To clarify the nature of LSB clusters, we need to increase the number of clusters in the sample. In this paper, we conduct an X-ray imaging and spectroscopic study of the LSB cluster Abell 2399 at using the XMM-Newton and Suzaku satellites. The good spatial resolution of XMM-Newton enables us to derive the temperature distribution of the hot gas associated with substructures in the cluster. In addition, we have searched for discontinuities in the X-ray surface brightness as an indicator of the merger activity. Suzaku’s low-background level allows us to measure the gas-entropy profile out to the virial radius. We have also compared the spatial distributions of the galaxies and the hot gas in this system because rich spectroscopic data in optical are available for the member galaxies (Moretti et al. 2017). In previous studies, A2399 (the alternative name is RXC J2157-0747) has been analyzed within the REXCESS sample (Böhringer et al. 2007); the profiles of gas density and entropy were determined up to by Croston et al. (2008) and Pratt et al. (2010) and the morphological investigation was also studied by Böhringer et al. (2010). They noted that RXC J2157-0747 has a higher entropy and is one of outliers in the substructure characterization such as a power ratio and a centroid shift parameter among the REXCESS sample even though they did not pursue the origin of the specific properties.
This paper is organized as follows: In section 2 we present the X-ray observations of A2399 with Suzaku and XMM-Newton and the data reduction. Sections 3–4 describe the results from our imaging and spectral analyses. In section 5, we discuss the X-ray and optical properties and propose a scenario to interpret the data. Where necessary, we assume the standard cosmological model, with a matter density , a cosmological constant , and a Hubble constant . At the cluster redshift , corresponds to 68 kpc. In this paper, we have employed HEAsoft v6.21 and XSPEC version 12.9 to perform fitting of the X-ray spectra, and we have used the metal-abundance table of Anders & Grevesse (1989). Unless otherwise stated, the error ranges show the 90% confidence levels from the central values.
2 Observation and data reduction
2.1 Suzaku
In November 2014, four-pointed Suzaku observations of A2399 (the center, east, west, and north) were performed. Table 2.1 summarizes the basic information about the observations. Four X-ray sensitive CCD cameras–known as the XIS instruments–are installed on Suzaku. Three of the CCD cameras are front-illuminated (XIS-0, -2, -3), and the other is back-illuminated (XIS-1) (Koyama et al. 2007). During the observation periods, the XIS-0, -1 and -3 CCD cameras were operated in normal mode with space charge injection enabled (Uchiyama et al. 2009).
Logs of Observations of A2399 with Suzaku and XMM-Newton Target Obs ID Date RA. Dec. Net Exposure [deg] [deg] [ks] Suzaku/XIS A2399 West 809020010 2014-11-11 329.1831 -7.8643 23.1 A2399 Center 809022010 2014-11-12 329.2851 -7.5651 26.0 A2399 North 809021010 2014-11-12 329.3708 -7.7975 18.6 A2399 East 809023010 2014-11-15 329.5573 -7.7299 20.9 XMM-Newton/EPIC RXC J2157-0747 (A2399) 0654440101 2010-06-07 329.3573 -7.7987 54.9∗*∗*footnotemark: (MOS1), 59.5∗*∗*footnotemark: (MOS2), 26.2\*\*footnotemark: (PN) {tabnote} ∗*∗*footnotemark: Net exposure time after removal of periods of high background flaring.
We used standard Suzaku pipeline processing to create event files with CALDB [v2016-06-07 for XIS and v2011-06-30 for the X-ray telescopes (XRTs: Serlemitsos et al. 2007)]. We used the following criteria to screen the data: Earth elevation angle , day-Earth elevation angle , and time removal during the South Atlantic Anomaly. As an additional correction, we removed flickering pixels111https://heasarc.gsfc.nasa.gov/docs/suzaku/analysis/xisnxbnew.html. We also excluded point sources detected by XMM-Newton (see subsection 2.2) from this Suzaku analysis.
We determined the X-ray background from the XIS spectra in the northern field, Mpc away from the center (figure 1 (a)). We subtracted the detector background and evaluated other background components assuming the same models as used in, e.g., Mitsuishi et al. (2012) and Babazaki et al. (2018), which consists of the comic X-ray background (CXB) and the Galactic X-ray background (GXB). Table 1 summarizes the best-fit parameters, and they are consistent with typical values for the CXB and GXB components (e.g., Kushino et al. 2002; Yoshino et al. 2009). Thus, we incorporate this background model in the spectral analysis.
| NormLHB∗*∗*footnotemark: | NormGH∗*∗*footnotemark: | NormCXB††\dagger††\daggerfootnotemark: | /d.o.f | |||
|---|---|---|---|---|---|---|
| keV | keV | |||||
| 0.1 (fixed) | 0.30 | 1.4 (fixed) | 72/62 |
Normalization of the APEC model divided by a solid angle (sr). in units of ,
where, , , , and are the electron and hydrogen number densities (cm-3), the angular diameter distance (cm) and the emission volume (cm3),
respectively. Here, “LHB” denotes the local hot bubble, and “GH” the Galactic halo, respectively.
††\dagger††\daggerfootnotemark: The unit is photons keV-1 cm-2 s-1 sr-1 at 1 keV.
2.2 XMM-Newton
We retrieved three datasets containing A2399 (RXC J2157-0747) from the XMM-Newton Science Archive. We used only the one data set OBSID 0654440101 in the analysis because two of them are heavily contaminated by soft-proton flares, .
We performed data reduction for the set of three X-ray CCD cameras on board XMM-Newton– the European Photon Imaging Camera (EPIC)–in the standard manner, using the ESAS (Extended Source Analysis Software) package (Snowden et al. 2008) in SAS version 16.0.0. We removed high background periods, for which the rates were beyond the 2 range of the rate distribution. Table 2.1 shows the observation identifications and the net exposure times after filtering. We used an ESAS routine to detect point sources in each detector and removed them from our analysis.
3 X-ray images
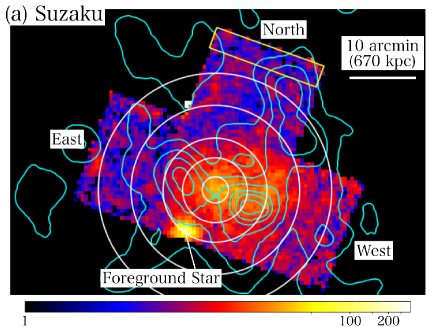
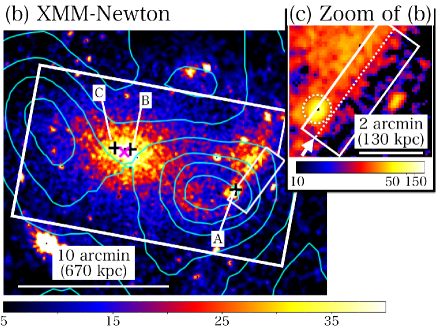
Figures 1 (a) and (b) show Suzaku/XIS-1 and XMM-Newton/EPIC images of A2399 in the 0.5–5.0 keV band, respectively. In the XIS image, diffuse cluster emission is detected out to the virial radius Mpc or . Here the virial radius is estimated from the global temperature keV and the relation (Arnaud et al. 2005) which is obtained from clusters in the temperature range of 2–9 keV.
In the EPIC image, the cluster shows a bimodal structure; the main gas clump in the east and a smaller (“the sub”) gas clump in the west each have a projected distance of 500 kpc. The X-ray surface brightness of the main clump has a peak (329.3790, -7.7982) after removal of point-like sources, and it appears to be extended in the southwest-northeast direction. On the other hand, the subclump has a rather elongated shape, extending in the southeast-northwest direction (see also Böhringer et al. 2007).
The bright X-ray point-like sources located around the center of the main / sub clumps correspond to the three brightest cluster galaxies (BCGs; Smith et al. 2004; Cava et al. 2009; Varela et al. 2009; Moretti et al. 2017) around redshift of A2399, i.e., WINGS J215701.72-075022.0, WINGS J215729.43-074744.1, and, WINGS J215733.47-074738.8, and they are denoted by A, B, and, C, respectively, in figure 1 (b).
4 X-ray spectra
To investigate the spatial distributions of the physical quantities that characterize the cluster gas, we performed X-ray spectral analyses using the XMM-Newton and Suzaku data. We define two kinds of spectral-integration regions in subsection 4.1, and we present the results of our analysis in subsections 4.2 and 4.3.
4.1 Definitions of spectral regions
As figure 1 indicates, we extracted spectra from the following two kinds of regions:
-
(i)
Bridge regions along the gas clumps (12 boxes; ).
-
(ii)
Annular regions centered on the X-ray peak of the main clump after removal of point sources (section 3). Considering the PSF size of the Suzaku XRT, five radial bins are chosen as follows: , , , , and , which correspond to kpc, kpc, kpc, kpc, and kpc. Note that the first three rings are extracted from the ‘A2399 Center’ field and thus cover a position angle , while the outer two rings in the east, north, and west directions are extracted from the ‘A2399 East’, ‘A2399 North’, and ‘A2399 West’ fields of view, respectively and thus each region has a sector angle of about 90\degree.
For (i), we used only the XMM-Newton data to take advantage of its higher angular resolution and to avoid contamination from the point sources (section 4.2). For (ii), we used the Suzaku data to capitalize on its stable and low background characteristics, which enable us to study low surface brightness signals out to the virial radius for the first time (section 4.3).
4.2 Bridge regions along the gas clumps
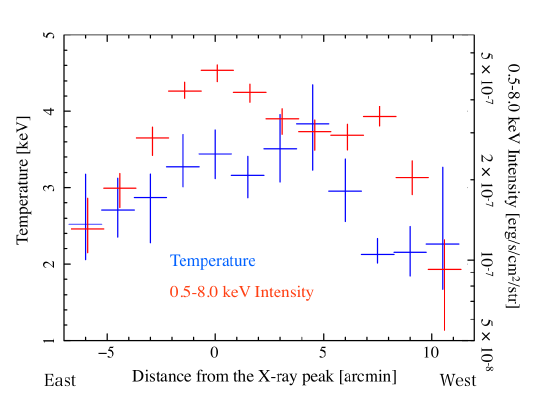
To investigate the temperature and intensity profiles along the axis connecting the main and sub gas clumps, we extracted XMM-Newton spectra from the 12 boxes defined in (i) of the previous subsection (see also figure 1 (b)). We fitted the 0.5–11.0 keV spectra to the sum of the X-ray background, the cluster, and a soft proton background model, in the same manner as in Babazaki et al. (2018). For the X-ray background emission, we took into account the local hot bubble (LHB), the Galactic halo (GH), and the cosmic X-ray background (CXB) components. The parameters of the X-ray background components are limited to the error ranges given in table 1. The power-law function representing the soft proton contamination was included with the diagonal response files distributed by the XMM-Newton team. The photon indices for the MOS1 and MOS2 spectra are linked to each other, as indicated in the guidelines given in the ESAS manual222https://heasarc.gsfc.nasa.gov/docs/xmm/esas/cookbook/xmm-esas.html. The Galactic column density is fixed at based on the HI maps (Kalberla et al. 2005). In the model for the hot cluster gas, the redshift is fixed at 0.0579, and the metal abundance is fixed at 0.22 solar, as obtained from the spectral analysis of the entire region.
Figure 2 shows the temperature and intensity profiles, and table 2 summarizes the data. The intensity profile shows two clear peaks, at and corresponding to the positions of the main and sub gas clumps. In the bridge region between the two gas clumps, the intracluster medium (ICM) shows a relatively flat temperature profile, with keV. The temperature decreases to keV outside the bridge, and a steep gradient is seen, particularly around the sub gas clump. There are no prominent temperature peaks at the positions of the X-ray-intensity peaks, indicating a significant difference between the temperature and gas-density profiles.
| Distance∗ | Norm† | ||
|---|---|---|---|
| (arcmin) | (keV) | ||
| -6.0 | 300/323 | ||
| -4.5 | 363/358 | ||
| -3.0 | 437/440 | ||
| -1.5 | 574/541 | ||
| 0 | 564/606 | ||
| +1.5 | 673/710 | ||
| +3.0 | 732/677 | ||
| +4.5 | 529/550 | ||
| +6.0 | 581/542 | ||
| +7.5 | 437/462 | ||
| +9.0 | 524/491 | ||
| +10.5 | 489/447 |
The distance from the peak position in the main gas clump
(minus: east, plus: west).
††\dagger††\daggerfootnotemark: See the footnote, , in table 1.
4.3 Annular regions
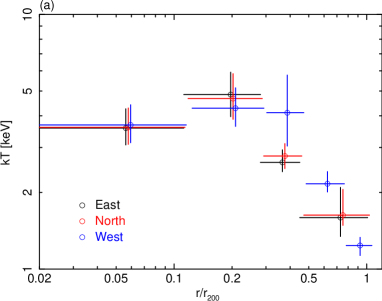
To derive the three-dimensional structure of the temperature, density and entropy of the hot gas, we de-projected the data, assuming a spherically symmetric gas distribution (figure 1a). We derived the distributions separately for each of the three directions (east, north, and west) to study the spatial variations. In each direction, we fitted the five annular spectra in the 0.7–8 keV band simultaneously and the de-projection operation by using the “projct” model in XSPEC. We assumed the APEC model for cluster emission attenuated by Galactic absorption for each annular bin. We assumed the metal abundance to be constant, independent of radius, and fixed at 0.22 solar, as is also the case in section 4.2. Because the temperature was not well constrained in the outer-most annular regions () in the east and north directions, we linked the temperature of that region to the next-innermost annular region (). The fit was reasonable, giving /degrees of freedom (d.o.f.), , and for the east/north/west directions.
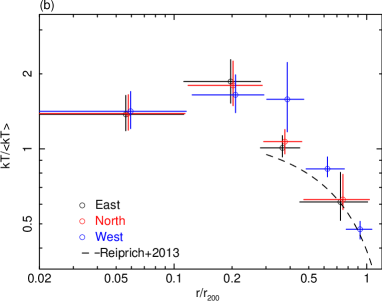
Table 3 lists the derived temperature values, and figure 3 (a) plots their profiles. The temperature is about 3.6 keV at the center and drops by a factor of 2 in the outskirts. In the ring , the temperature in the west, keV, is statistically consistent with the XMM result (figure 2), and it is marginally higher than in the other two directions.
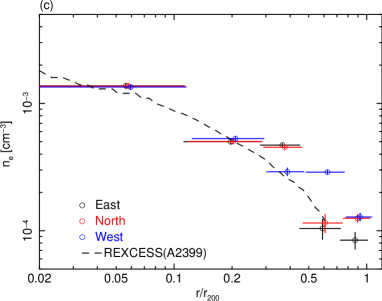
We calculated the electron density from the normalization of the APEC model. The central density is , which is extremely low in comparison with other nearby clusters. Here the density is averaged within because we used the radial bin-size of considering the spatial resolution of Suzaku and assumed that the gas is uniform in each spherical shell. At a very small radius, however, the gas density can be higher; in fact, the previous XMM-Newton measurement yielded at kpc or (Croston et al. 2008). For A2399 West, a density excess is seen in the ring , which can be attributed to the western sub gas clump (figure 1 (b)). Because of the presence of this high-density clump, the de-projection analysis leads to a relatively lower density bin in the ring in comparison with the other directions, even though the surface brightness is apparently the same.
We evaluated the entropy from the temperature and gas density within . The entropy is very high; the azimuthally-averaged value is in the central region, and flat outside . The entropy for in the west is marginally lower than in the other directions, which again coincides with the location of the subclump. In comparison with the previous XMM-Newton study of the REXCESS sample, the Suzaku result for agrees with their result within the measurement uncertainties. For , there are significant azimuthal variations due to the clumpy structure and the difference in the entropy values can be attributed to the difference in their analysis methods because in the XMM-Newton deprojection analysis by Pratt et al. (2010), the western gas clump is excluded and the maximum radius is about a half of that used in the Suzaku analysis.
| A2399 East | A2399 North | A2399 West | |||||||
| Region | |||||||||
| (keV) | () | () | (keV) | () | () | (keV) | () | () | |
5 Discussion
In this section, we discuss the thermodynamic properties of A2399 based on the XMM-Newton and Suzaku results. Then, we compare the X-ray and optical observations and discuss the dynamical state of the system.
5.1 Thermodynamic properties of the cluster gas
Previous X-ray observations have shown that the temperature profiles of relaxed clusters exhibit similarities at large radii, once they are scaled by the mean temperature and the virial radius (e.g., Vikhlinin et al. 2005; Pratt et al. 2007; Reiprich et al. 2013; Walker et al. 2013; Ichikawa et al. 2013; Ghirardini et al. 2018). Figure 3 (b) compares the normalized temperature profile of A2399 and the average of relaxed clusters observed with Suzaku (Reiprich et al. 2013). For , A2399 shows a decline similar to that of a relaxed cluster, while we found no significant cool-core structure for .
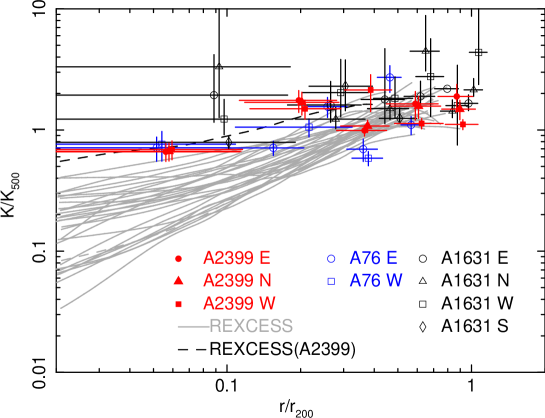
Figure 4 compares the A2399 scaled-entropy profile, as derived from our Suzaku analysis in section 4.3, with those of the REXCESS sample derived from the XMM-Newton observations (Pratt et al. 2010). Here the Suzaku data of A2399 are scaled by the value of estimated from (1.3 10) obtained by using the – scaling relation in Table 1 and equation (3) (Pratt et al. 2010). In the central region, A2399 has the highest scaled entropy, , in comparison with other REXCESS clusters as suggested by the previous study, and the present Suzaku result agrees well with that from XMM-Newton. We confirmed the difference in is only 20 % corresponding to 10 % in even though we adopt the –T scaling relation (Arnaud et al. 2005) to obtain . At larger radii () up to around the virial radius, even in the east and north directions, the normalized entropy values seem to be systematically lower than those of relaxed clusters (Walker et al. 2012) indicating that a large-scale event gives rise to the discrepancy in the whole cluster system. The scaled-entropy profiles of other two LSB clusters, A76 and A1631, obtained from previous Suzaku studies (Ota et al. 2013; Babazaki et al. 2018) are also shown in figure 4. Note that these two clusters are not a part of the REXCESS sample. The central scaled-entropy values of A2399 and A76 agree well with each other, while they tend to be lower than those of A1631. This mainly reflects a difference in electron density; A1631 has the lowest density of a few among known nearby clusters. The uncertainty in the scaling factor may also affect the difference.
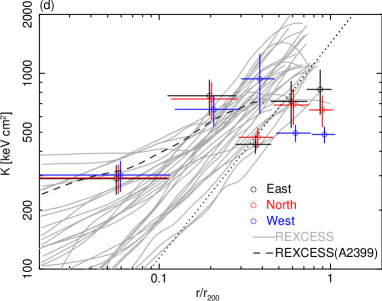
From numerical simulations that include gravitational heating effect, Voit et al. (2005) derived a ‘baseline’ entropy model for the cluster gas; . Figure 3 (d) compares the observed A2399 profile with the baseline model calculated for the averaged temperature of . The azimuthally-averaged central entropy, , is significantly higher than that expected from gravitational heating alone ( at ).
Non-gravitational heating processes can also contribute to the entropy excess, and numerical simulations suggest that AGN feedback plays a major role (e.g., Dubois et al. 2011). Although no signs of cavities or jets have been reported in A2399, we can assess the impact of AGN feedback as discussed in previous studies (Ota et al. 2013; Babazaki et al. 2018). Using the -band luminosity of the brightest galaxy 2MASX J21572939-0747443, log(/) = 11.5 (Skrutskie et al. 2006) and the empirical relationship given by Wang et al. (2010), we estimate the excess entropy in A2399 to be on the order of . Therefore, we conclude that the observed high entropy also cannot be explained by AGN feedback. Another likely origin of the excess entropy is disturbance by a cluster merger, which we will discuss in the following subsections.
5.2 Comparison between X-ray and optical properties
The galaxy distribution provides a clue as to the dynamical state of a cluster. For instance, if a cluster merger occurs, substructures can be identified in both spatial and velocity distributions of member galaxies (Geller & Beers 1982). Such substructures are detected in the adaptively smoothed galaxy maps of many merging systems (e.g., Owers et al. 2017).
The Omega WINGS survey (Moretti et al. 2017) has identified 234 spectroscopic galaxies as member galaxies of A2399. The smoothed galaxy map (see contours in figure 1) shows several substructures, with the peak number density in the western and eastern galaxy clumps being and , respectively. Thus, the spatial offset between the gas and galaxy clumps is 100 kpc. We have measured the central redshift and velocity dispersion of the galaxies that constitute the main and sub galaxy clumps. There is no significant difference in central redshift between the galaxy clumps, while the observed velocity dispersion is and in the main and sub galaxy clumps, respectively. The total mass is estimated to be and , respectively (Finn et al. 2005).
5.3 X-ray surface brightness discontinuity on the rim of the sub gas clump
To constrain the dynamical state of the system, we searched for discontinuities in the surface brightness distribution. As seen from figures 1 (c) and 5, there is a clear surface-brightness discontinuity near the rim of the western sub gas clump. Therefore we modeled the surface brightness by integrating the following double power-law model for the electron-density profile along the line of sight (e.g., Owers et al. 2009):
| (1) |
Here we assume spherically symmetry for simplicity, and , , and represent the central density, the radius at the point of discontinuity, and the density-jump parameter, respectively. The quantities and are the power-law indices for the high-density and low-density regions, respectively.
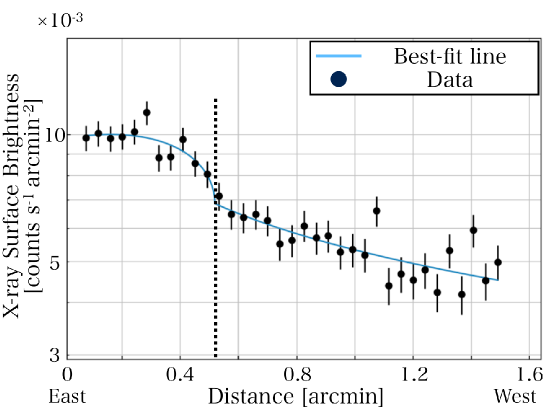
A case with no density jump, that is, the model with the jump parameter fixed at 1, does not reproduce the observed profile well. However, when the jump parameter is set free, the fit improves significantly (the null hypothesis probability is 1.2%, according to the F-test). The best-fit parameter is .
The XMM spectral analysis demonstrated that the temperatures of the upstream and downstream regions across the plane of the discontinuity are 1.83 keV and 3.71 keV, respectively. We find that pressure equilibrium holds at the boundary of the density jump to within the error bars. Thus the density discontinuity originates from a cold front rather than a shock.
5.4 A possible scenario
As is the case for A1631 (Babazaki et al. 2018), the observational characteristics in both X-ray and optical– i.e., no prominent cool-core structure, a flatter density profile, excess entropy at the center, and a spatial offset between the peaks in the X-ray surface brightness and galaxy number density distributions– suggest that the A2399 system is also in some stage of merging.
By utilizing hydrodynamic simulations, ZuHone (2011) has studied the effect of ICM mixing as a function of a mass ratio and impact parameter of a cluster collision. The simulations reproduce a high-entropy core–where the initial core is replaced by a low-density, high-temperature and high-entropy core–and in which the temperature and gas-density profiles become flatter, relative to those of the initial profiles. Therefore, we consider that the excess entropy in A2399 can be attributed to ICM mixing during a cluster merger.
Underluminosity in X-rays at the given velocity dispersion (Moretti et al. 2017) extracted by using the whole member galaxies is also seen, with the observed luminosity being approximately 1/3 that expected from the relation (Zhang et al. 2011) predicted from the hydrodynamic simulations (e.g., ZuHone 2011). Tovmassian (2015) argues that some merging clusters show a higher (1.2) or smaller (0.8) ratio of nl/nh, where nl and nh correspond to the numbers of galaxies with velocities lower and higher than the mean velocity of all member galaxies, and the observed ratio for A2399 is 0.70.1. In the case of A2399, the significant substructures seen in both X-ray and optical data and the discrepancy in the X-ray peak positions between the temperature and surface brightness also support the merger scenario (e.g., Markevitch et al. 2004; Harvey et al. 2015).
Furthermore, the main gas clump seen in X-rays is located between the main and sub galaxy clumps observed in the optical, and the cold front is found around the rim of the gas clump. The X-ray morphology is elongated along an axis connecting the galaxy clumps, and there is little difference in redshift between the two galaxy clumps (see section 5.2), indicating that the cluster-cluster collision occurred nearly in the plane of the sky. Thus, we conclude that A2399 may be a system in a head-on collision, like the Bullet cluster (e.g., Markevitch & Vikhlinin 2007). Deep X-ray observations and weak lensing will enable the determination of further details, such as shock structures and dark matter distributions. Because this LSB cluster resides in a supercluster, the merger events may have resulted from its dense environment.
6 Summary
To study the nature of low surface brightness clusters, we have analyzed the XMM-Newton and Suzaku data of an LSB cluster, A2399 at . The X-ray image is elongated and has a bimodal structure, while the temperature peak is significantly offset from the X-ray emission peaks. We have derived the profiles of gas temperature, density, and entropy out to the viral radius. The observed high entropy in the central region, , is comparable to other LSB clusters like A76 and A1631, and the scaled entropy of A2399 is the highest among the entire REXCESS sample. The galaxy map also exhibits main and sub clumps; however there is a considerable offset between the peak positions in the main galaxy clump and the main gas clump. Furthermore, we have detected the brightness and temperature discontinuities near the sub galaxy clump in the west, providing evidence for the presence of a cold front. Therefore, our results support the scenario that this cluster has experienced a merger in the plane of the sky, and the excess central entropy and complex X-ray and optical morphologies are caused by the merger. Since the X-ray properties of LSB clusters tend to deviate from the scaling relations of known nearby clusters, we expect the present study to have a significant impact on the detection techniques and interpretations of faint, diffuse clusters in future cluster surveys.
Acknowledgement
We thank all the Suzaku team members for their support. IM is grateful to Y. Tawara for the useful advice in the analysis and thanks Y. Fujita for his insightful comments. This work was supported in part by JSPS KAKENHI grant number 26220703 (IM) and 16K05295 (NO). HB and GC acknowledge support from the DFG Transregio Program TR33 and the Munich Excellence Cluster “Structure and Evolution of the Universe”. GWP acknowledges funding from the European Research Council under the European Union’s Seventh Framework Programme (FP7/2007−2013)/ERC grant agreement No. 340519.
References
- Anders & Grevesse (1989) Anders, E., & Grevesse, N. 1989, Geochim. Cosmochim. Acta, 53, 197
- Arnaud et al. (2005) Arnaud, M., Pointecouteau, E., & Pratt, G. W. 2005, A&A, 441, 893
- Babazaki et al. (2018) Babazaki, Y., Mitsuishi, I., Ota, N., Sasaki, S., Böhringer, H., Chon, G., Pratt, G. W., & Matsumoto, H. 2018, PASJ, 70, 46
- Böhringer et al. (2013) Böhringer, H., Chon, G., Collins, C. A., Guzzo, L., Nowak, N., & Bobrovskyi, S. 2013, A&A, 555, A30
- Böhringer et al. (2017) Böhringer, H., Chon, G., Retzlaff, J., Trümper, J., Meisenheimer, K., & Schartel, N. 2017, AJ, 153, 220
- Böhringer et al. (2007) Böhringer, H., et al. 2007, A&A, 469, 363
- Böhringer et al. (2010) —. 2010, A&A, 514, A32
- Cava et al. (2009) Cava, A., et al. 2009, A&A, 495, 707
- Croston et al. (2008) Croston, J. H., et al. 2008, A&A, 487, 431
- Dubois et al. (2011) Dubois, Y., Devriendt, J., Teyssier, R., & Slyz, A. 2011, MNRAS, 417, 1853
- Finn et al. (2005) Finn, R. A., et al. 2005, ApJ, 630, 206
- Geller & Beers (1982) Geller, M. J., & Beers, T. C. 1982, PASP, 94, 421
- Ghirardini et al. (2018) Ghirardini, V., et al. 2018, ArXiv e-prints, arXiv:1805.00042
- Harvey et al. (2015) Harvey, D., Massey, R., Kitching, T., Taylor, A., & Tittley, E. 2015, Science, 347, 1462
- Ichikawa et al. (2013) Ichikawa, K., et al. 2013, ApJ, 766, 90
- Kalberla et al. (2005) Kalberla, P. M. W., Burton, W. B., Hartmann, D., Arnal, E. M., Bajaja, E., Morras, R., & Pöppel, W. G. L. 2005, A&A, 440, 775
- Koyama et al. (2007) Koyama, K., et al. 2007, PASJ, 59, 23
- Kushino et al. (2002) Kushino, A., Ishisaki, Y., Morita, U., Yamasaki, N. Y., Ishida, M., Ohashi, T., & Ueda, Y. 2002, PASJ, 54, 327
- Markevitch et al. (2004) Markevitch, M., Gonzalez, A. H., Clowe, D., Vikhlinin, A., Forman, W., Jones, C., Murray, S., & Tucker, W. 2004, ApJ, 606, 819
- Markevitch & Vikhlinin (2007) Markevitch, M., & Vikhlinin, A. 2007, Phys. Rep., 443, 1
- Merloni et al. (2012) Merloni, A., et al. 2012, ArXiv e-prints, arXiv:1209.3114
- Mitsuda et al. (2007) Mitsuda, K., et al. 2007, PASJ, 59, S1
- Mitsuishi et al. (2012) Mitsuishi, I., et al. 2012, PASJ, 64, 18
- Moretti et al. (2017) Moretti, A., et al. 2017, A&A, 599, A81
- Nakazawa et al. (2016) Nakazawa, K., Kato, Y., Gu, L., Kawaharada, M., Takizawa, M., Fujita, Y., & Makishima, K. 2016, PASJ, 68, S21
- Neumann & Arnaud (1999) Neumann, D. M., & Arnaud, M. 1999, A&A, 348, 711
- Ota et al. (2013) Ota, N., Fujino, Y., Ibaraki, Y., Böhringer, H., & Chon, G. 2013, A&A, 556, A21
- Owers et al. (2009) Owers, M. S., Nulsen, P. E. J., Couch, W. J., & Markevitch, M. 2009, ApJ, 704, 1349
- Owers et al. (2017) Owers, M. S., et al. 2017, MNRAS, 468, 1824
- Pratt et al. (2007) Pratt, G. W., Böhringer, H., Croston, J. H., Arnaud, M., Borgani, S., Finoguenov, A., & Temple, R. F. 2007, A&A, 461, 71
- Pratt et al. (2010) Pratt, G. W., et al. 2010, A&A, 511, A85
- Reiprich et al. (2013) Reiprich, T. H., Basu, K., Ettori, S., Israel, H., Lovisari, L., Molendi, S., Pointecouteau, E., & Roncarelli, M. 2013, Space Sci. Rev., 177, 195
- Serlemitsos et al. (2007) Serlemitsos, P. J., et al. 2007, PASJ, 59, S9
- Skrutskie et al. (2006) Skrutskie, M. F., et al. 2006, AJ, 131, 1163
- Smith et al. (2004) Smith, R. J., et al. 2004, AJ, 128, 1558
- Snowden et al. (2008) Snowden, S. L., Mushotzky, R. F., Kuntz, K. D., & Davis, D. S. 2008, A&A, 478, 615
- Tovmassian (2015) Tovmassian, H. M. 2015, Astrophysics, 58, 328
- Uchiyama et al. (2009) Uchiyama, H., et al. 2009, PASJ, 61, S9
- Varela et al. (2009) Varela, J., et al. 2009, A&A, 497, 667
- Vikhlinin et al. (2005) Vikhlinin, A., Markevitch, M., Murray, S. S., Jones, C., Forman, W., & Van Speybroeck, L. 2005, ApJ, 628, 655
- Voit et al. (2005) Voit, G. M., Kay, S. T., & Bryan, G. L. 2005, MNRAS, 364, 909
- Walker et al. (2012) Walker, S. A., Fabian, A. C., Sanders, J. S., & George, M. R. 2012, MNRAS, 427, L45
- Walker et al. (2013) Walker, S. A., Fabian, A. C., Sanders, J. S., Simionescu, A., & Tawara, Y. 2013, MNRAS, 432, 554
- Wang et al. (2010) Wang, Y., Xu, H.-G., Gu, J.-H., Gu, L.-Y., Wang, J.-Y., & Zhang, Z.-L. 2010, Research in Astronomy and Astrophysics, 10, 1013
- Yoshino et al. (2009) Yoshino, T., et al. 2009, PASJ, 61, 805
- Zhang et al. (2011) Zhang, Y.-Y., Andernach, H., Caretta, C. A., Reiprich, T. H., Böhringer, H., Puchwein, E., Sijacki, D., & Girardi, M. 2011, A&A, 526, A105
- ZuHone (2011) ZuHone, J. A. 2011, ApJ, 728, 54