Novel constraints on fermionic dark matter from galactic observables II:
galaxy scaling relations
Abstract
We have recently introduced in paper I an extension of the Ruffini-Argüelles-Rueda (RAR) model for the distribution of DM in galaxies, by including for escape of particle effects. Being built upon self-gravitating fermions at finite temperatures, the RAR solutions develop a characteristic dense quantum core-diluted halo morphology which, for fermion masses in the range keV, was shown to provide good fits to the Milky Way rotation curve. We study here for the first time the applicability of the extended RAR model to other structures from dwarfs to ellipticals to galaxy clusters, pointing out the relevant case of keV. By making a full coverage of the remaining free parameters of the theory, and for each galactic structure, we present a complete family of astrophysical RAR profiles which satisfy realistic halo boundary conditions inferred from observations. Each family-set of RAR solutions predicts given windows of total halo masses and central quantum-core masses, the latter opening the interesting possibility to interpret them as alternatives either to intermediate-mass BHs (for dwarf galaxies), or to supermassive BHs (SMBHs, in the case of larger galaxy types). The model is shown to be in good agreement with different observationally inferred scaling relations such as: (1) the Ferrarese relation connecting DM halos with supermassive dark central objects; and (2) the nearly constant DM surface density of galaxies. Finally, the theory provides a natural mechanism for the formation of SMBHs of few via the gravitational collapse of unstable DM quantum-cores.
keywords:
Methods: numerical – Cosmology: dark matter – Galaxies: halos, nuclei, structurerho-crit short = , long = the critical density of the Universe, class = symbol \DeclareAcronymlambda-B short = , long = de Broglie wavelength, class = symbol \DeclareAcronymr-half short = , long = half light radius, class = symbol \DeclareAcronymr-last short = , long = last observed data point, class = symbol \DeclareAcronymr-300 short = , long = radius at , class = symbol \DeclareAcronymvelDispB short = , long = bulge velocity dispersion, class = symbol \DeclareAcronymvelDisp-proj short = , long = projected velocity dispersion, class = symbol \DeclareAcronymM-dm short = , long = dark matter mass, class = symbol \DeclareAcronymv-max short = , long = maximal velocity, class = symbol \DeclareAcronymv-min short = , long = minimal velocity, class = symbol \DeclareAcronymv-obs short = , long = observed total velocity, class = symbol \DeclareAcronymv-bar short = , long = velocity of the baryonic component, class = symbol \DeclareAcronymv-gas short = , long = velocity of the gas component, class = symbol \DeclareAcronymv-star short = , long = stellar velocity, class = symbol \DeclareAcronymv-dm short = v_DM, long = velocity of the dark matter component, class = symbol \DeclareAcronymr-max short = , long = radius at the maximum circular velocity, class = symbol \DeclareAcronymr-max-d short = , long = radius at the maximum circular velocity (dwarfs), class = symbol \DeclareAcronymrh-d short = , long = one-halo length scale of the RAR model (dwarfs), class = symbol \DeclareAcronymMh-d short = , long = halo mass (dwarfs), class = symbol \DeclareAcronymr-max-s short = , long = radius at the maximum circular velocity (spirals), class = symbol \DeclareAcronymrh-s short = , long = one-halo length scale of the RAR model (spirals), class = symbol \DeclareAcronymMh-s short = , long = halo mass (spirals), class = symbol \DeclareAcronymr-max-e short = , long = radius at the maximum circular velocity (ellipticals), class = symbol \DeclareAcronymrh-e short = , long = one-halo length scale of the RAR model (ellipticals), class = symbol \DeclareAcronymMh-e short = , long = halo mass (ellipticals), class = symbol \DeclareAcronymr-max-bcg short = , long = radius at the maximum circular velocity (BCGs), class = symbol \DeclareAcronymrh-bcg short = , long = one-halo length scale of the RAR model (BCGs), class = symbol \DeclareAcronymMh-bcg short = , long = halo mass (BCGs), class = symbol \DeclareAcronymMbh short = , long = black hole mass, class = symbol \DeclareAcronymMB short = , long = absolute magnitude, class = symbol \DeclareAcronymSigma0D short = , long = dark matter surface density, class = symbol \DeclareAcronymrho0D short = , long = central dark matter halo density, class = symbol \DeclareAcronymr0 short = , long = one-halo-scale-length of the Burkert profile, class = symbol \DeclareAcronymbeta0-crit short = , long = critical central temperature parameter, class = symbol \DeclareAcronymbeta0-max short = , long = maximal central temperature parameter, class = symbol \DeclareAcronymbeta0-min short = , long = minimal central temperature parameter, class = symbol \DeclareAcronymrc short = , long = core radius, class = symbol \DeclareAcronymrh short = , long = halo radius, class = symbol \DeclareAcronymrb short = , long = boundary radius, class = symbol \DeclareAcronymrb-max short = , long = boundary radius, class = symbol \DeclareAcronymMc short = , long = core mass, class = symbol \DeclareAcronymMc-crit short = , long = critical core mass, class = symbol \DeclareAcronymMc-max short = , long = maximum core mass, class = symbol \DeclareAcronymMc-min short = , long = minimum core mass, class = symbol \DeclareAcronymMh short = , long = halo mass, class = symbol \DeclareAcronymMtot short = , long = total dark matter mass, class = symbol \DeclareAcronymMtot-max short = , long = maximum total dark matter mass, class = symbol \DeclareAcronymMtot-min short = , long = minimum total dark matter mass, class = symbol \DeclareAcronymrhoc short = , long = core density, class = symbol \DeclareAcronymrhop short = , long = plateau density, class = symbol \DeclareAcronymDM short = DM, long = Dark Matter, class = abbrev \DeclareAcronymCDM short = CDM, long = Cold Dark Matter, class = abbrev-scheme \DeclareAcronymWDM short = WDM, long = Warm Dark Matter, class = abbrev-scheme \DeclareAcronymLCDM short = CDM, long = Cold Dark Matter, class = abbrev-scheme \DeclareAcronymLWDM short = WDM, long = Warm Dark Matter, class = abbrev-scheme \DeclareAcronymRAR short = RAR, long = Ruffini-Argüelles-Rueda, class = abbrev-model \DeclareAcronymNFW short = NFW, long = Navarro-Frenk-White, class = abbrev-model \DeclareAcronymFDM short = FDM, long = fuzzy DM, class = abbrev-model \DeclareAcronymBH short = BH , long = Black Hole , class = abbrev-co \DeclareAcronymSMBH short = SMBH , long = supermassive Black Hole , class = abbrev-co \DeclareAcronymIMBH short = IMBH, long = intermediate-mass Black Hole, class = abbrev-co \DeclareAcronymSgrA short = SgrA*, long = Sagittarius A*, class = abbrev-phen \DeclareAcronymGC short = GC, long = Globular Cluster, class = abbrev-system
1 Introduction
The problem of describing \acDM halos in terms of fundamental particles has gained considerable attention in the last years, given they may provide solutions to many of the unsuccessful predictions of the \acCDM paradigm arising below scales. The majority of such models are comprised within the following three different approaches: (i) The case of ultra light bosons with masses in the range , known as ultra light \acDM, \acFDM or scalar field \acDM (Baldeschi et al., 1983; Sin, 1994; Hu et al., 2000; Matos and Arturo Ureña-López, 2001; Robles and Matos, 2012; Hui et al., 2017; Bar et al., 2018); (ii) the case of Thomas-Fermi models based on fully-degenerate fermions with masses few (Destri et al., 2013; Domcke and Urbano, 2015; Randall et al., 2017). We also include in this group similar models based on self-gravitating fermions but in the dilute regime (i.e. Boltzmannian-like) which, however, do not imply an explicit particle mass dependence when contrasted with halo observables (see e.g. de Vega et al., 2014); (iii) the \acRAR model based on semi-degenerate configurations of self-gravitating fermions accounting for finite temperature and for relativistic effects, with masses in the range few (Argüelles et al., 2013; Argüelles and Ruffini, 2014; Ruffini et al., 2015; Siutsou et al., 2015; Argüelles et al., 2016; Gómez et al., 2016; Argüelles et al., 2018).
One of the main interesting aspects of the above models is the particle mass dependence on their density profiles (besides the other physically-motivated free parameters), differently to the case of phenomenological profiles existing in the literature aiming to fit results from classical N-body numerical simulations. Moreover, such kind of self-gravitating systems of particles opens the possibility to have direct access to the nature, mass, and explicit phase-space distributions dependence at the onset of halo formation (see e.g., Hui et al., 2017 and refs. therein, for the case of bosons and, e.g. Argüelles et al., 2018 and refs. therein, for the case of fermions).
However, not all of the above particle-motivated \acDM halo models have the required cosmological and astrophysical properties when contrasted with different observational data-sets. Some fundamental problems remain mainly within the cases (i) and (ii) such as: (a) galaxy-scaling relations; (b) Ly forest constraints; (c) nearby disk galaxies with high resolution rotation curve features.
Concerning the first point (a), we could mention the recent results in Deng et al. (2018) which demonstrated that standard \acFDM models without self-interactions111 Composed, for example, by axion-like particles with as the one proposed in Hu et al. (2000); Hui et al. (2017). are ruled out when asking to follow the \acDM-surface-density Universal relation (Donato et al., 2009; Rodrigues et al., 2017). That is, while this observational relation imposes that the central \acDM halo density scales with the inverse of the core radius to some power (i.e. ); the \acFDM theory yields an inverse proportionality relation but with a quite different power .222 Alternative \acFDM models including for quartic-like self-interactions were also ruled out when contrasted against the above observed \acDM halo Universal-relation in Deng et al. (2018); see however Robles and Matos (2012) for other kind of self-interacting bosons.
On a different observational ground, and moving to the issue (b), the \acDM particle mass constraints arising from recent Ly forest observations, put severe bounds both to \acFDM particles (i), as well as to fermions (ii)-(iii). The key concept to understand how all such bounds arise is to recognize that the Ly forest can be explained in terms of the standard cosmological model (see e.g. Cen et al., 1994), and therefore it can be directly linked to the matter power spectrum by offering a complementary probe for it (Hui, 1999). In the case of \acWDM (exhibiting a linear matter power spectrum with a clear drop below a given threshold scale respect to the CDM paradigm), a lower bound of few was found in Viel et al. (2013, see also , for more general lower bounds above including for sterile neutrino \acWDM) from Ly constraints. Such bounds are in strong tension with the below- Thomas-Fermi models cited above in (ii) as also discussed in Randall et al. (2017), while it remains in agreement with the \acRAR model introduced in (iii). Further discussion on \acFDM models regarding issues (b) and (c) will be given below in section 6.
We will show that the results of this work, together with the ones of the first article of this series (Argüelles et al., 2018, hereafter Paper I) on the fit to the Milky Way full rotation curve, and the discussion of the constraints put to \acsLCDM and \acsLWDM cosmologies by the Ly forest, favour instead the fermionic \acRAR model (iii).
In next section we introduce the main features of the RAR model (as originally given in Paper I). In section 3 we provide realistic halo boundary conditions as inferred from observational data coming from dwarf to ellitpical galaxies. In section 4 we present the application of the extended \acRAR theory to different galaxy types as well as galaxy clusters, and for fermion masses in the range limited by the Milky Way constraints. A more detailed description of the obtained families focusing on the configuration parameters is given in A. We also briefly compare in B the applied method with an alternative set of constraints for dwarfs to verify its robustness.
In addition, we demonstrate in section 5 that the results of our model are consistent with (a) the observationally inferred correlations between the mass of the dark central object and total \acDM halo mass (Ferrarese, 2002; Kormendy and Bender, 2011; Bogdán and Goulding, 2015), and with (b) the observationally inferred (universal) value (within the error bars) of the inner surface density of \acDM halos (Donato et al., 2009), from dwarf to elliptical galaxies. Further predicting for possible deviations of a constant surface density (i.e. slight rising trend or positive tilt in a linear fit) towards the brightest objects, in striking similitude with the phenomenological results reported in Boyarsky et al. (2009).
Finally, in section 6 we summarize the conclusions of our results.
2 The RAR model
In Paper I (Argüelles et al., 2018) we have introduced an extension of the original RAR model (Ruffini et al., 2015), by considering an spherical system of self-gravitating fermions presenting a cutoff in the Fermi-Dirac phase-space distribution. Such a (coarse-grained) phase-space distribution can be obtained as a (quasi) stationary solution of a generalized Fokker-Planck equation for fermions (including the physics of violent relaxation and escape of particles), proper to deal with non-linear DM halo formation (Chavanis, 2004); which is written below:
| (1) |
where is the particle kinetic energy, is the chemical potential with the particle rest-energy subtracted off, is the temperature, is the Boltzmann constant, is the Planck constant, is the speed of light, and is the fermion mass. We do not include the presence of anti-fermions, i.e. we consider temperatures . The full set of (functional) dimensionless-parameters of the model are defined by the temperature, degeneracy and cutoff parameters, , and , respectively.
The corresponding 4-parametric fermionic equation of state (at given radius ): , is directly obtained as the corresponding integrals (bounded from above by ) over momentum space of , given in equations () and () in Paper I. Such components of the equation of state corresponds to the diagonal part of the stress-energy tensor in the Einstein equations, which are solved under the perfect fluid approximation within a background metric with spherical symmetry (with (,,) the spherical coordinates, and and only depending on the radial coordinate ). The system of Einstein equations is solved together with the Tolman and Klein thermodynamic equilibrium conditions, and (particle) energy conservation along a geodesic as given in equations and of Paper I respectively. Finally, the dimensionless system of non-linear ordinary integro-differential equations reads:
| (2) | ||||
| (3) | ||||
| (4) | ||||
| (5) | ||||
| (6) |
Such that in the limit (i.e. no particle escape: ) these system reduce to the equations considered in the original RAR model (Ruffini et al., 2015). We have introduced the same dimensionless quantities as in the original RAR model formulation: , , , , where and the Planck mass. We note that the constants of the Tolman and Klein conditions are evaluated at the center , indicated with a subscript ‘0’.
The task of Paper I (for the Milky Way), was thus to solve the system (2–6), for given regular initial conditions at the center, , for different DM particle mass , to find solutions consistent with well-constrained DM halo observables of the Galaxy (see also beginning of next section). One of the main features of the RAR solutions is the fact that they are solved at finite temperature for positive central degeneracies (instead of the known diluted Boltzmannian-like regime ), giving rise to a degenerate core at the center of the halo which always fulfill the quantum condition: (where is the interparticle mean distance within the core (with the core particle density) and the thermal de-Broglie wavelength at the core). The dense and degenerate core is followed by a transition from positive to negative values of where quantum corrections are still important, finally reaching the region of highly negative values corresponding to a Boltzmannian diluted regime (see fig. () in Paper I). Such a core-halo transition with the different physical behaviours in is easily understood by the fact that the fermions are immerse in an external gravitational field, leading to a radial gradient (monotonically decreasing) of the degeneracy.
This core-halo behaviour in the intrinsic RAR model parameters is reflected in the DM density and rotation curve profiles as follows (whose solution for the Milky Way DM halo is displayed in figs. () and () in Paper I, for different RAR model paramters):
-
1.
an inner core with radius of almost constant density governed by quantum degeneracy (see the region of high positive values of the degeneracy parameter in upper panel of fig. 2 of Paper I);
-
2.
an intermediate region with a sharply decreasing density distribution followed by an extended plateau, where quantum corrections are still important (see the region of transition from positive to negative values of degeneracy in upper panel of fig. 2 of Paper I); and
-
3.
a Boltzmannian density tail (see highly negative values of the degeneracy parameter in upper panel of fig. 2 in Paper I) showing a behavior with due to the cutoff constraint (when approaches 0), as can be seen from lower panel of fig. 2 in Paper I.
3 Observational constraints
In the case of our Galaxy, thanks to the vast amount of rotation curve data, i.e. as obtained in Sofue, 2013, from inner bulge to outer halo, we were able to identify three relevant observables as the boundary conditions to be imposed to the RAR system of differential equations (2–6): a dark core mass (alternative to the central BH) and two well constrained dark halo masses: ; (see Paper I: Argüelles et al., 2018). With such three observationally well constrained mass values for the Milky Way it was possible to obtain in Paper I the three (free) RAR model parameters (,,) for different particle masses in the range.
It is now natural to ask whether or not the \acRAR model can explain the observational properties of other types of galaxies or even galaxy clusters, in the same range of \acDM particle mass obtained from the Milky way analysis. We therefore proceed to show how, for a fixed particle mass , our model leads to an extensive three-parametric () family of dark halos with parameters ranging from the ones of dwarf, to the ones in elliptical galaxies extending until galaxy clusters, harboring at the same time a semi-degenerate quantum core at each center.
When dealing with different galactic structures, located far away from us, the observational inferences of the \acDM content are limited to a narrow window of galaxy radii, usually lying just above the baryonic dominance region (i.e. typically up to several half-light radii). Generally, there is no observational access neither for the possible detection of a dark compact object at the centre nor for constraining the boundary of the \acDM halo at the virial radius scale. This is contrary to the case of the Milky Way, thus requiring a different phenomenology which is described in next.
We adopt here a similar methodology compared to the Milky Way analysis (Argüelles et al., 2018), but limited to radial halo extents where observational data is available, allowing to constraint the \acDM halo mass either in a model independent (or dependent) manner. In particular we will select as the only boundary conditions taken from observables a characteristic halo radius \acsrh with the corresponding halo mass . The halo radius is defined as the location of the maximum of the halo rotation curve which we adopt as the one-halo scale length of our model. Thus, we define in next the parameters adopted for the different \acDM halos as constrained from observations in typical dwarf spheroidal (dSph), spiral, elliptical to galaxy cluster structures.
3.1 Typical dSph galaxies
We consider the eight best resolved dwarf satellites of the Milky Way as analyzed in Walker et al. (2009) by solving the Jeans equations, using large (stellar) kinematic data sets and including for orbital anisotropy.
There, it was reported a \acDM model-independent evidence of a maximum circular velocity (\acsv-max) in the \acDM halo of the Fornax dwarf (see fig. 2 in Walker et al., 2009). Such an evidence was found by comparing the theoretical projected dispersion velocity (from Jeans equation) with the observed one (through a Markov-Chain Monte-Carlo method), using a 4-parametric generalized Hernquist mass model for the halo, the latter allowing either for cored or cuspy density profiles depending on the free parameters. The best fit to \acsv-max was found independently of the couple of free parameters which control the \acDM shapes, i.e. in a \acDM independent way.
In the other seven cases, a \acDM model-dependent evidence for a circular velocity peak was found assuming either cuspy (e.g. \acsNFW) or cored (e.g. cored-Hernquist) \acDM halos density profiles.
In all eight cases the inferred radii and masses at the maximum circular velocity (supported by data) are few and few . These values have been obtained by assuming a cored-Hernquist \acDM profile,333 Somewhat larger values and are obtained for cuspy profiles. Though, the latter are disfavored respect to cored ones for dSph, as recently reviewed in Bullock and Boylan-Kolchin (2017). similar to the \acRAR profiles here presented (see e.g. Ruffini et al., 2015; Argüelles et al., 2016 for the \acRAR halo fits to isothermal and Burkert profiles respectively).
The radius of maximal circular velocity we identify as the one-halo length scale of the RAR model with the corresponding \acDM halo mass . Thus, as allowed by data, we adopt throughout this work the following fiducial values for the characteristic \acDM halo properties for typical dSphs:
| (7) | ||||
| (8) |
3.2 Typical spiral galaxies
We consider some nearby disk galaxies observed in high resolution from the THINGS data sample (de Blok et al., 2008), where \acDM model-independent evidence for a maximum in the halo rotation curves is provided. Such an evidence is obtained by accounting for baryonic (stars and gas) components — thanks to the inclusion of infrared data from the Spitzer telescope — in addition to the (total) observed rotation curve from the HI tracers. They calculated along the full observed data coverage, the \acDM contribution to the observed rotation curve , by means of , through the corresponding build up of mass models for the baryonic components (with the stellar mass-to-light ratio).
This analysis shows galaxies with extended enough data coverage (mainly corresponding to the larger and more luminous) supporting for evidence of a maximum in the circular velocity (see gray curves within fig. 63 in de Blok et al., 2008). The maximum values for radii and velocity in the more luminous galaxies () are expected to be bounded from above and below as, , and , further implying . The bounds for and are reported in de Blok et al. (2008, fig. 63) using NFW models with data supporting up to . Note the similar behaviour between the NFW and the \acRAR models on the halo scales of interest, as shown in Argüelles et al. (2018, fig. 3) for the case of the Milky Way.
Analogue to dwarf galaxies we identify the radius of the maximal circular velocity as the one-halo length scale with the corresponding \acDM halo mass . Thus, as allowed by data, we adopt throughout this work the following fiducial values for the characteristic \acDM halo properties for typical spirals:
| (9) | ||||
| (10) |
3.3 Typical elliptical galaxies
We consider a sample of elliptical galaxies from Hoekstra et al. (2005), studied via weak lensing signals, and further analyzed in Donato et al. (2009) by providing halo mass models for the tangential shear of the distorted images (i.e. galaxies taken from Appendix A in Donato et al., 2009).
We also consider the iconic case of the largest and closest elliptical M87 as studied in Romanowsky and Kochanek (2001), accounting for combined halo mass tracers such as stars, \acpGC and X-ray data (see also Nulsen and Bohringer, 1995).
Kinematic measurements (e.g. \acpGC) can probe distances up to several , while X-ray and weak lensing data can reach much further distances up to several . Thus, the latter usually allow for (\acDM model-dependent) evidence of a maximum circular velocity on halo scales, where data supports. Such an evidence was provided in Donato et al. (2009) and Romanowsky and Kochanek (2001) through the \acDM profiles (i.e. Burkert and \acsNFW respectively), to obtain best fits to the full data coverage in the galaxies there considered. Providing the following maxima values: and (in the case of the more luminous ellipticals with , following Burkert) up to (in the case of M87, following \acsNFW).
Again, we identify here the radius of the maximal circular velocity as the one-halo length scale with the corresponding \acDM halo mass . Thus, as allowed by data, we adopt throughout this work the following fiducial values for the characteristic \acDM halo properties for typical ellipticals:
| (11) | ||||
| (12) |
3.4 Typical galaxy clusters
We consider a sample of 7 brightest cluster galaxies (BCGs) from Newman et al. (2013). In that work the luminous and dark components were separated to obtain DM distributions which can be well described by a generalized NFW (gNFW) model (Zhao, 1996), developing a maximal velocity at the one-halo length scale . Such morphology is shown in Newman et al. (2013) to be supported by data sets including for weak lensing and stellar kinematics, covering a radial extend from up to . In all cases the halo radii and masses can be inferred from such gNFW profiles and read , and respectivley.
Equivalent to other galaxy types, we identify here the radius of the maximal circular velocity as the one-halo length scale with the corresponding \acDM halo mass . For simplicity we take the mean values of the inferred radii and masses as typical values for BCGs. Thus, as allowed by data, we adopt throughout this work the following fiducial values for the characteristic \acDM halo properties for typical BCGs:
| (13) | ||||
| (14) |
3.5 Method
The halo values adopted above for each (representative) galaxy or BCG, are such that
-
1.
they correspond to \acDM dominated halos as carefully checked in each observational work cited above;
-
2.
they do not account for the (total) virial \acDM mass due to natural observational limitations, but they rather represent the \acDM halo characteristics somewhat outside the region of baryon dominance.
We thus systematically calculate (for the relevant example of as motivated by the Milky Way analysis in Paper I) the RAR solutions represented through the configuration parameter (), which match the halo constraints \acsrh and \acsMh with a tolerance under the least-square condition
| (15) |
Here, the observables for each galaxy or BCG case are compared with the predictions for a parameter vector . The associated set of constraints with are given in eqs. 7 and 8 for dwarfs, eqs. 9 and 10 for spirals, eqs. 11 and 12 for ellipticals and eqs. 13 and 14 for BCGs.
Notice that the observational constraints necessarily imply astrophysical RAR solutions which develop a maximum in the halo rotation curve (i.e. as set by ). Additionally, we request to the solutions one extra (underlying) physical condition, hereafter the quantum core condition: the compact-core is stable or non-critical (i.e. it does not have the critical mass of gravitational collapse to a BH), fulfilling the quantum-statistics relation in the core. These conditions define the full window of astrophysically allowed \acRAR-family solutions. Importantly, the two halo constraints (for given ) provide a one-parametric family within the full ranges of the three configuration parameters (, , and ). Thus, the obtained values lay along a one-dimensional curve in the free configuration space and are limited from below and above; see A for further details.
4 Results
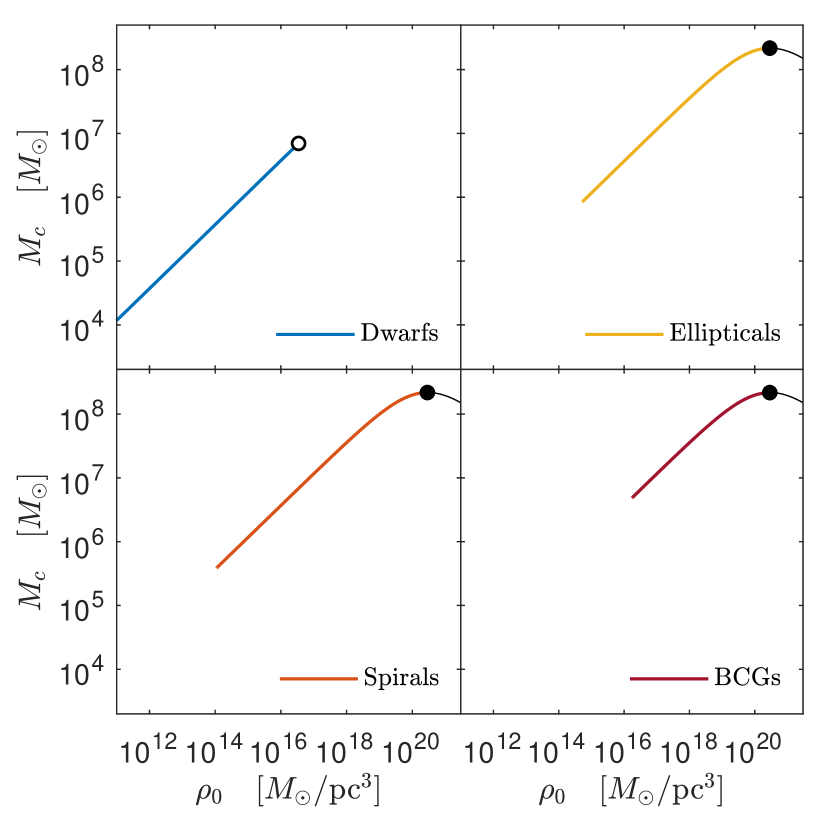
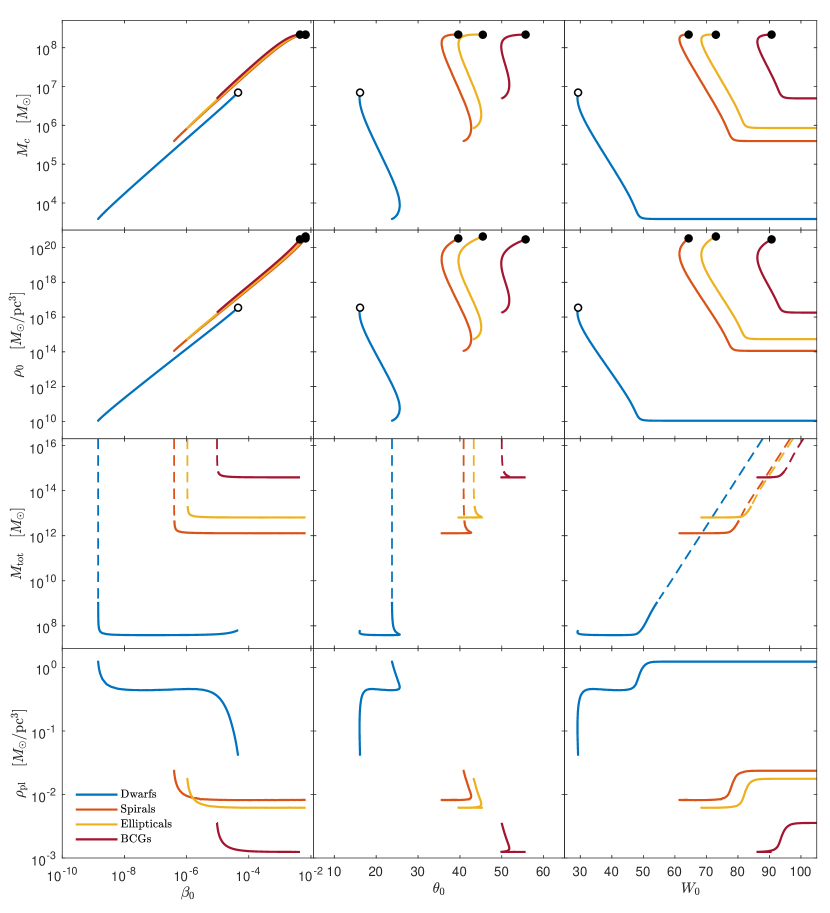
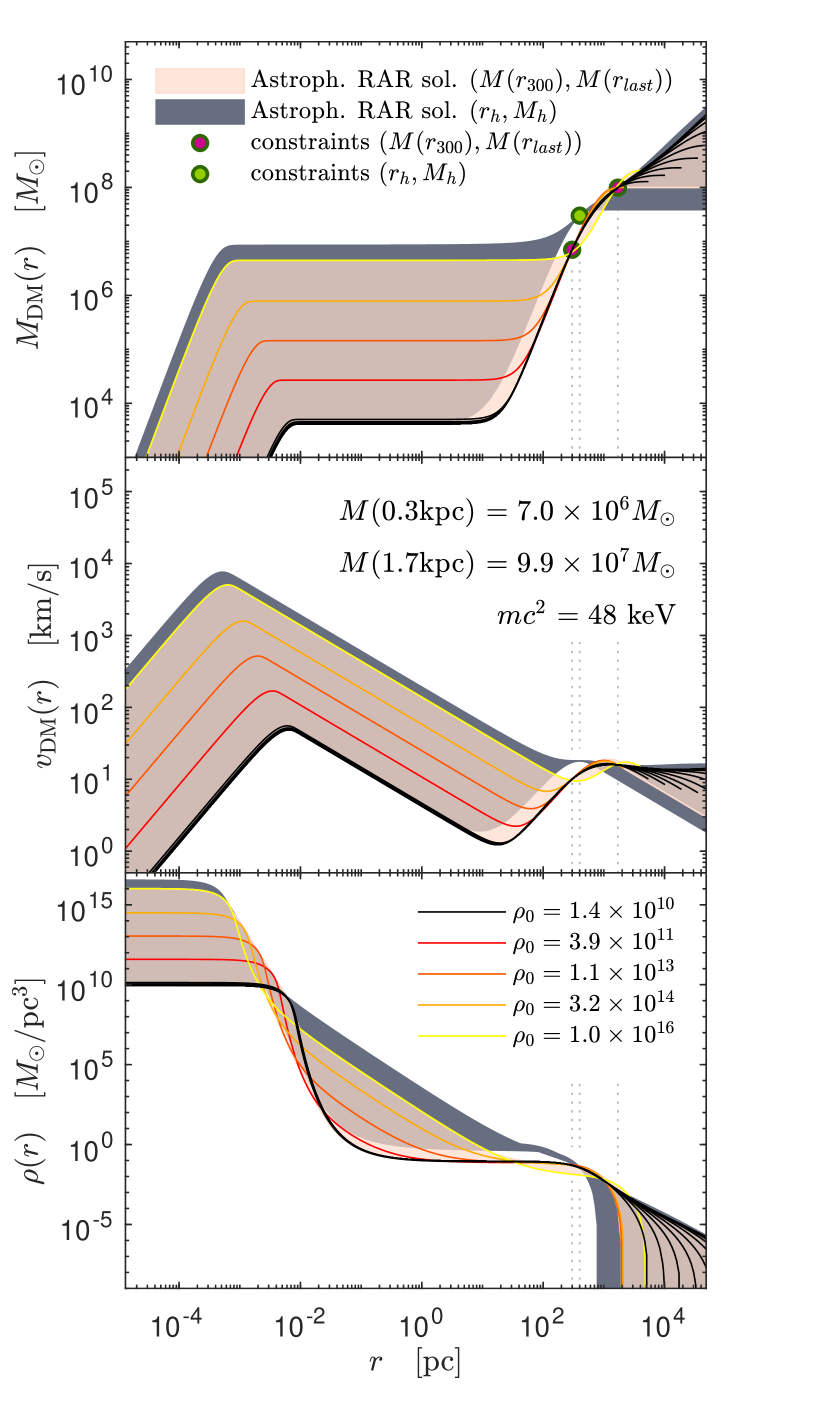
The \acRAR model provides, for each galaxy type and BCG with given observables ), a continuous set of solutions which is illustrated as a blue shaded region in fig. 1. In particular, we show five benchmark solutions, labeled with their central densities (from black to magenta, roughly enveloping the blue shaded regions), for \acDM mass distributions , rotation curves and density profiles . All solutions have been calculated for the relevant example of , with corresponding full set of free \acRAR parameters as detailed in A.
They encompass a window of possible core and total masses, labeled as \acsMc and \acsMtot, for each galactic structure (see table 1 for benchmark numerical values and fig. 8 for full range). Importantly, those mass windows are bounded from above and below as dictated by the astrophysical (i.e. \acsv-max at \acsrh) and quantum core conditions (see A for details).
![[Uncaptioned image]](/html/1810.00405/assets/x1.png)
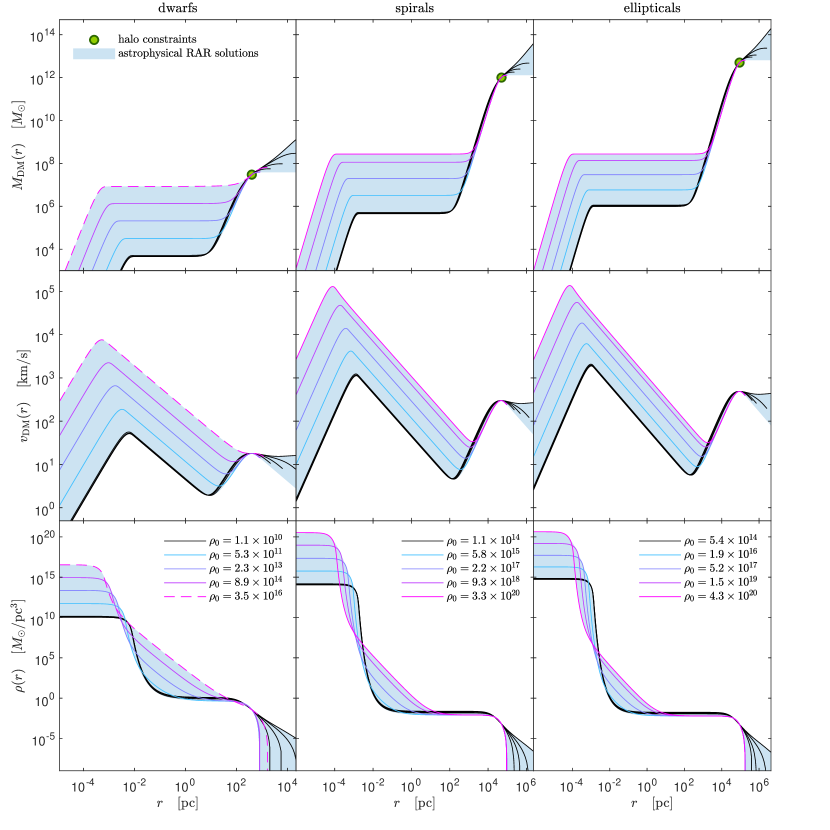
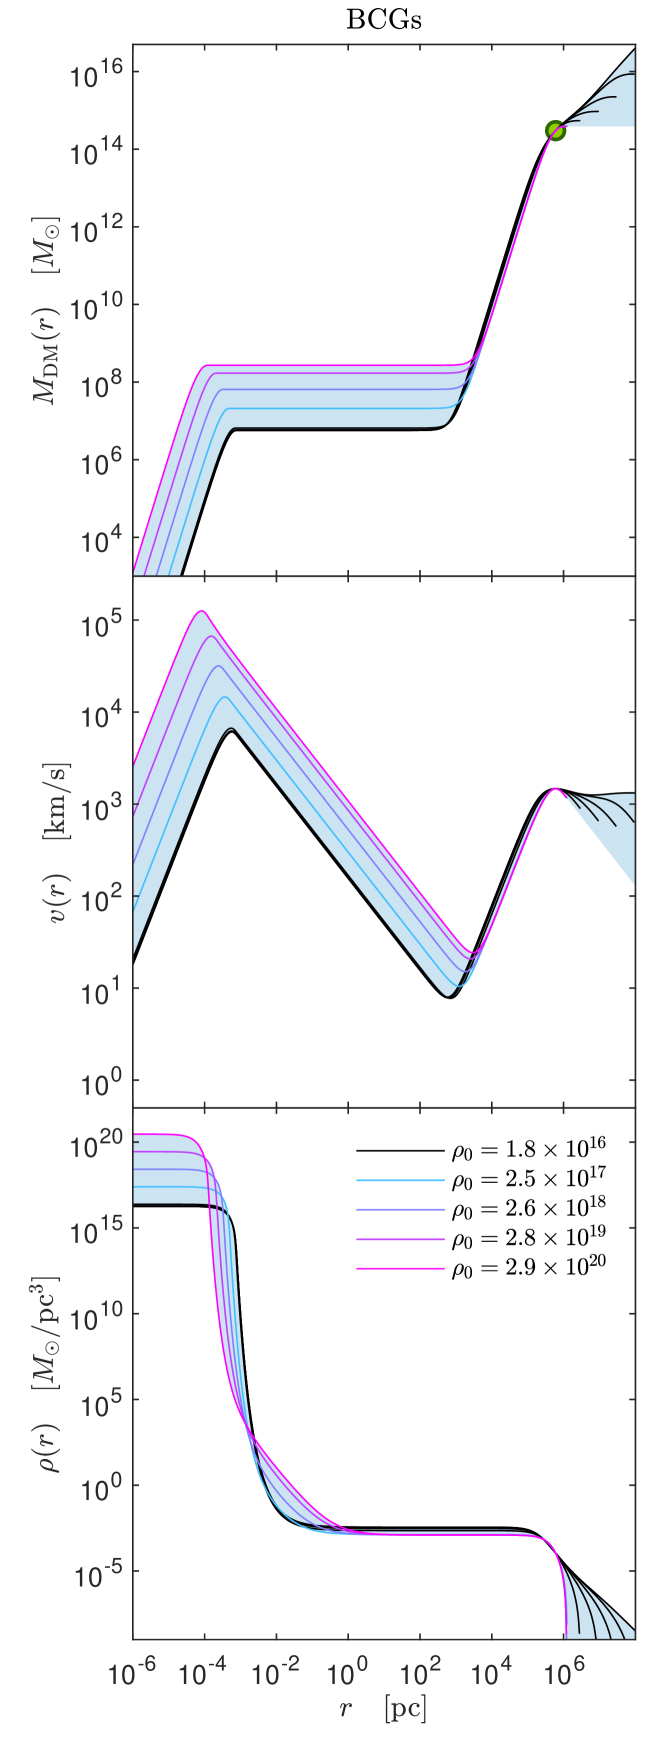
The core mass is given at the core radius, defined at the first maximum of the rotation curve (analogously to the halo radius definition). The outermost \acDM halo mass is obtained at the border radius \acsrb, which is defined by , above which there is no remaining particle energy as set by the \acRAR cutoff parameter condition (see section 2). Both masses are an outcome of the \acRAR family of astrophysical solutions and can be considered as a prediction of our theory (see table 1).
The critical solutions, reaching the limiting core mass achieved only by the typical spiral and elliptical galaxies as well as for larger BCGs, are represented by the continuous magenta curves. The dashed magenta curve, in contrast, indicates the limiting (non-critical) solutions for typical dwarfs, where no maximum halo rotation curve is present (i.e. halo-scale \acsv-max and plateau-scale \acsv-min merge to a saddle point in the rotation curve).
On the other hand, the black curves correspond to the solutions acquiring the lowest possible central density but with a cutoff affecting the outer halo tails. These solutions develop more and more extended density tails resembling isothermal-like solutions, corresponding to at large radii. Accordingly, the limiting case resembles fully isothermal solutions, infinite in mass and size, in agreement with what was obtained in the original version of the model (Ruffini et al., 2015).
The astrophysical conditions imposed to the solutions put no limit on the maximum value of . Unless no other observational constraint is available (for a given galaxy) regarding the ending trend in the shape of the density tail, can increase indefinitely. Indeed, the larger the lesser the hardness in the falling-down shape of density profiles beyond \acsrh and the larger the boundary radius \acsrb. Of course, at some point \acsrb (and consequently \acsMtot) will be excessively large to represent any reliable astrophysical halo. Therefore, those \acRAR solutions must be discarded as physical ones (see section 5 for the usage of a quantitative condition). We show, for completeness, at bottom left of fig. 1 (black lines) the full plethora of density tails, corresponding with the specific minimum core mass solutions for each galaxy type.
It is important to make explicit that in all the cases analyzed the quantum core condition is fulfilled. We obtain for dSphs, for typical spirals, for normal elliptical galaxies and for typical BCGs.
In sum we find that dark halos from dSph all the way up to BCG can be explained with regular and continuous distributions of the same type of fermions, having a particle mass of . Instead of massive BHs at their centres, our solutions develop massive and compact quantum cores with masses in the range
-
1.
for typical dSphs
-
2.
for typical spirals
-
3.
for typical ellipticals
-
4.
for typical BCGs
The smaller the dark halos (from dSphs to typical ellipticals to typical BCGs), the lesser their masses and the lesser their core compactness, and viceversa. This tendency ends at the larger (i.e. more extended) \acDM halos, having a core of critical mass which is described in more detail by the continuous-magenta solutions (e.g. typical spirals, ellipticals and BCGs) in fig. 1. Additionally, the trend can be checked by comparing the group of values in columns with and among the different galactic structures in table 1.
The quantum core masses \acsMc, the total halo masses \acsMtot and the (consequent) associated window for the plateau densities \acsrhop (defined at the minimum of the \acRAR rotation curve and inherent to each of the \acRAR solutions), have to be considered as explicit predictions of the \acRAR model.444 The reader is referred to A for a full description of the limiting predicted properties of the RAR profiles in terms of the free model parameters. These predicted values are contrasted in more details within the context of the \acsMbh - \acsMtot relation and the constancy of the central surface \acDM density in section 5, as a consistency check of the model.
4.1 Galaxy fitting examples: the case of Sculptor and UGC05986
4.1.1 The Sculptor dSph
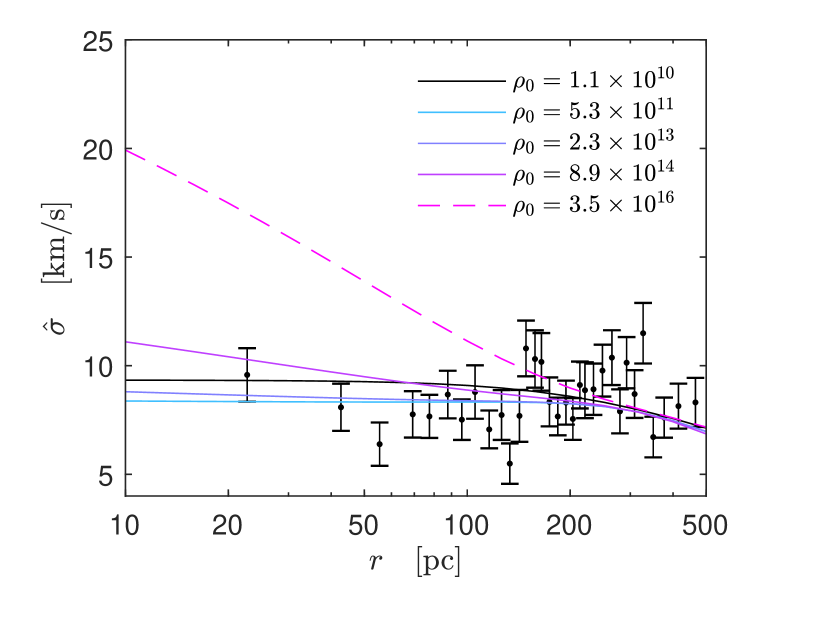
The aim is thus to link our typical RAR solutions for dSphs with a proper observable such as the (projected) dispersion velocity \acsvelDisp-proj arising from Jeans analysis (as the one applied for dwarfs in Walker et al., 2009) to be then compared with the corresponding data. We will consider for definiteness one of the best resolved MW satellites such as the Sculptor galaxy, as studied in Walker et al., 2009. For this we assume our \acRAR \acDM mass profile and a Plummer profile for the stellar (surface) density (with the corresponding and orbital anisotropy for stellar components adopted in Walker et al., 2009). This is done for the five different benchmark solutions () as given in fig. 1. From this (back-of-the-envelope) comparison, which is shown in fig. 3, it turns out that while all of our solutions provide reasonable fits on halo scales555 More refined fits to the data could be obtained within the \acRAR model through a least squares analysis, when all halo observables are used to find the best fitting RAR free-parameters for , besides the two (generic) halo restrictions here applied (to appear in Paper III dedicated to dSphs). (somewhat similar to the cored-halo profile assumed in Walker et al., 2009), some of them present a clear mismatch (of nearly a factor ) through the more central inner-halo scales (see dashed-magenta curve in fig. 3). This clear difference occurs for the solutions with central temperatures close to \acsbeta0-max, i.e. the ones having exceedingly large Keplerian velocity cores reaching inner halo scales of few .
It is important to further emphasize that such \acsvelDisp-proj data mismatch through the center, is only present for the RAR solutions developing a cuspy trend in , which in turn occurs only for the larger solutions. Interestingly, such trend arises because of the much small extension of dSphs respect to the larger galaxy types together with the astrophysical condition (presence of a maximum in the halo rotation curve) imposed to the solutions. Indeed, when such condition is no longer fulfilled (see saddle-point behaviour in for dSphs in dashed-magenta in fig. 1), an unphysical fast rising trend in \acsvelDisp-proj arises, evidencing the relevance of asking for such astrophysical condition in the rotation curve.
4.1.2 The UGC05986 spiral
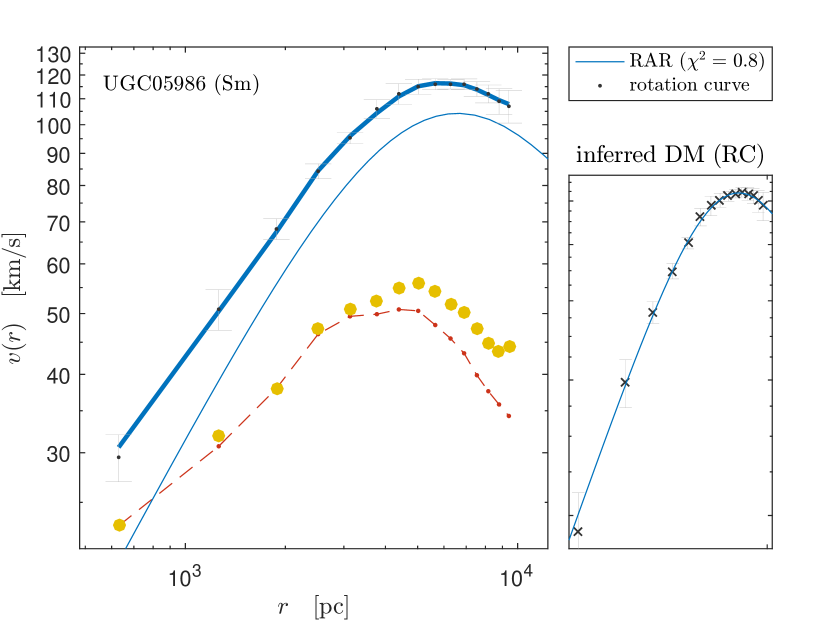
In order to provide a complementary and detailed fit for a different galaxy type to the one shown in the above section, we have selected a DM dominated and well resolved spiral galaxy (UGC05986) from the Spitzer Photometry and Accurate Rotation Curves (SPARC) date base (Lelli et al., 2016). Specific information about each galaxy (i.e Hubble type, inclination etc) are provided in different files at http://astroweb.cwru.edu/SPARC/. We take for this galaxy the corresponding galactocentric radius and rotation curves , from the file Table2.mrt, as well as the baryonic contribution , composed of a bulge (), disk () and gas component (). The bulge and disk components are inferred from surface brightness observations for a given mass-to-light ratio. In sum, the baryonic component is given by
| (16) |
With the corresponding mass-to-light ratio factors and for bulge and disk respectively. Then the rotation curve for each component traces immediately its centripetal acceleration . We thus fit the inferred DM rotation curve, , with the Levenberg–Marquardt (LM) algorithm to find a minima. The quantity is calculated by
| (17) |
with the number of data points, is the set of circular velocity data, is the corresponding set of radius data, is the predicted circular velocity at radius for the model parameter vector and is the uncertainty for . For the RAR model under consideration, , we vary the three free parameter () for a fixed particle mass until the least square condition is satisfied, giving: , and .
In fig. 4 we show the rotation curves for different components of the galaxy UGC05986 as an example illustrating the necessity of cutoff effects for the \acDM dominated halo666Notice moreover from fig. 9 (typical spirals) that lays within the range of benchmark solutions which correspond with the sharp decreasing halo tails (i.e. with ) in fig. 1. A detailed analysis of the full SPARC galaxy sample will be presented in an accompanying paper.
4.2 Particle mass dependence
In the case of typical dark halos in spiral, elliptical and BCGs a particle mass of provides the maximum (critical) core mass of . If the mass is instead shifted to larger values, say , a different three-parametric () family of solutions arises, able to reproduce the same \acDM halo observables () for each case. But now the maximum (critical) core mass decreases to for galactic structures larger than dwarfs. These new solutions have exactly the same core-halo behavior as those in fig. 1 with similar windows of predicted core and total halo mass (\acsMc and \acsMtot) but ending at the lower critical core mass as indicated above.
More generally, the fermion particle mass range , as obtained from the Milky Way analysis in Paper I, implies stable \acDM quantum cores with masses up to the critical values. The lower particle mass the higher the critical core mass. Thus, the corresponding range is due to the particle mass dependence (see Argüelles and Ruffini, 2014).
4.3 About the critical core mass
The core of our configurations is supported by fermion degeneracy pressure. Therefore, the core is subjected to the gravitational instability leading to the concept of critical mass, traditionally introduced for white dwarfs (Anderson, 1929; Stoner, 1930; Chandrasekhar, 1931a, b; Landau, 1932) and neutron stars (Oppenheimer and Volkoff, 1939; Rhoades and Ruffini, 1974). When the pressure is dominated by the degeneracy pressure (i.e. when the temperature is much lower than the Fermi temperature), the fermion kinetic energy depends only on density, and so the equilibrium value of mass and radius of the configuration is set by the balance between the gravitational and the kinetic energy, at given finite density (Oppenheimer and Volkoff, 1939). This effect can already be seen in a post-Newtonian approximation determination of the equilibrium configurations (see e.g. Wagoner and Malone, 1974; Ciufolini and Ruffini, 1981). It can be shown that such a limiting configuration is the first turning-point of the equilibrium sequence of increasing central density, namely configurations along the sequence branch with are stable, the ones with are unstable, and is the turning point, the critical mass configuration (see Shapiro and Teukolsky, 1983, for a detailed discussion on the subject). The above concept of the critical core mass \acsMc-crit can be therefore formally achieved by finding the maximum (turning point) in a vs. \acsMc diagram, as was shown in the context of the original \acRAR model, i.e. for (see Argüelles and Ruffini, 2014, and references therein). Labeled here as the critical-core condition, this concept applies in the same way for the actual \acRAR model with cutoff (), see fig. 5.
Accordingly, typical spiral and elliptical galaxies as well as BCGs reach the critical core mass (e.g the turning point at a critical density), corresponding to a critical temperature parameter . For typical dwarfs, on the other hand, the maximal temperature () is set by the astrophysical condition, such as requiring a maximum in the rotation curve on halo scales The (i.e. for such condition is broken as explicited in the dashed solutions of fig. 1 for dwarfs). This limits the maximal core mass (and central density), being far away from the critical value.
4.4 Role of the degeneracy and cutoff parameters in the core-halo morphology of \acRAR solutions
The fact that higher compactness of the core is obtained by increasing the temperature parameter, while maintaining a rather low degeneracy, is understood by the semi-degenerate nature of our fermionic solutions in contrast with a fully degenerate regime. The combination of the finite-temperature effects and the monotonically decreasing change (from positive to negative values) of the degeneracy parameter with the distance (see e.g. upper panel of fig. 2 in Argüelles et al., 2018) are the responsible for the clear dense quantum core - Boltzmannian tail behavior of the density profiles in fig. 1. Once in the diluted regime, and for solutions which are still away from becoming critical, a small increase in has important effects on the \acRAR halo scales: the larger the cutoff parameter , the more massive and more extended the galaxy gets as can be directly checked in fig. 1 and fig. 9 from dSphs to ellipticals to BCGs, respectively.
This fact is better understood through the role of the escape energy in the distribution function (see sec:RAR-model). The larger the escape energy , the larger the momentum (and energy) space the particles can occupy at any radius. Note, the escape energy is proportional to the cutoff parameter . In consequence, the solution cover more extended total spatial extensions before reaches 0 at the boundary radius \acsrb.
5 Galaxy parameter correlations
In the previous sections we have successfully compared and contrasted the solutions of the \acRAR model with a wide range of galactic observables. We turn now to analyze if the \acRAR model agrees with the following observational correlations:
-
1.
The constancy of the central surface \acDM density in galaxies, e.g. . It spans about 14 orders of (absolute) magnitude (\acsMB), where \acsrho0D and \acsr0 are the central \acDM halo density at the one-halo-scale-length of the Burkert profile (Donato et al., 2009).
- 2.
In order to show this, we use the full family of astrophysical \acRAR solutions (i.e. contained within the blue-shaded region of fig. 1) for typical dSphs, spiral and elliptical galaxies as well as typical BCGs. Such solutions cover the maximal free parameter space (,,) for each galaxy type as constrained by the halo observables for the particle mass together with the quantum core condition. Correspondingly, a well defined window of predicted masses () is obtained (see fig. 8 for details). As we show below, the knowledge of the corresponding values of the plateau density \acsrhop is also important for the analysis of the central surface \acDM density relation.
We can proceed now to make a consistency check of the predictions of the \acRAR model by contrasting them within the physical observed spread of the correlations. Notice that the constancy of the central surface \acDM density deals only with \acDM halos while the \acsMbh - \acsMtot relations correlate both, the central and total halo dark object masses. Traditionally, the central compact dark objects are assumed as \acpSMBH. But here we interpreted them as \acDM quantum cores with the exception of active galaxies harboring supermassive central objects above .
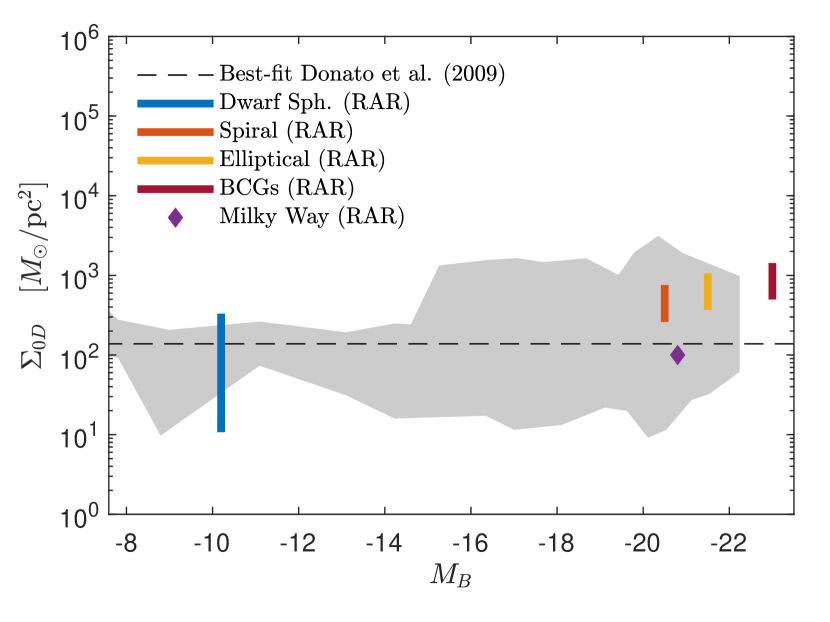
5.1 \acDM surface density relation
Regarding the central surface \acDM relation, we first take from the literature the values for the blue absolute magnitude \acsMB, corresponding to each typical galaxy within each galaxy type considered above. Thus we adopt for typical dSphs (Irwin and Hatzidimitriou, 1995), for the Milky Way (Karachentsev et al., 2004), for typical spirals (de Blok et al., 2008), for typical ellipticals (Hoekstra et al., 2005) and for typical BCGs (Wing and Blanton, 2013).
Then, in order to calculate the \acDM surface density in each case, we simply realize that the equivalent of the Burkert central density \acsrho0D would correspond to the density of the plateau \acsrhop within the \acRAR model. The relation between both one-halo scale lengths is given by , where \acsrh is fixed for each galaxy type according to the imposed halo constraints. For the corresponding family of \acsrhop values see table 1 and fig. 8.
We thus calculate the product for each theoretical profile in the case , including the Milky Way, and finally contrast the pair () with the observational relation found by Donato et al. (2009).
The results for dwarfs to ellipticals are in very good agreement with the observed relation, see fig. 6. For simplicity, the latter is displayed as the overall dark-grey region delimited (or enveloped) within the error bars along all the data points considered in Donato et al. (2009). The predicted surface density (vertical solid lines), for the adopted \acsMB values, are located within the expected data region. The magnitude \acsMB of typical BCGs is beyond the observed window reported in Donato et al. (2009) who considered up to elliptical structures, but their predicted values are somewhat similar to the latter.
Remarkably, our results of the \acRAR model show a mild increasing behavior with decreasing \acsMB. This trend resembles the analogous universal relation presented in Boyarsky et al. (2009) where larger elliptical galaxies as well as clusters were included in the analysis, contrary to the sample presented in Donato et al. (2009).
5.2 Super massive central object - DM halo mass relation
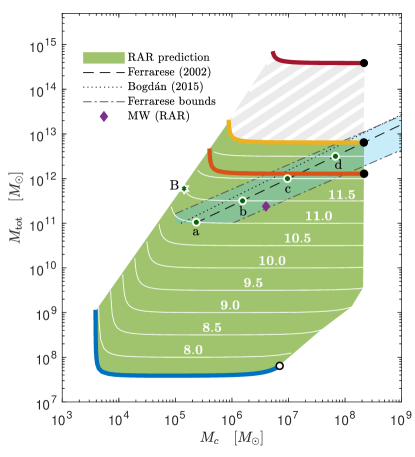
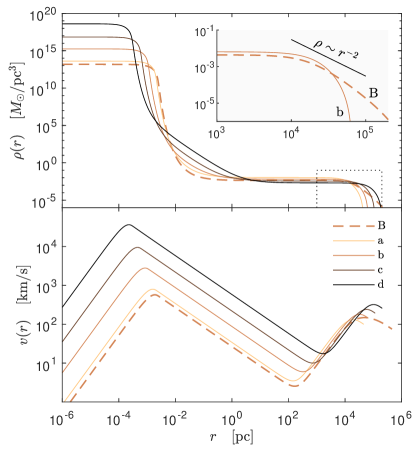
Concerning the \acsMbh - \acsMtot relations, we show in left-panel of fig. 7 the predicted values (see also fig. 8) for many different astrophysical family of RAR solutions including (but not limited to) the typical galactic structures of fig. 1), together with the observationally inferred best-fit relations found in Ferrarese (2002); Bogdán and Goulding (2015). The observational inferred relations are limited to the region where data supports, i.e. the Ferrarese strip denoted by blue-ish area in left-panel of fig. 7. Interestingly such observational strip is explicitly shown to be contained (up to ) within the larger \acRAR green-ish predicted area from small spirals up to ellipticals. The red and yellow continuous thick L-shaped lines correspond to the typical spirals and ellipticals considered in section 3. While the thin white lines (labeled with different \acsMtot values) cover many different one-halo scale observables (\acsrh,\acsMh) besides the ones associated to the typical galactic structures introduced in section 3. Such new (\acsrh,\acsMh) values are obtained from the independent Donato relation as explained in C and fig. 11, with the aim to maximally cover the plane. The RAR predicted (green-ish) area extends out of the Ferrarese strip, indicating a potential window of core-halo masses which are either not yet observed or unphysical.
Indeed, RAR solutions deviating too far-left of the observed strip (e.g. dot B in left-panel of fig. 7), has isothermal-like density tails () as plotted in right-panel, at difference with RAR solutions lying along the best-fit relation (e.g. dot b, see both panels). The later has halo tails decreasing as somewhat inside 777 Due to the cut-off effects, the RAR halo tails behaviour for solutions which are favored by the correlation are of polytropic nature, with for . more in line with other phenomenological profiles arising from N-body simulations either in WDM or CDM cosmologies. From this comparison we can conclude that the observed correlation disfavors RAR solutions showing isothermal-like halo tails, while favors more sharply decreasing halo tails. The Milky Way \acRAR solution is also plotted for completeness, showing a good agreement as well.
The case of typical dwarf galaxies (thick blue curve) is located at the lower-left end of the plane in fig. 7, beyond the observationally inferred blue-ish strip. It is worth to stress that no observational data exist yet in that part of the correlation and thus the obtained results are considered as a pure RAR model prediction, subject to observational scrutiny. However, special attention has to be given to our dwarf galaxy predictions in view of the recent observational reports of putative massive black holes of few detected in ultra-compact dwarf galaxies of total mass of few (e.g. Seth et al., 2014; Ahn et al., 2017, 2018; Afanasiev et al., 2018). Similarly interesting candidates are the recent discovered \acpIMBH in globular clusters (e.g. Kızıltan et al., 2017; Perera et al., 2017).
When we look at larger structures beyond ellipticals we find BCGs as further convenient predictions. Interestingly (and different to the other smaller structures considered) their dark central cores are limited by a relatively light-mass value () when compared to the very massive halo of few . Having halo properties very similar to typical ellipticals and spirals, in line with the universal DM halo morphology within the standard picture of hierarchical structure formation.
Notice that a vertical trend up to infinity (not shown) in the L-shaped lines of fig. 7 corresponds to \acRAR solutions having the minimum core mass (or minimum ) which in turn implies the larger cutoff parameters until with no particle escape whatsoever (see fig. 8 for the case of typical galactic structures). Those solutions develop more extended and more massive halos. Such trend ends in an infinite halo mass when the limiting isothermal \acRAR tail is reached, unless some (extra) virial condition is imposed to them (e.g. typically setting a minimum threshold density at about to any profile, where \acsrho-crit is the critical density of the Universe). Solutions with total masses exceeding such virial constraint are excluded as astrophysical ones and therefore not appearing in fig. 7.
It is appropriate to stress at this point that the \acsMtot values appearing in the observed relations plotted in fig. 7, were calculated at the virial radius within a \aclNFW \acDM model (Ferrarese, 2002). While in our case, they were obtained at the surface radius \acsrb of the \acRAR model equilibrium configurations. Besides, the majority of the values of \acsMbh in the observed \acsMbh - \acsMtot relation have been obtained through the so-called relation, with \acsvelDispB the bulge dispersion velocity (Ferrarese and Merritt, 2000; Gebhardt et al., 2000; Gültekin et al., 2009). However, in the case of dwarf galaxies the observational inference of the dark central object mass via the dispersion velocity is unclear (see, e.g., Valluri et al., 2005; Kormendy and Bender, 2011, and references therein). Interestingly, Valluri et al. (2005) attempted to give an estimate of such a central object mass in the case of NGC205 obtaining (interpreted there as an \acIMBH), which is in agreement with the values of \acsMc for the typical dSphs analyzed in this work (see table 1).
Finally, in the case of larger elliptical galaxies, it is interesting to note that the maximum quantum core mass (for ) predicted by our model, is in striking consistency with the uppermost (sample-representative) central mass \acsMbh obtained in Bogdán and Goulding (2015), from an X-ray imaging analysis of more than 3000 isolated and without AGN activity elliptical galaxies. These results, when viewed through our theoretical \acsMbh - \acsMtot relation, give support to our idea that normal elliptical galaxies may harbor dark central objects (not yet BHs) without showing AGN-like activity, while larger SMBHs masses, do show AGN properties, reaching the upper end of the \acsMbh - \acsMtot relation.
Additional verification of the above predictions of the \acRAR model needs the observational filling of the gaps in the plane from dwarfs all the way up to ellipticals. This has been partially done for disk galaxies from the SPARC data base and will be presented in an accompanying paper.
6 Concluding remarks
In Paper I we clearly demonstrated that gravitationally bounded systems based on fermionic phase-space distributions including for escape velocity effects and central degeneracy, can explain the \acDM content in the Galaxy while providing a natural alternative for the central BH scenario in \acsSgrA. This highly compelling result is bolstered here by the analysis of different galactic structures ranging from dwarfs to ellipticals to galaxy clusters.
As an interesting example, we have discussed in this paper the solutions for , where the model is able to explain the \acDM halos from typical dSph to normal elliptical galaxies up to typical BCGs, and predict the presence of massive compact dark objects from up to at their respective centers. A key point of the present \acRAR model is the ability to fulfill the observed properties of galaxies, such as the \acsMbh - \acsMtot and the universal relations, for a unique \acDM fermionic mass. The versatility of the physical three-parametric solutions, can also account for the (real) physical spread observed in the correlation between dark halo mass Vs. dark central object mass, as observationally inferred in Ferrarese (2002); Kormendy and Bender (2011); Bogdán and Goulding (2015). Whether or not such full window of compact dark-object masses at the centres of galaxies occur in Nature is a theme of future observational works, particularly interesting in the case of the smallest (i.e. faintest) dwarf galaxies.
Nevertheless, the analysis should cover all observed plethora of galactic dark halos with corresponding dark compact central objects. In particular, the RAR model predicts that galaxies with similar halo properties (i.e. total halo mass and radius) can harbor different dark quantum core masses, spanning up to about orders of magnitude. This peculiar feature is an important result of our theory, considering that very similar Seyfert-like galaxies have been observed to shown values of \acsMc that can differ in nearly one order in magnitude (, see Greene et al., 2010).
At the upper limit of the compact core mass range, it provides, on astrophysical basis, possible clues on the formation of \acpSMBH in galactic nuclei. In the case of typical dark halos in normal spiral and elliptical galaxies, self-gravitating fermions with a particle mass of may produce a maximum (critical) core mass of , at the onset of gravitational collapse.
The majority of the supermassive dark central objects are comprised within (Gültekin et al., 2009). However, in the largest elliptical galaxies have been also observed more massive dark objects up to . Those candidates are most likely \acpSMBH associated with active galaxies and are characterized by a clear X-ray and radio emissions as well as jets. Such \acpSMBH may be explained starting from a BH seed of mass \acsMc-crit formed out of the collapse of our critical quantum \acDM cores. After its formation, such a BH seed might start a baryonic and/or dark matter accretion process from their massive galactic environment (). An accretion of of the (inner) baryonic mass of the galaxy onto the \acsMc-crit core mass obtained here, would be enough to explain the formation of the largest () \acSMBH masses.
Other observational data-sets such as Ly forest constraints, or high resolution rotation curves of disk galaxies (points (b) and (c) mentioned in the introduction), are also important to discriminate between different particle-motivated \acDM halo models such as the RAR model, \acFDM or sub-keV degenerate fermions. Standard \acFDM as the ones recently considered in Hui et al. (2017), has an associated matter power spectrum which share the same features with the one of the \acWDM paradigm at large scales, both exhibiting a clear drop (though somewhat different in shape) in power below a given scale (Marsh and Silk, 2014). Such similar behaviour allowed Hui et al. (2017) to roughly relate the lower bound mass values of \acFDM to the ones of a \acWDM fermion obtained by Viel et al. (2013) from Ly forest data. In particular, a lower limit of (at ) of the hypothetical \acWDM particle (thermal relics) translates into for the ultra light boson at the same confidence level (Hui et al., 2017). Unfortunately, this bound strongly disfavours the typical \acFDM range of masses needed to solve different small-scale issues of the CDM paradigm (Hui et al., 2017). Improved analysis making use of dedicated cosmological simulations within \acFDM paradigm to account for the physics at the scales probed by the Ly forest data (from the BOSS survey), exclude the mass range (Armengaud et al., 2017).
In the case of fermionic models, it is then clear from the above paragraph that the few lower bound found in Viel et al. (2013, see also () for more general lower bounds above including for sterile neutrino \acWDM) is in tension with the below- Thomas-Fermi DM models presented in Destri et al. (2013); Domcke and Urbano (2015); Randall et al. (2017), while it remains in agreement with the \acRAR model here presented.
Reproducing the (total) Milky Way rotation curve features posses as well serious challenges to \acFDM models in the desired mass range needed to account for other astrophysical and small-scale cosmological observables (Bar et al., 2018). Indeed, it was there explicitly shown that the solitonic core arising typically at bulge-scales in the case of typical disk galaxies, practically excludes the \acFDM mass range . Finally, the case for highly degenerate fermionic halos (i.e. Thomas-Fermi models DM cited above), are not applicable at all to reproduce the rotation curves of disk galaxies (or larger), since they were originally motivated to fit the dispersion velocities of small dSphs (Destri et al., 2013) due to the predicted highly compact and small sized halos. Moreover, a closer look on such models (as the one recently analyzed in Domcke and Urbano (2015)) shows that they are disfavoured even to fit dSph dispersion velocities, and the artificial introduction of an isothermal tail is needed (Randall et al., 2017).
Thus, the results described in the above paragraphs put the \acRAR model with fermion masses above , in a position of privilege with respect to other particle-based models such as \acFDM or the ones based on sub-keV fully-degenerate fermions.
Finally, and in order to attempt to answer the question why nature constrains the \acRAR model free parameters to the specific values shown in fig. 9 and table 1, it would need the extension of the present analysis into a broader theoretical context such as the formation and evolution of galaxies.
Such an insight may be likely gained through a detailed study of a dynamical theory of collisionless relaxation, including a full statistical/thermodynamical analysis of the condition under which (quasi) \acDM halo relaxation is reached. Considerations based on maximization entropy approaches for given total mass (with corresponding running of the free model parameters), as the one analyzed in similar self-gravitating systems in Chavanis et al. (2015) (and references therein), could help in this direction. These interesting aspects are out of the scope of the present work and are subject of future research.
Acknowledgments
We thank the referee for her/his very constructive and clear suggestions. C.R.A acknowledges support by the International centre for Relativistic Astrophysics Network (ICRANet) and CONICET-Argentina. J.A.R acknowledges support from the International Cooperation Program CAPES-ICRANet financed by CAPES-Brazilian Federal Agency for Support and Evaluation of Graduate Education within the Ministry of Education of Brazil. A.K. is supported by the Erasmus Mundus Joint Doctorate Program by Grants Number 2014–0707 from the agency EACEA of the European Commission.
Appendix A Parameter space analysis
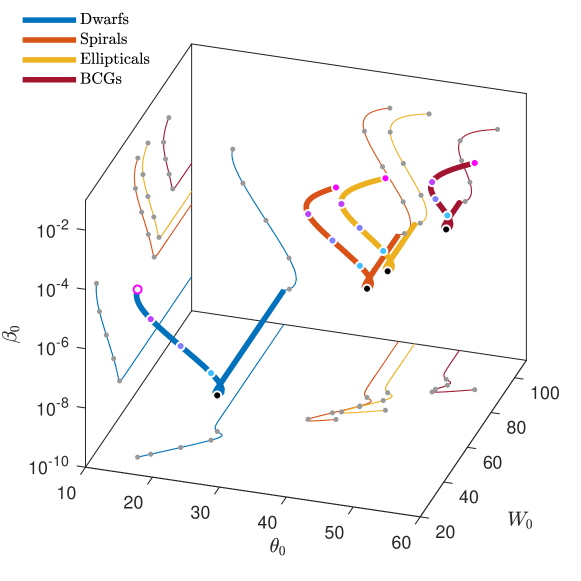
Here we show how the halo observable constraints (\acsrh and \acsMh) together with the additional quantum-core condition define the limiting values of the free sets of \acRAR configuration parameters (,,) for the different galaxy types. Specifically fig. 9 shows the full curves in the ()-space for . Each galaxy is represented through a coloured -dimensional line, i.e. in thick blue (dwarfs), red (spirals) and yellow (ellipticals), while typical BCGs are represented through a thick tamarillo line. We also include along each line the sets of the benchmark \acRAR solutions, given in fig. 1, through dots in corresponding colours. This correspondence shows clearly the ranges of , , and , encompassing all the astrophysical \acRAR solutions.
A.1 About the 1-dimensional curves of free \acRAR model parameter space
The fact that the halo scale radius \acsrh sets a specific morphological point in the \acRAR solutions (i.e. as in , , , , etc.), it must necessarily depend on the specific choice of the initial conditions, i.e.
This functional dependence, together with
clearly defines a -dimensional curve in the () \acRAR configuration parameter space once , \acsMh and \acsrh are given (i.e. free parameters and constraints).
The number of free parameters of the model may be reduced to three when the particle mass is set (i.e. in the range as obtained in PaperI). This approach requires only constraints, such as \acsrh and \acsMh. If instead only one constraint (i.e. with a hypothetically well constrained halo scale-length) is applied instead of the two constraints used in this work, then a narrow -dimensional region would arise in the ()-space of fig. 9. Nevertheless, many of the solutions in this (more) extended family will certainly provide worst fits to the baryonic data (as e.g. for the case of \acsvelDisp-proj in dSphs) than the solutions here presented, considering less observable constraints were used.
A.2 Limiting behavior in the parameter sets
The effects of the \acRAR parameter sets in the corresponding \acRAR solutions explain the limiting values in the core mass \acsMc, the total mass \acsMtot and plateau density \acsrhop. The maximum and minimum \acDM masses, predicted by the \acRAR model, have associated maximum and minimum in the predicted \acsrhop values, as explicitly shown in fig. 8.
The importance of those predicted windows for each galaxy type reflects universal relations between galaxy parameters. Thus, the predicted windows of \acsMc and \acsMtot masses reflect the Ferrarese Universal relation (Ferrarese, 2002) while the predicted \acsrhop window reflects the constancy of the central surface \acDM density in galaxies (Donato et al., 2009). Both relations are discussed in detail in section 5.
The main responsible for the increase of the quantum-core mass, i.e. from in dSphs to in typical spirals, ellipticals and BCGs, is the temperature parameter , which can vary about six orders of magnitude among the different galaxy types. Instead, the pair (, ) remains around the same order-of-magnitude values and is mainly relevant to the \acDM halo physics. For the latter compare fig. 1 and fig. 9, together with values in table 1.
The temperature parameter is limited from above by its critical value \acsbeta0-crit for the case of typical spiral and elliptical galaxies as well as BCGs. That limit is set by the quantum core condition. For higher values the \acRAR solutions become gravitationally unstable and lead to the gravitational collapse of the quantum core. In the case of typical dwarf galaxies the temperature is limited by its maximum value \acsbeta0-max. That limit, on the other hand, is set by the (threshold) solution without a maximum in the halo rotation curve, corresponding to highly cuspy halos. Thus, while sets the critical core mass \acsMc-crit for typical spiral and elliptical galaxies as well as BCGs, the \acsbeta0-max sets the \acsMc-max for typical dSphs. See fig. 8 and table 1 for numerical values for each galaxy type.
At the same time, a specific minimal temperature parameter \acsbeta0-min (for all galaxy types and BCGs) is implied by the linear relation between the configuration parameters (, , ), as seen in fig. 9 and the corresponding projection-planes (for not close to its maximum). For large enough values (and beyond) the solutions develop isothermal halo tails without affecting the inner structures through surface effects. Especially, the core remains constant, what resembles here mainly constant and values. Thus, large enough values set all the possible total halo masses \acsMtot, although unbounded from above because may grow up to infinity. Correspondingly those solutions imply the minimal temperature \acsbeta0-min which produce minimal \acDM core masses (see the projection plane).
The existence of a \acsbeta0-crit for spirals, ellipticals and BCGs (and \acsbeta0-max for dwarfs), will necessarily define through the above monotonic relation a low enough value to set the minimal total halo mass for each galaxy type. In the case of spirals, ellipticals and BCGs that minimum correlates with the maximal (critical) temperature \acsbeta0-crit. The correlation does not apply for dwarfs due to the strong boundary effects (i.e. small-sized) close to the maximal temperature \acsbeta0-max, see fig. 8.
Appendix B Robustness of the \acRAR model predictions
![[Uncaptioned image]](/html/1810.00405/assets/x13.png)
The allowed choice for observational constraints at the rotation curves maxima (\acsrh, \acsMh), are here selected in order to have a convenient and unique prior to be used across the entire galaxy zoo. Nevertheless, more precise observational halo mass constraints can be obtained at other typical radial halo scales (though somewhat close to \acsrh), depending on the galaxy type. For example, in the case of dSphs, the halo mass is observationally better constrained at \acsr-300 (i.e at , very close to \acsr-half for Milky Way satellites) as shown in Strigari et al. (2008). Including spiral and elliptical galaxies, other typical one-halo scale lengths (such as the Burkert halo scale-length) are appropriate as reported in Donato et al. (2009).
With the aim to analyze the robustness of the \acRAR model predictions, we further investigate which are the effects on the free \acRAR model parameters when changing the halo constraints to the (observationally) better constrained couple . Here, \acsr-last is the last observed data point, as reported in Walker et al. (2009), allowing for a good fit of . These constraints represent the case of typical dSphs.
The results show a mild shift between the new set of astrophysical \acRAR solutions, illustrated as a light-red shaded region in fig. 10, with respect to the one already found in fig. 1 (displayed as grey-shaded region in fig. 10). Correspondingly, we found similar sets of free \acRAR free model parameters for the new benchmark solutions, as explicited in table 2, which should be compared with those in table 1.
It is worth to note that with the new set of constraints our results predict a narrower range for the core mass, , compared to the result in section 4. This is an increase of about for the lower limit and a decrease of about for the upper limit. The total mass shows an offset towards higher values with increase of about .
Similarly, the same results predict also a narrower range for the surface density , being well within the uncertainty area as shown fig. 6. Note that there is an decrease in the plateau density \acsrhop of about one order of magnitude but also an increase in the halo radius \acsrh of about the same order of magnitude. In sum the product remains robust towards a change of constraints.
The main conclusions from the alternative constraints are very similar to conclusions from the halo constraints (\acsrh, \acsMh). Thus, we obtain similar effects on the predicted \acDM magnitudes (such as \acsMc, \acsMtot and \acsrhop) for the differently chosen boundary halo conditions. This maintains intact the main predictions as provided through the halo constraints (\acsrh, \acsMh).
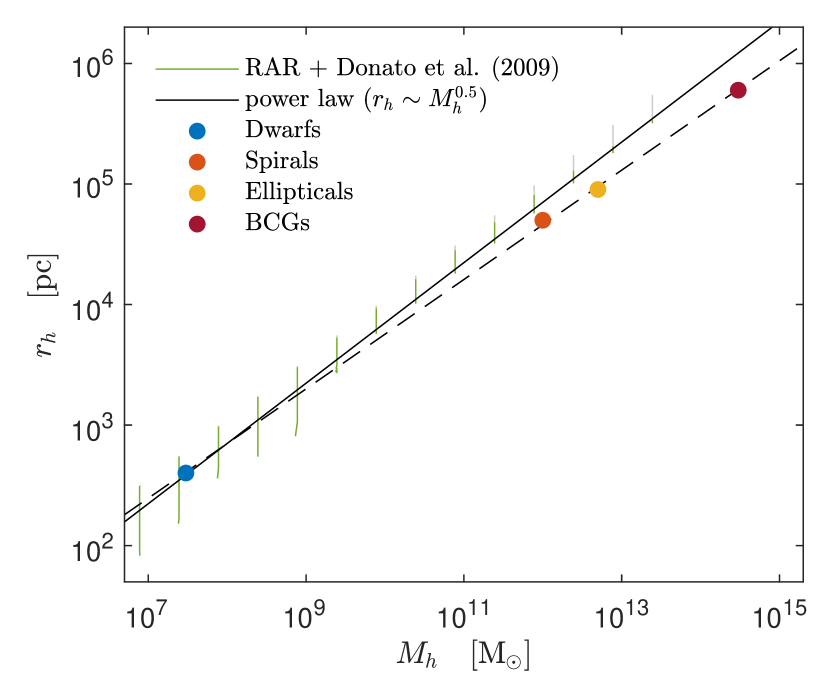
Appendix C The \acsrh - \acsMh RAR relation
The aim here is to show that by the usage of the nearly constant DM surface density (best-fit) as given in Donato et al. (2009), an approximate (but very useful) relation between the one-halo scale length of the RAR solutions \acsrh and its mass \acsMh, is possible (with \acsrho0D and \acsr0 the central \acDM halo density at the one-halo-scale-length of the Burkert profile). Such (\acsrh,\acsMh) relation, obtained without the need to go for specific galaxy-type observables as done in section 3, will be thus applied to cover the gap between dSphs and elliptical galaxies in fig. 7 (represented by the green-ish area).
We start the deduction by recalling the relation between Burkert and RAR one-halo scale lengths , as well as the identification , as given in section 5.1. This allows us to write the following new version of the Donato relation
| (18) |
Given that typical RAR family solutions develop extended plateaus of nearly constant density all the way up to halo scales, the following approximation holds
| (19) |
The combination of the above two equations directly implies a power law relation , which is plotted in fig. 11, and compared with the somewhat milder power relation followed by the observational constraints (\acsrh,\acsMh) obtained in section 3 from dSph to BCGs (in dashed line joining the coloured dots). The reason why these two relations cannot coincide can be seeing through the RAR predictions (vertical thick lines) to the Donato relation in fig. 6, which indeed do not exactly match the Donato best-fit for larger galaxy types. Therefore, an alternative (but equivalent) approach to calculate other families of \acRAR profiles from new boundary conditions (\acsrh,\acsMh) (obtained here from the approximate power law) is possible. Thus, for given halo masses \acsMh within the range (and for a fixed surface density ), one obtains corresponding halo radius \acsrh, depending on the model parameters. The results cover a regime between dwarfs and ellipticals, shown in the green-ish area in fig. 7, where the white (benchmark) lines (labeled by \acsMtot in the horizontal regime) show the new set of RAR families obtained for those new (\acsrh,\acsMh) values. Notice that the continuation of the predicted green-ish area is not extended up to BCGs because the constancy of the DM surface density by Donato et al. (2009) was only provided up to ellipticals.
References
- Baldeschi et al. (1983) M. R. Baldeschi, G. B. Gelmini, R. Ruffini, On massive fermions and bosons in galactic halos, Physics Letters B 122 (1983) 221–224, doi:10.1016/0370-2693(83)90688-3.
- Sin (1994) S.-J. Sin, Late-time phase transition and the galactic halo as a Bose liquid, Phys. Rev. D 50 (1994) 3650–3654, doi:10.1103/PhysRevD.50.3650.
- Hu et al. (2000) W. Hu, R. Barkana, A. Gruzinov, Fuzzy Cold Dark Matter: The Wave Properties of Ultralight Particles, Physical Review Letters 85 (2000) 1158–1161, doi:10.1103/PhysRevLett.85.1158.
- Matos and Arturo Ureña-López (2001) T. Matos, L. Arturo Ureña-López, Further analysis of a cosmological model with quintessence and scalar dark matter, Phys. Rev. D 63 (6) 063506, doi:10.1103/PhysRevD.63.063506.
- Robles and Matos (2012) V. H. Robles, T. Matos, Flat central density profile and constant dark matter surface density in galaxies from scalar field dark matter, MNRAS 422 (2012) 282–289, doi:10.1111/j.1365-2966.2012.20603.x.
- Hui et al. (2017) L. Hui, J. P. Ostriker, S. Tremaine, E. Witten, Ultralight scalars as cosmological dark matter, Phys. Rev. D 95 (4) 043541, doi:10.1103/PhysRevD.95.043541.
- Bar et al. (2018) N. Bar, D. Blas, K. Blum, S. Sibiryakov, Galactic Rotation Curves vs. Ultra-Light Dark Matter: Implications of the Soliton – Host Halo Relation, ArXiv e-prints .
- Destri et al. (2013) C. Destri, H. J. de Vega, N. G. Sanchez, Fermionic warm dark matter produces galaxy cores in the observed scales because of quantum mechanics, New A 22 (2013) 39–50, doi:10.1016/j.newast.2012.12.003.
- Domcke and Urbano (2015) V. Domcke, A. Urbano, Dwarf spheroidal galaxies as degenerate gas of free fermions, J. Cosmology Astropart. Phys 1 002, doi:10.1088/1475-7516/2015/01/002.
- Randall et al. (2017) L. Randall, J. Scholtz, J. Unwin, Cores in Dwarf Galaxies from Fermi Repulsion, MNRAS 467 (2017) 1515–1525, doi:10.1093/mnras/stx161.
- de Vega et al. (2014) H. J. de Vega, P. Salucci, N. G. Sanchez, Observational rotation curves and density profiles versus the Thomas-Fermi galaxy structure theory, MNRAS 442 (2014) 2717–2727, doi:10.1093/mnras/stu972.
- Argüelles et al. (2013) C. Argüelles, I. Siutsou, R. Ruffini, J. Rueda, B. Machado, On the core-halo constituents of a semi-degenerate gas of massive fermions, in: Probes of Dark Matter on Galaxy Scales, 30204, 2013.
- Argüelles and Ruffini (2014) C. R. Argüelles, R. Ruffini, Are the most super-massive dark compact objects harbored at the center of dark matter halos?, International Journal of Modern Physics D 23 1442020, doi:10.1142/S0218271814420206.
- Ruffini et al. (2015) R. Ruffini, C. R. Argüelles, J. A. Rueda, On the core-halo distribution of dark matter in galaxies, MNRAS 451 (2015) 622–628, doi:10.1093/mnras/stv1016.
- Siutsou et al. (2015) I. Siutsou, C. R. Argüelles, R. Ruffini, Dark matter massive fermions and Einasto profiles in galactic haloes, Astronomy Reports 59 (2015) 656–666, doi:10.1134/S1063772915070124.
- Argüelles et al. (2016) C. R. Argüelles, N. E. Mavromatos, J. A. Rueda, R. Ruffini, The role of self-interacting right-handed neutrinos in galactic structure, J. Cosmology Astropart. Phys 4 038, doi:10.1088/1475-7516/2016/04/038.
- Gómez et al. (2016) L. G. Gómez, C. R. Argüelles, V. Perlick, J. A. Rueda, R. Ruffini, Strong lensing by fermionic dark matter in galaxies, Phys. Rev. D 94 (12) 123004, doi:10.1103/PhysRevD.94.123004.
- Argüelles et al. (2018) C. R. Argüelles, A. Krut, J. A. Rueda, R. Ruffini, Novel constraints on fermionic dark matter from galactic observables I: The Milky Way, Physics of the Dark Universe 21 (2018) 82–89, doi:10.1016/j.dark.2018.07.002.
- Deng et al. (2018) H. Deng, M. P. Hertzberg, M. H. Namjoo, A. Masoumi, Can light dark matter solve the core-cusp problem?, Phys. Rev. D 98 (2) 023513, doi:10.1103/PhysRevD.98.023513.
- Donato et al. (2009) F. Donato, G. Gentile, P. Salucci, C. Frigerio Martins, M. I. Wilkinson, G. Gilmore, E. K. Grebel, A. Koch, R. Wyse, A constant dark matter halo surface density in galaxies, MNRAS 397 (2009) 1169–1176, doi:10.1111/j.1365-2966.2009.15004.x.
- Rodrigues et al. (2017) D. C. Rodrigues, A. del Popolo, V. Marra, P. L. C. de Oliveira, Evidence against cuspy dark matter haloes in large galaxies, MNRAS 470 (2017) 2410–2426, doi:10.1093/mnras/stx1384.
- Cen et al. (1994) R. Cen, J. Miralda-Escudé, J. P. Ostriker, M. Rauch, Gravitational collapse of small-scale structure as the origin of the Lyman-alpha forest, ApJ 437 (1994) L9–L12, doi:10.1086/187670.
- Hui (1999) L. Hui, Recovery of the Shape of the Mass Power Spectrum from the Ly Forest, ApJ 516 (1999) 519–526, doi:10.1086/307134.
- Viel et al. (2013) M. Viel, G. D. Becker, J. S. Bolton, M. G. Haehnelt, Warm dark matter as a solution to the small scale crisis: New constraints from high redshift Lyman- forest data, Phys. Rev. D 88 (4) 043502, doi:10.1103/PhysRevD.88.043502.
- Yèche et al. (2017) C. Yèche, N. Palanque-Delabrouille, J. Baur, H. du Mas des Bourboux, Constraints on neutrino masses from Lyman-alpha forest power spectrum with BOSS and XQ-100, J. Cosmology Astropart. Phys 6 047, doi:10.1088/1475-7516/2017/06/047.
- Ferrarese (2002) L. Ferrarese, Beyond the Bulge: A Fundamental Relation between Supermassive Black Holes and Dark Matter Halos, ApJ 578 (2002) 90–97, doi:10.1086/342308.
- Kormendy and Bender (2011) J. Kormendy, R. Bender, Supermassive black holes do not correlate with dark matter haloes of galaxies, Nature 469 (2011) 377–380, doi:10.1038/nature09695.
- Bogdán and Goulding (2015) Á. Bogdán, A. D. Goulding, Connecting Dark Matter Halos with the Galaxy Center and the Supermassive Black Hole, ApJ 800 124, doi:10.1088/0004-637X/800/2/124.
- Boyarsky et al. (2009) A. Boyarsky, O. Ruchayskiy, D. Iakubovskyi, A. V. Maccio’, D. Malyshev, New evidence for dark matter, ArXiv: 0911.1774 .
- Chavanis (2004) P.-H. Chavanis, Generalized thermodynamics and kinetic equations: Boltzmann, Landau, Kramers and Smoluchowski, Physica A Statistical Mechanics and its Applications 332 (2004) 89–122, doi:10.1016/j.physa.2003.09.061.
- Sofue (2013) Y. Sofue, Rotation Curve and Mass Distribution in the Galactic Center - From Black Hole to Entire Galaxy, PASJ 65 (2013) 118, doi:10.1093/pasj/65.6.118.
- Walker et al. (2009) M. G. Walker, M. Mateo, E. W. Olszewski, J. Peñarrubia, N. Wyn Evans, G. Gilmore, A Universal Mass Profile for Dwarf Spheroidal Galaxies?, ApJ 704 (2009) 1274–1287, doi:10.1088/0004-637X/704/2/1274.
- Bullock and Boylan-Kolchin (2017) J. S. Bullock, M. Boylan-Kolchin, Small-Scale Challenges to the CDM Paradigm, ARA&A 55 (2017) 343–387, doi:10.1146/annurev-astro-091916-055313.
- de Blok et al. (2008) W. J. G. de Blok, F. Walter, E. Brinks, C. Trachternach, S.-H. Oh, R. C. Kennicutt, Jr., High-Resolution Rotation Curves and Galaxy Mass Models from THINGS, AJ 136 2648-2719, doi:10.1088/0004-6256/136/6/2648.
- Hoekstra et al. (2005) H. Hoekstra, B. C. Hsieh, H. K. C. Yee, H. Lin, M. D. Gladders, Virial Masses and the Baryon Fraction in Galaxies, ApJ 635 (2005) 73–85, doi:10.1086/496913.
- Romanowsky and Kochanek (2001) A. J. Romanowsky, C. S. Kochanek, Dynamics of Stars and Globular Clusters in M87, ApJ 553 (2001) 722–732, doi:10.1086/320947.
- Nulsen and Bohringer (1995) P. E. J. Nulsen, H. Bohringer, A ROSAT determination of the mass of the central Virgo Cluster, MNRAS 274 (1995) 1093–1106, doi:10.1093/mnras/274.4.1093.
- Newman et al. (2013) A. B. Newman, T. Treu, R. S. Ellis, D. J. Sand, The Density Profiles of Massive, Relaxed Galaxy Clusters. II. Separating Luminous and Dark Matter in Cluster Cores, ApJ 765 25, doi:10.1088/0004-637X/765/1/25.
- Zhao (1996) H. Zhao, Analytical models for galactic nuclei, MNRAS 278 (1996) 488–496, doi:10.1093/mnras/278.2.488.
- Lelli et al. (2016) F. Lelli, S. S. McGaugh, J. M. Schombert, SPARC: Mass Models for 175 Disk Galaxies with Spitzer Photometry and Accurate Rotation Curves, AJ 152 157, doi:10.3847/0004-6256/152/6/157.
- Anderson (1929) W. Anderson, Über die Grenzdichte der Materie und der Energie, Zeitschrift fur Physik 56 (1929) 851–856, doi:10.1007/BF01340146.
- Stoner (1930) E. Stoner, The Equilibrium of Dense Stars, The London, Edinburgh, and Dublin Philosophical Magazine and Journal of Science: Series 7, Volume 9, Issue 60, p. 944-963 9 (1930) 944–963.
- Chandrasekhar (1931a) S. Chandrasekhar, The Maximum Mass of Ideal White Dwarfs, ApJ 74 (1931a) 81, doi:10.1086/143324.
- Chandrasekhar (1931b) S. Chandrasekhar, The highly collapsed configurations of a stellar mass, MNRAS 91 (1931b) 456–466, doi:10.1093/mnras/91.5.456.
- Landau (1932) L. D. Landau, To the Stars theory, Phys. Zs. Sowjet., vol.1, p.285, 1932 (English and German) 1 (1932) 285.
- Oppenheimer and Volkoff (1939) J. R. Oppenheimer, G. M. Volkoff, On Massive Neutron Cores, Physical Review 55 (1939) 374–381, doi:10.1103/PhysRev.55.374.
- Rhoades and Ruffini (1974) C. E. Rhoades, R. Ruffini, Maximum Mass of a Neutron Star, Physical Review Letters 32 (1974) 324–327, doi:10.1103/PhysRevLett.32.324.
- Wagoner and Malone (1974) R. V. Wagoner, R. C. Malone, Post-Newtonian Neutron Stars, ApJ 189 (1974) L75, doi:10.1086/181468.
- Ciufolini and Ruffini (1981) I. Ciufolini, R. Ruffini, On the value of the masses of neutron stars in the parameterized POST Newtonian formalism, A&A 97 (1981) L12–L14.
- Shapiro and Teukolsky (1983) S. L. Shapiro, S. A. Teukolsky, Black holes, white dwarfs, and neutron stars: The physics of compact objects, Wiley, 1983.
- Irwin and Hatzidimitriou (1995) M. Irwin, D. Hatzidimitriou, Structural parameters for the Galactic dwarf spheroidals, MNRAS 277 (1995) 1354–1378, doi:10.1093/mnras/277.4.1354.
- Karachentsev et al. (2004) I. D. Karachentsev, V. E. Karachentseva, W. K. Huchtmeier, D. I. Makarov, A Catalog of Neighboring Galaxies, AJ 127 (2004) 2031–2068, doi:10.1086/382905.
- Wing and Blanton (2013) J. D. Wing, E. L. Blanton, An Examination of the Optical Substructure of Galaxy Clusters Hosting Radio Sources, ApJ 767 102, doi:10.1088/0004-637X/767/2/102.
- Seth et al. (2014) A. C. Seth, R. van den Bosch, S. Mieske, H. Baumgardt, M. D. Brok, J. Strader, N. Neumayer, I. Chilingarian, M. Hilker, R. McDermid, L. Spitler, J. Brodie, M. J. Frank, J. L. Walsh, A supermassive black hole in an ultra-compact dwarf galaxy, Nature 513 (2014) 398–400, doi:10.1038/nature13762.
- Ahn et al. (2017) C. P. Ahn, A. C. Seth, M. den Brok, J. Strader, H. Baumgardt, R. van den Bosch, I. Chilingarian, M. Frank, M. Hilker, R. McDermid, S. Mieske, A. J. Romanowsky, L. Spitler, J. Brodie, N. Neumayer, J. L. Walsh, Detection of Supermassive Black Holes in Two Virgo Ultracompact Dwarf Galaxies, ApJ 839 72, doi:10.3847/1538-4357/aa6972.
- Ahn et al. (2018) C. P. Ahn, A. C. Seth, M. Cappellari, D. Krajnović, J. Strader, K. T. Voggel, J. L. Walsh, A. Bahramian, H. Baumgardt, J. Brodie, I. Chilingarian, L. Chomiuk, M. den Brok, M. Frank, M. Hilker, R. M. McDermid, S. Mieske, N. Neumayer, D. D. Nguyen, R. Pechetti, A. J. Romanowsky, L. Spitler, The Black Hole in the Most Massive Ultracompact Dwarf Galaxy M59-UCD3, ApJ 858 102, doi:10.3847/1538-4357/aabc57.
- Afanasiev et al. (2018) A. V. Afanasiev, I. V. Chilingarian, S. Mieske, K. T. Voggel, A. Picotti, M. Hilker, A. Seth, N. Neumayer, M. Frank, A. J. Romanowsky, G. Hau, H. Baumgardt, C. Ahn, J. Strader, M. den Brok, R. McDermid, L. Spitler, J. Brodie, J. L. Walsh, A 3.5 million Solar masses black hole in the centre of the ultracompact dwarf galaxy fornax UCD3, MNRAS 477 (2018) 4856–4865, doi:10.1093/mnras/sty913.
- Kızıltan et al. (2017) B. Kızıltan, H. Baumgardt, A. Loeb, An intermediate-mass black hole in the centre of the globular cluster 47 Tucanae, Nature 542 (2017) 203–205, doi:10.1038/nature21361.
- Perera et al. (2017) B. B. P. Perera, B. W. Stappers, A. G. Lyne, C. G. Bassa, I. Cognard, L. Guillemot, M. Kramer, G. Theureau, G. Desvignes, Evidence for an intermediate-mass black hole in the globular cluster NGC 6624, MNRAS 468 (2017) 2114–2127, doi:10.1093/mnras/stx501.
- Ferrarese and Merritt (2000) L. Ferrarese, D. Merritt, A Fundamental Relation between Supermassive Black Holes and Their Host Galaxies, ApJ 539 (2000) L9–L12, doi:10.1086/312838.
- Gebhardt et al. (2000) K. Gebhardt, R. Bender, G. Bower, A. Dressler, S. M. Faber, A. V. Filippenko, R. Green, C. Grillmair, L. C. Ho, J. Kormendy, T. R. Lauer, J. Magorrian, J. Pinkney, D. Richstone, S. Tremaine, A Relationship between Nuclear Black Hole Mass and Galaxy Velocity Dispersion, ApJ 539 (2000) L13–L16, doi:10.1086/312840.
- Gültekin et al. (2009) K. Gültekin, D. O. Richstone, K. Gebhardt, T. R. Lauer, S. Tremaine, M. C. Aller, R. Bender, A. Dressler, S. M. Faber, A. V. Filippenko, R. Green, L. C. Ho, J. Kormendy, J. Magorrian, J. Pinkney, C. Siopis, The M- and M-L Relations in Galactic Bulges, and Determinations of Their Intrinsic Scatter, ApJ 698 (2009) 198–221, doi:10.1088/0004-637X/698/1/198.
- Valluri et al. (2005) M. Valluri, L. Ferrarese, D. Merritt, C. L. Joseph, The Low End of the Supermassive Black Hole Mass Function: Constraining the Mass of a Nuclear Black Hole in NGC 205 via Stellar Kinematics, ApJ 628 (2005) 137–152, doi:10.1086/430752.
- Greene et al. (2010) J. E. Greene, C. Y. Peng, M. Kim, C.-Y. Kuo, J. A. Braatz, C. M. V. Impellizzeri, J. J. Condon, K. Y. Lo, C. Henkel, M. J. Reid, Precise Black Hole Masses from Megamaser Disks: Black Hole-Bulge Relations at Low Mass, ApJ 721 (2010) 26–45, doi:10.1088/0004-637X/721/1/26.
- Marsh and Silk (2014) D. J. E. Marsh, J. Silk, A model for halo formation with axion mixed dark matter, MNRAS 437 (2014) 2652–2663, doi:10.1093/mnras/stt2079.
- Armengaud et al. (2017) E. Armengaud, N. Palanque-Delabrouille, C. Yèche, D. J. E. Marsh, J. Baur, Constraining the mass of light bosonic dark matter using SDSS Lyman- forest, MNRAS 471 (2017) 4606–4614, doi:10.1093/mnras/stx1870.
- Chavanis et al. (2015) P.-H. Chavanis, M. Lemou, F. Méhats, Models of dark matter halos based on statistical mechanics: The fermionic King model, Phys. Rev. D 92 (12) 123527, doi:10.1103/PhysRevD.92.123527.
- Strigari et al. (2008) L. E. Strigari, J. S. Bullock, M. Kaplinghat, J. D. Simon, M. Geha, B. Willman, M. G. Walker, A common mass scale for satellite galaxies of the Milky Way, Nature 454 (2008) 1096–1097, doi:10.1038/nature07222.