Mildly Suppressed Star Formation in Central Regions of MaNGA Seyfert Galaxies
Abstract
Negative feedback from accretion onto super-massive black holes (SMBHs), that is to remove gas and suppress star formation in galaxies, has been widely suggested. However, for Seyfert galaxies which harbor less active, moderately accreting SMBHs in the local universe, the feedback capability of their black hole activity is elusive. We present spatially-resolved H measurements to trace ongoing star formation in Seyfert galaxies and compare their specific star formation rate with a sample of star-forming galaxies whose global galaxy properties are controlled to be the same as the Seyferts. From the comparison we find that the star formation rates within central kpc of Seyfert galaxies are mildly suppressed as compared to the matched normal star forming galaxies. This suggests that the feedback of moderate SMBH accretion could, to some extent, regulate the ongoing star formation in these intermediate to late type galaxies under secular evolution.
keywords:
galaxies: evolution – galaxies: active – galaxies: star formation1 Introduction
Super-massive black-holes (SMBHs) reside at centers of almost all massive galaxies(Kormendy & Ho, 2013).The accretion onto SMBHs, which powers phenomena known as active galactic nuclei(AGN), is suggested to play key roles in driving galaxy evolution by depositing accretion energy into the interstellar medium(ISM) in AGN host galaxies to regulate star formation(King, 2003; Springel, 2005; Hopkins et al., 2006). The feedback could be in forms of removing gas from the central part of host galaxies by fast multiphase outflows(Maiolino et al., 2012; Cano-Díaz et al., 2012; Cicone et al., 2014; Carniani et al., 2016), or heating the gas within and surrounding the host galaxies by radio jets(Forman et al., 2007; Fabian, 2012). Observations have found the former case in luminous quasars associated with major mergers, while evidence for the latter case mainly comes from radio-loud AGNs reside in massive red elliptical galaxies.
Although AGNs with moderate SMBH accretion (Seyfert galaxies) are much more numerous, their capability of feedback is unclear. It is still unknown if the SMBH’s feedback in Seyferts is necessary in re-producing the SMBH-bulge relationships because bulges form through the major merging while Seyfert galaxies are mostly blue and disk dominated spirals in secular evolution (Hopkins et al., 2006; Kormendy & Ho, 2013; Heckman & Best, 2014). This is in contrast to the case for massive red radio galaxies with elliptical morphology and the remnants of major merging(Springel, 2005; Cheung et al., 2016), and luminous quasars that are associated with ongoing major merging (Springel, 2005; Hopkins et al., 2006). Although outflows of ionized gas are seen in Seyfert galaxies, the observed low outflow rates indicate that they could be driven by the nuclear star formation itself(Harrison et al., 2014; Ho et al., 2014; Wild et al., 2014; López-Cobá et al., 2017a). Some recent spatially-resolved studies of a handful nearby Seyferts reveal the existence of fast outflows of ionized or dense molecular gas associated with radio jets but their impacts on star formation are unclear(Christensen et al., 2006; Krause et al., 2007; Wang et al., 2012; García-Burillo et al., 2014; Morganti et al., 2015; Querejeta et al., 2016; López-Cobá et al., 2017b).
Observationally it is a big challenge to conclude whether AGN’s feedback could regulate star formation or not, and how it regulates star formation. On one hand, if strong outflows emerge, they could clear out the star-forming gas to suppress star formation (Alexander & Hickox, 2012; García-Burillo et al., 2014; Alatalo et al., 2015; Hopkins et al., 2016; Wylezalek & Zakamska, 2016). The heating by jets propagating through the galaxies could prevent gas from cooling and cutoff the gas supply for further star formation(Karouzos et al., 2014; Choi et al., 2015). On the other hand, the outflows and jets interact with the gas in host galaxies and compress it to trigger new star formation (Zubovas et al., 2013; Silk, 2013; Zubovas & Bourne, 2017). In fact observations show either no or positive relationships between star formation rates and SMBH accretion rates but no negative trends are seen (Shi et al., 2007, 2009; Baum et al., 2010; Xu et al., 2015; Zhang et al., 2016; Mallmann et al., 2018). Whether AGN’s feedback plays the role may also depends on the spatial scale that observations could resolve and timescale that the observed tracers could probe(Harrison et al., 2012; Feruglio et al., 2015; Cresci et al., 2015). For example, radiation from AGNs nearly instantaneously impact the surrounding ISM while the attenuation from ISM probably limits their impact to the nuclear regions (Roos et al., 2015). Outflow or jets travels slowly and may be decelerated after interactions with ambient gas, which delays their effects on star formation at large distances from the nuclei (Harrison, 2017; Harrison et al., 2018). Feedback by jets or outflows on ISM also depends on their orientation relative to the dusty torus, making their effects on star formation to be anisotropic. The short duty cycle of AGNs could also make feedback by radiation from AGNs temporally variable in strength. Case studies of individual AGNs find evidence of coexistence of positive and negative feedback on star formation(Zinn et al., 2013), suggesting the complicated nature of AGN feedback.
The availability of spatially-resolved spectra as enabled by integral field unit (IFU) observations offers a new opportunity to investigate the possible effects of AGN’s feedback on star formation. These data allow measurements of a range of host galaxy properties in details including the star formation rate, stellar mass, stellar population, and metallicity at kpc scales or smaller and relate them to the AGN activities (Davies et al., 2007; Dumas et al., 2007; Riffel et al., 2011; Wylezalek et al., 2017; Riffel et al., 2017; Sánchez et al., 2018). Especially, a large IFU-observed sample of nearby galaxies from on-going SDSS-IV MaNGA (Bundy et al., 2015) offers the opportunity to statistically explore relationships between AGN and star formation at kpc scales. In this study we present studies of spatially-resolved star formation activities of nearby Seyfert galaxies and comparisons with a control sample of normal star-forming galaxies. Only with the large number of galaxies observed by MaNGA can we construct such a control sample that all physical parameters that may affect star formation are controlled. In Section 2, we describe the basic information of MaNGA data, the selection of AGN and control samples and the procedures of measuring the intensity of spatial resolved star formation. The difference in spatially-resolved SFRs between MaNGA AGNs and their comparison samples of normal galaxies are shown in section 3. We discuss the possible implications of our results in the context of galaxy evolution in section 4. A flat CDM cosmology with =0.692, =0.308 and =67.8 km/s/Mpc is assumed throughout this study.
2 Data and Methods.
2.1 MaNGA Data
We analyzed a large sample of 4756 galaxies with spatially-resolved integral field unit (IFU) observations carried out by the program of Mapping Nearby Galaxies at Apache Point Observatory (MaNGA) (Bundy et al., 2015; Yan et al., 2016b). MaNGA is an ongoing integral field unit(IFU) survey to acquire spatially resolved spectra of nearby 10000 galaxies from 2014 to 2020 (Bundy et al., 2015; Drory et al., 2015; Law et al., 2015; Yan et al., 2016b; Yan et al., 2016a; Blanton et al., 2017), with the Sloan Digital Sky Survey (SDSS) 2.5m telescope (Gunn et al., 2006) and the Baryon Oscillation Spectroscopic Survey (BOSS) spectrograph(Smee et al., 2013; Drory et al., 2015). MaNGA galaxies have a flat distribution in the stellar mass above 109 M⊙ and are composed of two sub-samples with different radial coverage: a primary sub-sample of about 70% galaxies (=0.03) with a coverage to 1.5 effective radii() and a secondary sub-sample of about 30% galaxies (=0.04) with a coverage to 2.5 . The spectrum covers a wavelength range from 3600 to 10300 Å with a velocity resolution of 65 km/s. The spatial resolution is about 2.5”. The S/N at band is about 4-8 Å -1 at the edge of the radial coverage.
The raw data were reduced, calibrated and reconstructed to a data cube by the Data Reduction Pipeline (DRP) (Law et al., 2016). The Pipe3D (Sánchez et al., 2016a, b) was applied to the data cube to measure the continuum and associated physical qualities. Both Pipe3D and MaNGA Data Analysis Pipeline(DAP) (Westfall et al. in prep) provide measurements on emission line fluxes that we used in sample selection and star formation rate calculation. These measurements were available in the internal MaNGA Product Launch currently at version 6 (MPL_6). These IFU spectra will be released in the coming SDSS DR15.
2.2 The selection of AGN with star-forming disks
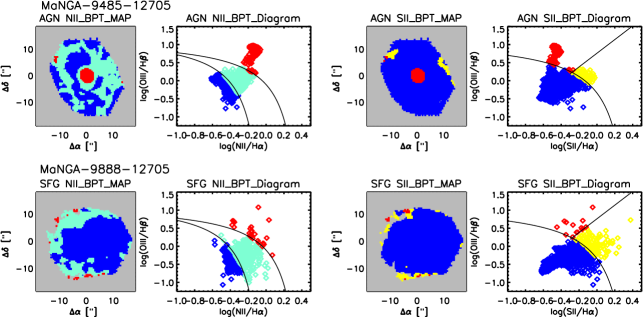
For each MaNGA galaxy, we first constructed the spatially-resolved BPT diagram (both NII-BPT and SII-BPT) to classify them into star-forming, composite and AGN (also LINER) according to the dividing lines in the literature (Baldwin et al., 1981; Kauffmann et al., 2003; Kewley et al., 2001, 2006). We used all spaxels with S/N of H, H, [OIII] 5007Å and [NII] 6584Å (or [SII] 6717/6731Å ) larger than 2 measured by MaNGA DAP using the pure emission line spectrum. A galaxy is classified as an AGN as long as the emission from the central spaxel of the MaNGA datacube has [NII]/H, [SII]/H and [OIII]/H line ratios that satisfy: 1. either the composite or the AGN definition in the [NII]/H BPT diagram. 2. the AGN or LINER definition in the [SII]/H BPT-diagram. We also required the equivalent width of H emission() at the central spaxel to be larger than 3Å , which rejects galaxies with weak emission lines powered by evolved stars (Stasińska et al., 2008; Cid Fernandes et al., 2010; Yan & Blanton, 2012; Belfiore et al., 2016). Spaxels classified as ’star formation’ are further required to have Å as suggested by previous studies (Sánchez et al., 2014). We then selected AGN with star-forming disks as those objects with AGN present at galaxy centers and star formation in the outer regions to investigate the effects of AGN’s feedback on star formation. Quantitatively, we required that more than half of spaxels within 1.0-1.5 should be filled by star formation spaxels, as we need the sSFR at this radial bin to be properly measured to constrain the same parameter in control galaxies to be the same(see section 2.4 for details). Edge-on galaxies with minor/major axis ratio in NSA catalog 0.35 (Blanton et al., 2011) are excluded to eliminate the additional smearing of the light from adjacent radial bins at high inclinations. A total of 56 AGNs are selected under these criteria and an example is shown in Fig. 1.
2.3 The selection bias of the AGN sample
Because the line emission at the center are contributed not only by the AGN narrow line region but also by star formation, the BPT diagram misses AGN with high central SFRs. We performed a test to qualify this bias in our sample selection, following the spirit of related methods applied in previous studies (Kauffmann & Heckman, 2009; Trump et al., 2015; Davies et al., 2016). We generated simulated AGNs of different [OIII] luminosities by adding PSF-convolved point source emission to the emission line maps of pure star-forming galaxies. Given a AGN [OIII] luminosity, the point source emission of different emission lines is calculated as following:
(1) For [OIII] 5007Å itself, the AGN’s contribution is from randomly selected AGN after the dusty extinction based on the central Balmer decrement (Osterbrock & Ferland, 2006) and PSF convolution at -band available in the MaNGA DRP.
(2) For H, the AGN’s contribution is calculated by the above AGN [OIII] 5007Å flux multiplied with a [OIII] 5007Å /H flux ratio. We fixed this ratio to 10 in our simulation, while varying it to other values does not significantly change our result.
(3) For H, the AGN’s contribution is calculated by the above H flux multiplied with the observed Balmer decrement.
(4) For [NII] 6584Å and [SII] 6717Å +6731Å , the AGN’s contribution is measured by the above H flux multiplied by a representative [NII] 6584Å /H or ([SII] 6717Å +6731Å )/H flux ratio. We fixed these two ratios to the average values of all selected AGN.
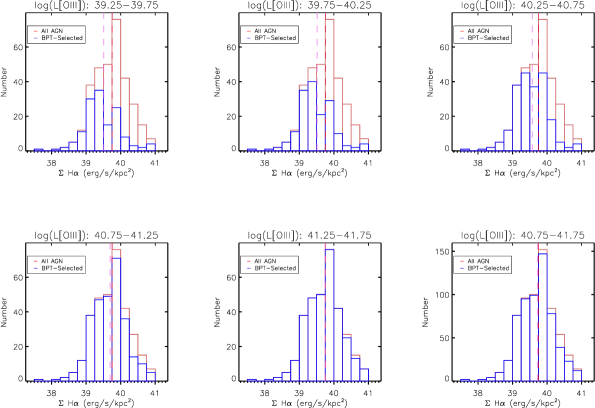
A uniform distribution in the logarithmic [OIII] luminosity is applied in the simulation. In total five luminosity bins were used to cover the range from to erg/s. With this simulated AGN sample, we then defined those that satisfied the BPT criteria as the BPT-selected AGN. Within a [OIII] luminosity bin, we measured the central (after attenuation correction) of the BPT-selected AGN and compared to the central of all AGN. Fig. 2 shows the distributions of extinction corrected of all simulated AGNs and BPT-selected AGNs. The figure clearly shows lower in BPT-selected AGNs when the AGN [OIII] luminosities drop below certain values. It also indicates that the above selection bias becomes less significant in luminous AGNs with the [OIII] luminosity above 71040 ergs/s. We thus restricted our AGN sample to be above this luminosity in order to avoid the bias toward selecting AGN with low central SFRs. After applying this luminosity constraint we got a final AGN sample with 14 objects in total.
2.4 The selection of the comparision sample of pure star-forming galaxies for each AGN.
To determine whether the influence on star formation happens in Seyfert galaxies, a well defined comparison sample of pure star-forming galaxies without SMBH accretion is needed so that all parameters that affect star formation are controlled to be the same as Seyfert galaxies. We considered six control parameters, including the total stellar mass, the presence/absence of the bar structures, the bulge-to-disk ratio, the stellar mass surface density at 1.5, the sSFR at 1.5 and the central stellar mass surface density in defining the control galaxies for each AGN from these pre-selected galaxies with the following quantitative criteria:
(1) The difference of the total stellar mass between each AGN and its comparison galaxies to be within log()0.3: the galaxy stellar mass controls the overall global galaxy properties to exclude any stellar-mass-dependent effects on the SFRs (Shi et al., 2011, 2018), such as the galaxy metallicity (Shi et al., 2014) and the total SFRs (Brinchmann et al., 2004). The stellar mass measurement was taken from the GALEX-SDSS-WISE legacy catalog (Salim et al., 2016) based on the UV-optical SED fitting. For galaxies without measurement in Salim et al. (2016), we turned to stellar mass measurement in SDSS+WISE MAGPHYS output catalog (Chang et al., 2015). Stellar masses from these two studies are consistent with each other over the mass range of MaNGA samples(within 0.2dex, see section 8 in Salim et al. (2016)).
(2) The strength of the bar structures: bars could enhance star formation in the central regions of galaxies (Kennicutt et al., 1994). We required the difference of the debiased vote fraction of ”the existence of bar” from the Galaxy Zoo 2 between each AGN and its comparison galaxies to be lower than 0.25. (Willett et al., 2013).
(3) The difference in bulge-to-disk ratio between each AGN and its comparison galaxies to be within . Star formation in bulges is generally lower than in disks. The bulge-to-disk ratio thus relates to the relative level of star forming activity in the inner parts of galaxies as compared to the outer parts. The bulge-to-disk ratio is based on the -band decomposition of the SDSS images (Simard et al., 2011). For galaxies without B/T measurement in Simard’s catalog, we use the fracDev parameter in band from SDSS DR12 photometric catalog(Alam et al., 2015) as an alternative control parameter on the bulge-to-disk ratio. Only one of these two parameters is used in the selection of comparison galaxies to a specific sample galaxy.
(4-5) At 1.5 , the difference of the stellar mass surface density between each AGN and its comparison galaxies to be within 0.3 dex(log 0.3 dex) and the difference of sSFR between each AGN and its comparison galaxies to be within 0.3 dex (log(sSFR)0.3). These two constraints ensure the AGN and comparison galaxies to have the same levels of disk star formation as characterized by the SFRs and sSFRs. With the MaNGA-produced H maps, we can make consistent measurements of the disk SFRs for all objects. In addition, by fixing the star formation level at 1.5 Re, we can assure any difference in the inner region is due to the central activity instead of the global offset. These qualities are measured by data products in MaNGA .
Here we did not control the global SFRs because: 1. The SFR measurements using MaNGA data only are also not consistent because the coverage of IFU bundle to different galaxies varies(Bundy et al., 2015; Wake et al., 2017). 2. The total SFR is not consistently measured for the MaNGA galaxies. The SFR derived by Salim et al. (2016) and Chang et al. (2015) are not well compatible with each other at lower sSFRs. 3. The inner SFR/sSFR that also contributes to the total SFR of galaxy is the quality we want to compare between the AGNs and comparison galaxies.
(6) The difference in central stellar mass surface density between each AGN and its comparison galaxies to be within 0.5 dex: this quantity could further constrain the central structure (Fang et al., 2013), and avoid the effect of any spatially-resolved SFR/stellar-mass relationship on the central star formation.
2.5 The Measurements Of Spatially Resolved sSFRs
With the selection of AGN with star-forming disks and comparison star-forming galaxies, we then carried out measurements of the spatial-resolved specific star formation rate (sSFR). Here the specific star formation rate refers to the star formation rate divided by the stellar mass, which qualifies the current stellar mass growth rate. We used the attenuation corrected H flux map to estimate the spatial-resolved SFR (Kennicutt, 1998). The stellar mass surface density of MaNGA galaxies are measured using Pipe3D(Sánchez et al., 2016a, b). A Salpeter initial mass function is assumed. Attenuation correction applied to H flux assumed the case B Balmer decrement(H/H=2.87) and the extinction law of Calzetti (2001).
For the central part of the AGN where the emission comes from both SMBH accretion and star formation, we tried to estimate the SFRs through decomposition. The contribution from star formation in the Balmer emission line could be derived if the intrinsic [OIII]/H line ratio of AGN emission is known. The observed [OIII] 5007Å and H emission line flux in the central region of these 14 type 2 AGNs could be contributed by both star formation and AGN narrow line region, thus the [OIII]/H ratio could be expressed as Eq 1
| (1) |
The right part of the Eq.1 could also be written in forms of line ratios of star formation and AGN narrow line region.
| (2) |
The superscripts tell the origin of the emission lines(AGN, star forming region or the observed total emission line flux). The total emission line flux and their line ratio are observables that could be derived directly from MaNGA data while the line ratio at AGN NLR and need to be determined with other information(see the following paragraph and Section 4.1 for the discussion). Then the contribution of star formation in Balmer emission line could be derived based on the observed [OIII]/H line ratio using the Eq 3 with assumptions on the [OIII]/H line ratio of AGN and star formation base spectra. From Eq 3 we could express the at the end of Eq 2 as:
| (3) |
The [OIII]/H value for pure star formation in Eq 3 are determined for each galaxy individually, as it is sensitive to the metallicity(Maiolino et al., 2008). We measured the average of [OIII]/H in different radial bins with a width of 0.1Re, among which the lowest value is used as the ([OIII]/H) of pure star formation. For the pure AGN line ratio, we applied log([OIII]/H)=1.0 with a error of 0.2. This brackets two cases: the value of log([OIII]/H)=0.8 has previously been used in a similar analysis by Kauffmann & Heckman (2009), and a value of log([OIII]/H)=1.2 is similar to the value of the upper bound of all SDSS AGN and also the maximum of our selected AGNs. The uncertainties of log([OIII]/H) value in AGN region is the major source of error in the estimation central SFR( 0.2-0.3dex), while the high S/N of MaNGA spectra makes contribution of measurement error of emission line flux to be minimal in this process.
3 Results
3.1 Properties of AGNs and their Host Galaxies
The general properties of 14 AGNs and their host galaxies are listed in Table 1. We derived the [OIII] luminosity from the reduced MaNGA datacube. The lower and upper limit of are calculated from the integrated [OIII] flux within central 2" and that of all regions classified as composite or AGN/LINER in BPT diagram. We collected the total SFR and total stellar mass of each galaxy from large multi-wavelength value-added catalogs of (Salim et al., 2016; Chang et al., 2015). Our AGN sample have luminosities that are typical of Seyfert galaxies and most of their host galaxies have late type morphology and high stellar masses(). We also crossmatched our sample with the FIRST Survey Catalog(Helfand et al., 2015) to obtain their properties in radio emission. Seven out of fourteen AGNs in our sample have FIRST detection with S/N>5. Three of them have 1.4GHz luminosity higher than the prediction of their total SFRs by more than 0.5dex using converting factor from Kennicutt & Evans (2012), which probably suggests the existence of radio jet or outflows(Ho, 2008; Zakamska et al., 2016; Hwang et al., 2018).
| MaNGA Plate-IFU | z | ||||||
| 0.0631 | 0.454 | 11.06 | |||||
| 0.0373 | 1.291 | 10.63 | |||||
| 0.0543 | N/A | 11.36 | |||||
| 0.0722 | 0.548 | 11.25 | |||||
| 0.0304 | N/A | 10.90 | |||||
| 0.0633 | 0.367 | 11.39 | |||||
| 0.0499 | 0.262 | 10.86 | |||||
| 0.0389 | 0.377 | 10.71 | |||||
| 0.0586 | 1.052 | 11.27 | |||||
| 0.0875 | 0.739 | 11.31 | |||||
| 0.0688 | 0.608 | 11.21 | |||||
| 0.0819 | 1.201 | 11.37 | |||||
| 0.0323 | 11.05 | ||||||
| 0.0809 | N/A | 11.37 | |||||
| Notes: a In . b In . c In . d Radio luminosity exceeds the prediction of star formation. | |||||||
| e Blob source in (Wylezalek et al., 2017) f Identified as MIR AGN, likely overestimated. | |||||||
| References: (1) This Work; (2) Salim et al. (2016); (3) Chang et al. (2015); (4) Helfand et al. (2015); | |||||||
3.2 Star Formation in AGN Host Galaxies
| Radial Bin | log(sSFR) -0.00 | log(sSFR) -0.25 | log(sSFR) -0.50 |
|---|---|---|---|
| 0.0-0.3 | |||
| 0.3-0.6 |
| Radial Bin | P() < P() |
|---|---|
| 0.0-0.3 | 0.76% |
| 0.3-0.6 | 3.5% |
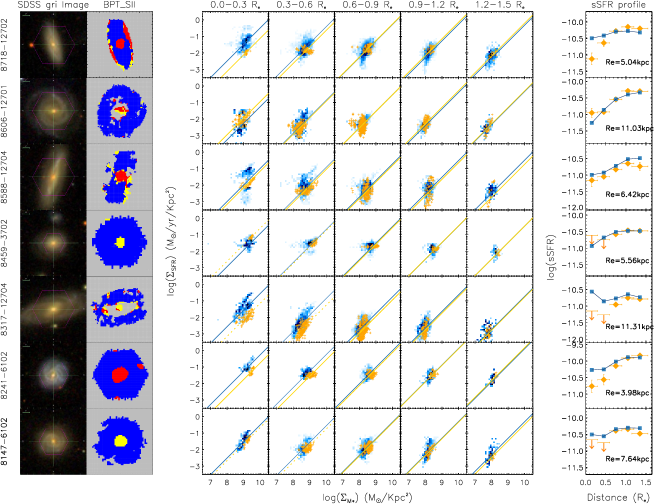
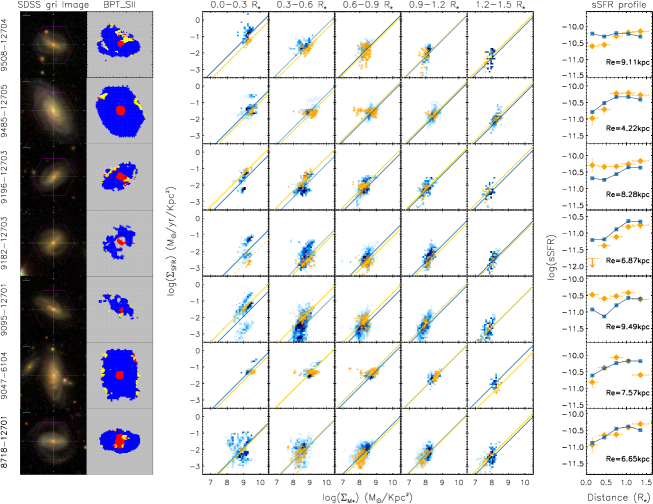
To compare the spatially-resolved sSFRs between AGNs and normal galaxies, we plotted the SFR surface density vs. stellar mass surface density () of all spaxels within five radial bins( 0.3 , 0.3-0.6 , 0.6-0.9 , 0.9-1.2 and 1.2-1.5 ) for each AGN and its comparison sample, respectively. Both quantities are corrected for the galaxy inclinations derived from the photometric axis ratio in NASA_Sloan Atlas (Blanton et al., 2011). The linear fitting to the relation between log() and log() in each radial bin was then performed for AGNs and comparison galaxies, respectively. With the slope fixed to a unity, the interceptions of the linear fitting give the sSFR in each radial bins. The log(sSFR) as a function of the galactocentric radii for each AGN and their comparison galaxies are shown in the final panel of each row in the Fig 3 and Fig 4. The relation between and is actually sub-linear as previous studies suggested(Sánchez et al., 2013; Cano-Díaz et al., 2016) However, the selection of the slope does not significantly affect the measured sSFR in each radial bins. We could derive similar sSFRs as the fitting method even when calculating the mean sSFR in each radial bins. The central sSFRs of LINERs are used as upper-limits given that they could have intrinsically lower [OIII]/H values than Seyferts, which causes an overestimate of their central SFRs in our analysis.
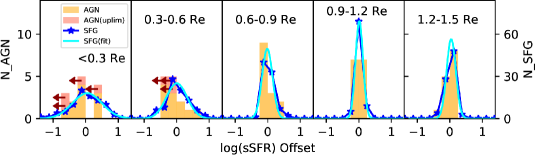
The distributions of the differences in the sSFRs (log(sSFR)) between AGN and their comparison normal galaxies are shown as filled histograms in Fig 5 for each radial bin. In the inner two bins (0.3 and 0.3-0.6), the offsets in sSFRs are systematically biased toward negative values, implying possible negative feedback. In outer radial bins (0.6-0.9, 0.9-1.2 & 1.2-1.5 ), log(sSFR) has a median value around zero, indicating that the star formation of AGN are not different from pure star-forming galaxies. As listed in Table 2, 10 out of 14 AGN have log(sSFR) 0.0 in the central bin, with 5 AGN below -0.25 and 3 AGN below -0.5.
To compute the statistical significance of these offsets, we drew a group of star-forming galaxy with matched physical properties of AGNs and measured their log(sSFR). We used the AGN comparison sample of 75 star-forming galaxies and for each of them we selected a control sample using the same methods as we did for the AGN sample. Then we measured log(sSFR) of each star-forming galaxy from its comparison star-formation galaxies. The star symbols in Fig 5 show the results. We fitted these distributions with Gaussian functions to derive the statistical probability as following: first to randomly draw 14 objects from the Gaussian distribution and then to compute the probability that more objects than the observed number have log(sSFR) 0.5, log(sSFR) 0.25, log(sSFR) 0.0, log(sSFR) -0.25 and log(sSFR) -0.5, e.g. for the central bin this require all 14 randomly selected galaxies with log(sSFR) 0.5, 10 galaxies with log(sSFR) 0.0, 10 AGN with log(sSFR) 0.0, 5 AGN with log(sSFR) -0.25 and 3 AGN with log(sSFR) -0.5. As listed in Table 3, the probability to produce the observed log(sSFR) distribution of the MaNGA Seyferts from star formation galaxies (P() < P()) is as low as 0.76% in the innermost bin and 3.5% in the second radial bin, supporting that the central regions of AGN most likely have suppressed SFRs.
4 Discussion
4.1 The Emission Line Flux Decomposition
Some assumptions are made about the decomposition of the central emission line fluxes. We consider the observed fluxes of central emission lines are the superposition of the emission from massive young stars and that from SMBH accretion. Under such assumption, a similar method has been applied to high spatial-resolution IFU spectra of some nearby galaxies (Davies et al., 2014; Davies et al., 2016). They decomposed the emission line by using the intrinsic spectra of different ionization mechanisms (star formation, AGN or shock). However, the poor spatial resolution of MaNGA data (about factor of 5 larger in the real physical scale per spaxel) causes significant blending between the emission from star-formation regions and AGN NLR regions, making it hard to find an central spaxel with purely star-formation region or AGN NLR emission. This dilution could be supported by the much lower maximum [OIII]/H line ratio in some MaNGA AGNs compared to that in high-spatial resolution IFU data(Davies et al., 2016) and to the largest values of all SDSS samples (e.g. Brinchmann et al. (2004)). To overcome caveats due to our low spatial resolutions, we adopted fixed maximal line ratios of AGN, which, if any, causes the derived SFRs to be overestimated, thus strengthening our conclusions of suppresses central SFRs in AGN hosts.
Our decomposition method also assumes the same Balmer decrement for AGN NLRs narrow as star-forming HII regions. Previous studies of local AGNs have found that AGN NLRs do have similar dust extinctions to the HII regions in their host galaxies (Wild et al., 2011; Trump et al., 2015), which holds over a large range of obscuration. Since our AGN samples are also selected optically, it is unlikely that they have different internal dust extinction properties compare to AGNs in Wild et al. (2011); Trump et al. (2015). Significantly larger extinction in single HII region has been seen in the ENLR of Centaurs A from high resolution observations (Salomé et al., 2016). However, the derived young age makes this HII region an extreme among extragalactic HII regions. And the poor spatial resolution of the MaNGA fiber makes the observation only sensitive to kpc-scale average extinction, which is similar to studies of Wild et al. (2011); Trump et al. (2015). If we consider the higher intrinsic Balmer decrement in AGN dominated regions(Osterbrock & Ferland, 2006), the central star formation rate corrected by the case B value could be slightly overestimated, while this does not dramatically change the main results.
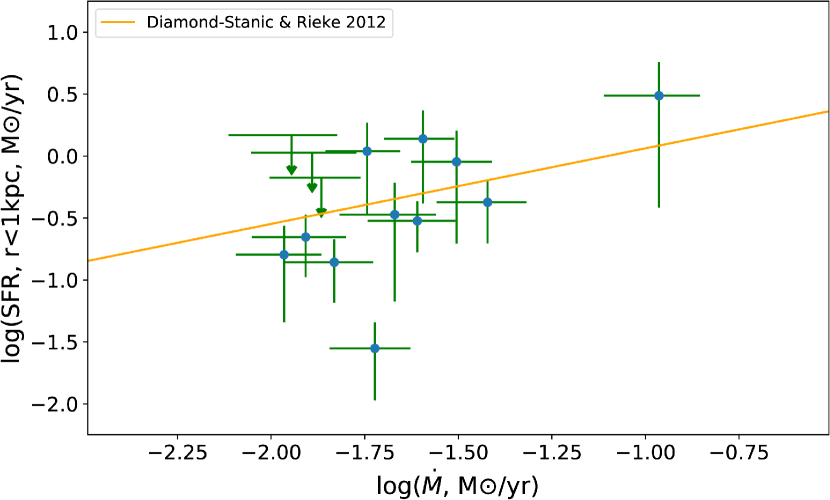
We examined the reliability of our SFR measurements of our AGN through the relation between central SFR and black hole accretion rate(BHAR) as found in Diamond-Stanic & Rieke (2012). They derived the SFRs using the mid-infrared aromatic features that are insensitive to the dust extinction and contamination by AGN. We used our decomposition method to derive the SFR within the same aperture () as in Diamond-Stanic & Rieke (2012) and the BHAR from the [OIII] luminosity (Kauffmann & Heckman, 2009) for all our 14 AGNs. As shown in Fig. 6, our derived SFRs and BHARs in general follows the relation as found by Diamond-Stanic & Rieke (2012), suggesting the reliability of our SFR measurements.
4.2 Implications of AGN feedback on Star Formation
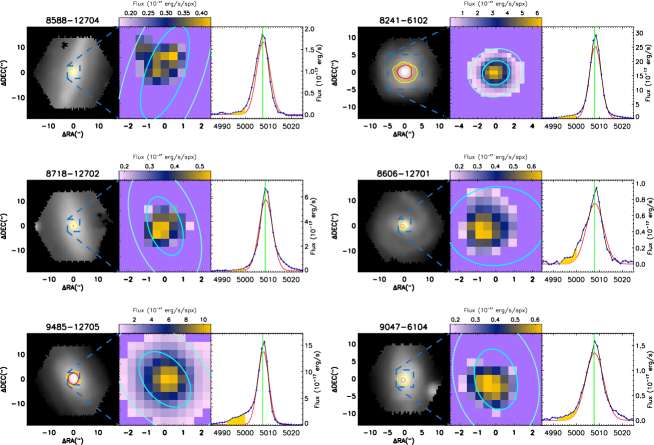
Based on the data of 14 AGNs, our analysis shows a marginal suppression of star formation within central few kpc. This result suggests moderate luminosity AGN could regulate the star formation in host galaxies. AGN outflows in ionized gas are detected in some of our samples by the residual flux at high velocity(in the range of blueshifted by 500-1000km/s) after subtracting the gaussian-fitted narrow emission line and stellar continuum from the spectra. Fig. 7 shows the distribution of outflow signals with S/N>3 per pixel for 6 of our sample. Most of these detected outflow are confined to the central few arc-seconds where suppressed star formation is identified. The small scale outflows could probably be more pervading in the sample than we identified, since the spatial resolution and low radial velocity of outflowing gas limit the detection rate under this coarse method(see Wylezalek et al. (2017) for an example, 8459-3702, which is also included in our sample)
It is possible that the outflows co-spatial with the low-SFR region cause the star formation suppression. However, in some cases the ability of ionized gas outflows to impact the central star formation is questioned, as they could only carry limited energy and momentum that is not likely to significantly influence the dense gas and the star formation therein(Balmaverde et al., 2016; Bae et al., 2017). In recent studies, more convincing evidence of AGN feedback on star formation has been revealed by the discovery of growing number of AGNs with outflows that could remove dense molecular gas within the central region of the host galaxies(Cicone et al., 2014; García-Burillo et al., 2014), which is more closely related to ongoing star formation in galaxies. However, single dish observations still find similar central molecular gas mass and gas fraction in local AGNs as compared normal galaxies whose stellar mass and morphology are controlled to be the same(Rosario et al., 2018), indicating that the outflow can not significantly impact the dense molecular gas content of the galaxies. This is consistent with our finding that central SFRs in AGNs are only mildly suppressed.
Besides the feedback by outflow, moderate to low luminosity AGNs could also impact the star formation by the kinetic energy carried in small scale jets(Guillard et al., 2015; Querejeta et al., 2016), which represent another probable paradigm of AGN feedback in Seyfert galaxies. Enhancement in turbulence caused by the interaction between outflows/jets with ambient gas could provide additional support against the self gravity, suppressing the collapse of gas clouds and star formation. For our samples, we find not all of our AGNs detected in radio continuum show lower sSFR in their centers. This might be caused by the small physical scale of regions affected by jets compare to MaNGA’s resolution. The gas distribution in general follow rotational disk of host galaxies, while the orientation of jets are not strongly correlated with the large scale angular momentum of galaxies. As a result the jets could interact with the dense molecular gas and probably impact the star formation in their host galaxies only when the jets are nearly coplanar with the disks and dense ISM is distributed along their path.
In our study we measured the star formation rate by H emission (Kennicutt & Evans, 2012) that trace short-lived (10 Myrs) O stars. Our optical selection of AGNs also only sensitive to SMBHs undergo active accretion of gas, which generally has a duration of years. (Haehnelt & Rees, 1993; Novak et al., 2011). Therefore our result reflects the impact of current AGN activity on the recent star formation in host galaxies. Literatures usually refers to this kind of feedback coherent with AGN activity as fast mode of feedback(Alexander & Hickox, 2012; Harrison et al., 2018; Cresci & Maiolino, 2018), where the radiation/outflow/jet released during the accretion of SMBHs directly impact the star formation. Fast mode feedback has been suggested to be responsible for the fast star formation quenching in major mergers triggering luminous quasars(Springel, 2005; Hopkins et al., 2006), which probably result in the massive non-active galaxies at higher redshift. Our results suggest that it probably also have mild impact on the star formation in local disk galaxies.
A growing number of studies supported a generally long quenching timescale in local quiescent galaxies(Schawinski et al., 2014; Peng et al., 2015; Belfiore et al., 2017; Sánchez et al., 2018). These studies pointed out that it is the gradual exhaustion of internal gas or(and) the secular growth of central bulges that contributes most to the galaxy quenching in local universe, which acts at timescales of around 1 Gyrs. Studies on the integrated colors of late type galaxies indicated that AGNs in these galaxies are in favor of more aged stellar population than galaxies that have just started quenching, which does not support a casual link between global quenching of late type galaxies and nuclear activities(Schawinski et al., 2010, 2014). However, it might be difficult for previous studies to search for spatially limited AGN feedback on star formation using integrated physical qualities of galaxies. Our discovery of marginally suppressed star formation within central kpc of MaNGA AGNs provide evidence that the fast removal/exhaustion of gas by AGN feedback could also act as an important process in the quenching of central part of secular evolved galaxies, in addition to the slower quenching process that has been widely suggested.
Alternative explanations to our finding such as the AGNs in favor of more aged stellar populations exceeding the lifetime of massive hot stars could also be plausible, which has been suggested by previous study like Norman & Scoville (1988); Davies et al. (2007). They suggest the slower stellar wind from aged stars could provide material more easily accreted by central black holes accretion. Recent studies has also revealed qualitatively similar overabundance of stellar population within the central 0.5 Re of some more luminous MaNGA AGNs(Rembold et al., 2017; Mallmann et al., 2018). However, comparing to our studies, these works either focus on stellar population at much smaller physical scales, or use a different controlling method in their comparison. In order to reveal if these results and our finding reflect different sides of interaction between AGN and central star formation in host galaxies, more detailed studies on the stellar population of current sample are needed.
5 Conclusion
We investigated the spatially-resolved star formation in 14 local Seyfert galaxies with the IFU observations by the SDSS-IV MaNGA survey. For each of 14 AGNs, we carefully selected a set of normal galaxies with the total stellar mass, bulge to disk ratio, central stellar mass surface density and specific star formation rate at 1.0-1.5 controlled to be the same.We derive the specific star formation rates of 14 Seyfert galaxies within 5 radial bins measured from IFU spectra and compared with those of the control sample. The comparison shows that the central radial bins of AGN have slightly lower SFRs with false-positive possibilities of 0.76% in the innermost 0.3Re and 3.5% within the 0.3-0.6Re. These low possibilities indicate marginally suppressed star formation within the central region of our AGNs. This may suggest that moderate SMBH accretion is capable of regulating star formation at the galaxy centers.
Acknowledgements
The authors thank Yifei Jin, Christy Tremonti and Renbin Yan for their valuable suggestions. L.B. and Y.S. acknowledge support from the National Key R&D Program of China (No. 2018YFA0404502), the National Natural Science Foundation of China (NSFC grants 11733002 and 11773013), the Excellent Youth Foundation of the Jiangsu Scientific Committee (BK20150014), and National Key R&D Program of China (No. 2017YFA0402704). Y.C. acknowledge support from the National Natural Science Foundation of China (NSFC grants 11573013). SFS thank the CONACyT program CB-180125 and DGAPA-PAPIIT IA101217 grants for their support to this project. R.M. acknowledges support by the Science and Technology Facilities Council (STFC) and from the ERC Advanced Grant 695671 "QUENCH". RR thanks to CNPq and FAPERGS. D.B. is supported by grant RScF 14-50-00043.
Funding for the Sloan Digital Sky Survey IV has been provided by the Alfred P. Sloan Foundation, the U.S. Department of Energy Office of Science, and the Participating Institutions. SDSS-IV acknowledges support and resources from the Center for High-Performance Computing at the University of Utah. The SDSS web site is www.sdss.org.
SDSS-IV is managed by the Astrophysical Research Consortium for the Participating Institutions of the SDSS Collaboration including the Brazilian Participation Group, the Carnegie Institution for Science, Carnegie Mellon University, the Chilean Participation Group, the French Participation Group, Harvard-Smithsonian Center for Astrophysics, Instituto de Astrofísica de Canarias, The Johns Hopkins University, Kavli Institute for the Physics and Mathematics of the Universe (IPMU) / University of Tokyo, Lawrence Berkeley National Laboratory, Leibniz Institut für Astrophysik Potsdam (AIP), Max-Planck-Institut für Astronomie (MPIA Heidelberg), Max-Planck-Institut für Astrophysik (MPA Garching), Max-Planck-Institut für Extraterrestrische Physik (MPE), National Astronomical Observatories of China, New Mexico State University, New York University, University of Notre Dame, Observatário Nacional / MCTI, The Ohio State University, Pennsylvania State University, Shanghai Astronomical Observatory, United Kingdom Participation Group, Universidad Nacional Autónoma de México, University of Arizona, University of Colorado Boulder, University of Oxford, University of Portsmouth, University of Utah, University of Virginia, University of Washington, University of Wisconsin, Vanderbilt University, and Yale University.
This project makes use of the MaNGA-Pipe3D dataproducts. We thank the IA-UNAM MaNGA team for creating this catalogue, and the ConaCyt-180125 project for supporting them.
This research made use of Marvin, a core Python package and web framework for MaNGA data, developed by Brian Cherinka, José Sánchez-Gallego, and Brett Andrews. (MaNGA Collaboration, 2017).
References
- Alam et al. (2015) Alam S., et al., 2015, ApJS, 219, 12
- Alatalo et al. (2015) Alatalo K., et al., 2015, ApJ, 798, 31
- Alexander & Hickox (2012) Alexander D. M., Hickox R. C., 2012, New~Astron.~Rev., 56, 93
- Bae et al. (2017) Bae H.-J., Woo J.-H., Karouzos M., Gallo E., Flohic H., Shen Y., Yoon S.-J., 2017, ApJ, 837, 91
- Baldwin et al. (1981) Baldwin J. A., Phillips M. M., Terlevich R., 1981, PASP, 93, 5
- Balmaverde et al. (2016) Balmaverde B., et al., 2016, A&A, 585, A148
- Baum et al. (2010) Baum S. A., et al., 2010, ApJ, 710, 289
- Belfiore et al. (2016) Belfiore F., et al., 2016, MNRAS, 461, 3111
- Belfiore et al. (2017) Belfiore F., et al., 2017, MNRAS, 466, 2570
- Blanton et al. (2011) Blanton M. R., Kazin E., Muna D., Weaver B. A., Price-Whelan A., 2011, AJ, 142, 31
- Blanton et al. (2017) Blanton M. R., et al., 2017, AJ, 154, 28
- Brinchmann et al. (2004) Brinchmann J., Charlot S., White S. D. M., Tremonti C., Kauffmann G., Heckman T., Brinkmann J., 2004, MNRAS, 351, 1151
- Bundy et al. (2015) Bundy K., et al., 2015, ApJ, 798, 7
- Calzetti (2001) Calzetti D., 2001, PASP, 113, 1449
- Cano-Díaz et al. (2012) Cano-Díaz M., Maiolino R., Marconi A., Netzer H., Shemmer O., Cresci G., 2012, A&A, 537, L8
- Cano-Díaz et al. (2016) Cano-Díaz M., et al., 2016, ApJ, 821, L26
- Carniani et al. (2016) Carniani S., et al., 2016, A&A, 591, A28
- Chang et al. (2015) Chang Y.-Y., van der Wel A., da Cunha E., Rix H.-W., 2015, ApJS, 219, 8
- Cheung et al. (2016) Cheung E., et al., 2016, Nature, 533, 504
- Choi et al. (2015) Choi E., Ostriker J. P., Naab T., Oser L., Moster B. P., 2015, MNRAS, 449, 4105
- Christensen et al. (2006) Christensen L., Jahnke K., Wisotzki L., Sánchez S. F., Exter K., Roth M. M., 2006, A&A, 452, 869
- Cicone et al. (2014) Cicone C., et al., 2014, A&A, 562, A21
- Cid Fernandes et al. (2010) Cid Fernandes R., Stasińska G., Schlickmann M. S., Mateus A., Vale Asari N., Schoenell W., Sodré L., 2010, MNRAS, 403, 1036
- Cresci & Maiolino (2018) Cresci G., Maiolino R., 2018, Nature Astronomy, 2, 179
- Cresci et al. (2015) Cresci G., et al., 2015, ApJ, 799, 82
- Davies et al. (2007) Davies R. I., Müller Sánchez F., Genzel R., Tacconi L. J., Hicks E. K. S., Friedrich S., Sternberg A., 2007, ApJ, 671, 1388
- Davies et al. (2014) Davies R. L., Kewley L. J., Ho I.-T., Dopita M. A., 2014, MNRAS, 444, 3961
- Davies et al. (2016) Davies R. L., et al., 2016, MNRAS, 462, 1616
- Diamond-Stanic & Rieke (2012) Diamond-Stanic A. M., Rieke G. H., 2012, ApJ, 746, 168
- Drory et al. (2015) Drory N., et al., 2015, AJ, 149, 77
- Dumas et al. (2007) Dumas G., Mundell C. G., Emsellem E., Nagar N. M., 2007, MNRAS, 379, 1249
- Fabian (2012) Fabian A. C., 2012, ARA&A, 50, 455
- Fang et al. (2013) Fang J. J., Faber S. M., Koo D. C., Dekel A., 2013, ApJ, 776, 63
- Feruglio et al. (2015) Feruglio C., et al., 2015, A&A, 583, A99
- Forman et al. (2007) Forman W., et al., 2007, ApJ, 665, 1057
- García-Burillo et al. (2014) García-Burillo S., et al., 2014, A&A, 567, A125
- Guillard et al. (2015) Guillard P., Boulanger F., Lehnert M. D., Pineau des Forêts G., Combes F., Falgarone E., Bernard-Salas J., 2015, A&A, 574, A32
- Gunn et al. (2006) Gunn J. E., et al., 2006, AJ, 131, 2332
- Haehnelt & Rees (1993) Haehnelt M. G., Rees M. J., 1993, MNRAS, 263, 168
- Harrison (2017) Harrison C. M., 2017, Nature Astronomy, 1, 0165
- Harrison et al. (2012) Harrison C. M., et al., 2012, MNRAS, 426, 1073
- Harrison et al. (2014) Harrison C. M., Alexander D. M., Mullaney J. R., Swinbank A. M., 2014, MNRAS, 441, 3306
- Harrison et al. (2018) Harrison C. M., Costa T., Tadhunter C. N., Flütsch A., Kakkad D., Perna M., Vietri G., 2018, Nature Astronomy, 2, 198
- Heckman & Best (2014) Heckman T. M., Best P. N., 2014, ARA&A, 52, 589
- Helfand et al. (2015) Helfand D. J., White R. L., Becker R. H., 2015, ApJ, 801, 26
- Ho (2008) Ho L. C., 2008, ARA&A, 46, 475
- Ho et al. (2014) Ho I.-T., et al., 2014, MNRAS, 444, 3894
- Hopkins et al. (2006) Hopkins P. F., Hernquist L., Cox T. J., Di Matteo T., Robertson B., Springel V., 2006, ApJS, 163, 1
- Hopkins et al. (2016) Hopkins P. F., Torrey P., Faucher-Giguère C.-A., Quataert E., Murray N., 2016, MNRAS, 458, 816
- Hwang et al. (2018) Hwang H.-C., Zakamska N. L., Alexandroff R. M., Hamann F., Greene J. E., Perrotta S., Richards G. T., 2018, MNRAS, 477, 830
- Karouzos et al. (2014) Karouzos M., et al., 2014, ApJ, 784, 137
- Kauffmann & Heckman (2009) Kauffmann G., Heckman T. M., 2009, MNRAS, 397, 135
- Kauffmann et al. (2003) Kauffmann G., et al., 2003, MNRAS, 346, 1055
- Kennicutt (1998) Kennicutt Jr. R. C., 1998, ARA&A, 36, 189
- Kennicutt & Evans (2012) Kennicutt R. C., Evans N. J., 2012, ARA&A, 50, 531
- Kennicutt et al. (1994) Kennicutt Jr. R. C., Tamblyn P., Congdon C. E., 1994, ApJ, 435, 22
- Kewley et al. (2001) Kewley L. J., Dopita M. A., Sutherland R. S., Heisler C. A., Trevena J., 2001, ApJ, 556, 121
- Kewley et al. (2006) Kewley L. J., Groves B., Kauffmann G., Heckman T., 2006, MNRAS, 372, 961
- King (2003) King A., 2003, ApJ, 596, L27
- Kormendy & Ho (2013) Kormendy J., Ho L. C., 2013, ARA&A, 51, 511
- Krause et al. (2007) Krause M., Fendt C., Neininger N., 2007, A&A, 467, 1037
- Law et al. (2015) Law D. R., et al., 2015, AJ, 150, 19
- Law et al. (2016) Law D. R., et al., 2016, AJ, 152, 83
- López-Cobá et al. (2017a) López-Cobá C., et al., 2017a, MNRAS, 467, 4951
- López-Cobá et al. (2017b) López-Cobá C., et al., 2017b, ApJ, 850, L17
- Maiolino et al. (2008) Maiolino R., et al., 2008, A&A, 488, 463
- Maiolino et al. (2012) Maiolino R., et al., 2012, MNRAS, 425, L66
- Mallmann et al. (2018) Mallmann N. D., et al., 2018, MNRAS, 478, 5491
- Morganti et al. (2015) Morganti R., Oosterloo T., Oonk J. B. R., Frieswijk W., Tadhunter C., 2015, A&A, 580, A1
- Norman & Scoville (1988) Norman C., Scoville N., 1988, ApJ, 332, 124
- Novak et al. (2011) Novak G. S., Ostriker J. P., Ciotti L., 2011, ApJ, 737, 26
- Osterbrock & Ferland (2006) Osterbrock D. E., Ferland G. J., 2006, Astrophysics of gaseous nebulae and active galactic nuclei
- Peng et al. (2015) Peng Y., Maiolino R., Cochrane R., 2015, Nature, 521, 192
- Querejeta et al. (2016) Querejeta M., et al., 2016, A&A, 593, A118
- Rembold et al. (2017) Rembold S. B., et al., 2017, MNRAS, 472, 4382
- Riffel et al. (2011) Riffel R., Riffel R. A., Ferrari F., Storchi-Bergmann T., 2011, MNRAS, 416, 493
- Riffel et al. (2017) Riffel R. A., Storchi-Bergmann T., Riffel R., Dahmer-Hahn L. G., Diniz M. R., Schönell A. J., Dametto N. Z., 2017, MNRAS, 470, 992
- Roos et al. (2015) Roos O., Juneau S., Bournaud F., Gabor J. M., 2015, ApJ, 800, 19
- Rosario et al. (2018) Rosario D. J., et al., 2018, MNRAS, 473, 5658
- Salim et al. (2016) Salim S., et al., 2016, ApJS, 227, 2
- Salomé et al. (2016) Salomé Q., Salomé P., Combes F., Hamer S., Heywood I., 2016, A&A, 586, A45
- Sánchez et al. (2013) Sánchez S. F., et al., 2013, A&A, 554, A58
- Sánchez et al. (2014) Sánchez S. F., et al., 2014, A&A, 563, A49
- Sánchez et al. (2016a) Sánchez S. F., et al., 2016a, Rev. Mex. Astron. Astrofis., 52, 21
- Sánchez et al. (2016b) Sánchez S. F., et al., 2016b, Rev. Mex. Astron. Astrofis., 52, 171
- Sánchez et al. (2018) Sánchez S. F., et al., 2018, Rev. Mex. Astron. Astrofis., 54, 217
- Schawinski et al. (2010) Schawinski K., et al., 2010, ApJ, 711, 284
- Schawinski et al. (2014) Schawinski K., et al., 2014, MNRAS, 440, 889
- Shi et al. (2007) Shi Y., et al., 2007, ApJ, 669, 841
- Shi et al. (2009) Shi Y., Rieke G. H., Ogle P., Jiang L., Diamond-Stanic A. M., 2009, ApJ, 703, 1107
- Shi et al. (2011) Shi Y., Helou G., Yan L., Armus L., Wu Y., Papovich C., Stierwalt S., 2011, ApJ, 733, 87
- Shi et al. (2014) Shi Y., Armus L., Helou G., Stierwalt S., Gao Y., Wang J., Zhang Z.-Y., Gu Q., 2014, Nature, 514, 335
- Shi et al. (2018) Shi Y., et al., 2018, ApJ, 853, 149
- Silk (2013) Silk J., 2013, ApJ, 772, 112
- Simard et al. (2011) Simard L., Mendel J. T., Patton D. R., Ellison S. L., McConnachie A. W., 2011, ApJS, 196, 11
- Smee et al. (2013) Smee S. A., et al., 2013, AJ, 146, 32
- Springel (2005) Springel V., 2005, MNRAS, 364, 1105
- Stasińska et al. (2008) Stasińska G., et al., 2008, MNRAS, 391, L29
- Trump et al. (2015) Trump J. R., et al., 2015, ApJ, 811, 26
- Wake et al. (2017) Wake D. A., et al., 2017, AJ, 154, 86
- Wang et al. (2012) Wang J., Fabbiano G., Karovska M., Elvis M., Risaliti G., 2012, ApJ, 756, 180
- Wild et al. (2011) Wild V., et al., 2011, MNRAS, 410, 1593
- Wild et al. (2014) Wild V., et al., 2014, A&A, 567, A132
- Willett et al. (2013) Willett K. W., et al., 2013, MNRAS, 435, 2835
- Wylezalek & Zakamska (2016) Wylezalek D., Zakamska N. L., 2016, MNRAS, 461, 3724
- Wylezalek et al. (2017) Wylezalek D., et al., 2017, MNRAS, 467, 2612
- Xu et al. (2015) Xu L., Rieke G. H., Egami E., Haines C. P., Pereira M. J., Smith G. P., 2015, ApJ, 808, 159
- Yan & Blanton (2012) Yan R., Blanton M. R., 2012, ApJ, 747, 61
- Yan et al. (2016a) Yan R., et al., 2016a, AJ, 151, 8
- Yan et al. (2016b) Yan R., et al., 2016b, AJ, 152, 197
- Zakamska et al. (2016) Zakamska N. L., et al., 2016, MNRAS, 455, 4191
- Zhang et al. (2016) Zhang Z., Shi Y., Rieke G. H., Xia X., Wang Y., Sun B., Wan L., 2016, ApJ, 819, L27
- Zinn et al. (2013) Zinn P.-C., Middelberg E., Norris R. P., Dettmar R.-J., 2013, ApJ, 774, 66
- Zubovas & Bourne (2017) Zubovas K., Bourne M. A., 2017, MNRAS, 468, 4956
- Zubovas et al. (2013) Zubovas K., Nayakshin S., King A., Wilkinson M., 2013, MNRAS, 433, 3079