Vol.0 (20xx) No.0, 000–000
\vs\noReceived 20xx month day; accepted 20xx month day
Mineralogy of northern nearside mare basalts
Abstract
The mineralogy of mare basalts reflects the chemical composition of the magma source, as well as the physical and chemical environment of the rock’s formation. It is significant for understanding the thermal evolution of the Moon. In this study, the spatial distribution of the mineralogy of the lunar northern nearside basalts was mapped using the Moon Mineralogy Mapper (M data. The study area, which is an elongated mare, Mare Frigoris and northern Mare Imbrium, was mapped and characterized into 27 units based on multi-source data, including spectrum, terrain, and element abundance. We extracted 177 M3 spectra from fresh craters. Spectral parameters such as absorption center and band area ratio (BAR) were obtained through data processing. The variation of mafic mineral of this region was acquired by analyzing these parameters. The basaltic units in eastern Mare Frigoris, which are older, have been found to be dominated by clinopyroxene with lower CaO compared to the returned lunar samples; this is similar to older basaltic units in Mare Imbrium. The basaltic units of western Mare Frigoris and Sinus Roris which are younger have been found to be rich in olivine. The late-stage basalts in Oceanus Procellarum and Mare Imbrium show the same feature. These wide-spread olivine-rich basalts suggest the uniqueness in the evolution of the Moon. Geographically speaking, Mare Frigoris is an individual mare, but the magma source region have connections with surrounding maria in consideration of mineral differences between western and eastern Frigoris, as well as mineral similarities with maria at the same location.
keywords:
Mare Frigoris; Moon Mineralogy Mapper; spectra; basalt unit; mineralogy1 Introduction
Mare basalt covers 17% of the surface of the Moon and accounts for approximately 1% of the lunar crust (Head 1976). Its spatial distribution, composition, and volume record important information of the magmatic activity of the Moon. Research into its mineral components aids in the understanding of the magma source and characterizes the pressure, temperature, cooling rate, and other physical parameters of the magmatic state and processes. In addition, the mineralogy of mare basalts is an important scientific focus of the lunar exploration.
Among the lunar maria, Mare Frigoris is very special. Most maria are circular; however, Mare Frigoris is very long and narrow (approximately 1800 km long with a maximum width of 200 km). Although Mare Frigoris is a separate mare geographically, its basalts may be associated with the adjacent maria (such as western Mare Frigoris and Oceanus Procellarum, southern Mare Frigoris and northern Mare Imbrium). Therefore, this study chose this long and narrow mare as the major research area to analyze the variation in mineral compositions in different locations. Further, it makes a comparison with the mineral compositions of adjacent maria (northern Mare Imbrium basalts) to discuss its role in the thermal evolution of the Moon.
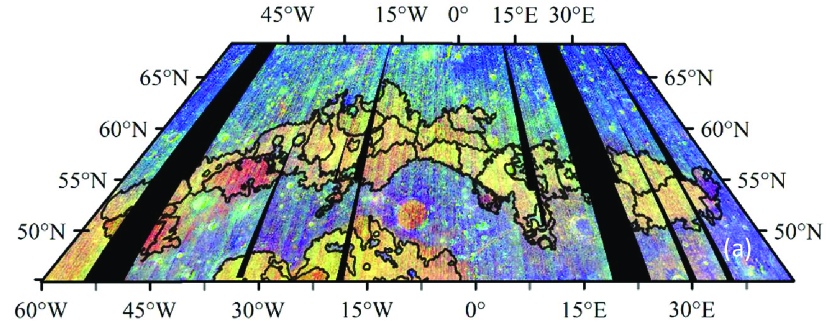
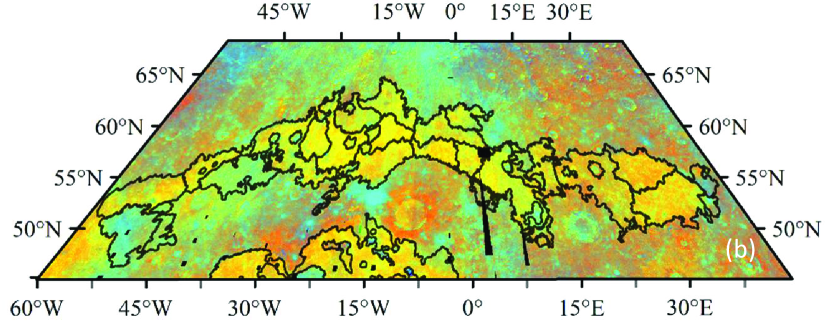
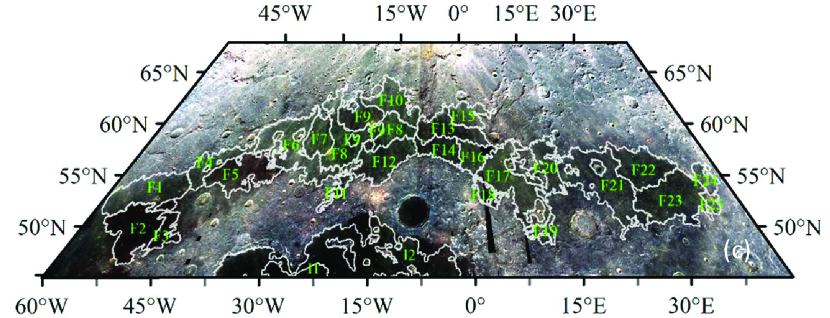
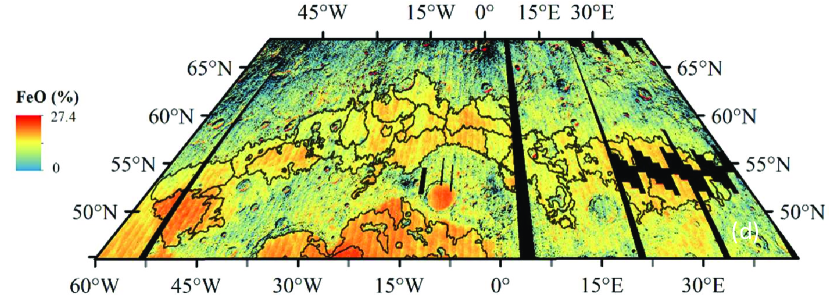
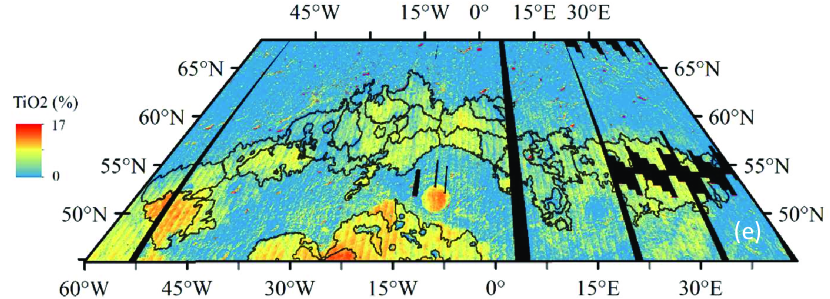
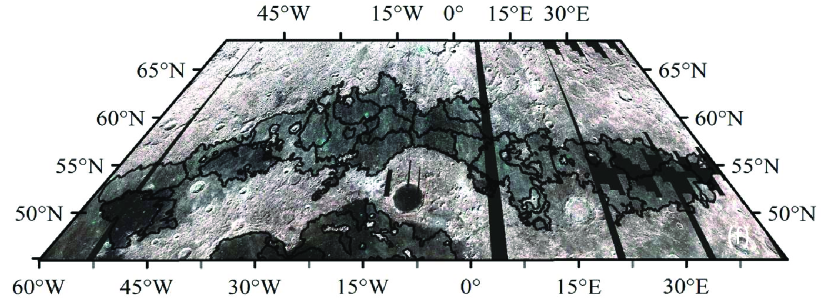
Fig. 1 shows the focus area of this study. It centers around Mare Frigoris, including Sinus Roris in western and northern Mare Imbrium. Mare Frigoris is located in Procellarum KREEP Terrane (PKT) on the nearside of the Moon (Jolliff et al. 2000), at 56.0∘N central latitude and 1.4∘E central longitude. Its west side is linked to Oceanus Procellarum by Sinus Roris. Whitford-Stark (1990) drew the geological map of Mare Frigoris based on ground observation and Lunar Orbiter data, and revealed that the oldest and the youngest basalts were located in the northeast and southwest, respectively. Hiesinger et al. (2010) divided 37 geological units using the false color images of Clementine UV/VIS, and calculated the model age using the crater size-frequency distribution (CSFD) method. The results showed that the youngest basalts were located in Sinus Roris; four young Eratosthenian basalts were located in the middle of Mare Frigoris, northern Plato crater and northwest of Baily crater; the remaining old geological units were formed in the late Mare Imbrium, aged between 3.4 and 3.8 Ga. Kramer et al. (2015) divided Mare Frigoris into 26 geological units based on Clementine, Lunar Prospector (LP), and Lunar Reconnaissance Orbiter (LRO) data. With the exception of two units in the west, where the contents of iron and titanium reached the levels of medium iron & low titanium and medium iron & medium titanium, respectively, the majority of the remaining areas were characterized as high-alumina basalts, characterized by low titanium to extremely low titanium, low iron, and high alumina,
The Clementine UV/VIS data ranges from 415 to 1000 nm with only five bands. The spectral resolution is low, which restricts the reliable identification of the minerals. The India’s Chandrayaan-1 Moon Mineralogy Mapper (M data have a wider range of wavelengths and higher spectral resolution. They can make an approximate description of the spectral curve continuously, so as to more accurately infer the mineral composition. The study obtains the spectral absorption characteristics of fresh craters by using of the M3 data to identify the mineral composition of Mare Frigoris and northern Mare Imbrium. Then, it compares the composition with those of adjacent maria to discuss its regional geological significance.
2 Data
The M3 Level 2 (L2) data with spatial resolution of 140 m/pixel were used for the mineral analysis. In addition, this study adopts a variety of other data for the division of the stratigraphic units. Of these, the standard Clementine color ratio composite (R, 750/415, G, 750/950, B, 415/750) map and the standard M3 integrated band depth (IBD) composite (R: 1000 nm IBD; G: the 2000 nm IBD; and B: reflectance at 1480 nm) were used as base maps for separating basaltic units. In the two mosaic images the stitching traces between orbital boundaries are very obvious, which makes it difficult for the separation of different geologic units. The Lunar Reconnaissance Orbiter Camera (LROC) Wide Angle Camera (WAC) 7-channel composite (Wagner et al. 2015) and the Chang’E-1 interference imaging spectroscopy (IIM) data calibrated in Wu et al. (2013) eliminate the tile-shaped splicing boundary. These non-trace mosaics are conducive to the preparation of the geological map, though they are partially missing and unable to completely cover the study area. Moreover, the M3 images containing thermal emission radiation, the WAC low-Sun mosaic and 30 m LOLA DEM show morphology information hence contributed to the separation of the basaltic units (Wu et al. 2018a). The FeO and TiO2 maps were from the original IIM 2C level data (Wu 2012). All the data except IIM were from the Planetary Data System (PDS).
3 Methodology
3.1 Separation of Stratigraphy
The stratigraphic division, which is important for the interpretation of mineralogy and geology, is not easy work because of the space weathering, contamination by the ejecta and lack of perfectly calibrated data. Following the methodology developed in Wu et al. (2018a), the separation of geologic units of this study was derived using diverse datasets including Clementine band ratio composite, FeO abundances, IIM color composite, LROC WAC mosaic composite, M3 IBD and M3 enhanced color, LROC WAC low-Sun image). All of these images were input in ArcGis and stretched for contrast enhancement.
3.2 Collection of Spectra
To avoid space weathering, the spectra from small fresh craters with diameters of 1 km or slightly larger, and the mean spectra calculated from several pixels of the individual crater have been often used in previous publications (Kramer et al. 2008; Staid & Pieters 2001; Whitten et al. 2011; Kaur et al. 2013). The extracted spectra from craters with diameters of 1 km easily contain the compositions of the underlying stratigraphy because these craters of this size could excavate depths of approximately 84 m (Melosh 1989). If a crater has a lower resolution than that of M3, the spectra are not from fresh crater itself; instead, they contain shadows, melts, and soils. Through trial-and-error in Wu et al. (2018a), a fresh crater with a diameter of 3 – 5 M3 pixels is optimal to not only distinguish walls and shadows, but also to represent the top unit. Following Wu et al. (2018a) in this study we used the fresh craters with diameters of 400 – 500 m to sample spectra and they were from high-quality one pixel to reduce the pixel mixing. In order to ensure that the craters are fresh the very high spatial-resolution LROC Narrow Angle Camera (NAC) data were used.
3.3 Spectral parameter acquisition
The mafic minerals (e.g., pyroxene and olivine) of mare basalts can be identified through their characteristic spectral absorption features. Pyroxene displays two absorption peaks at approximately 1000 nm (Band I) and 2000 nm (Band II) (Adams 1974; 1975; Burns 1993; Cloutis 1985; Klima et al. 2007). In contrast, the olivine reflectance spectrum is revealed by a broad and asymmetric 1000 nm absorption, but lacks the 2000 nm absorption (Adams 1975; Singer 1981; Burns 1993; Isaacson et al. 2014). The broad Band I absorption in olivine is caused by three distinct absorption bands (Burns 1993). The central absorption, located just beyond 1000 nm, is caused by iron in the M2 crystallographic site. The two weaker absorptions near 850 and 1250 nm are the result of iron in the M1 site (Burns 1993; Sunshine & Pieters 1998). The Band I “secondary” absorption near 1250 nm allows olivine to be detected when admixed with the spectrally “stronger” pyroxene.
The absorption band center is crucial for mineral identification. The Band I and Band II centers provide a qualitative way to access the composition of pyroxenes (Klima et al. 2007). The band centers are influenced by the amount of Fe2+ and Ca2+. For example, with increasing Fe2+ and Ca2+, the band centers move slightly to the longer wavelength (Burns 1993; Hazen et al. 1978). However, in the case of olivine-pyroxene mixtures, Band I is dependent on the relative abundances of both olivine and pyroxene, which makes the interpretations problematic. The band area ratio (BAR), defined as the ratio between the Band II and Band I absorption features, is useful for estimating the relative abundances of pyroxene and olivine in basalts (Cloutis et al. 1986; Gaffey et al. 1993). The BAR is in inversely proportion to the olivine content, but increases linearly with pyroxene abundance (Gaffey et al. 1993; Cloutis et al. 1986).
Prior to calculating the absorption parameters, a B-spline function fitting is used to smoothen the spectral data to reduce the effects of spectral noise. The spectral curve after smoothing maintains a similar form and value to the original, with the noise removed. To derive the accurate absorption band center, the spectral continuum should be removed. The continuum removal was performed using the convex hull method with the 2497 nm as the right endpoint suggested in Wu et al. (2018a) to handle the reflectance increases in the longer wavelength. The band area refers to the accumulative value of the absorption depths of the continuum function within 1000 and 2000 nm band absorption characteristic peaks. They are represented by Band I Area and Band II Area, respectively.
4 Results and Discussion
4.1 Stratigraphy
According to the unit division method mentioned above, this study area has been divided into 27 unites, 25 units in Mare Frigoris and Sinus Roris and two units in the northern Mare Imbrium. Kramer et al. (2015) excludes F24 from Mare Frigoris; however, in the LROC WAC and M3 OP1B images, it is smooth and dark on the surface, and thus it is included in the scope of research. Owing to the serious loss of M3 data around Lacus Mortis, it is impossible to extract the spectrum. Thus, it is not included in this study. Fig. 1 shows the unit division results in the M3 IBD image, Clementine color ratio composite image, IIM FeO and TiO2 content diagram, and IIM false color composite image, respectively.
Fig. 1a shows the M3 (IBD) composite. In this figure, the highlands appear blue, whereas mare basalts appear yellow/green to orange according to the relative strength of the mafic minerals. The darker red hues of the unit is, the higher olivine/pyroxene ratios (Staid et al. 2011). In Fig. 1a, the F1, F4, and F6 units are in yellow, and F2, F3, and F5 are in orange. F7, F8, F9, and F10 are in yellow-green. F11 and F12 are in orange-red. F13 and F15 are in orange-yellow, and F14, F16, F17, and F19 are in yellow-green. Three edge units, namely, F18 in the southern Plato crater and F24 and F25 in the eastern Plato crater, are in purple in the Clementine ratio color composite image (Fig. 1b), and, F18 is in red-purple and F24 is in blue-purple. The blue area in the Clementine ratio false color composite image indicates the high content of titanium in the unit.
4.2 Spectral Analysis
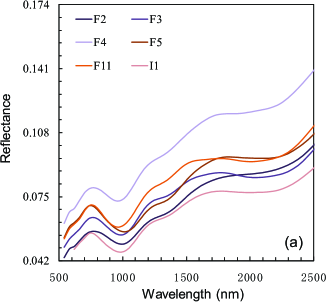

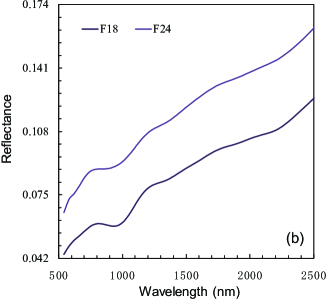
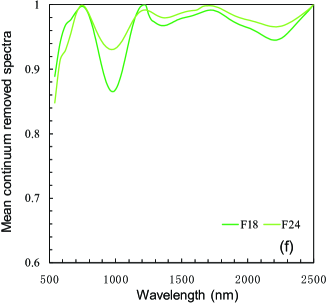
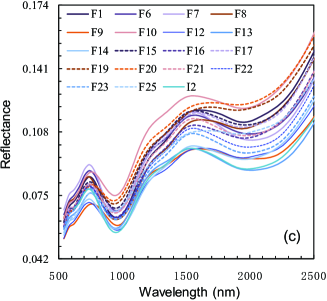
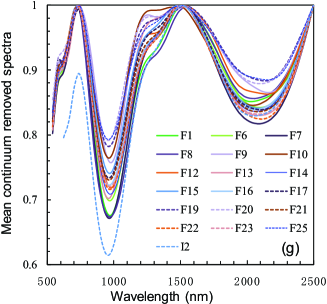
Fig. 2 shows the average reflectance of fresh craters, as well as their average reflectance curves after continuum removal. They are divided into three groups according to the shape of the spectral curves (width and depth of absorption characteristic and spectral slope): G1 (F2, F3, F4, and F5 in the western Mare Frigoris; F11 in the central Mare Frigoris; and I1 in the central northern Mare Imbrium), G2 (F18 in the southern Mare Frigoris, and F24 on the extreme eastern side of Mare Frigoris), and G3 (remaining units except those in G1 and G2). The spectra of most units have strong absorption characteristics at 1000 and 2000 nm. The absorption characteristic of five units in G1 at 1000 and 2000 nm are in the middle level of the three groups. They have an absorption at 1300 nm and weak absorption at 2000 nm. The absorption characteristic of two units in Group 2 is special; they have the weakest absorption at 1000 and 2000 nm and a big slope. This may be because it is difficult to select a fresh crater in this region hence contains the mixture of soils, or because the region has less crystallized composition. F24 is the oldest unit in Mare Frigoris, aged 3. 77 Ga (Hiesinger et al. 2010). It has low of iron and titanium contents and a weak absorption characteristic of the spectral curve. The spectral curves of the units in G3 are highly consistent; they have the strongest absorption at 1000 and 2000 nm and weak absorption at 1300 nm.
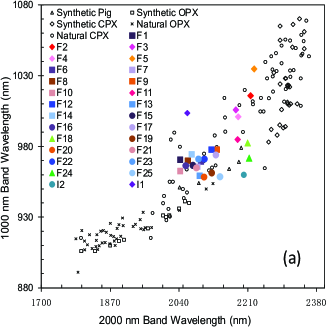
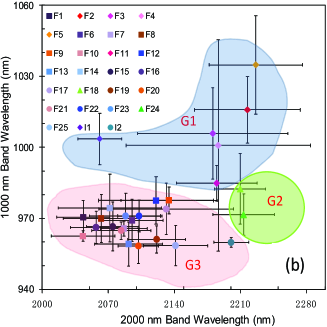
Fig. 3 shows the average 1000 nm and 2000 nm absorption center scatter plots of all units. As a contrast, the figure also shows the laboratory spectral data of natural pyroxene and synthetic pyroxene (Adams 1974; Klima et al. 2011). The wavelengths of the 1000 and 2000 nm absorption centers of synthetic low-Ca pyroxene, which better addresses the fundamental constraints of crystal structure and Ca-Mg-Fe content on reflectance spectra, are 900 to 930 nm and 1800 nm to 2100 nm, respectively. Those of synthetic high-Ca pyroxene are 950 nm to 1070 nm and 2260 nm to 2400 nm, respectively. G1 has the maximum absorption center wavelength, namely 985 nm to 1035 nm and 2181 nm to 2226 nm, respectively. The spectral curve has a wide and asymmetrical absorption peak at 1000 nm. The absorption peak is weak at 2000 nm, which is the olivine-dominated mineralogy. The absorption center wavelengths of G2 are 972 nm to 982 nm and 2210 nm to 2214 nm, respectively. Those of G3 are 958 nm to 978 nm and 2043 nm to 2141 nm, respectively, indicating rich monoclinic pyroxene; however, the content of pyroxene calcium is lower than that in the lunar samples.
Fig. 3 shows the scatter plot of the absorption center wavelengths and BARs of the units of Mare Frigoris and northern Mare Imbrium. The BAR value is low in G1, ranging from 0.26 to 0.73, which is the olivine-dominated mineralogy. The BAR value is between 0.76 and 1.52 in G3, which is the clinopyroxenes and olivine mixed mineral. The BARs of F18 and F24 in G2 are 0.85 and 0.83, respectively.
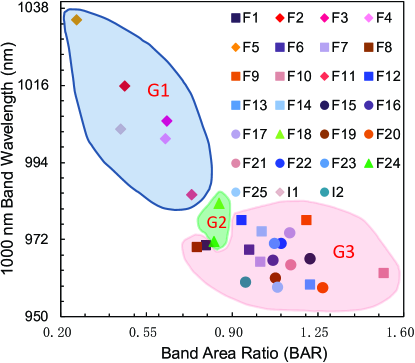
Fig. 4 presents the distribution diagram of the 1000 nm absorption centers and BAR values of Mare Frigoris and northern Mare Imbrium. Overall, they both show a certain negative correlation, which is in line with the proportional change in olivine/pyroxene. This indicates that the minerals comply with the change from olivine domination to pyroxene domination. The olivine-dominated mineralogy in western Mare Frigoris and central Mare Imbrium has a long 1000 nm absorption center wavelength and low BAR value. The clinopyroxenes-dominated mineralogy in eastern central Mare Frigoris has the shortest 1000 nm wavelength and a high BAR value.
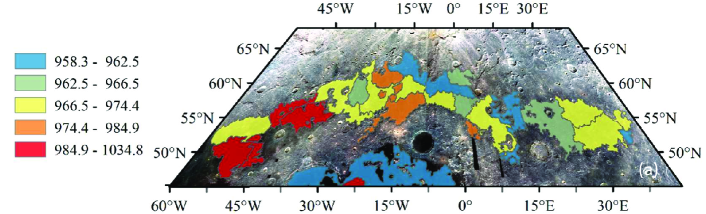

The change in the relative trends of mafic mineral in space in Mare Frigoris and northern Mare Imbrium can be seen intuitively from Fig. 5. Western Mare Frigoris, Sinus Roris and central Mare Imbrium (F2, F3, F4, F5, and I1) have the longest 1000 nm absorption center wavelengths and the smallest BAR, dominated by olivine. Young basalts in Oceanus Procellarum are also dominated by olivine (Staid et al. 2011; Zhang et al. 2016). Further combining with the age data, the basalts in western Mare Frigoris, Sinus Roris, Procellarum, and Mare Imbrium are all found to be young basalts (F2, F3, F4, and F5 aged 1.3-1.7 Ga (Hiesinger et al. 2010), and I1 aged 2.35 Ga (Wu et al. 2018a)). The similar olivine domination and age suggest that the late-stage thermal evolution of the Moon has a regularity in a larger scope.
The Mare Frigoris mineralogy in the northern Plato crater shows different absorption characteristic on the east and west sides. The 1000 nm absorption center on the west side is long with a small BAR value, whereas that on the east side is short with a large BAR value. The ratio of olivine to pyroxene on the west side is higher than that on the east. The 1000 nm absorption center wavelength and BAR value of the mineralogy around the eastern Aristoteles crater are 958.3 nm to 962.5 nm and 1.02 to 1.14, respectively. The ratio of olivine to pyroxene is low. The mineralogy in this area is old, aged over 3.56 Ga (Hiesinger et al. 2010). The basalts around the two craters are rich in low-Ca and medium-Ca pyroxene, which is consistent with the Mare Imbrium basalts on the north of the Mare Imbrium basin (Wu et al. 2018a). This may indicate that the deep source of east central Mare Frigoris basalt has certain correlation with those of northern Mare Imbrium basalts. These phenomena indicate that the deep source of Mare Frigoris may be consistent with surrounding adjacent lunar maria, despite being a geographical mare.
5 Summary and Conclusions
By comprehensive utilization of multi-source data and according to various characteristics of albedo, hue, and topography, this study divided the units of the maria on the northern nearside of the Moon in detail, analyzed the spectral absorption characteristics of different units, mapped the distribution of the 1000 nm absorption center wavelengths and BAR values, and studied the mineral variation in different units.
The basalts in western Mare Frigoris and Sinus Roris have the highest ratio of olivine to pyroxene, i.e., they are rich in olivine. Similarly, the Eratosthenian basalts in northern Mare Imbrium (and Oceanus Procellarum) are also dominated by olivine (Staid et al. 2011; Varatharajan et al. 2014; Zhang et al. 2016). The basalts in central and eastern Mare Frigoris have low ratios of olivine to pyroxene. The mineralogy with the lowest ratio is located around crater Fontenelle on the southern Mare Frigoris, and is rich in low-Ca to medium-Ca pyroxene. The old basalts in northern Mare Imbrium have similar composition. All of these phenomena indicate that, although Mare Frigoris is a geographical mare, the basalts of Mare Frigoris have different magma sources and have a certain correlation to the sources of adjacent maria.
The unsampled late-stage basalts are spectrally unique hence they are compositionally unique and distinguished from older basalts. For the formation of these spectrally unique basalts some hypotheses have been suggested. One explanation is that the olivine-rich Eratosthenian basalts were formed via the partial melting from the ilmenite-rich mantle source and mixed with the residual KREEP layer beneath the anorthosite crust as it ascended to the surface (Zhang et al. 2015). Alternatively, Zhang et al. (2015) also suggests that the basalts were derived via the partial melting of the mantle source that mixed with sinking ilmenite-rich KREEPy rocks. The young basalts in Mare Frigoris and Sinus Roris are rich in olivine, and the iron and titanium contents are also very high. The composition is similar to that of a large area of young basalts in Oceanus Procellarum and Mare Imbrium, which indicates that the late-stage volcanism of the Moon occurred on a larger scale. The young basalts have the lowest Mg# among all the rocks of the Moon (e.g., Wu 2012; Crites & Lucey 2015). The Chang’E-3 rover Active Particle-induced X-ray Spectrometer (APXS) data show that the young basalts are characterized with high-FeO (22.24 wt.%), medium TiO2 (4.31 wt.%) and high Al2O3 (12.11wt.%) (Wu et al. 2018b). The chemical and mineral data indicate that the young basalts do not have a KREEPy composition or affinity (Neal et al. 2015). Therefore, such a large-scale evolution and the unique composition show that their sources have experienced a high evolution process rather than assimilation with KREEPy materials. In the future, the samples of young basalts need to be collected for detailed petrological analysis. Chang’E-5 will collect samples, and it is recommended that the late-stage basalts be sampled.
Acknowledgements.
This research was supported by the National Key R&D Program of China (2018YFB0504704), the National Natural Science Foundation of China (11773087), the Macau Science and Technology Development Fund (103/2017/A and 119/2017/A3) and Minor Planet Foundation of Purple Mountain Observatory. The M3 Level 2 reflectance data are downloaded from the PDS (http: //pdsimaging.jpl.nasa.gov/volumes/m3.html). The LROC WAC images are acquired from the LROC website (http: //wms.lroc.asu.edu/lroc). The Clementine UV/VIS images are downloaded from the PDS note (http: //pdsimage.wr.usgs.gov).References
- (1) Adams, J. B. 1974, J. Geophys. Res., 79, 4829
- (2) Adams, J. B. 1975, Interpretation of Visible and Near-infrared Diffuse Reflectance Spectra of Pyroxenes and Other Rockforming Minerals, Infrared and Raman Spectroscopy of Lunar and Terrestrial Minerals (Academic Press New York), 91
- (3) Burns, R. G. 1993, Mineralogical Applications of Crystal Field Theory, ed. Roger G. Burns (Cambridge, UK: Cambridge Univ. Press), 575
- (4) Cloutis, E. A. 1985, Interpretive techniques for reflectance spectra of mafic silicates, M.S. Thesis, University of Hawai‘i, Honolulu, Hawai‘i
- (5) Cloutis, E. A., Gaffey, M. J., Jackowski, T. L., & Reed, K. L. 1986, J. Geophys. Res., 91, 11641
- (6) Cloutis, E. A., & Gaffey, M. J. 1991, J. Geophys. Res., 96, 22809
- (7) Crites, S. T., & Lucey, P. G. 2015, Am. Mineral., 100, 973
- (8) Gaffey, M. J., Bell, J. F., Brown, R. H., et al. 1993, Icarus, 106, 573
- (9) Hazen, R. M., Bell, P. M., & Mao, H. K. 1978, Lunar and Planetary Science Conference Proceedings, 9, 2919
- (10) Head, J. W. 1976, Rev. Geophys., 14, 265
- (11) Hiesinger, H., Head, J. W., Wolf, U. et al. 2010, Journal of Geophysical Research (Planets), 115, E03003
- (12) Isaacson, P. J., Klima, R. L., Sunshine, J. M. et al. 2014, Am. Mineral., 99, 467
- (13) Jolliff, B. L., Gillis, J. J., Haskin, L. A. et al. 2000, J. Geophys. Res., 105, 4197
- (14) Kaur, P., Bhattacharya, S., Chauhan, P. et al. 2013, Icarus, 222, 137
- (15) Klima, R. L., Pieters C. M., & Dyar M. D. 2007, Meteorit. Planet. Sci., 42, 235
- (16) Klima, R. L., Pieters, C. M., Boardman, J. W., et al. 2011, Journal of Geophysical Research (Planets), 116, E00G06
- (17) Kramer, G. Y., Jolliff B. L., & Neal C. R. 2008, Journal of Geophysical Research (Planets), 113, E01002
- (18) Kramer, G. Y., Jaiswal, B., Hawke, B. R. et al. 2015, J. Geophys. Res., 120, 1646
- (19) Melosh, H. J. 1989, Impact cratering: A geologic process. Research supported by NASA. New York, Oxford University Press (Oxford Monographs on Geology and Geophysics, No. 11), 253, 11
- (20) Neal, C. R., Wu, Y. Z., Cui, X. Z., Peng, W. X., & Ping, J. S. 2015, Lunar and Planetary Science Conference, 46, 1641
- (21) Singer, R. B. 1981, J. Geophys. Res., 86, 7967
- (22) Staid, M. I., & Pieters, C.M. 2001, J. Geophys. Res., 106, 27887
- (23) Staid, M. I., Pieters, C. M., Besse, S., et al. 2011, Journal of Geophysical Research (Planets), 116, E00G10
- (24) Sunshine, J. M., & Pieters C. M. 1998, J. Geophys. Res., 103, 13675
- (25) Varatharajan, I., Srivastava, N., & Murty, S. V. S. 2014, Icarus, 236, 56
- (26) Whitford-Stark, J. L. 1990, Proc. Lunar Sci. Conf., 20th, 175
- (27) Whitten, J., Head, J. W., Staid, M. et al. 2011, Journal of Geophysical Research (Planets)., 116, E00G09
- (28) Wu, Y. Z. 2012, Geochim. Cosmochim. Acta, 93, 214
- (29) Wu, Y. Z., Besse, S., Li, J. Y. et al. 2013, Icarus, 222, 283
- (30) Wu, Y. Z., Li, L., Luo, X. et al. 2018a, Icarus, 303, 67
- (31) Wu, Y., Wang, Z., Cai, W., & Lu, Y. 2018b, Astron. J., 155, 213
- (32) Zhang, J., Yang, W., Hu, S. et al. 2015, Proc. Natl. Acad. Sci., 112, 5342
- (33) Zhang, X., Wu, Y., Ouyang, Z. et al. 2016, J. Geophys. Res., 121, 2063