Quantification of historical drought conditions over different climatic zones of Nigeria
Abstract
The impact of extreme climate such as drought and flooding on agriculture, tourism, migration and peace in Nigeria is immense. There is the need to study the trend and statistics for better planning, preparation and adaptation. In this study, the statistical and temporal variation of climatic indices Standardized Precipitation Index (SPI ) and Standardized Precipitation Evapotranspiration Index (SPEI) were computed for eighteen (18) stations covering four climatic zones (Sahel, Midland, Guinea Savannah and Coastal) of tropical Nigeria. Precipitation, minimum and maximum temperature from 1980 - 2010 obtained from the archives of the Nigerian Meteorological Services were used to compute both the SPI and SPEI indices at 1-, 3- 6- and 12-month timescales. The temporal variation of drought indices showed that droughts were more prominent at 6- and 12-months timescales. SPI and SPEI were found to be better correlated at longer timescales than short time scales. Predominant small, positive and significant trend across the region suggest an increasing trend due to climate change.
keywords:
climate indices , Standardized Precipitation Index , Standardized Precipitation Evapotranspiration Index , Nigeria , climate change.1 Introduction
Drought is an unusual period of dryness as a result of low precipitation or high temperature (Sordo-Ward et al, 2017). A drought event is characterized by a continuous shortage of water due to low rainfall over a period of time (Chen et al, 2009). The occurrence of drought in a location over a long period of time is referred to as severe drought (Muhammad et al. 2017). Droughts have become a consistent global climatic occurrence (Pereira et al, 2009). Intense drought conditions have been linked to the accumulation of greenhouse gases especially from decades of industrial activities (Gudmundsson and Seneviratne, 2015; Stocker, 2014; Field et al, 2012). Drought events in different regions of the globe vary in intensity (severity or magnitude), frequency of occurrence and duration (Wilhite, 1993; Dracup et al, 1980).
The effects of drought are far reaching to agriculture, ecology, health. Droughts that have direct effects on crop growth and yield as a result of dryness in their roots is referred to as agricultural droughts. Ahmad et al (2004) reported that agricultural drought occurred in Pakistan during years 2000 and 2001. During the same period, there was a severe drought in North Korea that led to a significant drop in food production (Josserand et al, 2008). Other types of physical droughts are: meteorological and hydrological droughts (Khan et al, 2018). Keyantash and Dracup (2002) described a non-physical form of drought referred to as socioeconomic drought. Blain (2012) emphasized the slowly accumulating effect of drought and the need for its early detection. Notably, there is an expected increase in the severity, spread and effect of drought in some African countries by 2020. (Pachauri and Reisinger, 2008).
Drying trends were found to be increasing from the 1970s till the 1990s in a study carried out by qian2001climate for regions of Northern China. Oloruntade et al (2017) found high correlations values of 0.65 and 0.55 between SPI and SPEI at 3-months and 12-months in the Niger-South Basin area of Nigeria. SPI and SPEI values were found to produce similar droughts characteristics over the Volta basin with a correlation of 0.97 in observed and simulated data (Oguntunde et al, 2017). Drought can lead to violence and radical attitudes among politically neglected, marginalized and disaffected people (Detges, 2017). Positive correlation has been reported between Atlantic Nino 1 along the coastal regions of West Africa while a negative correlation prevails in the Sahel region (Adeniyi and Dilau, 2018). Coupled ocean-atmosphere phenomena has been found to influence drought events within the Greater Horn of Africa region (Mpelasoka et al, 2018). Drought vulnerability index over Africa during the period 1960 - 2100 showed that northern African countries such as Egypt, Tunisia, and Algeria are the least drought vulnerable countries (Ahmadalipour and Moradkhani, 2018). Ndehedehe et al (2016) reported that El-Nino Southern Oscillation (ENSO), Atlantic multi-decadal oscillation and Atltantic meridional mode (AMM) are associated with extreme rainfall conditions with statistically significant relationship between AMO and SPI at 12 months.
Studies on drought trends are useful in the development of models for future hydroclimatic predictions and water resource planning. A number of drought assessment indices are existent and in use (Khan et al, 2018). The choice of a drought index depends on the type of drought as each index in use has its uniqueness and application some of which were highlighted in (Khan et al, 2018) and Mishra and Singh (2010). Indicators such as the Standard Precipitation Index (SPI) can be used to characterize droughts (moreira2008spi). SPI has an advantage in its usefulness for impact assessment of agricultural droughts (Zargar et al, 2011). However the SPI is also recommended for the characterization of meteorological droughts all over the world (Blain, 2012). The Standard Precipitation Evapotranspiration Index (SPEI) factors evapotranspiration and precipitation in its computation. Other indicators that have been popularly used in the characterization of drought events include: Reconnaissance Drought Index (EDI), Palmer Drought Severity Index (PDSI), Surface Water Supply Index (SWSI) and Effective Drought Index (EDI).
Studies on drought over Nigeria have always considered subregions. In this study, we aim to investigate the statistics of drought across the different climatic zones of Nigeria using SPI and SPEI. The correlation between the two drought indices will be investigated, as well as, their regression analysis, trend and frequency distributions. Results from this study is expected to show the comparative drought risks across the different regions in Nigeria and provide information for strategic planning and adaptation.
2 Methodology
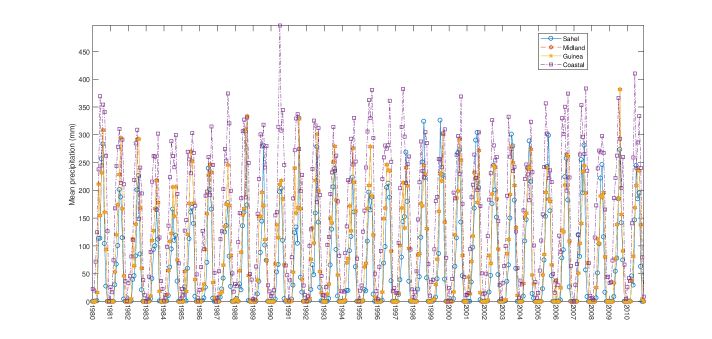
Eighteen locations across the four climatic zones of Nigeria were considered in this study. The geographical coordinates and statistics of the location are presented in Table 1 and the temporal variation of mean regional precipitation is shown in Figure 1. Monthly precipitation, minimum temperature and maximum temperature data were obtained from the archives of the Nigerian Meteorological Services from 1980 - 2010.
The Standardized Precipitation Index (SPI) is based on the use of probability distribution to evaluate the departure of precipitation during a time span from the mean value (Oguntunde et al, 2017). The parameters, and , of a gamma distribution obtained are from maximum likelihood estimation when precipitation data is fitted to a gamma distribution given by
| (1) |
where , is the gamma function, and are the form and scale parameter respectively. The Standardized Potential Evaporation Index is computed in the same way, however, with the consideration of potential evapotranspiration (Oguntunde et al, 2017; Oloruntade et al, 2017). The drought indices are classified as
| (2) |
| Region | Location | LATITUDE | LONGITUDE | TOTAL (mm) | MEAN (mm) | STDEV |
|---|---|---|---|---|---|---|
| Sahel | Sokoto | 13.03 | 5.12 | 36057.0 | 96.93 | 116.29 |
| Maiduguri | 11.5 | 13.1 | 17847.7 | 47.98 | 75.60 | |
| Kano | 12.02 | 8.32 | 31236.3 | 83.97 | 130.51 | |
| Katsina | 12.51 | 7.33 | 15390.3 | 41.37 | 83.50 | |
| Midland | Kaduna | 10.28 | 7.25 | 32226.0 | 86.63 | 112.66 |
| Minna | 9.38 | 6.31 | 37312.2 | 100.30 | 106.65 | |
| Yola | 9.15 | 12.3 | 27500.9 | 73.93 | 84.38 | |
| Guinea Savannah | Lokoja | 7.47 | 6.37 | 38280.5 | 102.90 | 101.79 |
| Markudi | 7.45 | 8.53 | 36528.8 | 98.20 | 109.41 | |
| Warri | 5.52 | 5.75 | 85674.7 | 230.31 | 189.02 | |
| Coastal | Lagos | 6.61 | 3.62 | 50944.4 | 136.95 | 146.50 |
| Akure | 7.25 | 5.19 | 44495.6 | 119.61 | 94.67 | |
| Port Harcourt | 4.41 | 6.59 | 71602.6 | 192.48 | 147.79 | |
| Owerri | 5.27 | 6.59 | 73599.8 | 197.85 | 161.34 | |
| Enugu | 6.27 | 7.29 | 53822.4 | 144.68 | 131.01 | |
| Calabar | 4.58 | 8.21 | 90572.6 | 243.47 | 181.65 | |
| Ogoja | 6.66 | 8.79 | 58444.0 | 157.11 | 148.04 | |
| Abeokuta | 7.15 | 5.15 | 36002.0 | 100.01 | 90.81 |
3 Results and Discussion
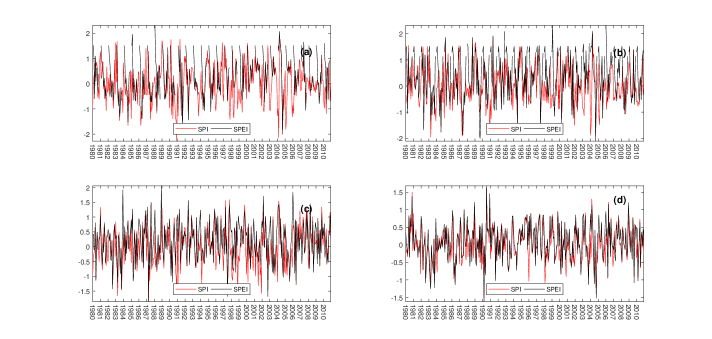
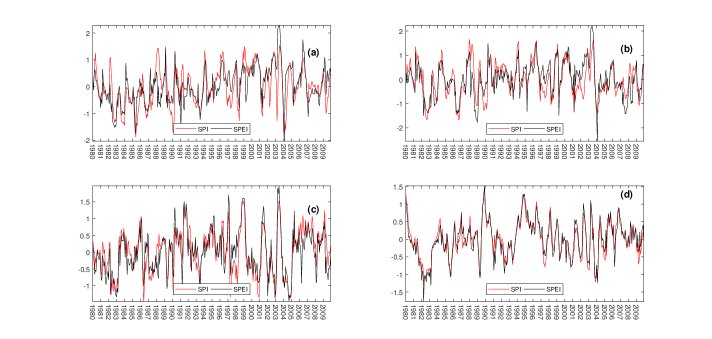
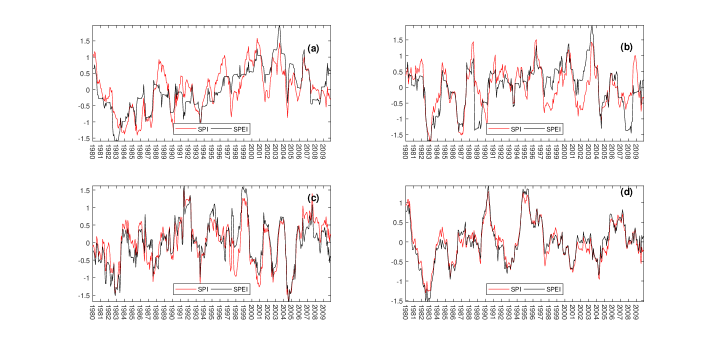
The temporal evolution of mean SPI and SPEI values at 1-, 3-, 6- and 12-month timescales are presented in Figures 2 - 5 respectively. The SPEI values at 1-month in the Sahel and Midland region showed periodic occurrences which can be attributed to the short but intense dry seasons experienced in the regions (Fig. 2 a-b). The drought intensity in these regions tend to be higher than the intensity in the Guinea Savannah and Coastal regions. At 3-month scale (Figure 3), the seemingly periodicity in mean SPI/SPEI values persist in the Sahel but not in the Midlands. A significant drought event could be seen in 1982-1983 in the Coastal region. Considering the temporal variation of the indices at 6- and 12-month timescales, periodicity was no more obvious in the Sahel region. Prominent drought regimes and general agreement between SPI and SPEI could be observed 1983, 1990, 1992/93 and 2004. The drought period observed are in agreement with reported drought periods in the region (Oguntunde et al, 2017; Ndehedehe et al, 2016).

The linear correlation between SPI and SPEI at different time scales (1,3,6,12) for the locations in each climatic zones is presented in Table 2. In the Sahel region, the strongest was observed at 12-month. Maiduguri has the lowest correlation values at both 3- and 6-month scales while Sokoto and Katsina have the lowest correlation values between SPI and SPEI at 1- and 12-month scale respectively. In the Midland area, Kaduna has the highest correlation values between SPI and SPEI while the lowest correlation values were observed in Yola. Warri, in the Guinea savannah, was found to have the highest correlation values for the region at all scales. The lowest correlation values were obtained at the 1-month scale. An unusually low correlation value was observed at 3-month scale for Calabar in the coastal region. The correlation values were observed to increase in the progression Sahel - Midland area - Guinea Savanna - coastal area. This increasing trend could be attributed to the reducing effect of evapotranspiration as one move from the northern region to the coastal area of the country. In a study over the Niger-South basin of Nigeria, (Oloruntade et al, 2017) obtained correlation in the range . This range is lower than the values obtained in this work for the same region. The differences can be attributed to different data sources and time range. SPI and SPEI have better comparative performance at longer time scales than shorter durations.
A linear regression of the two indices showed the same trend as correlation analysis (Table 3). The best fit in the Sahel region was found in Kano at 12-month scale with slope and values close to 1. The weakest fits were observed in Sokoto at 1- and 3-month scales. The regression fit for the Sahel region showed better fit at 12-month scale compared to other scales. In the Midland region, the worst regression fit could be found in Yola. The location has the lowest slope and values for the region. The performance of the fit were better in the Guinea Savannah and the Coastal region. Calabar showed perfect fits with good coefficient of determination for the Coastal region. The Guinea Savannah and Coastal regions of Nigeria have longer wet seasons, short dry seasons and larger amount of precipitation than the Midland and Sahel region.
Trend over the study period was computed for SPI and SPEI (Table 4) using Mann-Kendall algorithm. Trends in SPI and SPEI at all timescales were in the range and respectively. The trend values obtained for SPI are less than the range of obtained in Southern Portugal at 12-month timescale (Costa, 2011). In the Sahel region, all locations exhibit positive trends at all timescales except Sokoto which has negative trends. In the Midland region, Minna has positive trends at all timescales while the other two locations in the region showed negative trends. In the Guinea Savannah, Warri is the exception with negative trend at all time scales while in the Coastal region, Lagos, Akure and Owerri are the stations with negative trends. The varying trend signs within regions are attributed to local dynamics and topography. Locations in all the region have the same trend sign in both SPI and SPEI except Markurdi, Warri and Akure at the 1-month timescale; Lagos, Oweri and Akure at 3-month timescale; Yola, Lagos and Owerri at 6-month timescale; and Owerri at 12-month timescale. All these locations have negative signs in SPI but positive signs in SPEI computation. The trends were found to be significant at 95% confidence interval except locations in Sahel and Midland regions at 1- and 3- months timescale for SPEI and Sokoto, Minna and Yola at 6- and 12-months timescales. The trend values are similar to those obtained in Cyprus by Katsanos et al (2018) but lower than that reported by Oguntunde et al (2017) for the same region at 12-month scale. In the report by Oguntunde et al (2017), a longer period of time was used, different data source as well as a different method of computing the slope was used, and ecological zones were considered rather than climatic zones at only 12-month timescale.
Frequency distribution of SPI and SPEI classes are shown in Tables 5 - 8 at 1-, 3-, 6-, and 12-months timescales respectively. In the Sahel and Midland regions, the occurrences of near normal events were greater in SPI than SPEI at 1- and 3-months timescales as opposed to the occurrences being greater in SPEI for both Guinea Savannah and Coastal regions. This trend was not noticeable at 6- and 12-months timescales. This implies that both SPI and SPEI have comparative performance at higher timescales than shorter timescales. It can be inferred that atmospheric-land interactions such as El Nino and Atlantic Nino 1 influence drought at short time scales. Atlantic Nino 1 has been reported to have positive correlation with SPEI in the coastal regions of West Africa but negative correlation in the Sahel regions (Adeniyi and Dilau, 2018). It has also been posited that El-Nino Southern Oscillation-ENSO, Atlantic Multi-decadal Oscillation-AMO, and Atlantic Meridional Mode-AMM can be responsible for the results obtained 12-month timescale (Ndehedehe et al, 2016). Near normal condition was found to be predominant in all the analysis. A noticeable trend in all climatic zones is the the higher number of occurrences of MD values in SPI than the MD values obtained under SPEI.
4 Conclusion
In this study, the performance and statistics of two drought indices were investigated over different climatic zones of Nigeria. The study considered eighteen locations over a period of thirty-one years. At 1- and 3- months scale, both SPI and SPEI are predominantly periodic in the Sahel and Midland regions indicating a harsh and severe dry season. At longer time scales, SPI and SPEI have stronger correlation than at shorter time scales. This trend was also reflected in the regression coefficient between the two indices. The regression fits were better in the southern part of the country than the northern part of the country. Comparative trend analysis of drought over Nigeria using SPI and SPEI were also carried out. Results obtained indicate that small but positive significant trends were predominant over the region in the period under consideration. Finally, the statistical distribution of both SPI and SPEI at different time scales reveal the prevalence of near normal conditions. It is posited that coupled ocean-atmosphere is responsible for the statistical distribution across the different climatic regions.
There is the need for spectral analysis to determine the frequency of occurrence of drought in the region. Furthermore, the role of ocean-atmosphere coupling such as ENSO in drought frequency over the region is worth of investigation.
| Scale | |||||
|---|---|---|---|---|---|
| Region | Location | 1 | 3 | 6 | 12 |
| Sahel | Sokoto | 0.607 | 0.631 | 0.734 | 0.787 |
| Maiduguri | 0.651 | 0.609 | 0.645 | 0.736 | |
| Kano | 0.699 | 0.693 | 0.783 | 0.899 | |
| Katsina | 0.712 | 0.649 | 0.667 | 0.733 | |
| Midland | Kaduna | 0.726 | 0.706 | 0.830 | 0.869 |
| Minna | 0.650 | 0.718 | 0.792 | 0.781 | |
| Yola | 0.639 | 0.548 | 0.622 | 0.542 | |
| Guinea Savannah | Lokoja | 0.765 | 0.793 | 0.855 | 0.877 |
| Markudi | 0.685 | 0.791 | 0.876 | 0.922 | |
| Warri | 0.932 | 0.955 | 0.958 | 0.946 | |
| Coastal | Lagos | 0.899 | 0.928 | 0.944 | 0.956 |
| Akure | 0.860 | 0.847 | 0.876 | 0.858 | |
| Port Harcourt | 0.932 | 0.908 | 0.935 | 0.954 | |
| Owerri | 0.915 | 0.924 | 0.939 | 0.939 | |
| Enugu | 0.796 | 0.876 | 0.942 | 0.953 | |
| Calabar | 0.945 | 0.069 | 0.974 | 0.973 | |
| Ogoja | 0.822 | 0.870 | 0.936 | 0.949 | |
| Abeokuta | 0.827 | 0.849 | 0.861 | 0.859 | |
| Regression slope | |||||||||
|---|---|---|---|---|---|---|---|---|---|
| Scale | Scale | ||||||||
| Region | Location | 1 | 3 | 6 | 12 | 1 | 3 | 6 | 12 |
| Sahel | Sokoto | 0.634 | 0.656 | 0.752 | 0.804 | 0.369 | 0.398 | 0.538 | 0.619 |
| Maiduguri | 0.645 | 0.612 | 0.644 | 0.753 | 0.424 | 0.371 | 0.417 | 0.542 | |
| Kano | 0.681 | 0.663 | 0.760 | 0.916 | 0.488 | 0.481 | 0.614 | 0.809 | |
| Katsina | 0.667 | 0.624 | 0.661 | 0.748 | 0.507 | 0.421 | 0.445 | 0.537 | |
| Midland | Kaduna | 0.758 | 0.737 | 0.842 | 0.888 | 0.526 | 0.498 | 0.689 | 0.755 |
| Minna | 0.662 | 0.697 | 0.802 | 0.781 | 0.423 | 0.516 | 0.627 | 0.610 | |
| Yola | 0.655 | 0.567 | 0.636 | 0.556 | 0.408 | 0.300 | 0.387 | 0.294 | |
| Guinea Savannah | Lokoja | 0.727 | 0.763 | 0.871 | 0.897 | 0.586 | 0.629 | 0.731 | 0.769 |
| Markudi | 0.632 | 0.746 | 0.886 | 0.941 | 0.470 | 0.626 | 0.767 | 0.851 | |
| Warri | 0.901 | 0.955 | 0.978 | 0.964 | 0.868 | 0.913 | 0.918 | 0.895 | |
| Coastal | Lagos | 0.850 | 0.930 | 0.960 | 0.980 | 0.808 | 0.861 | 0.892 | 0.913 |
| Akure | 0.800 | 0.852 | 0.889 | 0.874 | 0.740 | 0.718 | 0.768 | 0.736 | |
| Port Harcourt | 0.914 | 0.927 | 0.951 | 0.976 | 0.869 | 0.824 | 0.874 | 0.909 | |
| Owerri | 0.883 | 0.937 | 0.952 | 0.960 | 0.837 | 0.855 | 0.882 | 0.883 | |
| Enugu | 0.742 | 0.877 | 0.968 | 0.976 | 0.634 | 0.768 | 0.887 | 0.908 | |
| Calabar | 0.921 | 1.000 | 1.000 | 1.000 | 0.893 | 0.939 | 0.949 | 0.948 | |
| Ogoja | 0.755 | 0.861 | 0.953 | 0.966 | 0.676 | 0.756 | 0.966 | 0.901 | |
| Abeokuta | 0.788 | 0.854 | 0.887 | 0.880 | 0.685 | 0.721 | 0.741 | 0.739 | |
| SPI | SPEI | ||||||||
|---|---|---|---|---|---|---|---|---|---|
| Scale | Scale | ||||||||
| Region | Location | 1 | 3 | 6 | 12 | 1 | 3 | 6 | 12 |
| Sahel | Sokoto | -0.00159 | -0.00214 | -0.00255* | -0.00349* | -0.00047 | -0.00071 | -0.00082 | -0.00135 |
| Maiduguri | 0.0004 | 0.00107 | 0.00207 | 0.00354 | 0.00288 | 0.00373 | 0.00431 | 0.00645 | |
| Kano | 0.00132 | 0.00225 | 0.0037 | 0.00587 | 0.00403 | 0.00444 | 0.00474 | 0.007 | |
| Katsina | 0.00142 | 0.0024 | 0.00345 | 0.00457 | 0.00188 | 0.00273 | 0.00294 | 0.00356 | |
| Midland | Kaduna | -0.00026 | -0.00057 | -0.00069 | -0.00095 | -0.00047 | -0.00071 | -0.00082 | -0.00135 |
| Minna | 0.00082 | 0.00131 | 0.00222 | 0.00362* | 0.00124 | 0.00192 | 0.00325 | 0.00517 | |
| Yola | -0.00094 | -0.00099 | -0.00142* | -0.00201* | -0.00024 | -0.00001 | 0.00008 | -0.00013 | |
| Guinea Sav. | Lokoja | 0.00169 | 0.00249 | 0.00308 | 0.00369 | 0.00092 | 0.00176 | 0.00275 | 0.00377 |
| Markudi | -0.00005 | 0.00024 | 0.00075 | 0.00082 | 0.00014 | 0.00055 | 0.00108 | 0.00095 | |
| Warri | -0.00002 | -0.00058 | -0.00094 | -0.00148 | 0.00007 | -0.00039 | -0.00075 | -0.00099 | |
| Coastal | Lagos | -0.00008 | -0.00005 | -0.0002 | -0.00069 | -0.00001 | 0.00022 | 0.00009 | -0.00026 |
| Akure | -0.00079 | -0.00131 | -0.0017 | -0.00211 | 0.00011 | 0.00004 | -0.00041 | -0.0006 | |
| Port H. | 0.00016 | 0.00037 | 0.00024 | 0.00043 | 0.00025 | 0.00063 | 0.00067 | 0.0009 | |
| Owerri | -0.00044 | -0.00062 | -0.00082 | -0.00116 | -0.00003 | 0.00025 | 0.00015 | 0.0001 | |
| Enugu | 0.00047 | 0.00112 | 0.00116 | 0.00129 | 0.0006 | 0.00133 | 0.0017 | 0.00203 | |
| Calabar | 0.00063 | 0.00137 | 0.00149 | 0.00172 | 0.00063 | 0.00165 | 0.00183 | 0.00214 | |
| Ogoja | 0.00097 | 0.00174 | 0.00227 | 0.00254 | 0.00079 | 0.00146 | 0.00215 | 0.00286 | |
| Abeokuta | 0.00021 | 0.00068 | 0.00126 | 0.00171 | 0.00089 | 0.0016 | 0.00242 | 0.00325 | |
| Region | Location | SPI | SPEI | ||||||||||||
|---|---|---|---|---|---|---|---|---|---|---|---|---|---|---|---|
| EW | VW | MW | NN | MD | SD | ED | EW | VW | MW | NN | MD | SD | ED | ||
| Sahel | Sokoto | 5 | 17 | 43 | 235 | 49 | 18 | 5 | 5 | 42 | 21 | 173 | 23 | 10 | 5 |
| Maiduguri | 5 | 19 | 42 | 242 | 40 | 20 | 4 | 5 | 6 | 54 | 158 | 16 | 5 | 4 | |
| Kano | 4 | 21 | 40 | 250 | 35 | 16 | 6 | 5 | 8 | 52 | 159 | 10 | 11 | 3 | |
| Katsina | 3 | 20 | 42 | 252 | 28 | 21 | 6 | 5 | 13 | 21 | 185 | 14 | 8 | 2 | |
| Midland | Kaduna | 9 | 15 | 38 | 249 | 35 | 21 | 5 | 5 | 42 | 21 | 173 | 23 | 10 | 5 |
| Minna | 6 | 15 | 45 | 245 | 37 | 20 | 4 | 7 | 46 | 53 | 201 | 17 | 12 | 5 | |
| Yola | 8 | 15 | 31 | 255 | 38 | 20 | 5 | 3 | 40 | 24 | 176 | 19 | 12 | 5 | |
| Guinea | Lokoja | 7 | 15 | 43 | 243 | 43 | 15 | 6 | 10 | 9 | 37 | 245 | 26 | 8 | 6 |
| Markudi | 7 | 17 | 37 | 251 | 39 | 13 | 8 | 7 | 20 | 59 | 253 | 17 | 13 | 3 | |
| Warri | 7 | 22 | 33 | 250 | 34 | 23 | 3 | 6 | 16 | 34 | 269 | 21 | 20 | 6 | |
| Coastal | Lagos | 9 | 16 | 38 | 247 | 45 | 13 | 4 | 8 | 12 | 37 | 275 | 21 | 11 | 8 |
| Akure | 7 | 18 | 36 | 246 | 38 | 22 | 5 | 3 | 14 | 43 | 269 | 17 | 22 | 4 | |
| PH | 7 | 16 | 41 | 244 | 41 | 19 | 4 | 5 | 17 | 42 | 255 | 33 | 13 | 7 | |
| Owerri | 5 | 22 | 38 | 249 | 33 | 19 | 6 | 5 | 19 | 36 | 270 | 24 | 7 | 11 | |
| Enugu | 7 | 17 | 41 | 245 | 38 | 16 | 8 | 4 | 23 | 34 | 276 | 17 | 13 | 5 | |
| Calabar | 4 | 24 | 45 | 235 | 45 | 14 | 5 | 3 | 15 | 45 | 268 | 23 | 8 | 10 | |
| Ogoja | 10 | 18 | 28 | 262 | 31 | 16 | 7 | 9 | 18 | 32 | 273 | 24 | 9 | 7 | |
| Abeokuta | 5 | 23 | 35 | 239 | 37 | 17 | 4 | 7 | 16 | 30 | 275 | 14 | 10 | 8 | |
| Region | Location | SPI | SPEI | ||||||||||||
|---|---|---|---|---|---|---|---|---|---|---|---|---|---|---|---|
| EW | VW | MW | NN | MD | SD | ED | EW | VW | MW | NN | MD | SD | ED | ||
| Sahel | Sokoto | 4 | 18 | 45 | 221 | 50 | 19 | 3 | 7 | 40 | 25 | 211 | 27 | 12 | 8 |
| Maiduguri | 4 | 21 | 34 | 230 | 52 | 14 | 5 | 8 | 7 | 54 | 197 | 19 | 10 | 5 | |
| Kano | 12 | 11 | 30 | 255 | 28 | 10 | 14 | 9 | 8 | 55 | 197 | 17 | 11 | 3 | |
| Katsina | 5 | 19 | 39 | 233 | 40 | 14 | 10 | 5 | 14 | 30 | 216 | 21 | 10 | 4 | |
| Midland | Kaduna | 5 | 14 | 37 | 240 | 37 | 22 | 5 | 7 | 40 | 25 | 211 | 27 | 12 | 8 |
| Minna | 2 | 23 | 46 | 231 | 37 | 13 | 8 | 5 | 18 | 33 | 264 | 22 | 8 | 10 | |
| Yola | 6 | 13 | 43 | 233 | 39 | 21 | 5 | 7 | 38 | 61 | 213 | 23 | 9 | 9 | |
| Guinea Sav. | Lokoja | 3 | 18 | 48 | 228 | 40 | 18 | 5 | 7 | 15 | 41 | 254 | 24 | 12 | 7 |
| Markudi | 7 | 11 | 49 | 228 | 40 | 22 | 3 | 8 | 11 | 42 | 254 | 28 | 16 | 1 | |
| Warri | 7 | 19 | 31 | 244 | 36 | 18 | 5 | 6 | 18 | 32 | 244 | 34 | 19 | 7 | |
| Coastal | Lagos | 5 | 19 | 42 | 230 | 44 | 16 | 4 | 3 | 17 | 37 | 244 | 33 | 15 | 11 |
| Akure | 7 | 18 | 35 | 233 | 45 | 17 | 5 | 2 | 14 | 42 | 235 | 35 | 23 | 9 | |
| PH | 4 | 22 | 28 | 244 | 39 | 17 | 6 | 7 | 11 | 37 | 252 | 25 | 18 | 10 | |
| Owerri | 6 | 18 | 33 | 236 | 42 | 21 | 4 | 7 | 12 | 30 | 249 | 37 | 18 | 7 | |
| Enugu | 7 | 14 | 31 | 241 | 46 | 14 | 7 | 2 | 18 | 40 | 257 | 20 | 12 | 11 | |
| Calabar | 7 | 17 | 36 | 239 | 39 | 12 | 10 | 8 | 9 | 40 | 250 | 26 | 16 | 11 | |
| Ogoja | 5 | 21 | 31 | 248 | 30 | 20 | 5 | 8 | 19 | 28 | 260 | 23 | 12 | 10 | |
| Abeokuta | 6 | 19 | 33 | 232 | 38 | 15 | 5 | 7 | 9 | 44 | 232 | 30 | 18 | 8 | |
| Region | Location | SPI | SPEI | ||||||||||||
|---|---|---|---|---|---|---|---|---|---|---|---|---|---|---|---|
| EW | VW | MW | NN | MD | SD | ED | EW | VW | MW | NN | MD | SD | ED | ||
| Sahel | Sokoto | 4 | 15 | 38 | 238 | 41 | 22 | 2 | 7 | 12 | 26 | 254 | 33 | 18 | 10 |
| Maiduguri | 3 | 20 | 34 | 228 | 51 | 22 | 2 | 9 | 15 | 27 | 258 | 29 | 14 | 8 | |
| Kano | 13 | 11 | 25 | 254 | 35 | 11 | 11 | 10 | 12 | 36 | 250 | 31 | 18 | 3 | |
| Katsina | 0 | 23 | 46 | 225 | 43 | 20 | 3 | 6 | 17 | 42 | 248 | 26 | 17 | 4 | |
| Midland | Kaduna | 6 | 12 | 39 | 240 | 34 | 26 | 3 | 7 | 12 | 26 | 254 | 33 | 18 | 10 |
| Minna | 1 | 20 | 51 | 225 | 40 | 16 | 7 | 2 | 15 | 36 | 258 | 21 | 11 | 17 | |
| Yola | 7 | 15 | 31 | 244 | 33 | 23 | 7 | 4 | 18 | 25 | 263 | 27 | 9 | 14 | |
| Guinea Sav. | Lokoja | 3 | 24 | 39 | 231 | 40 | 19 | 4 | 9 | 17 | 31 | 246 | 33 | 18 | 6 |
| Markudi | 7 | 17 | 27 | 249 | 31 | 24 | 5 | 9 | 15 | 28 | 245 | 34 | 28 | 1 | |
| Warri | 4 | 17 | 44 | 239 | 31 | 22 | 3 | 12 | 11 | 38 | 243 | 39 | 12 | 5 | |
| Coastal | Lagos | 2 | 22 | 36 | 237 | 35 | 24 | 4 | 0 | 21 | 34 | 248 | 27 | 16 | 14 |
| Akure | 9 | 15 | 30 | 242 | 39 | 20 | 5 | 5 | 14 | 31 | 247 | 31 | 21 | 11 | |
| PH | 4 | 21 | 33 | 239 | 38 | 21 | 4 | 5 | 20 | 36 | 239 | 35 | 18 | 7 | |
| Owerri | 8 | 12 | 37 | 244 | 27 | 28 | 4 | 10 | 12 | 33 | 244 | 32 | 19 | 10 | |
| Enugu | 5 | 12 | 38 | 233 | 51 | 14 | 7 | 4 | 9 | 41 | 258 | 26 | 7 | 15 | |
| Calabar | 7 | 18 | 29 | 252 | 30 | 16 | 8 | 10 | 16 | 25 | 261 | 27 | 10 | 11 | |
| Ogoja | 4 | 22 | 39 | 237 | 32 | 22 | 4 | 11 | 18 | 33 | 244 | 30 | 14 | 10 | |
| Abeokuta | 2 | 20 | 42 | 229 | 34 | 16 | 5 | 6 | 11 | 40 | 228 | 30 | 28 | 5 | |
| Region | Location | SPI | SPEI | ||||||||||||
|---|---|---|---|---|---|---|---|---|---|---|---|---|---|---|---|
| EW | VW | MW | NN | MD | SD | ED | EW | VW | MW | NN | MD | SD | ED | ||
| Sahel | Sokoto | 3 | 15 | 48 | 215 | 57 | 22 | 0 | 7 | 12 | 15 | 262 | 24 | 29 | 11 |
| Maiduguri | 1 | 20 | 43 | 228 | 47 | 20 | 1 | 0 | 29 | 22 | 246 | 29 | 22 | 12 | |
| Kano | 7 | 26 | 20 | 253 | 40 | 2 | 12 | 1 | 30 | 34 | 222 | 42 | 31 | 0 | |
| Katsina | 3 | 17 | 39 | 227 | 51 | 23 | 0 | 2 | 16 | 66 | 216 | 28 | 25 | 7 | |
| Midland | Kaduna | 5 | 15 | 36 | 235 | 36 | 29 | 4 | 7 | 12 | 15 | 262 | 24 | 29 | 11 |
| Minna | 7 | 12 | 36 | 248 | 27 | 21 | 9 | 0 | 14 | 40 | 263 | 7 | 11 | 25 | |
| Yola | 5 | 23 | 21 | 245 | 35 | 27 | 4 | 0 | 13 | 42 | 255 | 24 | 5 | 21 | |
| Guinea Sav. | Lokoja | 2 | 25 | 38 | 233 | 33 | 29 | 0 | 8 | 14 | 48 | 223 | 42 | 17 | 8 |
| Markudi | 12 | 5 | 41 | 242 | 37 | 17 | 6 | 15 | 19 | 13 | 252 | 35 | 20 | 6 | |
| Warri | 3 | 21 | 47 | 224 | 43 | 19 | 3 | 10 | 12 | 37 | 238 | 44 | 14 | 5 | |
| Coastal | Lagos | 6 | 16 | 42 | 235 | 37 | 21 | 3 | 3 | 19 | 38 | 247 | 27 | 13 | 13 |
| Akure | 12 | 12 | 24 | 247 | 40 | 21 | 4 | 17 | 7 | 24 | 256 | 23 | 22 | 11 | |
| PH | 10 | 10 | 39 | 241 | 37 | 18 | 5 | 3 | 17 | 51 | 228 | 33 | 22 | 6 | |
| Owerri | 1 | 29 | 28 | 237 | 39 | 26 | 0 | 12 | 13 | 23 | 262 | 22 | 13 | 15 | |
| Enugu | 5 | 15 | 32 | 239 | 51 | 12 | 6 | 0 | 14 | 49 | 250 | 31 | 3 | 13 | |
| Calabar | 3 | 22 | 37 | 233 | 45 | 16 | 4 | 20 | 14 | 26 | 242 | 39 | 17 | 2 | |
| Ogoja | 1 | 25 | 56 | 221 | 45 | 6 | 6 | 11 | 20 | 48 | 226 | 39 | 10 | 6 | |
| Abeokuta | 0 | 22 | 56 | 211 | 40 | 17 | 2 | 3 | 17 | 46 | 217 | 33 | 20 | 12 | |
References
- Adeniyi and Dilau (2018) Adeniyi MO, Dilau KA (2018) Assessing the link between Atlantic Niño 1 and drought over West Africa using CORDEX regional climate models. Theoretical and Applied Climatology 131(3-4):937–949, URL http://dx.doi.org/10.1007/s00704-016-2018-0
- Adeyemi and Emmanuel (2011) Adeyemi B, Emmanuel I (2011) Monitoring tropospheric radio refractivity over Nigeria using CM-SAF data derived from NOAA-15, 16 and 18 satellites. Indian Journal of Radio and Space Physics 40(6):301–310
- Ahmad et al (2004) Ahmad S, Hussain Z, Qureshi AS, Majeed R, Saleem M (2004) Drought mitigation in Pakistan: current status and options for future strategies, vol 85. IWMI
- Ahmadalipour and Moradkhani (2018) Ahmadalipour A, Moradkhani H (2018) Multi-dimensional assessment of drought vulnerability in Africa: 1960 - 2100. Science of The Total Environment 644:520 – 535, URL http://www.sciencedirect.com/science/article/pii/S0048969718324987
- Blain (2012) Blain GC (2012) Revisiting the probabilistic definition of drought: strengths, limitations and an agrometeorological adaptation. Bragantia 71(1):132–141
- Chen et al (2009) Chen ST, Kuo CC, Yu PS (2009) Historical trends and variability of meteorological droughts in Taiwan. Hydrological sciences journal 54(3):430–441
- Costa (2011) Costa AC (2011) Local patterns and trends of the standardized precipitation index in southern Portugal (1940-1999). Advances in Geosciences 30:11–16, URL http://dx.doi.org/10.5194/adgeo-30-11-2011
- Detges (2017) Detges A (2017) Droughts, state-citizen relations and support for political violence in Sub-Saharan Africa: A micro-level analysis. Political Geography 61:88–98, URL https://doi.org/10.1016/j.polgeo.2017.07.005
- Dracup et al (1980) Dracup JA, Lee KS, Paulson EG (1980) On the definition of droughts. Water Resources Research 16(2):297–302, URL https://agupubs.onlinelibrary.wiley.com/doi/abs/10.1029/WR016i002p00297
- Field et al (2012) Field CB, Barros V, Stocker TF, Dahe Q (2012) Managing the risks of extreme events and disasters to advance climate change adaptation: special report of the intergovernmental panel on climate change. Cambridge University Press
- Fuwape and Ogunjo (2018) Fuwape I, Ogunjo S (2018) Modeling of raining season onset and cessation of tropical rainfall for climate change adaptation in agriculture. arXiv preprint arXiv:181109677
- Gudmundsson and Seneviratne (2015) Gudmundsson L, Seneviratne SI (2015) European drought trends. Proceedings of the International Association of Hydrological Sciences 369:75–79
- Josserand et al (2008) Josserand H, Morrison T, O_Dea J, Dradri S, Hidalgo Sanchis P, Xie H (2008) FAO/WFP crop and food supply assessment mission to the Democratic People’s Republic of Korea. special report. Special Reports and Alerts (FAO)
- Katsanos et al (2018) Katsanos D, Retalis A, Tymvios F, Michaelides S (2018) Study of extreme wet and dry periods in Cyprus using climatic indices. Atmospheric Research 208(August 2017):88–93
- Kayode and Francis (2012) Kayode AJ, Francis OA (2012) Drought intensities in the sudano-sahelian region of nigeria. Journal of Sustainable Society 1(4):88–95
- Keyantash and Dracup (2002) Keyantash J, Dracup JA (2002) The quantification of drought: an evaluation of drought indices. Bulletin of the American Meteorological Society 83(8):1167–1180
- Khan et al (2018) Khan MI, Liu D, Fu Q, Faiz MA (2018) Detecting the persistence of drying trends under changing climate conditions using four meteorological drought indices. Meteorological Applications 25(2):184–194
- Mishra and Singh (2010) Mishra AK, Singh VP (2010) A review of drought concepts. Journal of hydrology 391(1-2):202–216
- Mpelasoka et al (2018) Mpelasoka F, Awange JL, Zerihun A (2018) Influence of coupled ocean-atmosphere phenomena on the Greater Horn of Africa droughts and their implications. Science of the Total Environment 610-611:691–702, URL https://doi.org/10.1016/j.scitotenv.2017.08.109
- Ndehedehe et al (2016) Ndehedehe CE, Agutu NO, Okwuashi O, Ferreira VG (2016) Spatio-temporal variability of droughts and terrestrial water storage over Lake Chad Basin using independent component analysis. Journal of Hydrology 540:106 – 128, URL http://www.sciencedirect.com/science/article/pii/S0022169416303456
- Ogunjo et al (2019) Ogunjo ST, Fuwape IA, Olusegun CF (2019) Impact of large scale oscillation on drought in west africa. arXiv prepring (1901.10145)
- Oguntunde et al (2017) Oguntunde PG, Lischeid G, Abiodun BJ, Dietrich O (2017) Analysis of long-term dry and wet conditions over Nigeria. International Journal of Climatology 37(9):3577–3586, URL https://rmets.onlinelibrary.wiley.com/doi/abs/10.1002/joc.4938
- Oladipo (1995) Oladipo E (1995) Some statistical characteristics of drought area variations in the savanna region of nigeria. Theoretical and Applied climatology 50(3-4):147–155
- Oladipo (1993) Oladipo EO (1993) Some aspects of the spatial characteristics of drought in northern nigeria. Natural Hazards 8(2):171–188
- Oloruntade et al (2017) Oloruntade AJ, Mohammad TA, Ghazali AH, Wayayok A (2017) Analysis of meteorological and hydrological droughts in the Niger-South Basin, Nigeria. Global and Planetary Change 155:225–233, URL http://dx.doi.org/10.1016/j.gloplacha.2017.05.002
- Pachauri and Reisinger (2008) Pachauri R, Reisinger A (2008) Changements climatiques 2007–rapport de synthèse. Rapport GIEC, Genève, Suisse
- Pereira et al (2009) Pereira LS, Cordery I, Iacovides I (2009) Coping with water scarcity: Addressing the challenges. Springer Science & Business Media
- Sordo-Ward et al (2017) Sordo-Ward A, Bejarano MD, Iglesias A, Asenjo V, Garrote L (2017) Analysis of current and future spei droughts in the la plata basin based on results from the regional eta climate model. Water 9(11):857
- Stocker (2014) Stocker T (2014) Climate change 2013: the physical science basis: Working Group I contribution to the Fifth assessment report of the Intergovernmental Panel on Climate Change. Cambridge University Press
- Street-Perrott et al (2000) Street-Perrott FA, Holmes J, Waller M, Allen M, Barber N, Fothergill P, Harkness D, Ivanovich M, Kroon D, Perrott R (2000) Drought and dust deposition in the west african sahel: a 5500-year record from kajemarum oasis, northeastern nigeria. The Holocene 10(3):293–302
- Thornthwaite (1948) Thornthwaite CW (1948) An approach toward a rational classification of climate. Geogr Rev 38:55–94
- Wilhite (1993) Wilhite DA (1993) Planning for drought: A methodology. In: Drought assessment, management, and planning: Theory and case studies, Springer, pp 87–108
- Zargar et al (2011) Zargar A, Sadiq R, Naser B, Khan FI (2011) A review of drought indices. Environmental Reviews 19(NA):333–349