Coherence and density dynamics
of excitons in a single-layer MoS2
reaching the homogeneous limit
Abstract
We measure the coherent nonlinear response of excitons in a single-layer of molybdenum disulphide embedded in hexagonal boron nitride, forming a -BN/MoS2/-BN heterostructure. Using four-wave mixing microscopy and imaging, we correlate the exciton homogeneous and inhomogeneous broadenings. We find that the exciton dynamics is governed by microscopic disorder on top of the ideal crystal properties. Analyzing the exciton ultra-fast density dynamics using amplitude and phase of the response, we investigate the relaxation pathways of the resonantly driven exciton population. The surface protection via encapsulation provides stable monolayer samples with low disorder, avoiding surface contaminations and the resulting exciton broadening and modifications of the dynamics. We identify areas localized to a few microns where the optical response is totally dominated by homogeneous broadening. Across the sample of tens of micrometers, weak inhomogeneous broadening and strain effects are observed, attributed to the remaining interaction with the -BN and imperfections in the encapsulation process.
keywords:
MoS2, 2D materials and heterostructures, coherent nonlinear spectroscopy, microscopy, four-wave mixing, exciton dephasing and disorder, ultrafast dynamicsPresent address: Department of Physics, University of Basel, 4056 Basel, Switzerland
![[Uncaptioned image]](/html/1810.00039/assets/ToC_MoS2FWM5.png)
Context.
Transition metal dichalcogenides (TMDs) are lamellar compounds held together by van der Waals inter-layer interactions. For this reason, they can be exfoliated down to a single-layer (SL), similar to graphene obtained from graphite. Even though the inter-layer interactions are weak, they have an important effect on the band structure of TMDs, moving them towards an indirect band gap. When thinning bulk crystals down to SLs, many TMDs can be converted to a direct band gap semiconductor, as first shown for MoS2. The discovery of efficient emission and absorption of light in SL TMDs, facilitated by creation of excitons (EXs) of high binding energy and their fast radiative recombination1, 2, made two-dimensional TMDs candidates for next generation optoelectronics. Additionally, the symmetry and chemical composition of the atomic lattice of TMDs enable, besides their flexibility and partial transparency, a wealth of innovative application concepts3, 4, 5, 6, 7.
Among semiconducting TMDs, MoS2 has been the most studied, because of its expected superior stability in atmospheric conditions. Several recent observations nevertheless challenge this expectation. The measured EX linewidth has been on the order of several tens of meV even at low temperatures8, 4, 9, 6, 7, 10, 11, 12. These high values indicate an inhomogeneous broadening () of the EX transition more than an order of magnitude above the homogenenous broadening () expected in the meV range13. The dominating inhomogeneities () in SL MoS2 conceal the intrinsic properties of the EXs resulting from the underlying band structure, which is still under debate14, 15, 16. Presumed origins of observed in the experiments down to low temperature are adsorbed impurities and crystal defects such as vacancies, strongly affecting the quantum yield17, 18. Another source of inhomogeneous broadening is the substrate onto which the two-dimensional material is typically deposited. The most common substrate used to fabricate optoelectronic devices, a thin thermal oxide (silica) layer on silicon wafers, is known to be corrugated and to contain charged impurities, generating a disorder potential landscape for EXs in the supported TMD layer.
Recently, deterministic transfer methods19, developed to stack two-dimensional materials in the form of so-called van der Waals heterostructures20, have been applied to prepare MoS2 SLs sandwiched between two thin hexagonal boron nitride (h-BN) layers13, 21, 22. In these structures, the distance between MoS2 and the charged impurities in SiO2 and possible adhered impurities on the top surface is set by the respective -BN thicknesses and is typically several tens of nanometers (nm). Moreover, the van der Waals interaction is thought to promote a close, conformal and very flat contact at the MoS2/h-BN interface (with typically few Å interfacial distances23) by expelling adsorbed molecules sideways, much like a flat-iron would eliminate the pleats of a clothing. In such samples, photoluminescence (PL) revealed sharp excitonic features of a few meV width, approaching the expected homogenous limit13. The narrow emission allowed to deepen the understanding of the excitonic complexes involving different valleys13 and to observe the EX’s excited states22 in MoS2 SLs. The encapsulation strategy has also been employed to reduce in other TMDs24, 25, 21, 26.
Rationale and methodology.
The question arises if could be suppressed with this method sufficiently to provide a dominating radiative broadening and a resulting long-range exciton-polariton formation. Towards this, can one show correlations between and ? Such fundamental issues are relevant for spectroscopists and material scientists exploring optical properties of TMD SLs and, in a broader context, for condensed matter physicists investigating two-dimensional systems. We note that the EX spectral line-shape measured in linear transmission or reflection13, 21, 22 is a convolution of and . Separating them, for example by applying line-shape fits such as a Voigt profile, requires the prior knowledge of homogeneous and inhomogeneous line-shapes. For example, in the limit , the lineshape is Gaussian, such that cannot be reliably estimated. Interestingly, the EX emission measured in non-resonantly excited PL can show narrower linewidths than those retrieved via resonant absorption. This can be understood as due to the carrier and EX relaxation selecting local potential minima at low temperatures, prior to EX recombination.
To separate homogeneous from inhomogeneous broadening in the EX line-shape, nonlinear spectroscopy, specifically four-wave mixing (FWM), is particularly suited. FWM driven on an inhomogeneously broadened optical transition - for example created by a spatially varying EX transition in TMDs - forms a photon echo27, 28, 29. Its temporal width is determined by , assuming that the excitation pulses are sufficiently short with respect to . Conversely, its amplitude decay with delay time between the first two exciting pulses, i. e. , is only due to the microscopic EX dephasing. In case of a simple exponential decay it determines the full width at half maximum (FWHM) of the homogeneous linewidth , where denotes the EX dephasing time. Only in the case of vanishing , the latter can be read from the FWM transient, taking the form of a free induction decay, overcoming the necessity to scan . This however is only known a posteriori. Since the inhomogeneous broadening is due to the spatial variation of the EX energy on the scale of its radius of a few nm, it can also vary on longer scales spatially across the sample surface. Furthermore, since also the homogeneous broadening is depending on this spatial variation, the measured pair is a spatially varying quantity on a length scale with a lower limit given by the size of the sample region probed by the optical excitation, and an upper limit given by the size of the investigated sample. The spatial variations across the flake can be due to strain from the substrate or encapsulating layers30, the dielectric environment, the density of impurities and defects, and the free carrier concentration. These mechanisms give rise to the disorder, affecting EXs’ radiative rates31, and thus . The disordered potential landscape results in varying EX localization lengths and produces different sets of EX energy levels32, determining and affecting a population lifetime .
Enhanced spatial and temporal resolution is required to experimentally investigate the above issues. It is thus instructive to study TMD SLs with FWM micro-spectroscopy, resolving the signal on a 100 femto-second (fs) time and 300 nm spatial scale28, 29. In the employed implementation, the exciting laser pulses propagate co-linearly in the same spatial mode, while the signal is discerned via optical heterodyning. This technique allows us to spatially resolve and , revealing correlations between EX’s dephasing and . The signal to noise in this experiment is increased compared to more traditional two-dimensional systems, such as GaAs quantum wells, by the large oscillator strength of EXs in MoS2 SLs. The latter generates substantial multi-photon nonlinear responses33, 34, including FWM as its amplitude (intensity), scales as (), respectively.
Results.
In this work, we report FWM microscopy of two heterostructures composed of a SL MoS2 flake encapsulated by layers of a high quality -BN35. Details regarding sample fabrication are provided in the Methods section. In contrast to MoSe228, WSe2 and WS229 SLs, we find that encapsulation is essential to observe a strong, coherent, nonlinear optical response in exfoliated MoS2 SLs. By analyzing the FWM transients acquired in the first investigated sample which exhibits more disorder (sample A), we assess homogeneous and inhomogeneous contributions to the EX spectral line-shape. We find that the encapsulation leads to a global reduction of , down to a few meV, comparable to the homogeneous broadening. In some micron sized areas of the sample, a decrease of correlated with an enhanced FWM signal can be observed. We exploit the varying inhomogeneous broadening across the sample to investigate the impact of EX disorder onto their coherence dynamics, occurring at a pico-second (ps) time scale. The retrieved correlations between , , and provide fundamental insights into EX localization and dynamics in a disordered two-dimensional landscape. Using the second sample, with significantly less disorder (sample B), we demonstrate the EX optical response in its homogeneous limit. In such conditions, we assess the phonon-induced homogeneous broadening with increasing temperature. We then evaluate the excitation-induced dephasing with increasing EX density. Finally, the dynamics of the EX density after resonant excitation is unveiled. On a picosecond time scale we resolve an initially dominating radiative decay28, 36, competing with non-radiative redistribution into optically dark states. The remaining EX density is scattered back to the optically bright EXs states and recombines (radiatively and non-radiatively) assisted by a three-exciton decay process visible on a nanosecond timescale. The coherent detection allows to disentangle the EX populations in the different bright and dark states. They create a different phase of the response depending on the phase of the complex EX renormalization of the optically probed bright EXs due to Coulomb and exchange interaction with the total EX density. These contributions involve different EX populations, each corresponding to charge carriers in the inequivalent K and K’ valleys of the electronic band structure37. For example, broadening described by an imaginary part of the interaction is in quadrature with energy shifts described by the real part of the interaction. The different relaxation processes contribute to the FWM amplitude with different phases, imprinting unusual signatures in the measured density dynamics of the FWM amplitude due to constructive and destructive interferences37.
Characterization with linear spectroscopy.
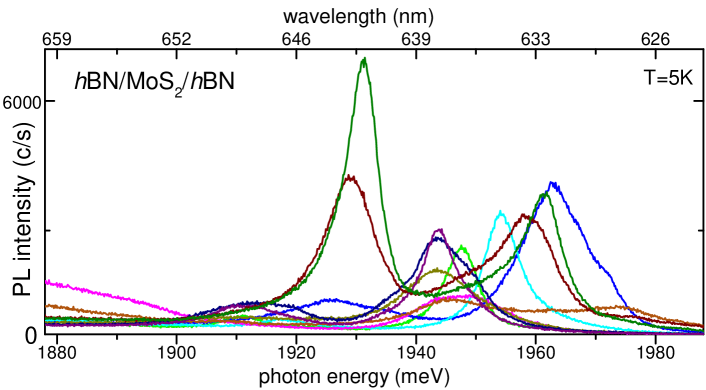
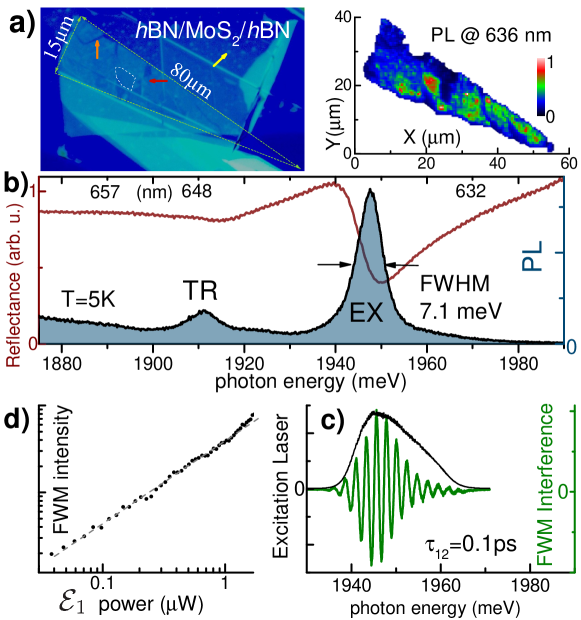
The optical pictograph of the sample A, containing an elongated MoS2 SL, displayed in Figure 1 a (left), shows breaks (indicated by orange arrow) and wrinkles (red arrow) in the flake, as well as air trapped in bubbles and puddles23 (yellow arrow). In spite of these features, structurally clean areas extending across about (7x7) m2 are found, such as the one enclosed with a white dashed-contour. For the initial characterization at T=5 K, we perform hyperspectral imaging of the confocal PL (non-resonantly excited with a CW laser diode operating at 450 nm, 10 W arriving at the sample) across the spectral range around the EX emission. The experiment reveals EX center energies spanning across 30 meV, with a PL intensity varying over more than an order of magnitude and different proportions of neutral (EX) and charged (trion, TR) states, as shown in Supplementary Figure S1. We also see zones, where both PL and reflectance of EX are suppressed, while a characteristic spectrally broad band21, that was tentatively attributed to defects, appears below the EX energy. A spatial map of the PL intensity across the entire flake for nm is shown in Figure 1 a (right). Within this region we identify areas containing quite narrow EX emission, down to 7.1 meV FWHM, as exemplified in Figure 1 b.
To inspect the linear coherent response, we performed micro-reflectance from the same zone, showing resonances at EX, TR, as well as the B exciton, centered at nm (not shown). In spite of the substantial improvement of the optical response with respect to previously examined free-standing MoS2 SLs13, 38, the EX line-shape in this -BN/MoS2/-BN heterostructure is still affected by . To disentangle and we employ three-beam FWM microscopy, inferring EX coherence and population dynamics from femtosecond to nanosecond timescales.
Coherence dynamics via four-wave mixing microscopy.
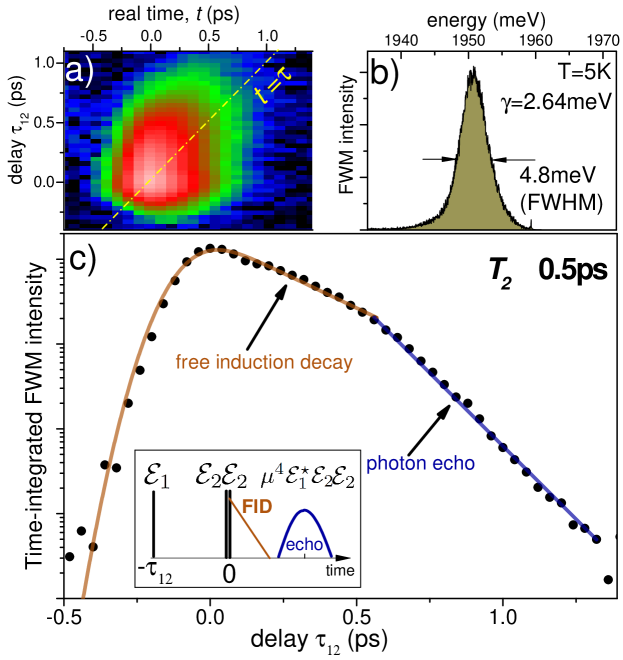
The FWM microscopy was performed in the configuration reported in Ref. [29], briefly described in the Methods section. A typical spectral interferogram of the two-beam FWM field (proportional to where are the fields of the exciting pulses) from the neutral EX in our heterostructure is presented in Figure 1 c (green trace). The measured spectrally integrated FWM intensity (amplitude squared) as a function of the power of the first arriving pulse (), given in Figure 1 d, shows a linear dependence, consistent with the third order regime of the FWM, up to W. The latter corresponds to an excited EX density of around cm-2 per pulse, which is around four orders of magnitude below the EX saturation density in TMDs.
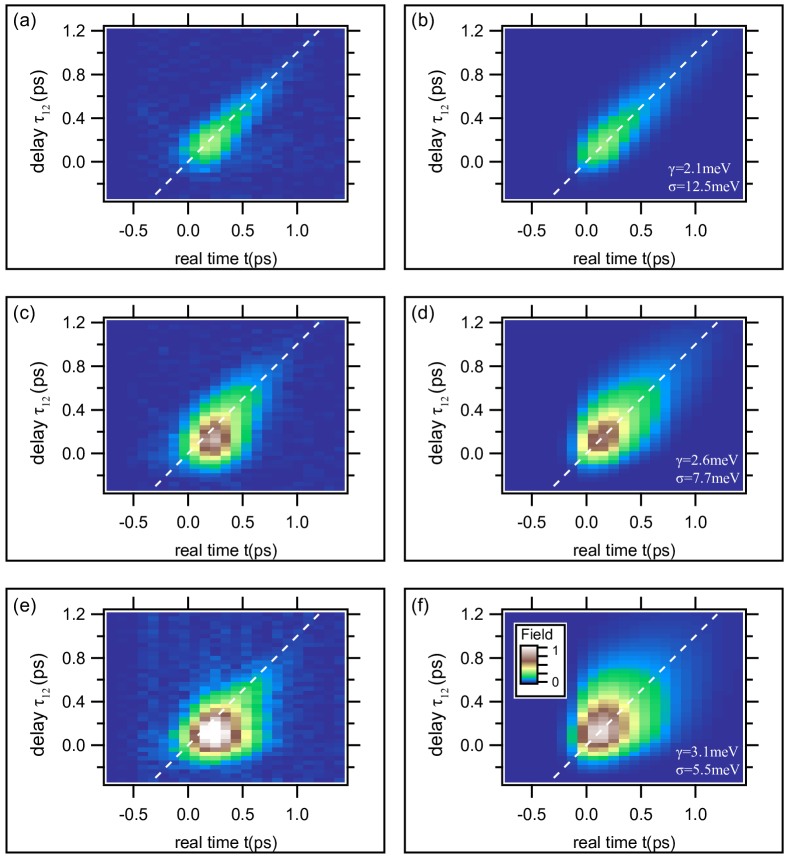
We now turn to the assessment of and by inspecting the time-resolved FWM amplitude as a function of . The experimental results are given in Figure 2 (left). In panel a) we see that FWM is observed for , and already for ps takes a form of a Gaussian pulse centered close to , i. e., the photon echo is formed. In an ideal case of a set of two-level systems and for delta-pulses, the FWM signal for , can be described by a product of an exponential decay and a Gaussian shifting its maximum in time: . The echo has a constant temporal width, with a standard deviation of and FWHM of . This quantity is linked with the FWHM of the spectral inhomogeneous broadening as . Conversely, the amplitude decay of the echo with increasing reflects the homogeneous dephasing time . The measured signal is convoluted with the temporal duration of the applied pulses of about 150 fs, which is taken into account in the modeling presented in Figure 2 b. The two-dimensional fit to the experimental data shown in a) yields . We note that the FWM amplitude at pulse overlap (), encoded in the hue level, principally reflects the EX oscillator strength .
In order to discuss the local character of the quantities , let us now consider Figure 2 e, where the FWM transient acquired within a distance of a few m from the spot considered in a) is shown. Here, the shape of the photon echo is different in several respects: i) it is broader in real time, showing that is smaller, ii) the amplitude decay along is faster, revealing a shorter (and thus larger ), iii) The amplitude around is larger by an order of magnitude, showing a larger . These changes are quantified by the fitted form of the echo, given in Figure 2 f with the parameters meV at this position. It is worth to note that the response in e) already deviates form the echo form, i. e. the maximum of the signal is not aligned along the diagonal, indicating a transition to a homogeneously broadened case. When further approaching this limit, the coherence dynamics displays a crossover from the photon echo towards the free induction decay, resulting in the bi-exponential decay, as discussed in the Supplementary Figure S2. In Figure 2 c, we present another case of the measured echo, with the intermediate line-shape parameters meV, as reflected by the simulation shown in the panel d). These examples demonstrate that the EX optical response is affected by the disorder on scales above and below the resolution of the present experiment, 300 nm. Below this resolution, the disorder leads to an effective inhomogeneous broadening of the response, and a reduction of the radiative decay rate by the localization of the EXs below the optical resolution , thus leading to a mixing of dark EX states outside the radiative cone. Above this resolution, we can see the varying impact of disorder acting on EXs, as shown in the three examples.
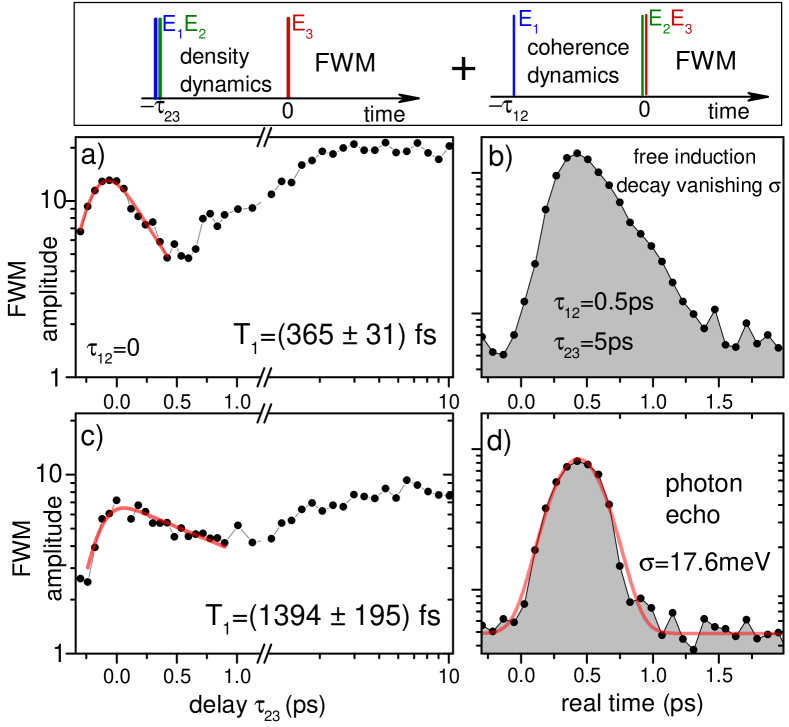
To verify if the encapsulation can be used to virtually eliminate , we have processed a second heterostructure (sample B), presented in the Supplementary Figure S3. To exclude any aging issues, the FWM experiment was started only a few hours after completing the fabrication. At micron-sized areas we measure FWM amplitude as narrow as 4.4 meV (FWHM) at T=4.5 K, as shown by filled-blue peak in Figure 3 a. No signatures of the photon echo can be noticed, when inspecting FWM transients versus . Thus, here is not detectable and the broadening reaches its homogeneous limit. In that limit, time-resolved FWM takes a form of a free induction decay (FID), i. e., exponential decay from for any , with a decay constant determined by , as depicted by a scheme framed in b). Two explicit examples of the measured FID at 4.5K for ps (yellow arrow) and ps (orange arrow) are given by the yellow and orange points in a). By deconvoluting the laser pulse duration we retrieve fs, i. e., meV, close to FWHM of the spectrally resolved amplitude, also in a stunning agreement with retrieved from time-integrated FWM as a function of , shifting the focus of the discussion to b). Interestingly, therein at 4.5 and 10 K we clearly detect the signal at negative delays with a FWM rise time of around 130 fs (after deconvoluting the pulse duration), close to theoretical prediction39 of . Such contributions have previously been observed when studying homogeneously broadened EXs in GaAs quantum wells and were assigned to the local-field effect39.
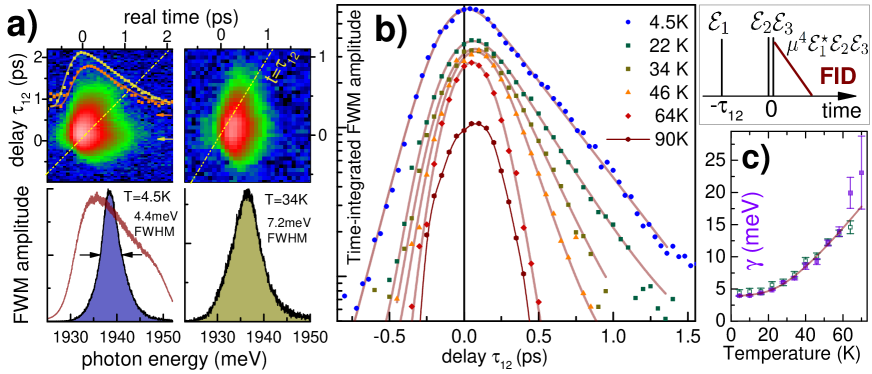
A relevant factor influencing the EX coherent dynamics is the temperature, which determines the density of acoustic and optical phonons40. Increasing the temperature, and thus the phonon density, broadens by phonon-assisted scattering41, 27, 28, 29. On the other hand, the changing phonon-scattering influences the EX relaxation dynamics37. To measure the impact of temperature on , we plot in Figure 3 b the EX coherence dynamics, i. e., the time-integrated FWM amplitude as a function of , for different temperatures. At this homogenously broadened zone the FWM amplitude decays as . With increasing temperature from 5 K to 70 K, we measure shortening of the dephasing time, and thus an increase of the homogeneous broadening from 4 to 23 meV, as marked by violet squares in c). In parallel, virtually the same broadening is seen in the FWM spectral amplitudes (green open squares): To directly illustrate the dominance of the homogeneous broadening mechanism through phonons at this sample position, in the bottom-right panel of a) we present the data measured at 34 K. At higher temperatures, as exemplified for 90 K, the dephasing is too fast to be measured with our current setup, limited by the temporal resolution of around 150 fs. We fit the data with a sum of a linear and exponential activation terms: . For the linear term, attributed to acoustic phonons, we obtain [meV, meV/K]. For the second term we find: [meV, meV]. In contrast to previously inspected SL TMD28, 29, the value of activation is here not consistent with the energy of optical phonons40 of around 35 meV. We tentatively link such a more pronounced temperature dephasing with a particularly small conduction band splitting in MoS2, favoring the population loss of bright excitons through their scattering to dark states.
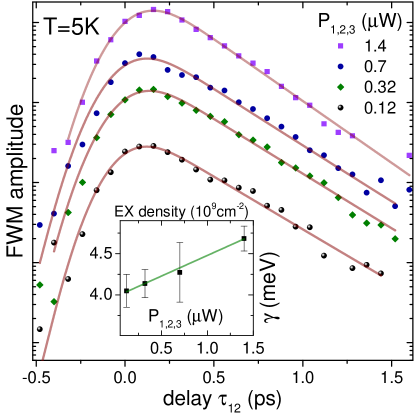
While investigating dephasing mechanisms in TMD SLs, it is also instructive to determine the impact of EX-EX interactions on . Such interactions cause the broadening27 of by 250% when increasing the EX density from to cm-2. In Figure 4 we present dephasing curves measured for different excitaton powers , spanning across typically operating excitation range in our experiments. With increasing EX density from around to cm-2, we detect a small, but measurable increase of the homogeneous broadening by 15%; 0.5 meV over an order of magnitude density. As the absorption (thus also EX density for a fixed ) could vary across the flake, it is important to check that such excitation-induced dephasing is of minor importance in the applied range of : Values of retrieved from the analysis of the spatially-resolved FWM experiment, presented in the next section, are expected not to be significantly affected by spatially fluctuating EX-EX interactions.
Four-wave mixing mapping and statistical correlations.
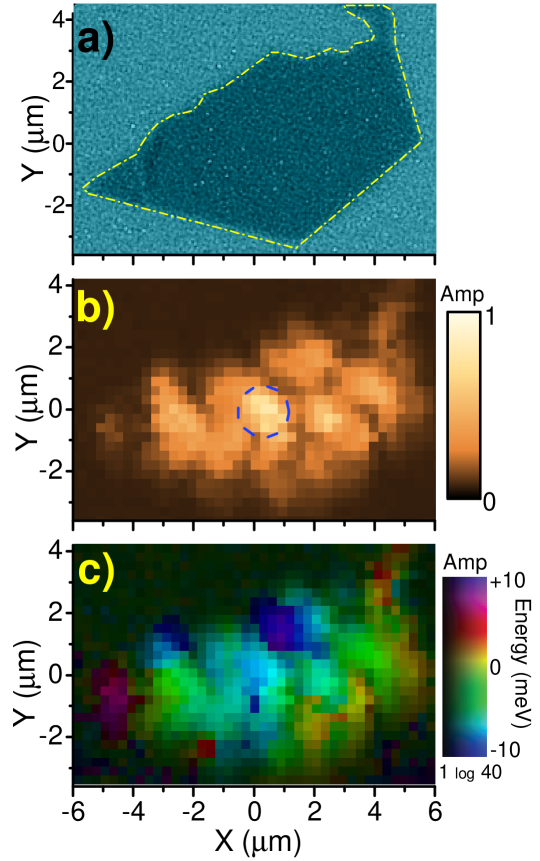
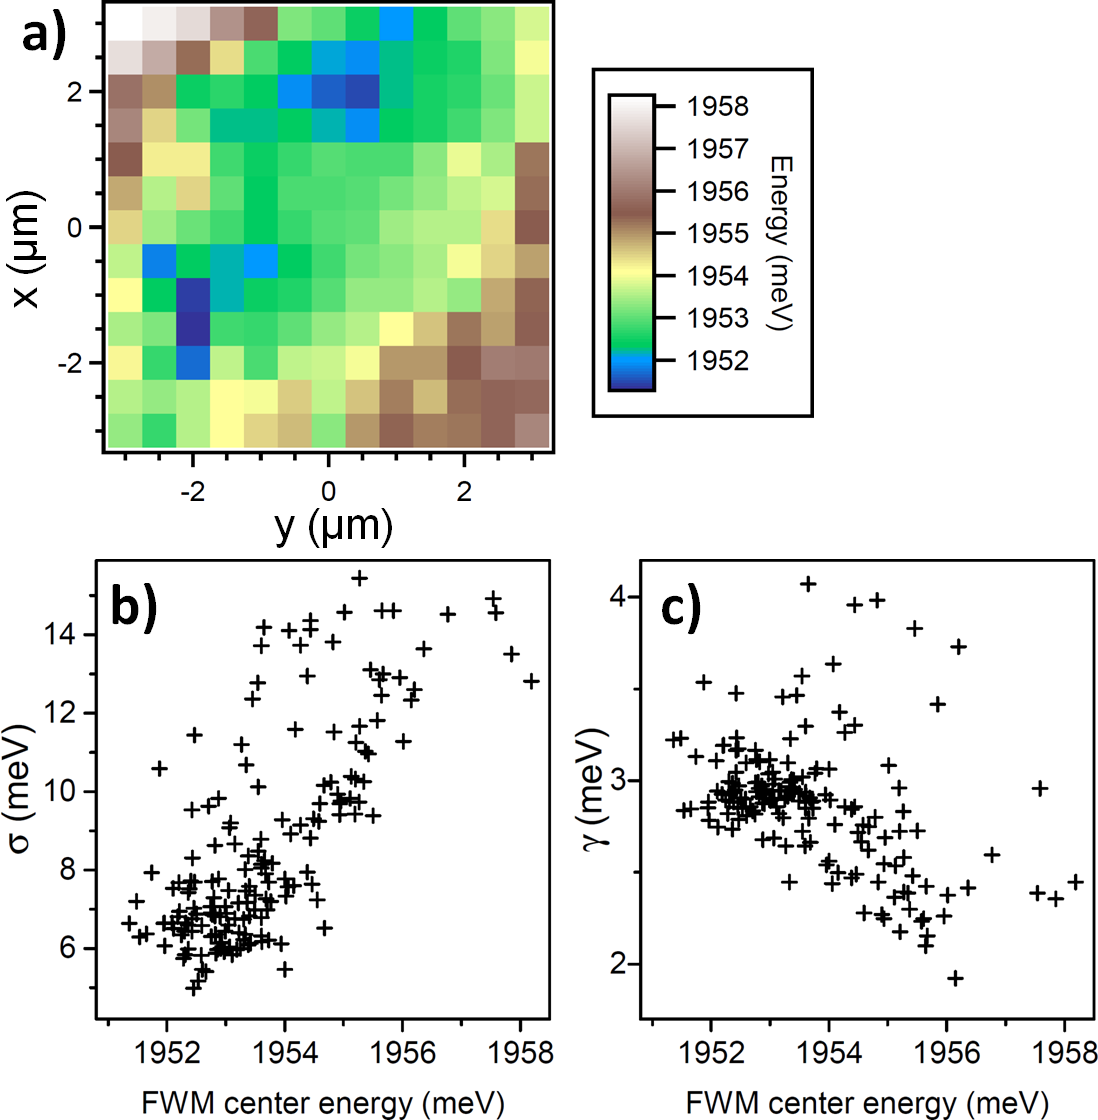
To draw a comprehensive picture of the balance between the microscopic disorder and the EX coherent dynamics we go back to the more disordered heterostructure (sample A, Figure 1). We use FWM imaging29, measuring photon echos, as in Figure 2, at the grid of spatial points of the sample. For each position, we perform two-dimensional measurements and fits as in Figure 2, extracting , and the FWM amplitude, . While we note that these fits are not taking into account the interaction induced nature of the signal, the resulting parameters mimic the response well and are suited for , being the case for the investigated sample. These parameters are presented as color maps in Figure 5 a-c. Within the investigated area, (FWHM) spans from 1.8 to 4.3 meV. We see the spread of (FWHM) from 4.7 to 16 meV, with the less disordered zone colored in green-blue in Figure 5 a. Note that the upper limit of the measured is set by the spectral width of the excitation laser. This low-disorder zone (greenish area) also shows the strongest FWM amplitude, proportional to , as shown in Figure 5 b.
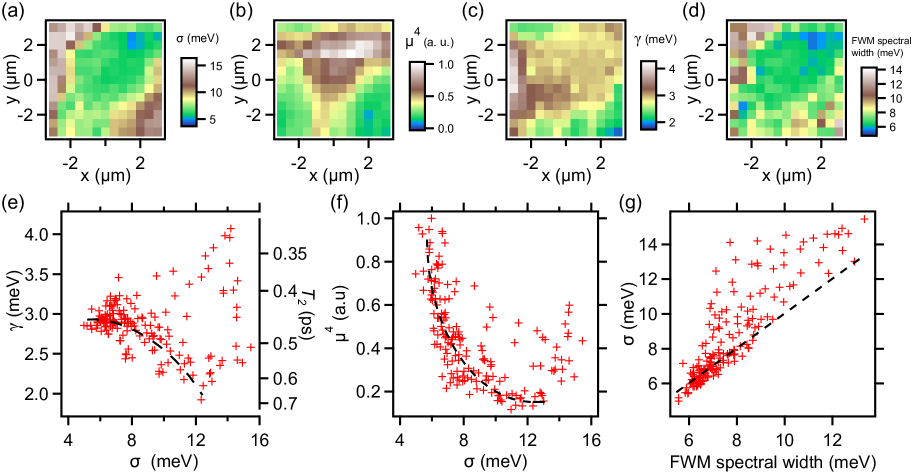
A pronounced correlation between and is explicit in Figure 5 f. It is interpreted as follows. Smaller signifies weaker disorder enabling larger EX center-of-mass localization lengths32, thus generating large EX coherence volume in real space. In the reciprocal space, the EX wavefunction is thus dominated by small k-vector components and therefore is better contained within the light cone. This increases the light-matter interaction, and thus also , resulting in an enhancement of the FWM signal. Instead, at areas showing large , the EX spans more prominently out of the light cone. Smaller overlap with the light-cone results in decreasing and increasing radiative lifetime: instances of such qualitative dependencies between , and are shown in the Supplementary Figure S4. Close to the radiative limit (), this implies an increase of and thus a decrease of the homogeneous linewidth with increasing . Such a correlation is visible in Figure 5 e. Nonetheless, we do observe points showing a short T2 and yet a large . This is attributed to other homogeneous broadening mechanisms, such as non-radiative exciton-electron scattering, which vary across the investigated area.
It is instructive to compare the parameters obtained through the temporal dynamics with the ones from the spectra. In Figure 5 d we present the inhomogeneous width (FWHM) of the Gaussian profiles we fit to the spectrally-resolved FWM data. We find agreement between the inhomogeneous width determined by the FWM transients (a) and the spectral FWHM (d) - the correlation between both is shown in g). In the Supplementary Figure S5 we further exploit correlations and demonstrate that , characterizing amount of disorder, increases with the EX center energy, obtained from the spectra. This means that the short-range (sub-resolution) disorder is dominating within the probed region and is of repulsive nature.
Population dynamics on a nanosecond scale.
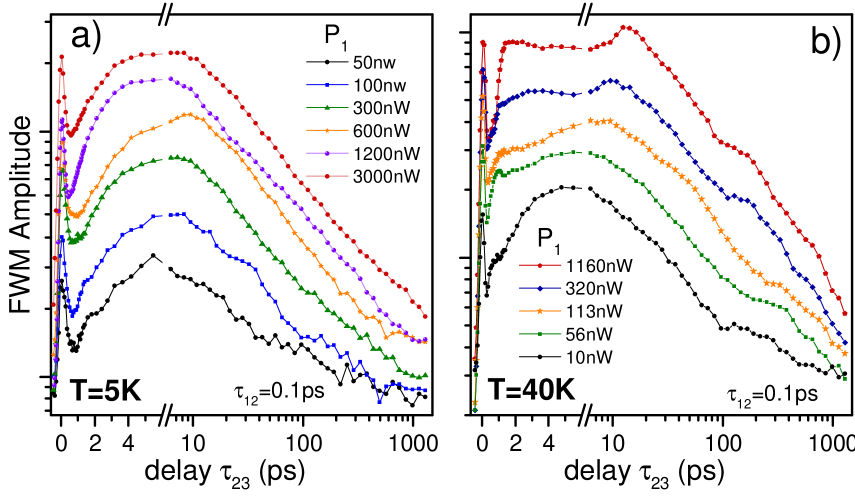
After the resonant excitation several relaxation mechanisms play an important role37. They are governed by, on the one hand, the high oscillator strength42 and thus fast radiative recombination rate, and on the other hand, by the EX conversion towards different dark states, resulting from the peculiar valley structure and available scattering channels with phonons, charge carriers and EXs. Due to this scattering and radiative recombination, the EX phase is lost on a picosecond timescale, as shown by the results discussed in the previous sections. Nonetheless, the EX population in the dark states is evolving on a much longer timescale. Time-resolved PL performed on TMD SLs typically shows tails in a range of a few 100 ps43, 44, 45, 46. The quantitative interpretation of PL dynamics is difficult, as there are many intermediate states in the scattering pathway from the initially excited electron-hole pairs to the emission of the bright EX states. Importantly, the occupation of dark EX states is not directly observable, but can be inferred indirectly, by modeling. Conversely, the experiments using phase-sensitive heterodyne detection28, 37 are sensitive not only to the bright EXs, but also the dark ones, through their interaction with the optically probed bright EXs. Even more, the phase of the signal encodes the phase of the complex interaction energy, enabling the distinction between population of different dark state reservoirs (fast direct spin-allowed, direct spin-forbidden, indirect spin-allowed, and indirect spin-forbidden)37. Furthermore, resonant pumping generates a well-defined initial density of bright EXs (within the light cone) with a given spin-state encoded by the light helicity. Namely, the two pulses and (shifted by the radio-frequencies, and , respectively), arriving in time overlap, create an EX density , oscillating at the frequency =1 MHz (see Methods). The FWM signal probing the density dynamics - generated by the third pulse delayed by - infers the amplitude and the phase of the resulting modulation of the excitonic response. This pulse sequence is shown in Figure 6 together with a typical dynamics measured at T=5 K.
Qualitatively, the data for different densities and temperatures, as presented for FWM amplitudes in the Supplementary Figure S6, are consistently described by:
-
1.
A weak signal for negative times due to previous pulses (repetition period is 13 ns), about one order of magnitude below the signal at .
-
2.
A signal amplitude rise from the negative delays , given by the pulse autocorrelation, accompanied with a /2 phase shift.
-
3.
A decay of the amplitude to less than half its value occurring for ps.
-
4.
Subsequently, the signal amplitude rises on a timescale of 10 ps, accompanied by a phase shift of about /2.
-
5.
For ps the amplitude decays, following a power law up to a time of about 1 ns, while the phase shifts by about .
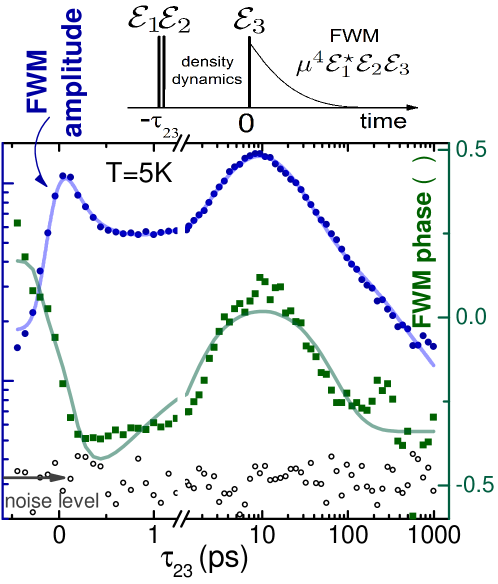
While the initial FWM decrease is attributed to the EX radiative recombination with the time constant given by and simultaneous scattering to the dark states, its subsequent rise (with additional features developing when increasing the temperature, see Figure S6) is surprising. To interpret the density dynamics measured with the heterodyne FWM, we recall that the technique retrieves response functions which are complex, hence is sensitive to both amplitudes and relative phases of the components of the signal . This permits signals stemming from different densities and different interaction processes (between different EX states) to interfere, which is visible when their relative contributions change along the delay . In the present case, this effect is pronounced, indicating that the dynamics contains EX densities with interaction energies of significantly different phases, so that a description using a constant phase fails. In particular, to describe our data set, we introduce the following complex response function:
| (1) |
The meaning of the parameters is explained in Table 1. The response function includes a complex offset (, ), a two-photon absorption process (, ) generating nonresonant FWM around and exponential decay processes, all multipled by the power law decay. Note that (, ) pairs represent amplitudes and phases for the density scattering processes exhibiting exponential decays with the time constants . We found that a minimum of three such processes were required for a good fit to the data at 5 K. With increasing the temperature to 40 K, inclusion of the forth component was necessary to model the data (not shown).
Additionally, the third line of the above expression has been explicitly added to describe the power law visible for longer delays . Introducing this term is motivated by the observed power law in the decay for different temperatures, and the fact that after some time the EX density will be thermalized and therefore described by an overall decay process, which here appears to be EX-EX scattering leading to a power-law decay. The fitting function accounts for the temporal width of the excitation Gaussian pulses () and their repetition period () yielding this quite involved, but analytical expression.
The simultaneously fitted dynamics to the FWM amplitude and FWM phase is shown by blue and green traces in Figure 6, respectively. We interpret it as follows. The initial drop is governed by the radiative recombination of EXs in the light cone competing with scattering out of the light cone leading to a fast decay with ps. Later dynamics is characterized by ps and comparable amplitude (). Populating the indirect dark EXs results in the rise of FWM amplitude and produces a phase-shift due to modified interaction with the bright EXs. This is followed by the overall density decay via EX-EX scattering into a photon and a bright EX or non-radiative Auger recombination. To rephrase, in this model, the FWM rise (quantified by the second process, with the parameters: , and ) is due to the scattering of EXs into states with a stronger interaction with the probed bright EXs, for example spin-forbidden direct or indirect EXs. We speculate that, within the TMD family, such scattering from bright towards dark EX configuration is the most efficient in MoS2 SLs, owing to its particularly small conduction band splitting47, giving a reason why it is much more pronounced here with respect to MoSe2 SLs37. After 10 ps, this process is completed and the subsequent decay dynamics is ruled by the power law with the power . This value corresponds to a decay rate proportional to the EX density with the power , and thus indicates tri-exciton scattering as dominating decay mechanism. The remaining third exponential process yields the decay constant ps and , comparable with . We found that, while restricting the modeling to the first two decay processes one can describe the FWM amplitude dynamics reasonably well (not shown), the third decay process was necessary to fit the phase dynamics. This exemplifies how the phase observable contains additional information, otherwise obscured when considering the FWM amplitude only. This third process is tentatively attributed to a further redistribution between the different dark exciton states, as suggested by the different phase of the resulting interaction.
| Parameter | Value | Error | Physical meaning |
| 19059 | 1573 | amplitude of the complex offset | |
| 0.666 | 0.136 | phase of the complex offset | |
| 52443 | 10184 | two-photon absorption amplitude | |
| 0.261 | 0.288 | phase of the two-photon absorption process | |
| 0.16 | 0 | of autocorrelation (intensity FWHM) in ps | |
| 13157 | 0 | laser repetition time in ps | |
| 167700 | 59863 | amplitude of the process | |
| 0.132 | 0.041 | time constant for the process in ps | |
| 269940 | 68166 | amplitude process | |
| 4.22 | 1.27 | time constant for the process in ps | |
| 232748 | 88908 | amplitude of the process | |
| 55.81 | 17.85 | time constant for the process in ps | |
| -0.442 | 0.231 | phase of the process in rad | |
| -2.696 | 0.067 | phase of the process in rad | |
| 0.784 | 0.243 | phase of the process in rad | |
| 134112 | 90948 | amplitude of the power law decay | |
| -1.20626 | 0.09495 | phase of the power law dacay in rad | |
| 0.056 | 0.066 | coefficient in the power law | |
| 0.59 | 0.05 | exponent of the power law |
Table 1. Set of parameters for the fit shown in Figure 6 using the response function (1). The values marked in blue correspond to the most relevant physical parameters of the fit.
Conclusions.
We have shown that encapsulating MoS2 SLs in between -BN layers drastically improves the optical quality in this material and permits to recover giant coherent nonlinear responses of the EXs, as expected from their oscillator strength. Using two heterostructures differing in the degree of the EX disorder, we have performed three-beam FWM to infer the EX coherent and incoherent dynamics, spanning timescales from 100 fs to 1.3 ns. By measuring the coherence dynamics and time-resolved FWM, we reveal the formation of the photon echos, extracting homogeneous and inhomogeneous contributions to the EX spectral line-shape. We directly show the correlation between and the measured initial population loss, indicating that the latter is affected by the change in radiative lifetime on top of non-radiative channels. Importantly, at some positions of the low disorder sample the FWM transient appears in the form of interaction dominated free-induction decay, with no evidence of photon echo formation, showing that the EX broadening in the probed region is homogeneous within the experimental accuracy. FWM microscopy allowed us to reveal the impact of the local disorder on the EX’s oscillator strength and line-shape. The latter is shown to be affected by the temperature and also weakly by the excitation induced dephasing due to EX-EX interaction. The EX density dynamics measured by FWM is sensitive both to the dark and the bright EX density, and can recover the complex interaction energy with the bright EXs using the amplitude and phase of the signal. Employing the modeling with complex fitting function, we identified three major EX relaxation channels, specifically: radiative decay and scattering out of the light cone (into fast EXs), scattering into dark excitons, which subsequently decay via tri-EX scattering. Further FWM transient grating investigations, thoroughly addressing a large space of parameters — the temperature, injected exciton density, valley-polarization, distinct TMD SL materials (exhibiting optically bright and dark exciton ground state), as well as the charge state (neutral EXs versus trions) — are necessary to draw a comprehensive picture of the exciton relaxation dynamics. This would enable to elaborate more accurate and predictive models, yet also more involved, with respect to the one presented in this work. To consistently describe the measured rich EX relaxation dynamics, one could for example incorporate master equations, modeling the dynamics between the different EX reservoirs.
Our methodology is well suited to accurately assess the impact of disorder on the EX responses in experiments with forthcoming TMD heterostructures. Especially, with the suppressed structural disorder, we could access and measure the coherent dynamics, mutual couplings and lifetime of the EX excited states. Finally, using spatially-resolved FWM configuration would enable to demonstrate long-range propagation of the coherence and of the exciton-polariton diffusion. The latter aspects are of utmost importance to reveal the exciton dispersion curve in optically active van der Waals structures48.
1 Methods
Preparation of the MoS2 van der Waals heterostructure.
In the present two samples, A and B, the natural MoS2 crystals were purchased from SPI and the -BN crystals were obtained from NIMS, Japan. The Si/SiO2 substrates with a 295 nm thick oxide were cleaned using acetone and isopropyl-alcohol followed by nitrogen blow dry. For the sample A (with more disorder), we used a viscoelastic stamping method for the stack preparation, while for the sample B (with less disorder) we used a pick-up technique.
For the sample A, the -BN crystal was placed on a scotch tape and was mechanically exfoliated onto a Si/SiO2 substrate whereas the MoS2 crystal was exfoliated onto a PDMS layer. It has been already shown that large area monolayer MoS2 flakes could be obtained by exfoliating on PDMS49. A large SL MoS2 flake (m2) was identified on PDMS based on optical contrast and was aligned and transferred onto the -BN flake on Si/SiO2 by viscoelastic stamping, which is a dry method50. Likewise, another -BN flake exfoliated on PDMS was stamped over the monolayer MoS2, so as to encapsulate it and to obtain a -BN/MoS2/-BN van der Walls heterostructure. While this process is known to yield clean MoS2/-BN interface at the bottom, the top interface with -BN may encapsulate air blisters, puddles and cracks. These may form as a result of the exerted mechanical stress, but a low amount of contaminants is expected.
For the less disordered sample B, we use the so-called PPC (polypropylene carbonate) technique. The top and bottom h-BN and also the MoS2 are exfoliated onto Si/SiO2 substrates, respectively. Monolayer MoS2 and 15-20 nm thick -BN flakes are identified using an optical microscope. Using a micron thin film of PPC polymer top -BN, monolayer MoS2 and the bottom -BN are picked up one after another to form -BN/MoS2/-BN heterostructure using the procedure introduced by Wang et al. Science (2013), vol. 342, p. 614.
Four-wave mixing microscopy.
To measure coherent, resonant responses, and in particular FWM spectra, we use heterodyne spectral interferometry (HSI)51, 52. We employ three laser pulses generated by the Optical Parametric Oscillator (Radiantis Inspire) pumped by a Ti:Sapphire laser (Spectra-Physics, Tsunami Femto). The pulses are chirp corrected using a geometrical pulse-shaper, such that they arrive at the sample close to their Fourier limit, with around 150 fs duration. The beams are labeled and are resonant with the EX transition, as displayed in Figure 1 c (black trace). They are focussed on the sample with the microscope objective (NA=0.6) down to the diffraction limit. are frequency upshifted by distinct radio-frequencies around 80 MHz using acousto-optic deflectors. The reflectance is collected by the same objective and spectrally dispersed by an imaging spectrometer. By exploiting optical heterodyning, we select the field component proportional to the FWM polarization proportional to , which is carried by the heterodyne beat note at the frequency, also occurring around 80 MHz. By applying the acousto-optic downshift for this mixing frequency at the detection path, the FWM spectral interference detected by a CCD camera is observed as a non-oscillating (DC) signal. Using a defined time-ordering between signal and reference pulses, the signal is resolved in amplitude and phase using spectral interferometry 53, providing the response in both spectral and temporal domain connected via Fourier transform. By measuring the FWM as a function of time delays (between and ) and (between and ), we gain information about the EX coherence and density dynamics, respectively.
We acknowledge the financial support by the European Research Council (ERC) Starting Grant PICSEN (grant no. 306387) and Grenoble Alpes University community (AGIR-2016-SUGRAF). This work was supported by the European Union H2020 Graphene Flagship program (grants no. 604391 and 696656) and the 2DTransformers project under the OH-RISQUE program (ANR-14-OHRI-0004) and J2D (ANR-15-CE24- 0017) and DIRACFORMAG (ANR-14-CE32-0003) projects of Agence Nationale de la Recherche (ANR). G.Na. and V.B. are thankful for support from CEFIPRA. W.L., F.M, and L.S. acknowledge support by EPSRC under Grant No. EP/M020479/1. K.W. and T.T. acknowledge support from the Elemental Strategy Initiative conducted by the MEXT, Japan and and the CREST (JPMJCR15F3), JST.
References
- Splendiani et al. 2010 Splendiani, A.; Sun, L.; Zhang, Y.; Li, T.; Kim, J.; Chim, C.-Y.; Galli, G.; Wang, F. Emerging Photoluminescence in Monolayer MoS2. Nano Lett. 2010, 10, 1271–1275
- Mak et al. 2010 Mak, K. F.; Lee, C.; Hone, J.; Shan, J.; Heinz, T. F. Atomically Thin MoS2: A New Direct-Gap Semiconductor. Phys. Rev. Lett. 2010, 105, 136805
- Mak et al. 2012 Mak, K. F.; He, K.; Shan, J.; Heinz, T. F. Control of Valley Polarization in Monolayer MoS2 by Optical Helicity. Nat. Nanotech. 2012, 7, 494–498
- Zeng et al. 2012 Zeng, H.; Dai, J.; Yao, W.; Xiao, D.; Cui, X. Valley Polarization in MoS2 Monolayers by Optical Pumping. Nat. Nanotech. 2012, 7, 490–493
- Mak et al. 2014 Mak, K. F.; McGill, K. L.; Park, J.; McEuen, P. L. The Valley Hall Effect in MoS2 Transistors. Science 2014, 344, 1489–1492
- Kioseoglou et al. 2012 Kioseoglou, G.; Hanbicki, A.; Currie, M.; Friedman, A.; Gunlycke, D.; Jonker, B. Valley Polarization and Intervalley Scattering in Monolayer MoS2. Appl. Phys. Lett. 2012, 101, 221907
- Cao et al. 2012 Cao, T.; Wang, G.; Han, W.; Ye, H.; Zhu, C.; Shi, J.; Niu, Q.; Tan, P.; Wang, E.; Liu, B.; Feng, J. Valley-Selective Circular Dichroism of Monolayer Molybdenum Disulphide. Nat. Commun. 2012, 3, 887
- Korn et al. 2011 Korn, T.; Heydrich, S.; Hirmer, M.; Schmutzler, J.; Schüller, C. Low-temperature Photocarrier Dynamics in Monolayer MoS2. Appl. Phys. Lett. 2011, 99, 102109
- Neumann et al. 2017 Neumann, A.; Lindlau, J.; Colombier, L.; Nutz, M.; Najmaei, S.; Lou, J.; Mohite, A. D.; Yamaguchi, H.; Högele, A. Opto-Valleytronic Imaging of Atomically Thin Semiconductors. Nat. Nanotech. 2017, 12, 329–334
- Lagarde et al. 2014 Lagarde, D.; Bouet, L.; Marie, X.; Zhu, C.; Liu, B.; Amand, T.; Tan, P.; Urbaszek, B. Carrier and Polarization Dynamics in Monolayer MoS2. Phys. Rev. Lett. 2014, 112, 047401
- Stier et al. 2016 Stier, A. V.; McCreary, K. M.; Jonker, B. T.; Kono, J.; Crooker, S. A. Exciton Diamagnetic Shifts and Valley Zeeman Effects in Monolayer WS2 and MoS2 to 65 Tesla. Nat. Commun. 2016, 7, 10643
- Mitioglu et al. 2016 Mitioglu, A.; Galkowski, K.; Surrente, A.; Klopotowski, L.; Dumcenco, D.; Kis, A.; Maude, D.; Plochocka, P. Magnetoexcitons in Large Area CVD-Grown Monolayer MoS2 and MoSe2 on Sapphire. Phys. Rev. B 2016, 93, 165412
- Cadiz et al. 2017 Cadiz, F.; Courtade, E.; Robert, C.; Wang, G.; Shen, Y.; Cai, H.; Taniguchi, T.; Watanabe, K.; Carrere, H.; Lagarde, D.; Manca, M.; Amand, T.; Renucci, P.; Tongay, S.; Marie, X.; Urbaszek, B. Excitonic Linewidth Approaching the Homogeneous Limit in MoS2 Based van der Waals Heterostructures: Accessing Spin-Valley Dynamics. Phys. Rev. X 2017, 7, 021026
- Kormányos et al. 2014 Kormányos, A.; Burkard, G.; Gmitra, M.; Fabian, J.; Zólyomi, V.; Drummond, N. D.; Fal’ko, V. kp Theory for Two-Dimensional Transition Metal Dichalcogenide Semiconductors. 2D Mater. 2014, 2, 022001
- Echeverry et al. 2016 Echeverry, J.; Urbaszek, B.; Amand, T.; Marie, X.; Gerber, I. Splitting Between Bright and Dark Excitons in Transition Metal Dichalcogenide Monolayers. Phys. Rev. B 2016, 93, 121107
- Qiu et al. 2015 Qiu, D. Y.; Cao, T.; Louie, S. G. Nonanalyticity, Valley Quantum Phases, and Light-like Exciton Dispersion in Monolayer Transition Metal Dichalcogenides: Theory and First-Principles Calculations. Phys. Rev. Lett. 2015, 115, 176801
- Amani et al. 2015 Amani, M.; Lien, D.-H.; Kiriya, D.; Xiao, J.; Azcatl, A.; Noh, J.; Madhvapathy, S. R.; Addou, R.; KC, S.; Dubey, M.; Cho, K.; Wallace, R. M.; Lee, S.-C.; He, J.-H.; Ager, J. W.; Zhang, X.; Yablonovitch, E.; Javey, A. Near-Unity Photoluminescence Quantum Yield in MoS2. Science 2015, 350, 1065–1068
- Kim et al. 2017 Kim, H.; Lien, D.-H.; Amani, M.; Ager, J. W.; Javey, A. Highly Stable Near-Unity Photoluminescence Yield in Monolayer MoS2 by Fluoropolymer Encapsulation and Superacid Treatment. ACS Nano 2017, 11, 5179–5185
- Frisenda et al. 2018 Frisenda, R.; Navarro-Moratalla, E.; Gant, P.; Lara, D. P. D.; Jarillo-Herrero, P.; Gorbachev, R. V.; Castellanos-Gomez, A. Recent Progress in the Assembly of Nanodevices and van der Waals Heterostructures by Deterministic Placement of 2D Materials. Chem. Soc. Rev. 2018, 47, 53
- Novoselov and Neto 2012 Novoselov, K.; Neto, A. C. Two-Dimensional Crystals-Based Heterostructures: Materials with Tailored Properties. Phys. Scr. 2012, 2012, 014006
- Wierzbowski et al. 2017 Wierzbowski, J.; Klein, J.; Sigger, F.; Straubinger, C.; Kremser, M.; Taniguchi, T.; Watanabe, K.; Wurstbauer, U.; Holleitner, A. W.; Kaniber, M.; Müller, K.; Finley, J. J. Direct Exciton Emission from Atomically Thin Transition Metal Dichalcogenide Heterostructures Near the Lifetime Limit. Sci. Rep. 2017, 7, 12383
- Robert et al. 2017 Robert, C.; Semina, M.; Cadiz, F.; Manca, M.; Courtade, E.; Taniguchi, T.; Watanabe, K.; Cai, H.; Tongay, S.; Lassagne, B.; Renucci, P.; Amand, T.; Marie, X.; Glazov, M.; Urbaszek, B. Optical Spectroscopy of Excited Exciton States in MoS2 Monolayers in van der Waals Heterostructures. arXiv:1712.01548 2017,
- Rooney et al. 2017 Rooney, A. P.; Kozikov, A.; Rudenko, A. N.; Prestat, E.; Hamer, M. J.; Withers, F.; Cao, Y.; Novoselov, K. S.; Katsnelson, M. I.; Gorbachev, R.; Haigh, S. J. Observing Imperfection in Atomic Interfaces for van der Waals Heterostructures. Nano Lett. 2017, 17, 5222–5228
- Ajayi et al. 2017 Ajayi, O. A.; Ardelean, J. V.; Shepard, G. D.; Wang, J.; Antony, A.; Taniguchi, T.; Watanabe, K.; Heinz, T. F.; Strauf, S.; Zhu, X.-Y.; Hone, J. C. Approaching the Intrinsic Photoluminescence Linewidth in Transition Metal Dichalcogenide Monolayers. 2D Mater. 2017, 4, 031011
- Manca et al. 2017 Manca, M.; Glazov, M. M.; Robert, C.; Cadiz, F.; Taniguchi, T.; Watanabe, K.; Courtade, E.; Amand, T.; Renucci, P.; Marie, X.; Wang, G.; Urbaszek, B. Enabling Valley Selective Exciton Scattering in Monolayer WSe2 Through Upconversion. Nat. Commun. 2017, 8, 14927
- Lindlau et al. 2017 Lindlau, J.; Robert, C.; Funk, V.; Förste, J.; Michael Förg, L. C.; Neumann, A.; Courtade, E.; Shree, S.; Taniguchi, T.; Watanabe, K.; Glazov, M. M.; Marie, X.; Urbaszek, B.; Högele, A. Identifying Optical Signatures of Momentum-Dark Excitons in Transition Metal Dichalcogenide Monolayers. arXiv 2017, 1710.00988
- Moody et al. 2015 Moody, G.; Kavir Dass, C.; Hao, K.; Chen, C.-H.; Li, L.-J.; Singh, A.; Tran, K.; Clark, G.; Xu, X.; Berghäuser, G.; Malic, E.; Knorr, A.; Li, X. Intrinsic Homogeneous Linewidth and Broadening Mechanisms of Excitons in Monolayer Transition Metal Dichalcogenides. Nat. Commun. 2015, 7, 8315
- Jakubczyk et al. 2016 Jakubczyk, T.; Delmonte, V.; Koperski, M.; Nogajewski, K.; Faugeras, C.; Langbein, W.; Potemski, M.; Kasprzak, J. Radiatively Limited Dephasing and Exciton Dynamics in MoSe2 Monolayers Revealed with Four-Wave Mixing Microscopy. Nano Lett. 2016, 16, 5333–5339
- Jakubczyk et al. 2018 Jakubczyk, T.; Nogajewski, K.; Molas, M. R.; Bartos, M.; Langbein, W.; Potemski, M.; Kasprzak, J. Impact of Environment on Dynamics of Exciton Complexes in a WS2 Monolayer. 2D Mater. 2018, 5, 031007
- Mannarini et al. 2004 Mannarini, G.; Grosse, F.; Zimmermann, R.; Kaßbohm, S.; Langbein, W. Moving Speckles in the Rayleigh Scattering of Excitons in Potential Gradients. Phys. Rev. B 2004, 69, 085326
- Zimmermann et al. 2003 Zimmermann, R.; Runge, E.; Savona, V. Theory of Resonant Secondary Emission: Rayleigh Scattering versus Luminescence. Quantum Coherence, Correlation and Decoherence in Semiconductor Nanostructures 2003, 89–165
- Savona and Langbein 2006 Savona, V.; Langbein, W. Realistic Heterointerface Model for Excitonic States in Growth-Interrupted GaAs Quantum Wells. Phys. Rev. B 2006, 74, 75311
- Säynätjoki et al. 2017 Säynätjoki, A.; Karvonen, L.; Rostami, H.; Autere, A.; Mehravar, S.; Lombardo, A.; Norwood, R. A.; Hasan, T.; Peyghambarian, N.; Lipsanen, H.; Kieu, K.; Ferrari, A. C.; Polini, M.; Sun, Z. Ultra-Strong Nonlinear Optical Processes and Trigonal Warping in MoS2 Layers. Nat. Commun. 2017, 8
- Liu et al. 2017 Liu, H.; Li, Y.; You, Y. S.; Ghimire, S.; Heinz, T. F.; Reis, D. A. High-Harmonic Generation from an Atomically Thin Semiconductor. Nat. Phys. 2017, 13, 262–265
- Dean et al. 2010 Dean, C. R.; Young, A. F.; Meric, I.; Lee, C.; Wang, L.; Sorgenfrei, S.; Watanabe, K.; Taniguchi, T.; Kim, P.; Shepard, K. L.; Hone, J. Boron Nitride Substrates for High-Quality Graphene Electronics. Nat. Nanotech. 2010, 5, 722–726
- Naeem et al. 2015 Naeem, A.; Masia, F.; Christodoulou, S.; Moreels, I.; Borri, P.; Langbein, W. Giant Exciton Oscillator Strength and Radiatively Limited Dephasing in Two-Dimensional Platelets. Phys. Rev. B 2015, 91, 121302
- Scarpelli et al. 2017 Scarpelli, L.; Masia, F.; Alexeev, E. M.; Withers, F.; Tartakovskii, A. I.; Novoselov, K. S.; Langbein, W. Resonantly Excited Exciton Dynamics in Two-Dimensional Monolayers. Phys. Rev. B 2017, 96, 045407
- Klein et al. 2018 Klein, J.; Kuc, A.; Nolinder, A.; Altzschner, M.; Wierzbowski, J.; Sigger, F.; Kreupl, F.; Finley, J. J.; Wurstbauer, U.; Holleitner, A. W.; Kaniber, M. Robust Valley Polarization of Helium Ion Modified Atomically Thin MoS2. 2D Mater. 2018, 5, 011007
- Wegener et al. 1990 Wegener, M.; Chemla, D.; Schmitt-Rink, S.; Schäfer, W. Line Shape of Time-Resolved Four-Wave Mixing. Phys. Rev. A 1990, 42, 5675–83
- Molina-Sánchez and Wirtz 2011 Molina-Sánchez, A.; Wirtz, L. Phonons in Single-Layer and Few-Layer MoS2 and WS2. Phys. Rev. B 2011, 84, 155413
- Borri et al. 1999 Borri, P.; Langbein, W.; Hvam, J. M.; Martelli, F. Well-Width Dependence of Exciton-Phonon Scattering in InxGa1-xAs/GaAs Single Quantum Wells. Phys. Rev. B 1999, 59, 2215
- Liu et al. 2014 Liu, X.; Galfsky, T.; Sun, Z.; Xia, F.; Lin, E.-C.; Lee, Y.-H.; Kena-Cohen, S.; Menon, V. M. Strong Light-Matter Coupling in Two-Dimensional Atomic Crystals. Nat. Photon. 2014, 9, 30
- Godde et al. 2016 Godde, T.; Schmidt, D.; Schmutzler, J.; Aßmann, M.; Debus, J.; Withers, F.; Alexeev, E. M.; Del Pozo-Zamudio, O.; Skrypka, O. V.; Novoselov, K. S.; Bayer, M.; Tartakovskii, A. I. Exciton and Trion Dynamics in Atomically Thin and : Effect of Localization. Phys. Rev. B 2016, 94, 165301
- Moody et al. 2016 Moody, G.; Schaibley, J.; Xu, X. Exciton Dynamics in Monolayer Transition Metal Dichalcogenides. J. Opt. Soc. Am. B 2016, 33, C39
- Robert et al. 2016 Robert, C.; Lagarde, D.; Cadiz, F.; Wang, G.; Lassagne, B.; Amand, T.; Balocchi, A.; Renucci, P.; Tongay, S.; Urbaszek, B.; Marie, X. Exciton Radiative Lifetime in Transition Metal Dichalcogenide Monolayers. Phys. Rev. B 2016, 93, 205423
- Plechinger et al. 2017 Plechinger, G.; Nagler, P.; Arora, A.; Schmidt, R.; Chernikov, A.; Lupton, J.; Bratschitsch, R.; Schüller, C.; Korn, T. Valley Dynamics of Excitons in Monolayer Dichalcogenides. arxiv.org 2017,
- Marinov et al. 2017 Marinov, K.; Avsar, A.; Watanabe, K.; Taniguchi, T.; Kis, A. Resolving the Spin Splitting in the Conduction Band of Monolayer MoS2. Nat. Commun. 2017, 8, 1938
- Basov et al. 2016 Basov, D. N.; Fogler, M. M.; de Abajo, F. J. G. Polaritons in van der Waals Materials. Science 2016, 354, 1992
- Dubey et al. 2017 Dubey, S.; Lisi, S.; Nayak, G.; Herziger, F.; Nguyen, V.-D.; Quang, T. L.; Cherkez, V.; Gonzàlez, C.; Dappe, Y. J.; Watanabe, K.; Taniguchi, T.; Magaud, L.; Mallet, P.; Veuillen, J.-Y.; Arenaland, R.; Marty, L.; Renard, J.; Bendiab, N.; Coraux, J.; Bouchiat, V. Weakly Trapped, Charged, and Free Excitons in Single-Layer MoS2 in Presence of Defects, Strain, and Charged Impurities. ACS Nano 2017, 11, 11206–11216
- Castellanos-Gomez et al. 2014 Castellanos-Gomez, A.; Buscema, M.; Molenaar, R.; Singh, V.; Janssen, L.; van der Zant, H. S. J.; Steele, G. A. Deterministic Transfer of Two-Dimensional Materials by All-Dry Viscoelastic Stamping. 2D Mater. 2014, 1, 1
- Langbein and Patton 2006 Langbein, W.; Patton, B. Heterodyne Spectral Interferometry for Multidimensional Nonlinear Spectroscopy of Individual Quantum Systems. Opt. Lett. 2006, 31, 1151
- Langbein and Patton 2007 Langbein, W.; Patton, B. Transient Coherent Nonlinear Spectroscopy of Single Quantum Dots. J. Phys.: Condens. Matter 2007, 19, 295203
- Lepetit et al. 1995 Lepetit, L.; Chériaux, G.; Joffre, M. Linear Techniques of Phase Measurement by Femtosecond Spectral Interferometry for Applications in Spectroscopy. J. Opt. Soc. Am. B 1995, 12, 2467
SUPPLEMENTARY MATERIAL
Coherence and density dynamics of
excitons in a single-layer MoS2
reaching the homogeneous limit