Turbulence in the intracluster medium: simulations, observables & thermodynamics
Abstract
We conduct two kinds of homogeneous isotropic turbulence simulations relevant for the intracluster medium (ICM): (i) pure turbulence runs without radiative cooling; (ii) turbulent heatingradiative cooling runs with global thermal balance. For pure turbulence runs in the subsonic regime, the rms density and surface brightness (SB) fluctuations vary as the square of the rms Mach number (). However, with thermal balance, the density and SB fluctuations are much larger. These scalings have implications for translating SB fluctuations into a turbulent velocity, particularly for cool cores. For thermal balance runs with large (cluster core) scale driving, both the hot and cold phases of the gas are supersonic. For small scale (one order of magnitude smaller than the cluster core) driving, multiphase gas forms on a much longer timescale but is smaller. Both small and large scale driving runs have velocities larger than the Hitomi results from the Perseus cluster. Thus turbulent heating as the dominant heating source in cool cluster cores is ruled out if multiphase gas is assumed to condense out from the ICM. Next we perform thermal balance runs in which we partition the input energy into thermal and turbulent parts and tune their relative magnitudes. The contribution of turbulent heating has to be in order for turbulence velocities to match Hitomi observations. If the dominant source of multiphase gas is not cooling from the ICM (but say uplift from the central galaxy), the importance of turbulent heating cannot be excluded.
keywords:
methods: numerical – hydrodynamics – turbulence – galaxies : intracluster medium1 Introduction
The intracluster medium (ICM) refers to the hot ( K) X-ray emitting plasma that pervades clusters of galaxies. It contains majority of the baryons within the cluster. It is mainly composed of ionised hydrogen and helium, but also contains other elements such as iron. It loses energy via bremsstrahlung and metal line emission.
The radiative cooling time is shorter for a higher density. Since the gas density is higher toward the cluster center, inner regions are expected to cool much faster than the outskirts. In relaxed cool core clusters the core is expected to cool, lose pressure support, and flow toward the center of the cluster (see Fabian 1994 for a review). The cooling gas is expected to cool all the way to form molecules and hence lead to active star formation. The cooling-only model predicts a star formation rate (SFR) 100-1000Myear in cool core clusters. However, observations show a much reduced SFR (by orders of magnitude; e.g., O’Dea et al. 2008). This is known as the cooling flow problem.
It is now accepted that the cool cores lose thermal energy due to radiative cooling, but most of the losses are compensated by heating due to other sources such as thermal conduction, cosmic rays, and turbulence. Heating due to active galactic nuclei (AGN) jets powered by accretion on to the central supermassive black hole (SMBH) is particularly attractive because of sufficient energy and negative feedback (see McNamara & Nulsen 2007 for a review). A cool, dense core is prone to condensation of cold gas in the core that enhances accretion on to the SMBH and the jet power. A much larger jet power driven by multiphase condensation is able to stop catastrophic cooling in the core and the cycle continues (e.g., see Prasad et al. 2015; Li et al. 2015).
Cool cluster cores show multiphase gas (at K traced by CO [e.g., Edge 2001], at K traced by nebular lines [e.g., Hu 1992; McDonald et al. 2012], and of course the diffuse ICM at K). The multiphase gas can be interpreted in terms of local thermal instability in an ICM with global thermal balance (Sharma et al. 2010, 2012). The feedback model proposes that heating by AGN jets acts like a time-delayed feedback loop, which injects on-average the same amount of energy lost via cooling back into the ICM through energetic outbursts (Rafferty et al., 2006; Prasad et al., 2015).
Energy injection through AGN feedback and sloshing of the ICM during mergers (mostly with small subhalos) are expected to drive motion in the ICM. Turbulent structures, density and pressure fluctuations, have been observed in the ICM (Schuecker et al. 2004; Zhuravleva et al. 2014a; Khatri & Gaspari 2016). Turbulence has been proposed as a mechanism through which AGN jets and mergers can heat the ICM via direct turbulent heating (Zhuravleva et al. 2014a; but see Falceta-Gonçalves et al. 2010; Bambic et al. 2018) or via mixing of the much hotter outskirt/bubble gas with the ICM (e.g., Banerjee & Sharma 2014; Hillel & Soker 2017). From the Kolmogorov (hereafter, K41) picture of homogeneous, isotropic turbulence (Kolmogorov, 1941), turbulent energy from the driving scale cascades down the length scales before being dissipated at the viscous scale, thus heating the ICM. Other than heating, turbulence also plays two opposing roles in multiphase condensation: it can generate large density fluctuations, thus aiding condensation of cold filaments; it can mix up the cooling gas with the hot phase, thereby inhibiting multiphase condensation.
Two recent observational studies – Aharonian et al. (2016) (the Hitomi collaboration) and Zhuravleva et al. (2014a) – obtain a similar estimate for the turbulent velocities in the core of Perseus cluster. While Zhuravleva et al. (2014a) reconstruct the velocity amplitudes by analysing the power spectrum of X-ray surface brightness fluctuations, Hitomi directly measured the line of sight velocity dispersion () by analysing the broadening of Fe XXV and Fe XXVI lines. Zhuravleva et al. (2014a) find the turbulent energy injection to be large enough to completely compensate radiative cooling losses. On the other hand, the Hitomi paper emphasizes that the ICM is quiescent, and the turbulent pressure is only of the thermal pressure. Of course, even such a small turbulent velocity can be sufficient to check radiative cooling in the core, provided that the driving scale of the turbulence is sufficiently small (but see Bambic et al. 2018;111Bambic et al. (2018) argue that the time for turbulence to travel to the entire cool core is longer than the cooling time. Another interpretation of this argument is that the turbulent heating rate can be large if the driving scale is sufficiently small. But if is too small compared to the core size, turbulence needs to be driven independently throughout the core because energy primary cascades to small scales in Kolmogorov turbulence. see also the first bullet-point in section 6).
Thus, some of the unanswered questions are: what fraction of ICM feedback heating can be due to turbulent dissipation; the source of cold gas – whether most of it is uplifted or cooling down from the hot ICM; and whether the observed density perturbations are indeed generated by stratified turbulence (an assumption underlying the treatment of Zhuravleva et al. 2014a; density perturbations can also arise from the local thermal instability, leading to the separation of hot and cold phases of gas without generating much turbulence). Although we focus on turbulence-driven density perturbations in cool-core clusters, we also briefly discuss pressure fluctuations that can be probed by the fluctuating Sunyaev-Zeldovich signal out to the virial radius (Khatri & Gaspari 2016). Thus, our results on isotropic/homogeneous turbulence are also applicable to non-cool-core clusters and the circumgalactic medium, particularly at small scales.
In subsonic K41 turbulence, the velocity and density fluctuations at a particular length scale scale as , ; Kolmogorov 1941; Corrsin 1951). This is because the turbulent energy cascade rate is a constant in the inertial regime, given by , and the density behaves like a passive scalar mixed by turbulent eddies. For subsonic turbulence, density variations are small. From these simple scaling relations, we find . Density fluctuations follow the same scaling as ; therefore, . In steady state, on average, this cascading rate is the rate at which turbulent energy is injected into the system at the driving scale and the rate at which it is dissipated at the viscous scale.
In an earlier numerical study Banerjee & Sharma (2014),which assumed that the majority of cold gas in cluster cores is due to condensation from the ICM, showed that when turbulent heating rate () balances radiative cooling rate, the required turbulent velocities are sonic (Mach number close to unity). But cool cores are known to be subsonic. This study assumed the turbulence driving scale to be kpc, comparable to the size of the cool core and AGN bubbles/X-ray cavities. However, if we decrease the driving scale while still maintaining the same energy injection rate , we can decrease since for a constant . This way we can still achieve subsonic velocities driven by turbulent forcing, while still maintaining the global thermal balance between radiative cooling and turbulent heating. But driving turbulence at smaller length scales would also lead to smaller density fluctuations, since . Turbulence driven at smaller scales not only drives weaker turbulence-driven density perturbations, but also suppresses the mixing of hotter and cooler phases at large scales. In this paper we study the impact of the driving scale on the turbulence in cool cluster cores.
Imposing thermal balance between turbulent heating and radiative cooling, ( is the driving scale, is electron/ion number density and is the cooling function) and assuming the expected scalings with the halo mass, implies that the Mach number of the largest eddies ( is the sound speed of the ICM) is rather insensitive to the halo mass. Additionally, if we assume that majority of the observed cold gas in cool cluster cores is produced as a result of cooling from the hot phase (this is plausible but not at all an established fact), then the cooling time of the cooling blob must be shorter than the turbulent mixing time. This condition constraints the Mach number in the hot phase to be larger than a threshold value, which is larger than unity if turbulent heating is the dominant heating source and driving occurs at the core scale (c.f. Eq. 20). Another possibility is that the cold gas in cluster cores is not due to condensation from the hot phase, but say because of uplift by AGN jets and buoyant bubbles (e.g., Revaz et al. 2008). In this case the cooling time of the hot phase can be much longer than the turbulent mixing time and the Mach number in the hot phase can be smaller than unity (at least for small [large] enough ). However, this possibility does not naturally explain the occurrence of multiphase gas only in clusters with the ICM density larger than a certain threshold (e.g., Cavagnolo et al. 2008).
In the first part of our study, we simulate homogeneous isotropic turbulence to derive the relations between gas density (pressure), surface brightness (projected pressure) fluctuations, and the turbulent Mach number of the flow (see section 3). In the second set of runs, more applicable to cool cores, we impose global thermal balance over the entire simulation domain. In these runs, we analyse the thermodynamics of the flow, through Mach number and temperature distribution of the gas. We check the dependence of these thermodynamic aspects on the driving scale, fraction of turbulent heating relative to cooling, and initial density perturbations. Results from these simulations are presented in section 4.
2 Methods
2.1 Model equations
We model the ICM using the hydrodynamic equations. As the ICM plasma is hot and fully ionised, the magnetic fields can have significant effects. From Alfvén’s flux freezing theorem, field lines are frozen into the plasma and have to move along with it. In addition, the microscopic transport of heat along magnetic fields can lead to new buoyancy instabilities (Balbus 2000; Quataert 2008) and enhanced mixing in galaxy clusters (Sharma et al. 2009a; Kannan et al. 2017). Note that the kinetic whistler instability may significantly suppress thermal conduction (Levinson & Eichler 1992; Roberg-Clark et al. 2016).
The aim of the present paper is to study the interplay of turbulence, cooling and density perturbations. Banerjee & Sharma (2014) show that for our setup the evolution of magnetohydrodynamic (MHD) equations with anisotropic thermal conduction gives results qualitatively similar to the hydro simulations. The kinetic energy density in MHD is roughly half that in hydro (see their Fig. 1) and the density fluctuations are larger by a similar factor (see their Fig. 4). Because of smaller turbulent velocities the temperature and Mach number distributions in MHD are more bimodal (see their Figs. 6 & 7). As expected, thermal conduction tends to wipe out small scale structure (Gaspari & Churazov 2013). Since the overall impact of magnetic fields on thermodynamics and dynamics of the high beta ICM is easy to understand qualitatively, evolving HD equations is reasonable for our purposes.
We model the core of the ICM using periodic boundary conditions, ignoring the shallow gradients in density and temperature. Since we model gas at high temperatures (), we ignore self-gravity in our simulations. We solve the following equations:
| (1a) | ||||
| (1b) | ||||
| (1c) | ||||
where is the gas mass density, is the velocity, is the pressure, is the turbulent force per unit volume that we apply, is the total energy density, is the mean molecular mass, is the proton mass, is the Boltzmann constant, is the temperature, and are the thermal heating and cooling rate densities respectively, and is the adiabatic index. The cooling rate density is given by
| (2) |
where is the temperature-dependent cooling function of Sutherland & Dopita (1993) corresponding to solar metallicity, and and are electron and ion number densities respectively. The turbulent forcing is applied using a spectral forcing method, as described in subsection 2.3. In some runs, we include uniform thermal heating () throughout the domain, such that cooling is balanced by the sum total of turbulent and thermal heating. Viscosity and thermal conduction are not included explicitly.
We carry out two sets of simulations (see Tables 1 and 2). In turbulence-only simulations we vary the forcing amplitude to drive turbulence at different Mach numbers, but do not include cooling. The aim of these runs is to relate density (pressure) and surface brightness (projected pressure) fluctuations to the turbulent velocity for isotropic/homogeneous turbulence relevant below the Ozmidov scale (the scale at which the internal gravity wave oscillation timescale equals the turbulent eddy timescale; Ozmidov 1965). In the second set of simulations we impose thermal balance averaged over the whole computational domain to mimic the observed global thermal balance in cool cluster cores; i.e., the sum of the work done per unit time by turbulent forcing and the thermal power input equals the volume integrated cooling rate. In the thermal balance runs the denser/cooler regions cool and the hotter regions are heated (slowly) by design. Thus the temperature of the hot phase increases steadily and the CFL time step becomes shorter, making the second set of runs more time consuming. With gravity the hot regions will rise and cooler blobs will sink, but this physics is not included for the simulations in this paper. Our simulations are thus more relevant for scales below the Ozmidov scale, below which the Richardson number and turbulence dominates over buoyancy effects (see Equation 16 for the definition of .)
2.2 The cooling cutoff
In the absence of a gravitational field (and consequent stratification), cold gas can separate out from the hot phase due to local thermal instability. This cold gas collapses to an extremely small scale (Field 1965; Koyama & Inutsuka 2004; Sharma et al. 2010). In order to prevent the cold gas from collapsing to an extremely small scale we cut off the cooling function at a temperature . The scale of collapsing clouds, assuming isobaric conditions, goes as . For a very short cooling time, the isobaric condition is not valid during collapse and the gas can fragment on the scales of (McCourt et al. 2018) where
| (3) |
is the sound speed and
| (4) |
is the cooling time evaluated at the temperature of the cold stable phase.
To prevent cold gas from collapsing to unresolvable small scales, we truncate the cooling function at a small temperature floor . Thus, the cooling rate now has a form
| (5) |
where is the Heaviside function. We choose for most runs (we also tried a few runs with to check the sensitivity to this parameter). This choice is reasonable, since most of the gas that cools to K will cool to K because of a short cooling time in this temperature range. A higher cutoff temperature enables us to better resolve the cold phase.
2.3 Turbulent forcing
We follow a spectral forcing method using the stochastic Ornstein-Uhlenbeck (OU) process to model the turbulent force with a finite autocorrelation time scale (Eswaran & Pope 1988; Schmidt et al. 2006). The acceleration in the Fourier space is given by
| (6) |
where the exponential damping factor ( is the time step size), is the acceleration amplitude generated by our random number generator, being a time-step label. It is generated by a Gaussian random number generator with amplitude . We make sure that the driving acceleration is solenoidal, by subtracting its component along in Fourier space, and taking only the solenoidal component,
| (7) |
We limit the modes to which forcing is applied in the Fourier space by setting two limits and , which control the distribution of in the Fourier space. The force in the real space is given by:
| (8) |
The typical values of and are of the order of . We label the wavenumbers by is the box-size) that are indicated in Table 1 and Table 2 for each run.
We make sure that turbulent forcing does not add any net momentum to the computational box. We subtract a constant from all three components of momentum at all grid points, such that at each time step ( denotes volume average and is the change in velocity at a grid point due to turbulent forcing).
In heating balancing cooling runs, we scale turbulent forcing so as to maintain global thermal equilibrium, i.e., we explicitly enforce the following condition:
| (9) |
We introduce a parameter which denotes the fraction of cooling that is compensated by turbulent heating. To maintain thermal balance, the gas is thermally heated uniformly at a rate at each grid point.
2.4 Initial density perturbations
In some of our runs, we initialize isobaric density fluctuations on top of the uniform density, which are generated such that , the Fourier transform of , has a scaling similar to that expected in a steady turbulent flow, i.e., . Our initial density fluctuations follow this scaling for .
2.5 Numerical Methods
We use a modified version of the grid based PLUTO code (version 4.1; Mignone et al. 2007) for our simulations. We evolve the Euler equations in PLUTO, with additional forcing, cooling and heating terms added as source terms (Eqs. 1a-1c). The relation between pressure, density and temperature is set by the ideal gas equation of state. We use the tvdlf (Total Variation Diminishing Lax-Friedrich) solver, with periodic boundary conditions, RK-3 time stepping and parabolic reconstruction. All our runs use a box size of 40 kpc in each direction, with 3D Cartesian grids having a resolution of . We have tested the code for numerical convergence by doubling the resolution to for some of the runs. Our box size of 40 kpc ensures that we are able to focus on the cool core and have a good resolution, upto 100 pc.
We initialize the gas with a temperature of keV, , which give a cooling time 60 Myr. We assume the gas composition to have and (although we use a cooling function corresponding to metallicity). For our thermal balance runs, the local thermal instability leads to the separation of gas into hot and cold phases, and the rarer/hotter phase (which is hotter and rarer than the initial condition) represents the ICM.
| Label | Resolution | Forcing Amplitude () | Remarks | |
|---|---|---|---|---|
| Fl1 | 0.005 | subsonic | ||
| Fl2 | 0.02 | subsonic | ||
| Fl3 | 0.1 | transonic initially | ||
| Fl4 | 0.9 | supersonic initially | ||
| Fl5 | 2.5 | supersonic initially | ||
| Flr | 0.005 | subsonic, results converge | ||
| Fh | 0.1 | subsonic |
In the labels, F stands for Fiducial (without explicit heating & cooling), r denotes the high resolution run with grid points, l denotes driving at low s (), h denotes driving at high s ().
3 Results – Turbulence-only runs
Here we describe the results of our fiducial (turbulence-only, no cooling or thermal heating) simulations. Table 1 lists the parameters of these runs. The energy equation (Eq. 1c) is thus
| (10) |
The gas temperature increases with time due to work done by turbulent forcing, the strength of which we characterize by an amplitude .
The flow is subsonic for lower values of , and transonic/supersonic at early times for a large . Since we do not have radiative cooling in these runs, the gas eventually heats up, and the flow always becomes subsonic at later times as the sound speed increases.
3.1 Mach number and density/pressure perturbations
Figure 1 shows the relative root mean square (rms) fluctuations in density and pressure as a function of the rms Mach number
| (11) |
where is the rms velocity and is the volume-averaged sound speed. In the subsonic regime (), the density and pressure fluctuations vary as . In the transonic/supersonic regime, both density and pressure fluctuations flatten with (e.g., see Fig. 7 in Nolan et al. 2015). Further, the density and pressure fluctuations scale linearly with each other in the subsonic regime but in the shock-dominated supersonic regime the density behind a shock can only be a factor of 4 higher than the ambient value but the pressure can be much higher, indicating the breakdown of the linear scaling.
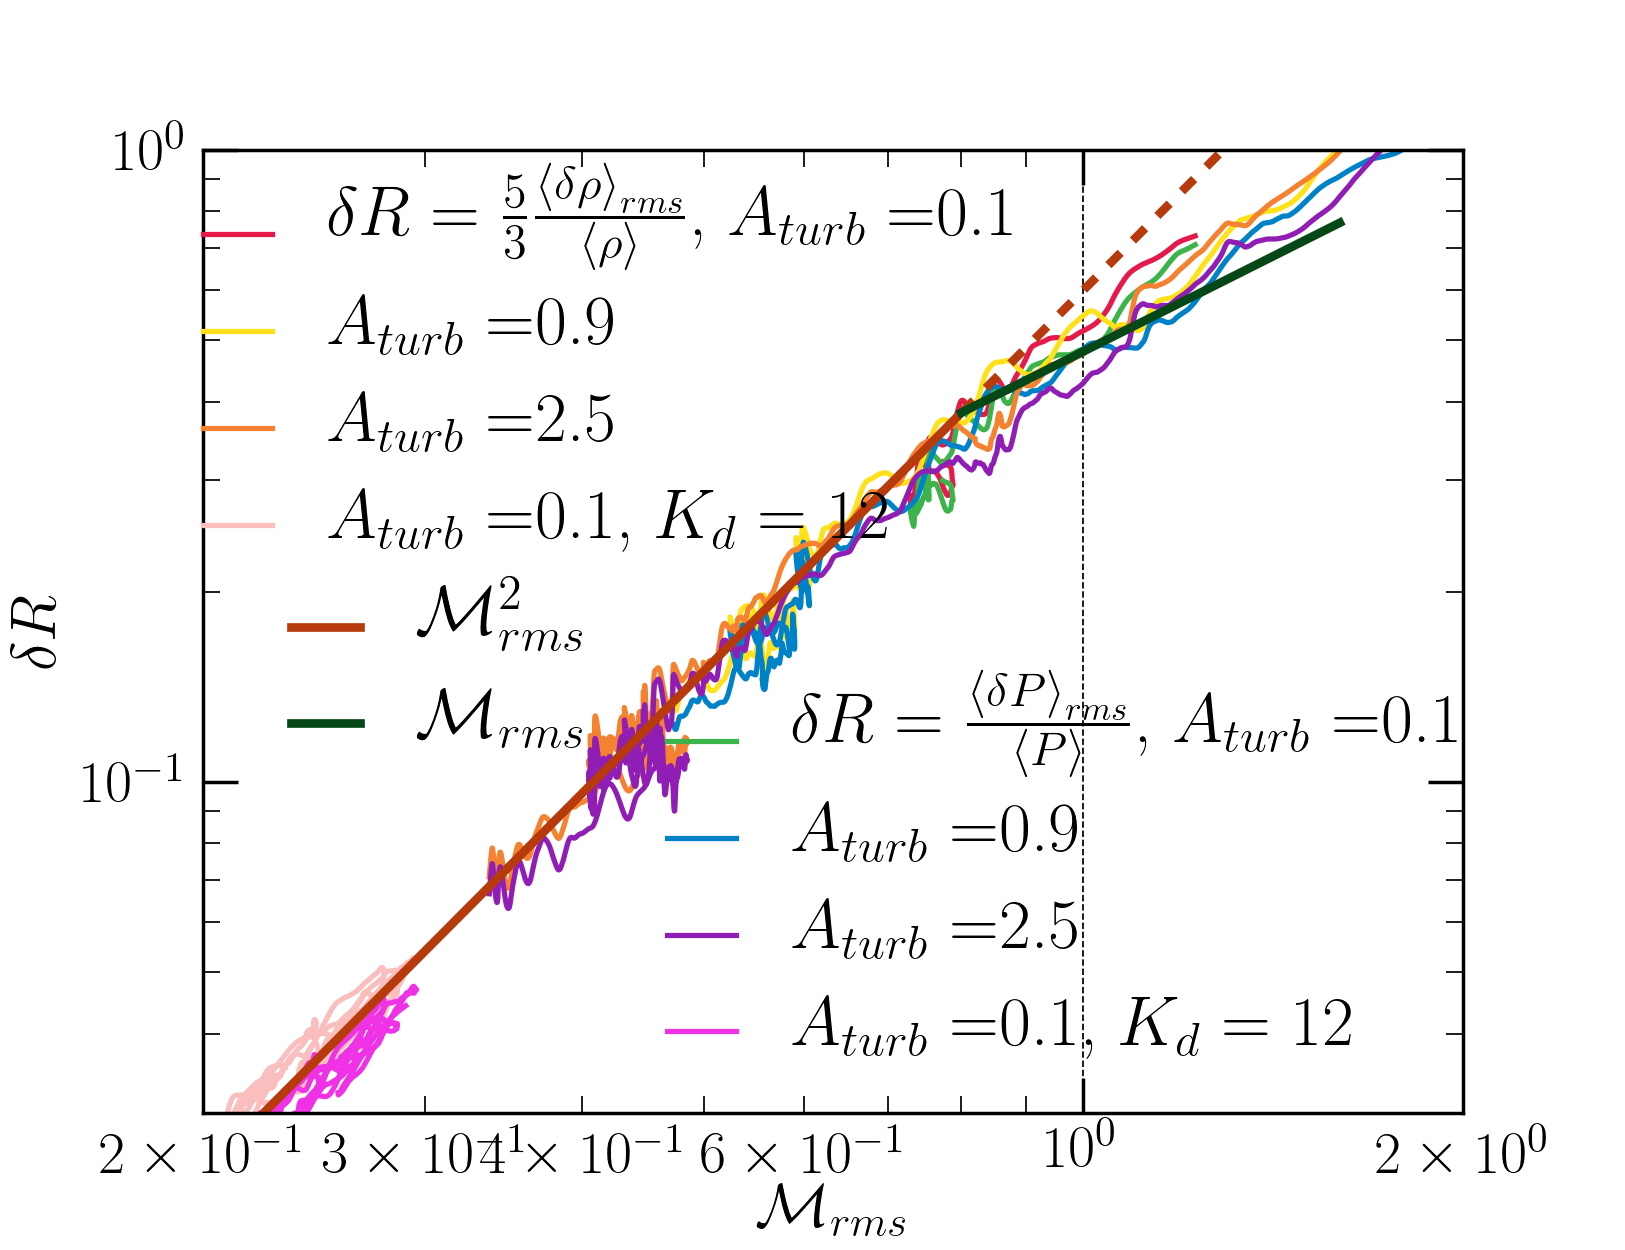
The scaling of density and pressure fluctuations with the Mach number can be motivated from the following arguments. In the subsonic regime, the flow is close to incompressible and the pressure satisfies the Poisson equation , which implies that , or . For transonic Mach numbers the disturbance are dominated more and more by sound-like perturbations with and (this is just the relation between fluctuations in a sound wave). In both subsonic and transonic regimes the pressure and density fluctuations are related as . These scalings explain the observed relation in Figure 1. The top-left panel in Fig. 6 of Konstandin et al. (2012) shows a similar scaling of density fluctuations222They measure the width of the PDF of , which in the subsonic regime should roughly equal . We have done some low Mach number simulations with pure compressible driving, and find that and scalings are closer to than for . This does not agree with Fig. 6 of Konstandin et al. (2012), but it may be because they are using an isothermal equation of state for which pressure is a constant times the density and our pressure fluctuations are governed by Eqs. 1a-1c. and Mach number as ours for their isothermal turbulence simulations with solenoidal driving (like us).
3.2 Power spectra
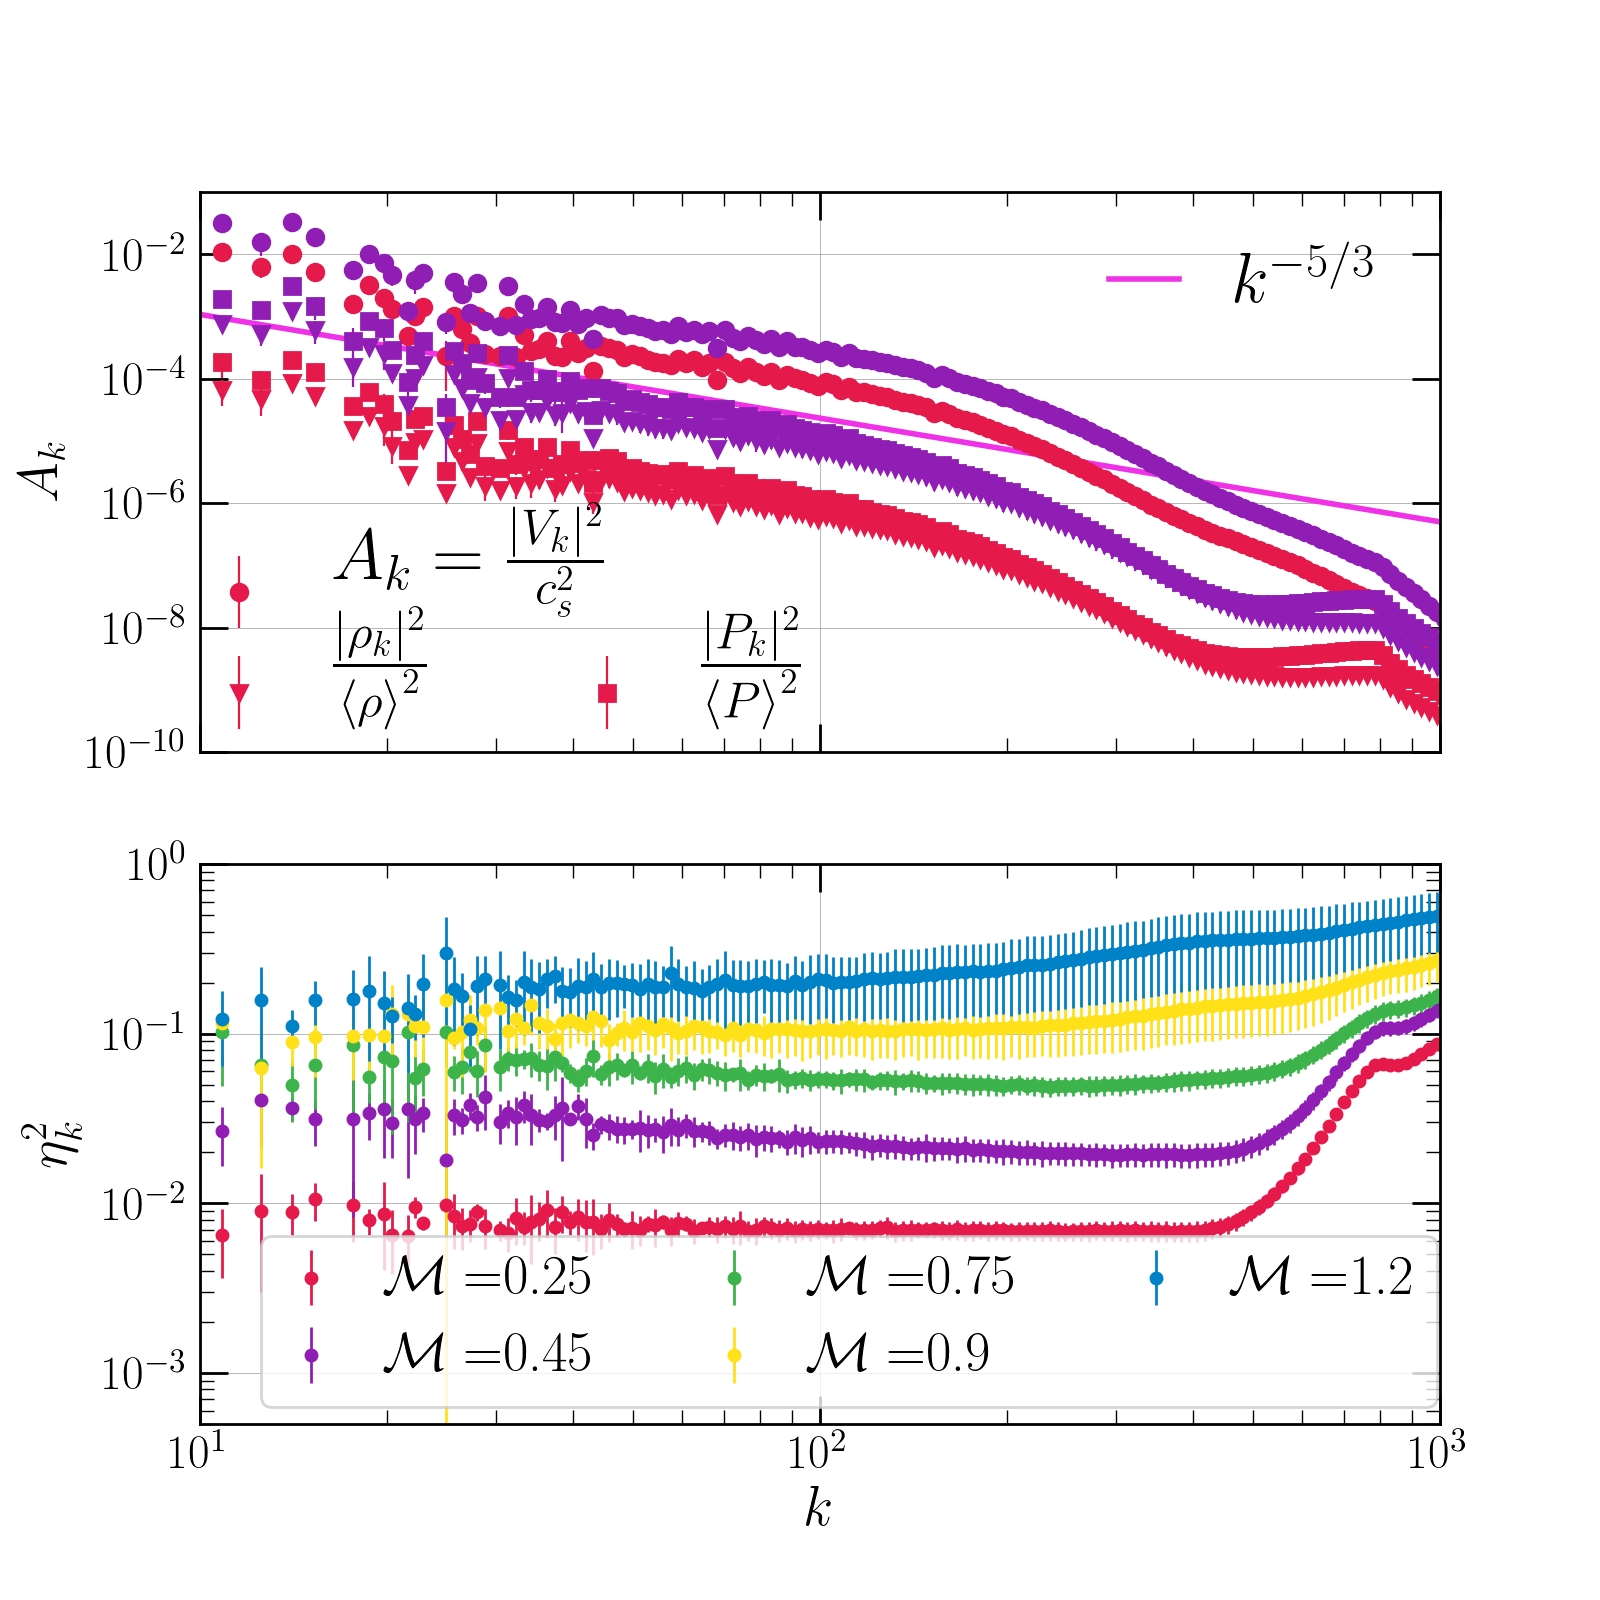
Now that we have established that the domain averaged rms density and pressure fluctuations vary as for subsonic turbulence relevant for the ICM, we move on to power spectra. We find that the spectral amplitudes of both velocity and density perturbations and vary as (i.e., density follows the Obukhov-Corrsin spectrum for passive scalars; Corrsin 1951). Although the density and velocity power spectra have the same slope, from Figure 1 and Parseval’s theorem (equal power in real and Fourier space) we expect to increase with an increasing . Figure 2 shows the density/pressure and velocity power spectra (top panel) and their ratio (bottom panel) for some of our fiducial runs. Notice a large flat portion in the ratio between power spectra of density and velocity, but an increasing value of the ratio with an increasing Mach number.
The top panel of Figure 2 shows that the density and pressure power spectra are very similar for . We expect the pressure spectrum to be steeper by unity than the density spectrum (which follows the passive-scalar/velocity spectrum) in the very subsonic regime (e.g., see Eq. 6.94 in Lesieur 2008). However, for the Mach numbers relevant for galaxy clusters we find an almost the same spectral slope for the pressure and density power spectra, with only a slight hint of steepening of the former at the smallest Mach numbers.
The ratio of the density and velocity power spectra is proportional to , where is the density fluctuation flux and is the kinetic energy flux (both are constant in the inertial range), which can be defined as
| (12) | |||
| (13) | |||
| (14) |
where is the characteristic velocity at length scale (note that the labels and are interchangeable). The ratio of the power spectra is constant in the inertial range as seen in Figure 2, and , are constants independent of . Note that these arguments need to be modified for transonic/supersonic turbulence. In the transonic runs, the inertial range is not flat, and Figure 2 shows that there is a slight increase in the ratio with an increase in . Perhaps most importantly for the ability to convert density fluctuations to turbulent velocities, the ratio of powers in density and velocity perturbations at a given scale is proportional to the Mach number. This is found to be a constant in previous works that include stratification (Zhuravleva et al. 2014b; Gaspari et al. 2014).
3.3 Surface brightness fluctuations
In X-ray observations we directly observe the surface brightness (SB); i.e., the X-ray emissivity integrated along the line of sight that has contributions from different spherical shells. Correlating SB fluctuations with velocity fluctuations provides a way to constrain fluid motions in the ICM. This is a promising approach in absence of direct turbulent velocity measurements from high resolution X-ray spectra.
We define the surface brightness as
| (15) |
Note that before performing these calculations, we manually set the density fluctuations from the mean values to decay slowly to zero outside a sphere centered at the origin, with a scale radius . This is done to impose a realistic spherical symmetry, but its effects are moderate and only at the lowest wavenumbers. The procedure is described in detail in appendix B.
3.3.1 Dependence on Mach number
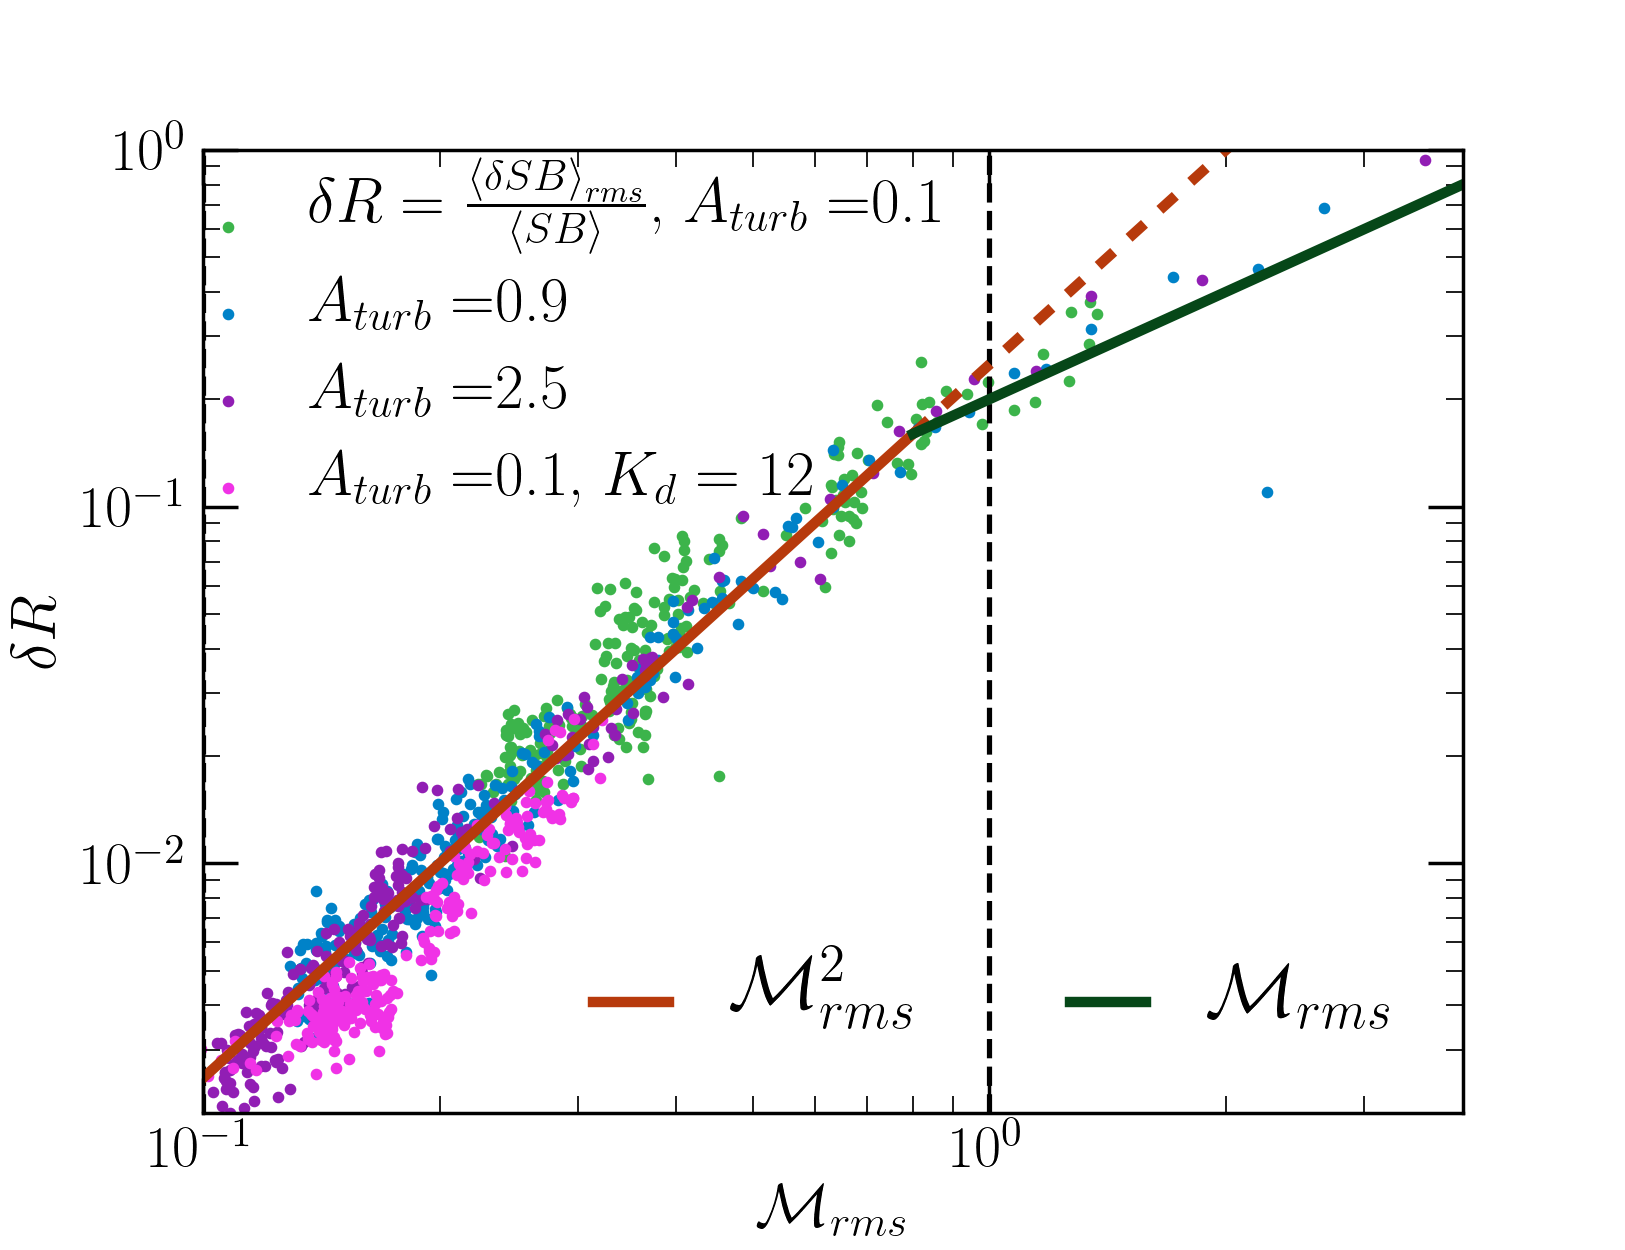
Figure 3 shows that the surface brightness fluctuations have a similar dependence on as . In the subsonic regime surface brightness fluctuation amplitude varies as , and in the supersonic regime it is flatter.
3.3.2 Surface brightness power spectra
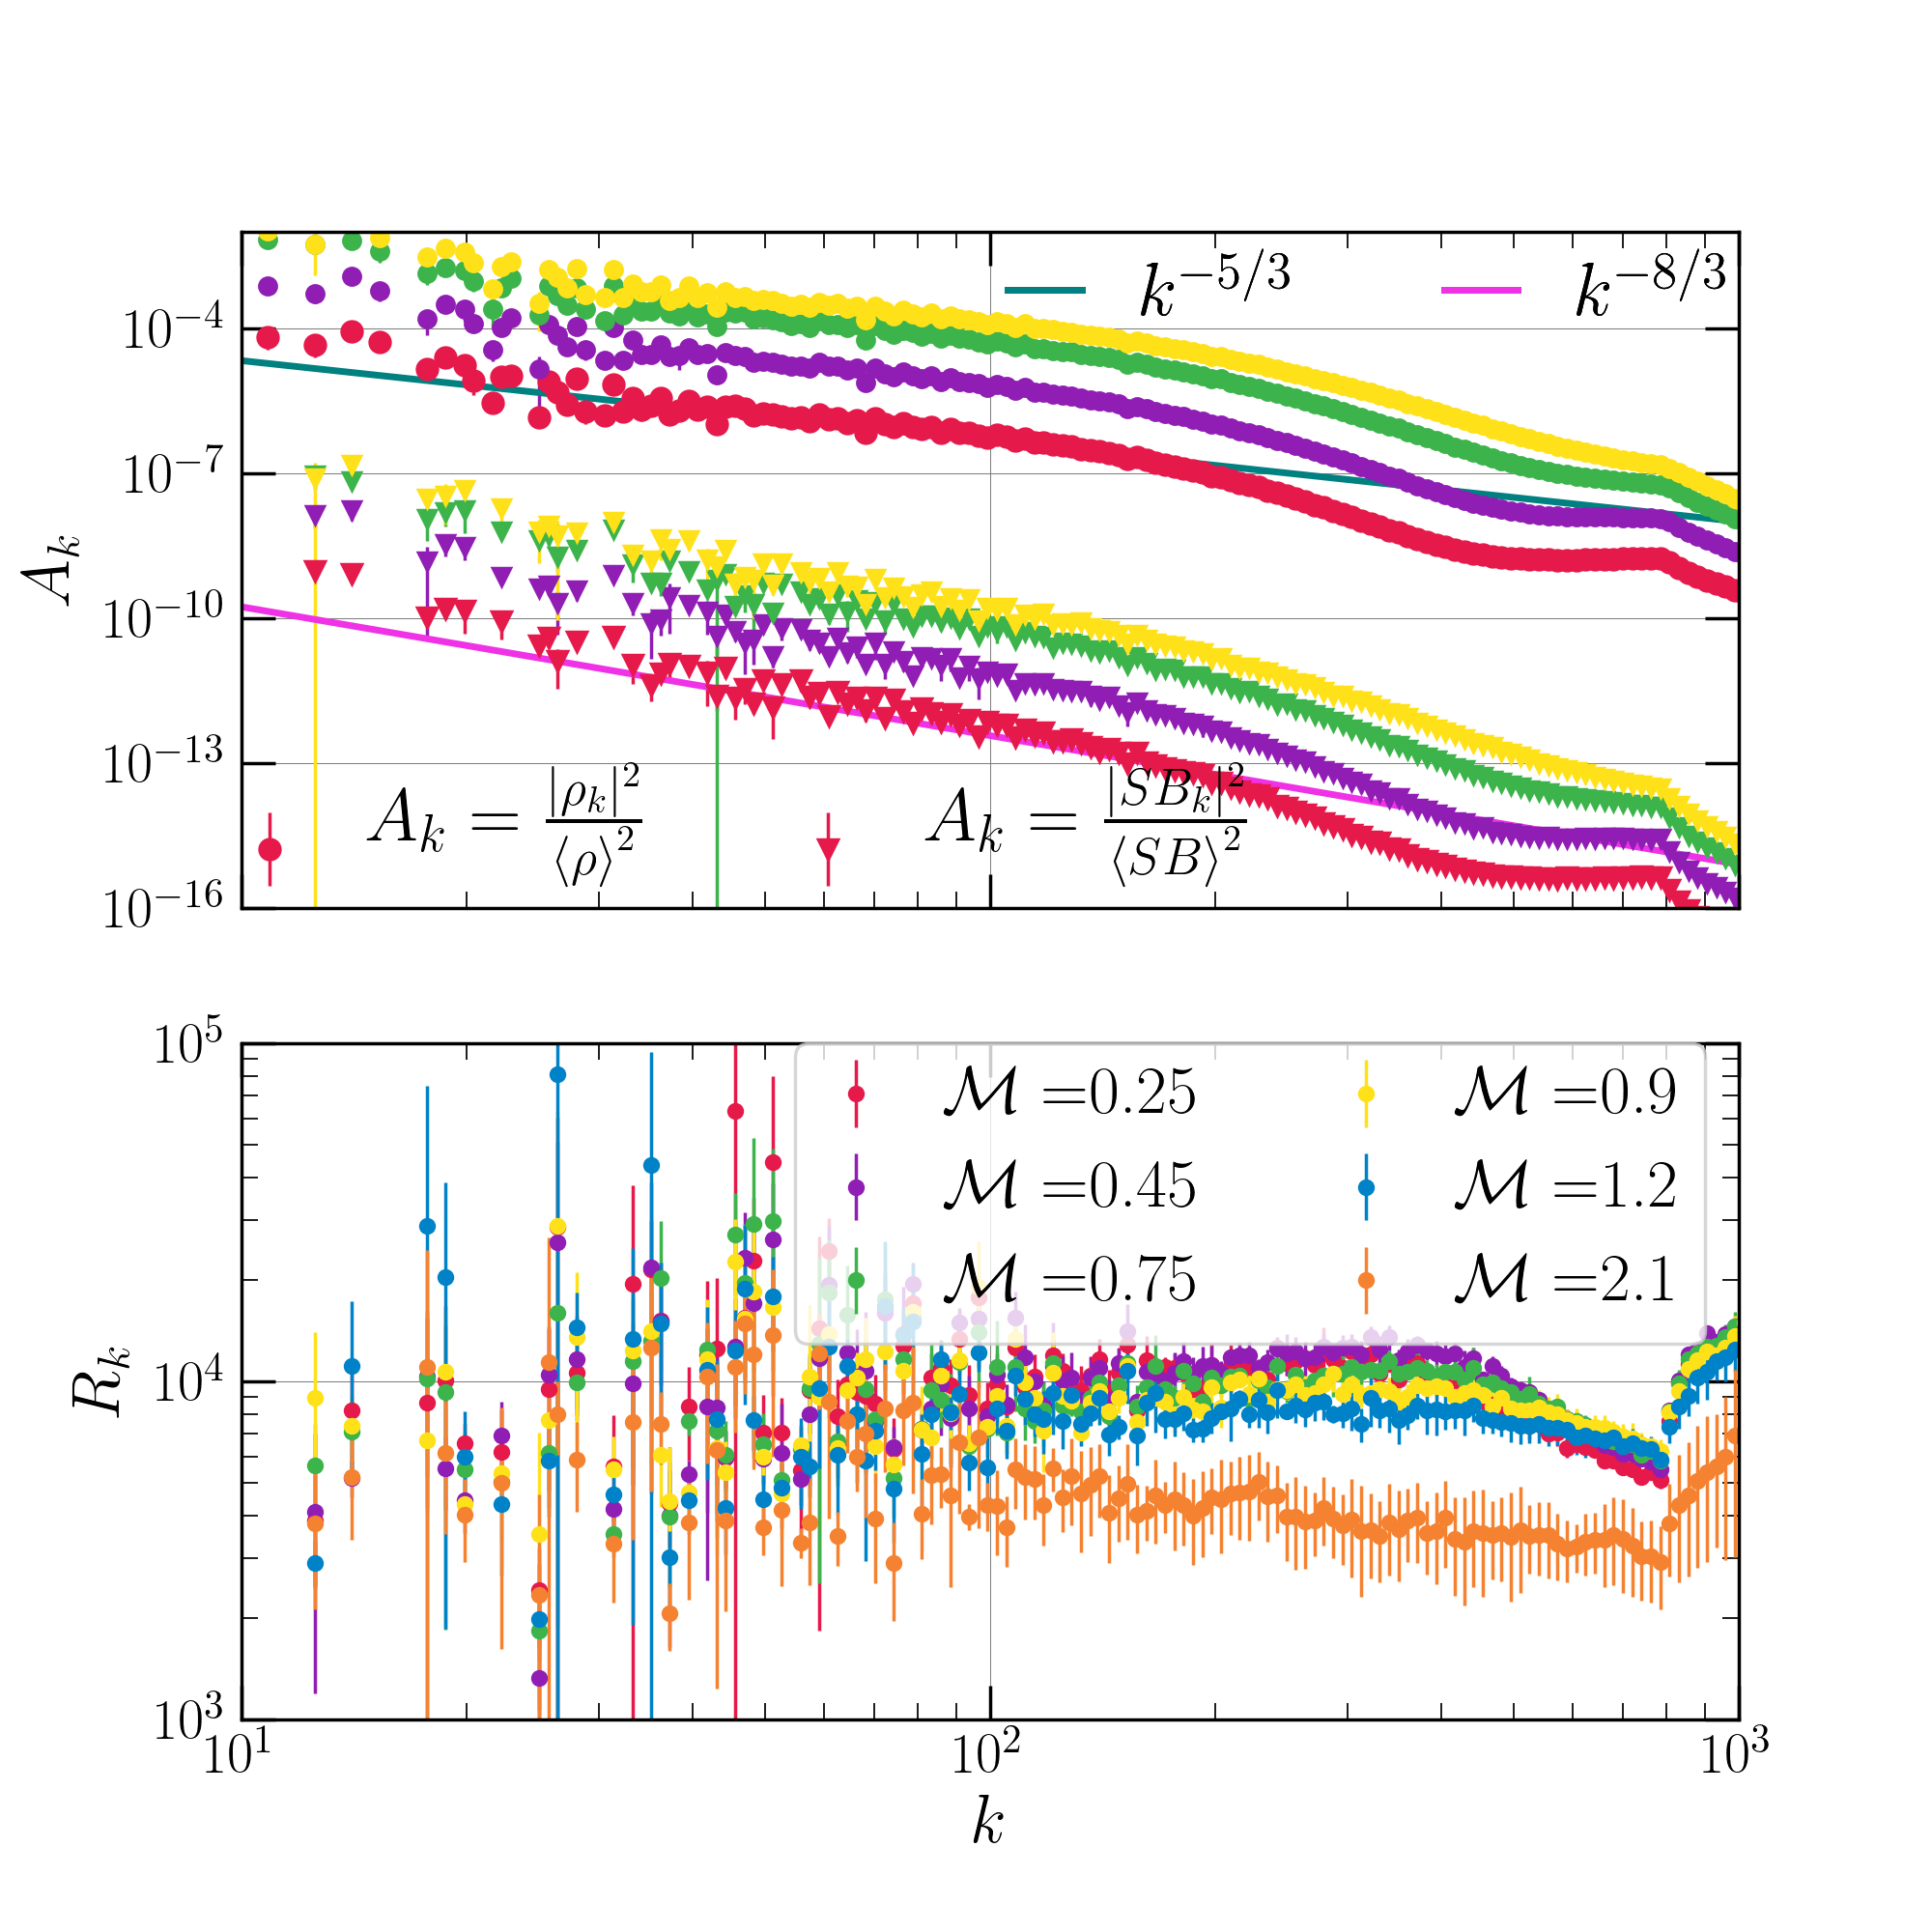
Figure 4 shows that the surface brightness power spectra follow a scaling in the inertial range, which is steeper by unity than the density spectrum . This is because the number of -space points grid points within is proportional to for spherical shells and to for circular annuli. Since the power spectra differ by a factor of , the spectral amplitudes of surface brightness and density fluctuations would differ by a factor of . This result is in line with the 3D and 2D spectral amplitude relations discussed in section 3 of Churazov et al. (2012). In the subsonic regime the ratio of relative density and compensated surface brightness fluctuations is almost a constant in the inertial range.
4 Results – heating balancing cooling
In the simulations described in this section, we are more faithful to cool core thermodynamics and explicitly balance radiative cooling rate with the sum of turbulent and thermal heating rates. Observations show that the hot gas is in rough thermal balance. The factor gives the turbulent heating fraction out of the total (thermal+turbulent) heating. The gas is uniformly heated by a constant thermal heating rate density , where is the average radiative cooling rate of the box. In some of our runs, we seed the gas with initial random density perturbations, using the method described in subsection 2.4. Table 2 lists our thermal balance simulations.
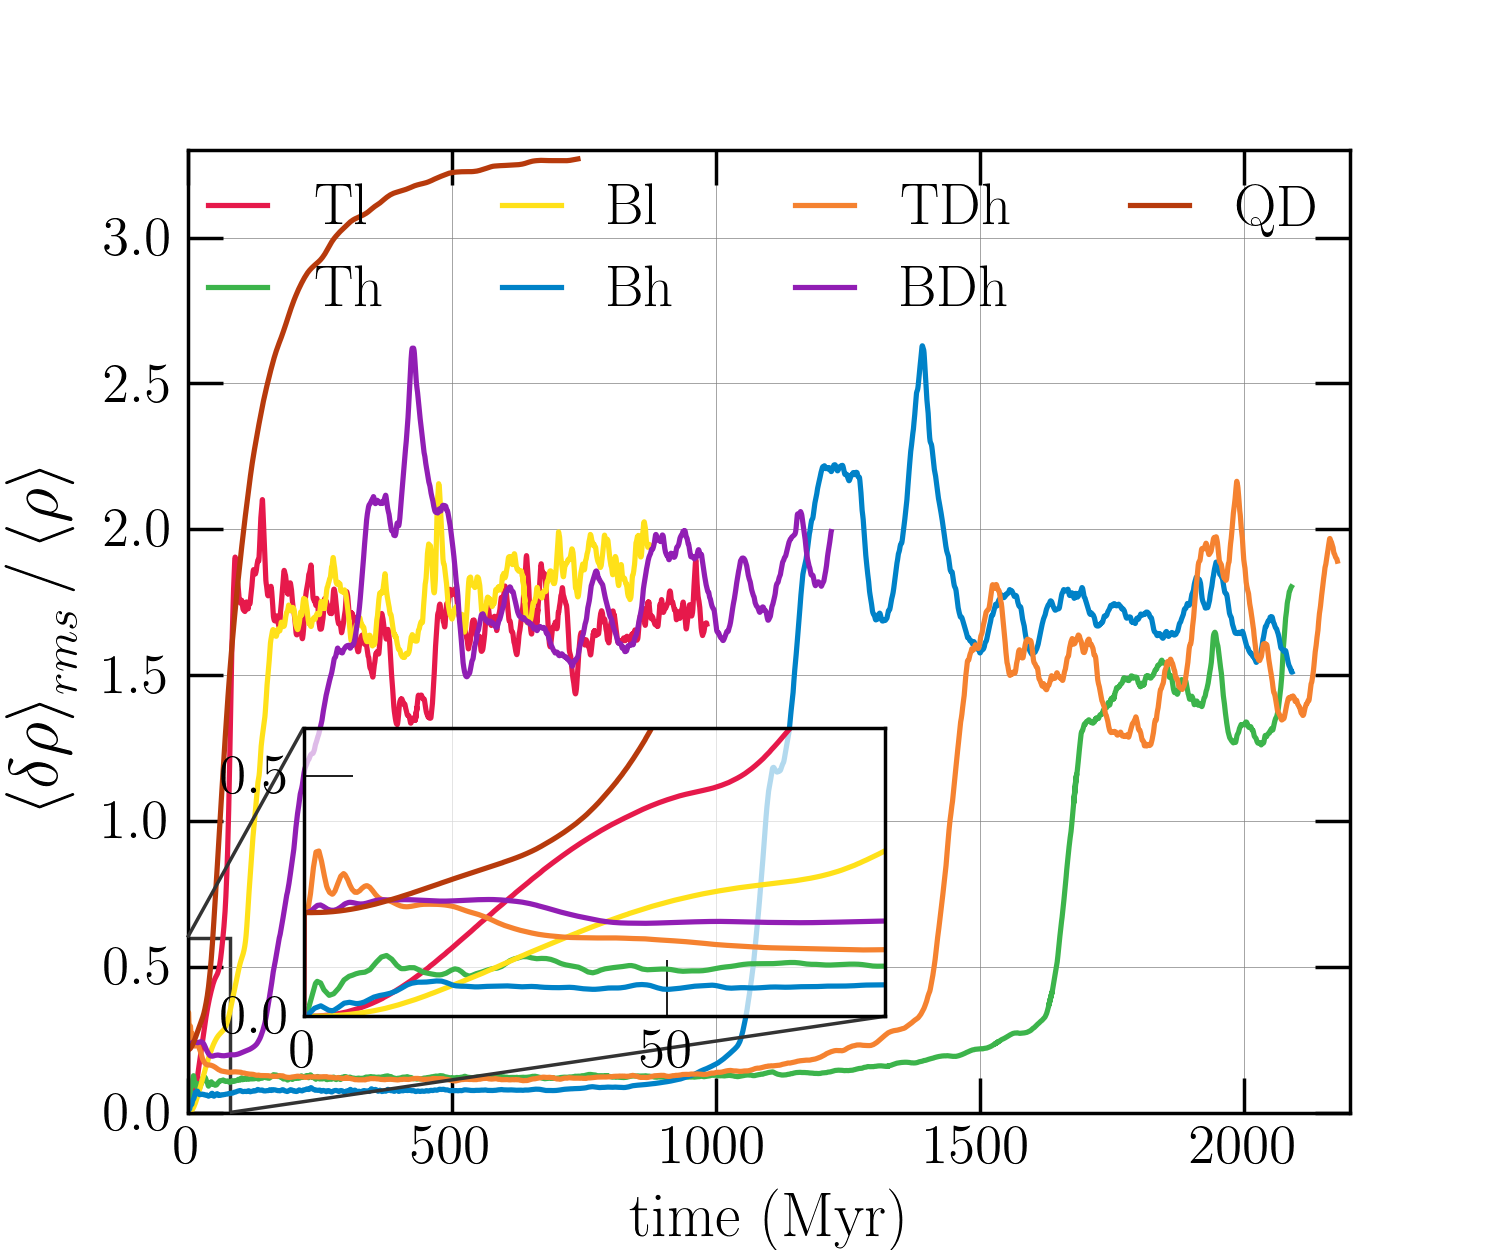
Figure 5 shows the time evolution of the volume-averaged rms density fluctuations (normalized to the mean density) in our thermal balance runs. Most of these runs show two stages of evolution – the first being a turbulent steady state and the second reflecting thermal instability that leads to multiphase condensation. The first stage occurs after an eddy turnover time scale for most of our runs. It depends on the amplitude of forcing, and thus on the parameter (the fraction of turbulent heating). The second stage of evolution has much higher density fluctuations (. In this stage, the gas separates into hot and cold phases due to thermal instability. The multiphase gas formation time scale is very different for different parameter choices.
| Label | Resolution | Forcing Amplitude | initial | (Myrs) | (km/s) | Remarks | ||
|---|---|---|---|---|---|---|---|---|
| Tl | autoscaled | 1.0 | off | 90 | 380 | supersonic gas | ||
| Th | autoscaled | 1.0 | off | 1700 | 255 | long | ||
| Tlr | autoscaled | 1.0 | off | 90 | – | results converge with Tl | ||
| Thr | autoscaled | 1.0 | off | 1500 | – | shorter as compared to Th | ||
| Bl | autoscaled | off | 160 | 361 | supersonic gas | |||
| Bh | autoscaled | off | 1200 | 228 | long | |||
| QD | 0 | n/a | 40 | 32 | immobile cold gas clumps | |||
| TDh | autoscaled | 1.0 | 1500 | 260 | long | |||
| BDh | autoscaled | 400 | 226 | subsonic gas, reasonable | ||||
| BDh2 | autoscaled | 240 | 165 | reproduces Hitomi velocity profile | ||||
| BDh3 | autoscaled | 320 | 202 | subsonic gas, reasonable | ||||
| BDh4 | autoscaled | 500 | 254 | subsonic gas, reasonable | ||||
| BDh5 | autoscaled | 700 | 264 | long |
In the labels, T stands for pure turbulent heating (), Q denotes pure thermal heating () and B stands for both thermal and turbulent heating, r denotes a resolution of grid points (all other runs use a grid with grid points), l denotes driving at low s (), h denotes driving at high s (), D denotes initial density perturbations with (, is a constant amplitude). represents the velocity dispersion along the line of sight.
4.1 Pure turbulent heating (Tl & Th)
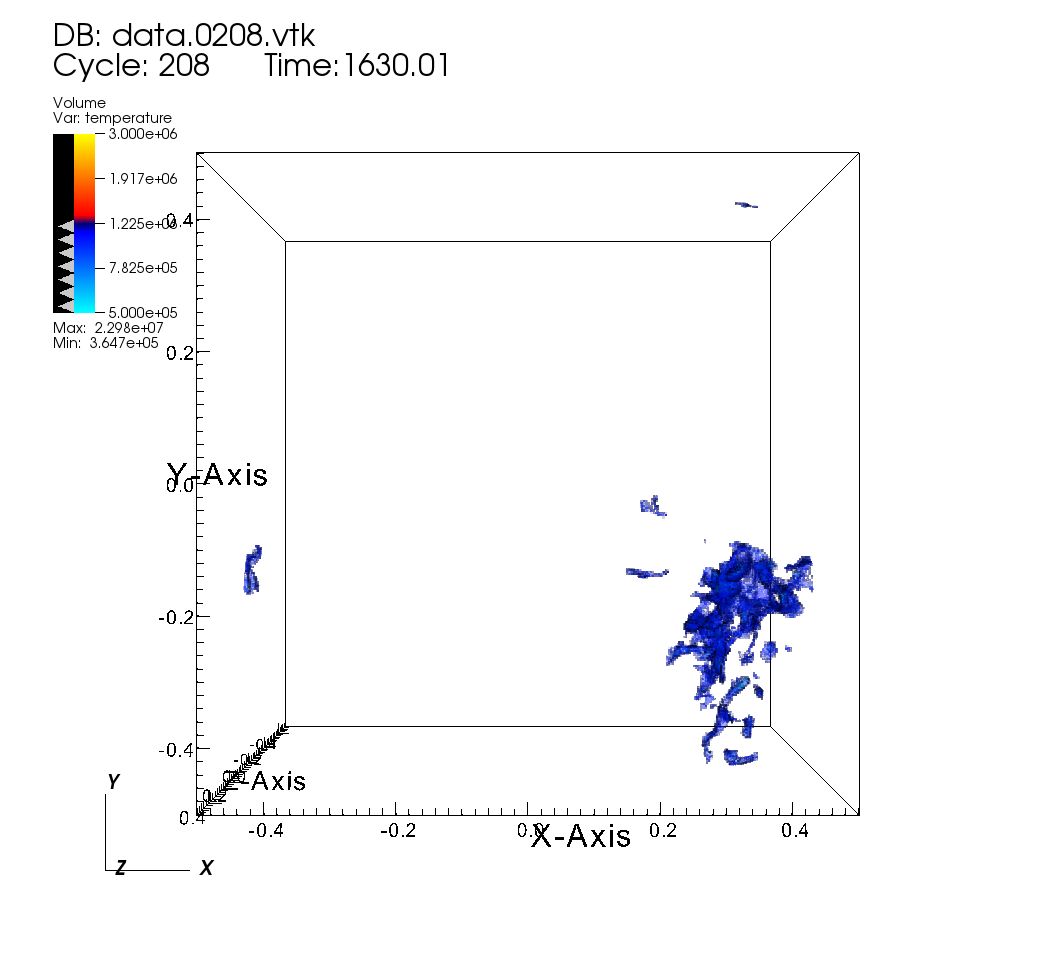
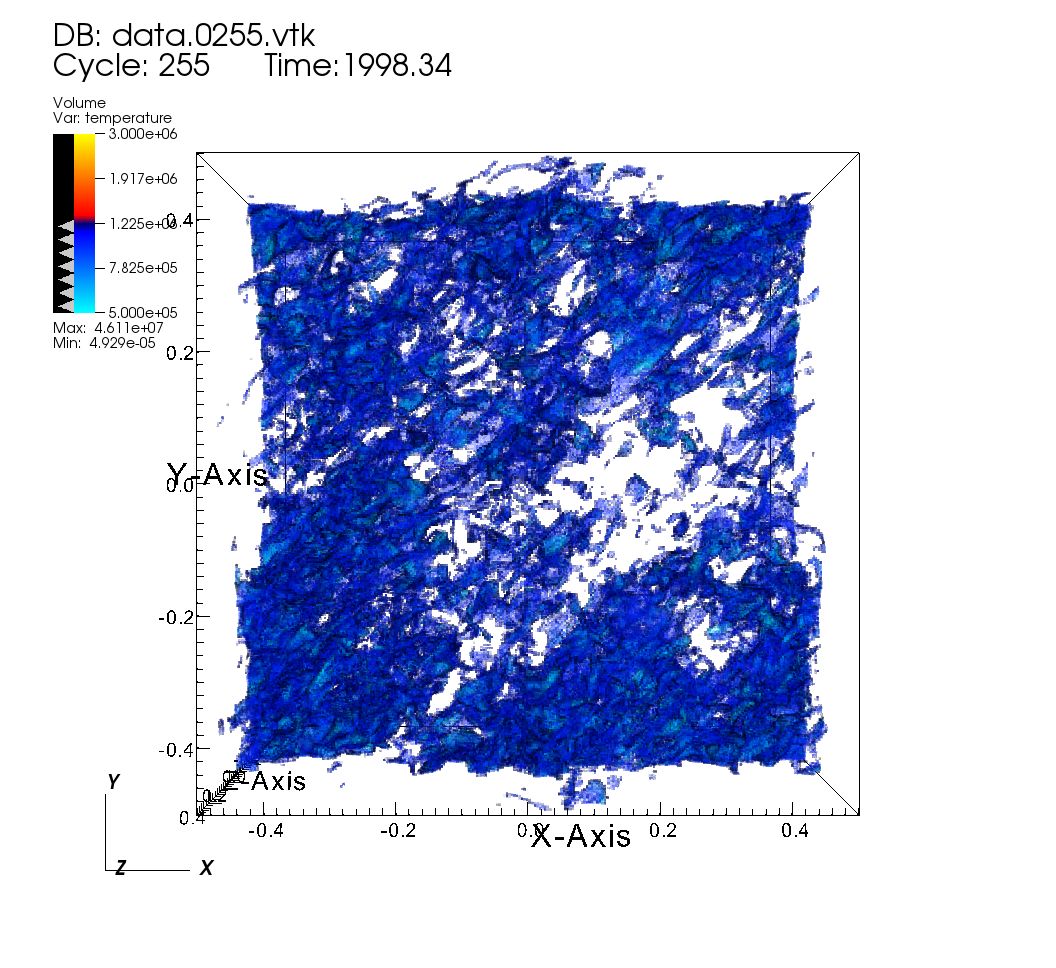
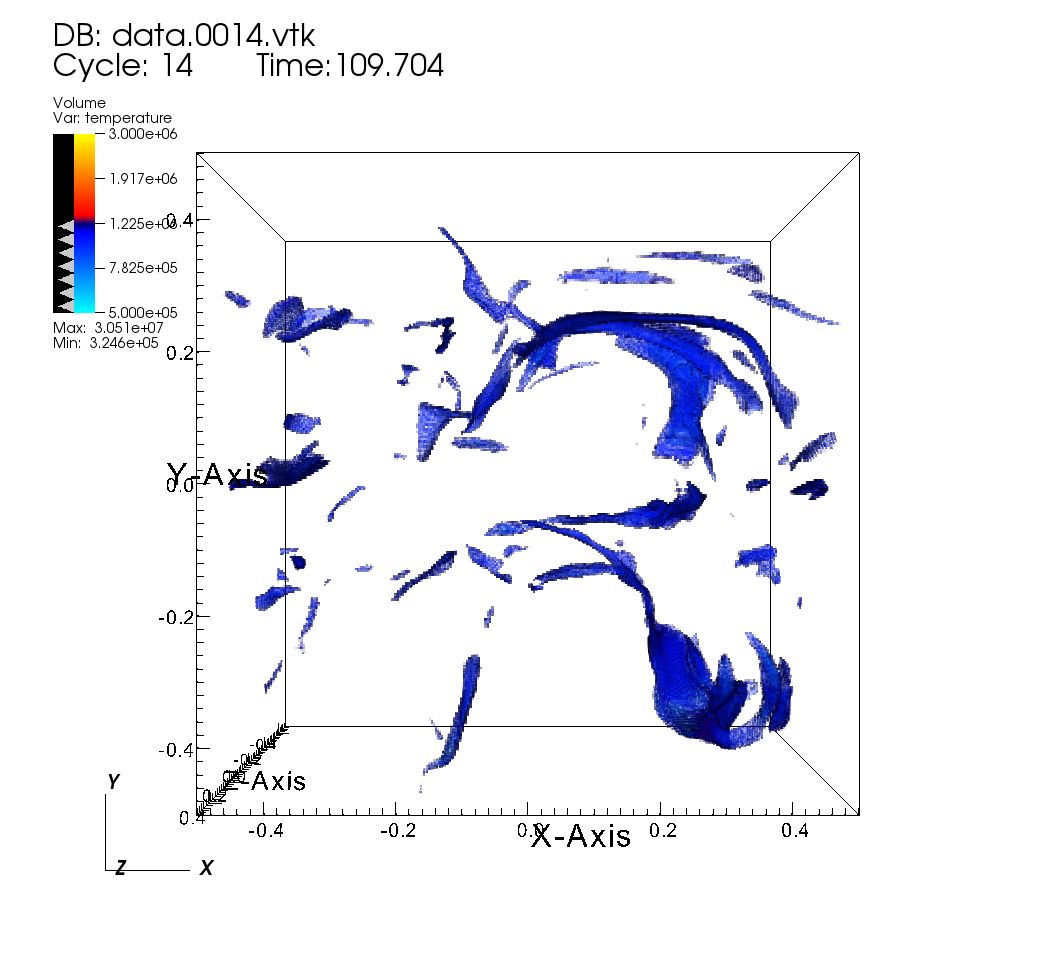
For runs Tl (low- driving) and Th (high- driving; see Table 2), we use (i.e., turbulent heating fully compensates energy losses due to radiative cooling at each time step). We do not initialize density perturbations in these runs (they are seeded by turbulence itself). Both runs with driving at large and small length scales show multiphase gas. While the run with large driving scales (Tl) has Myr, for small scale driving (Th) Myr (20 times longer!). The time can be directly measured from the plot of rms density perturbation versus time (Figure 5), which grows by an order of magnitude when multiphase gas condenses. Local thermal instability can lead to cold gas condensation and nonlinear density perturbations, but it may take several cooling times.
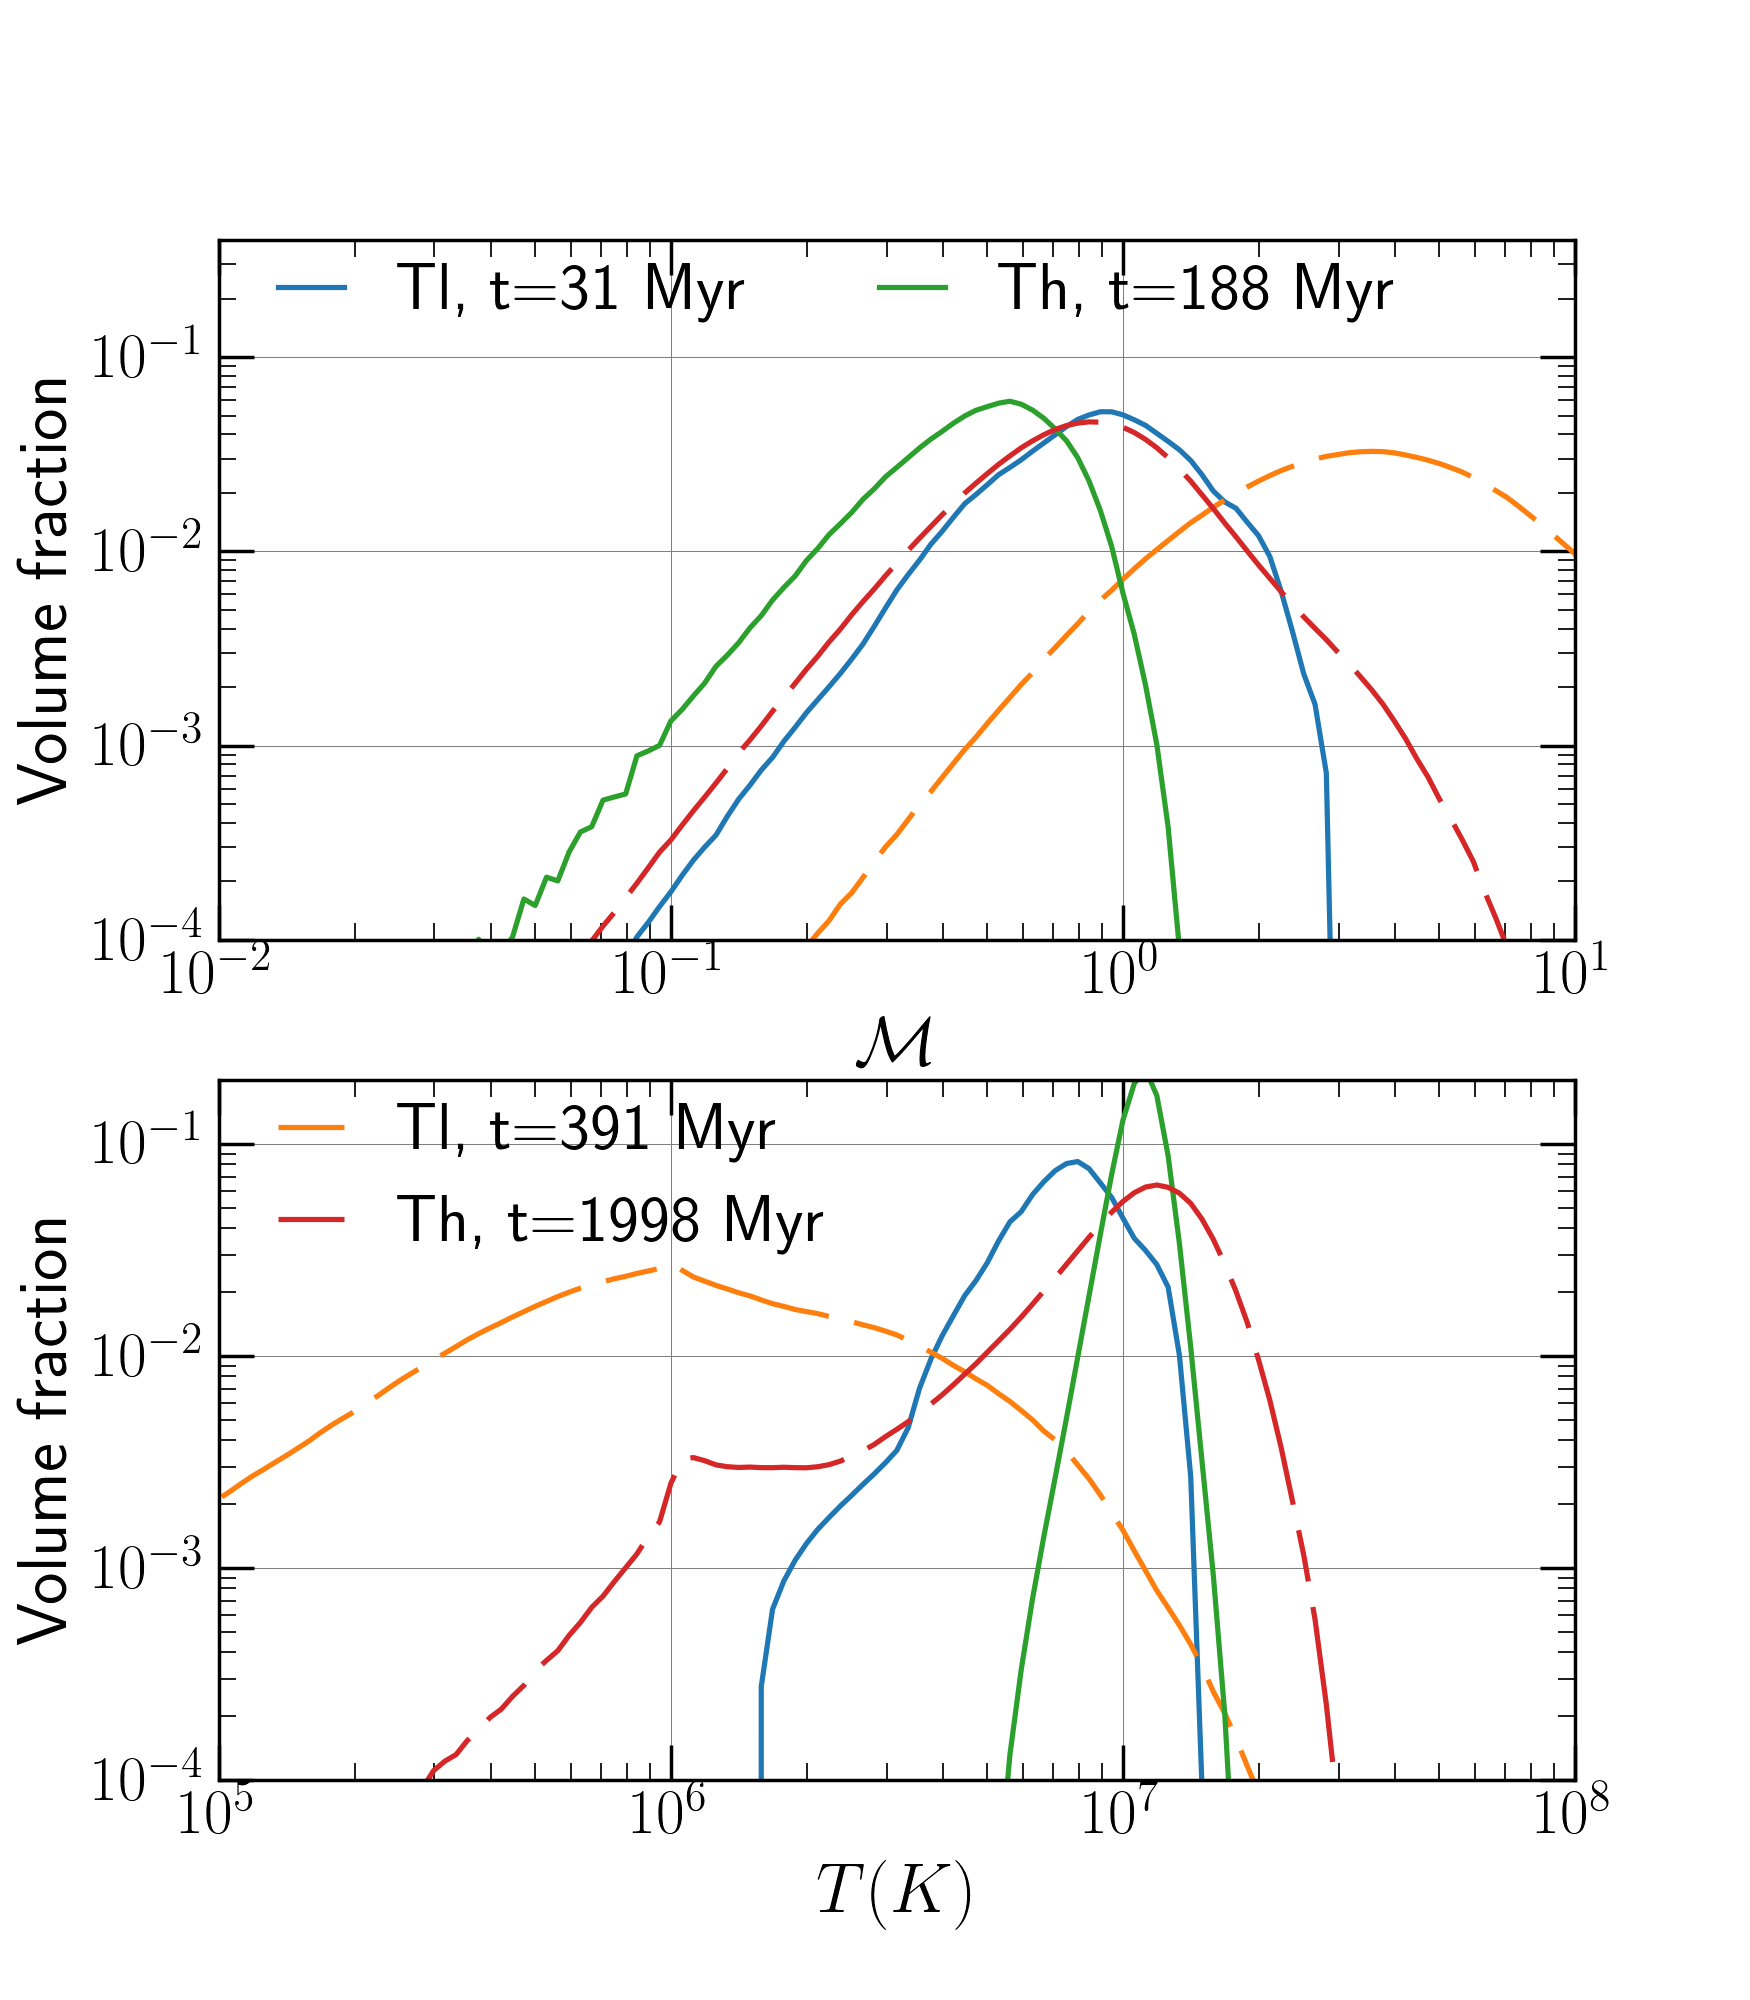
Figure 6 shows the Mach number and temperature distributions for the two runs Tl and Th before and after multiphase condensation. Compared to Th, Tl has a fair amount of gas at intermediate temperatures (i.e., between and , where is the temperature of the hot phase). Also, is smaller for Tl as compared to Th. The cold peak is more prominent for large scale driving (Tl). For Tl most of the gas is supersonic at time , with peak at . For small scale driving (Th), the peak in Mach number distribution is at , with a small bump at .
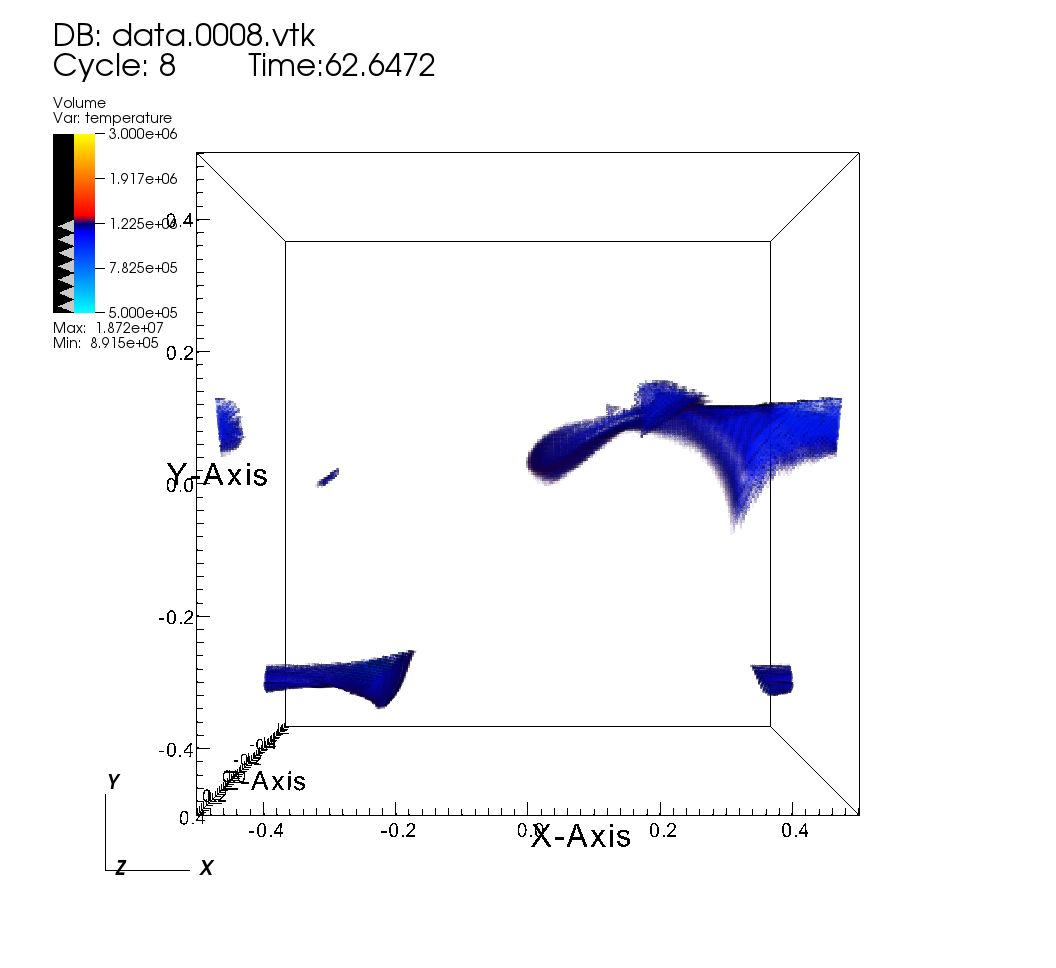
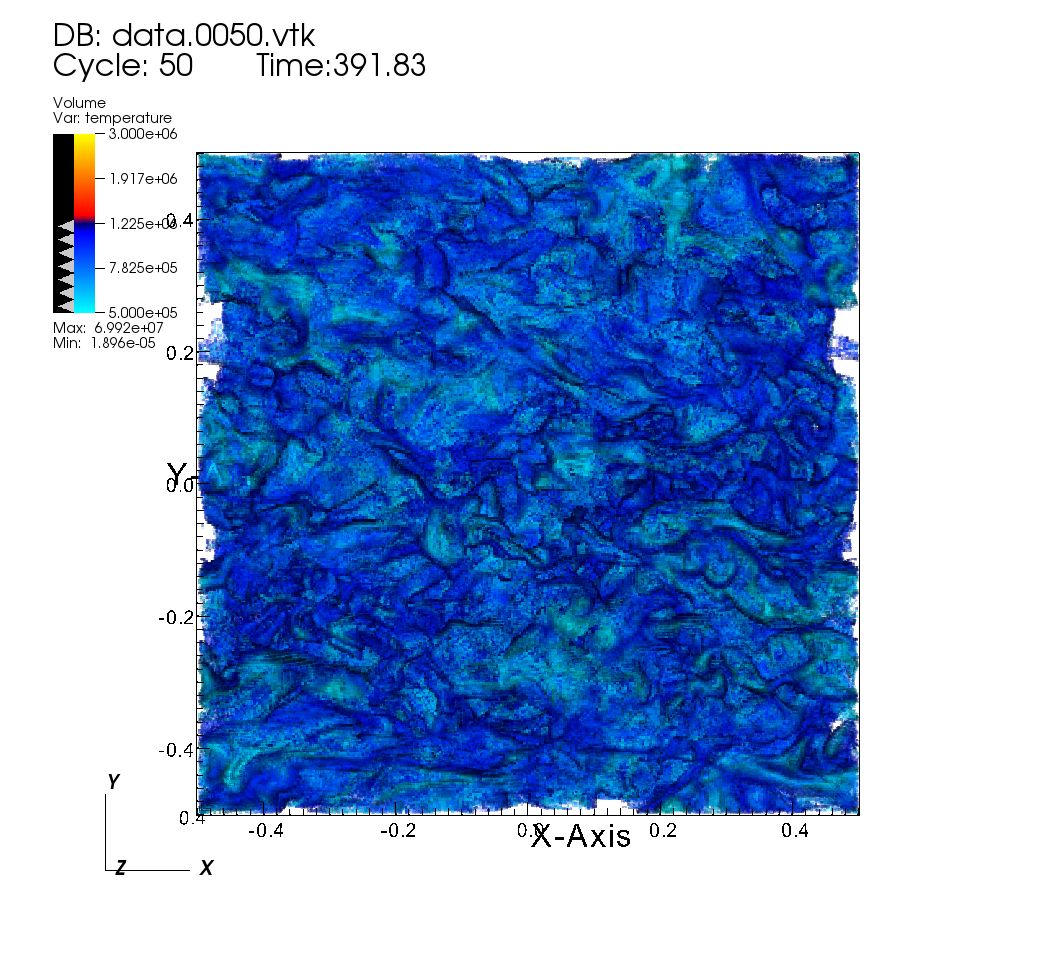
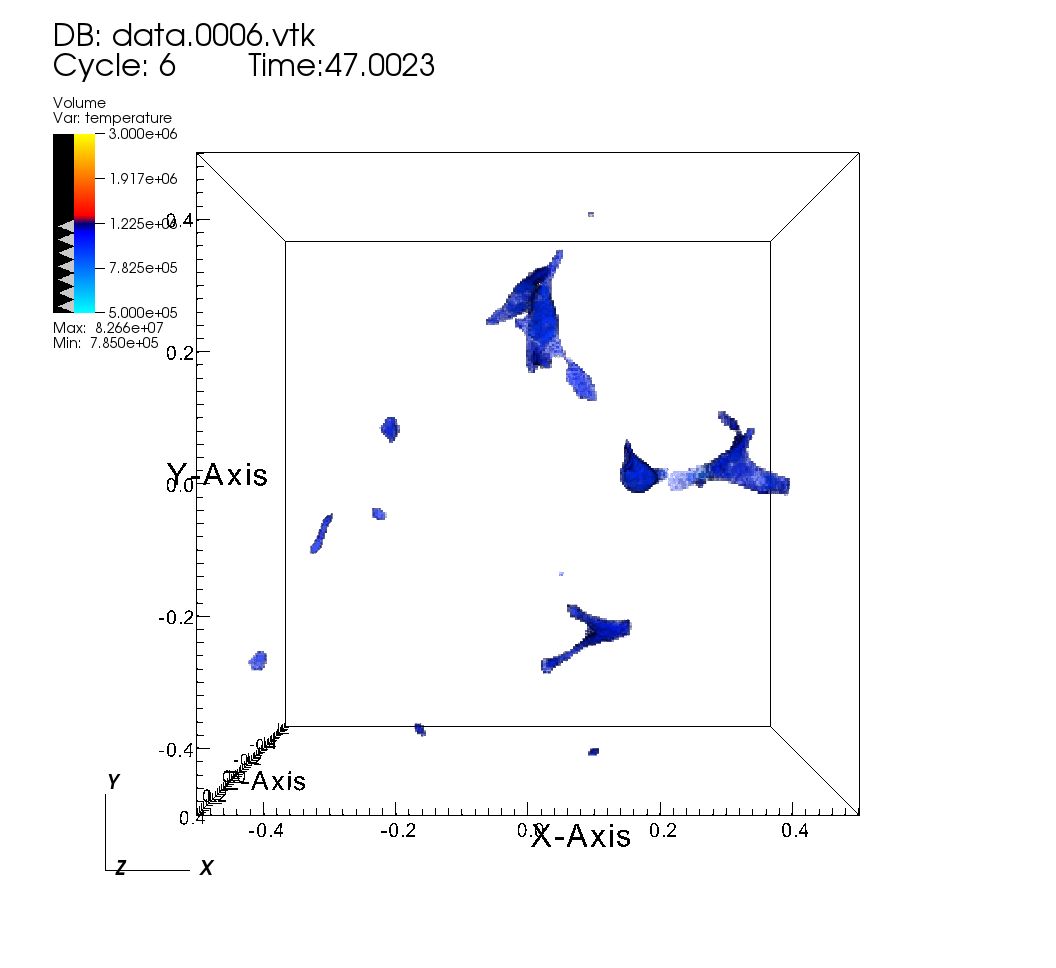
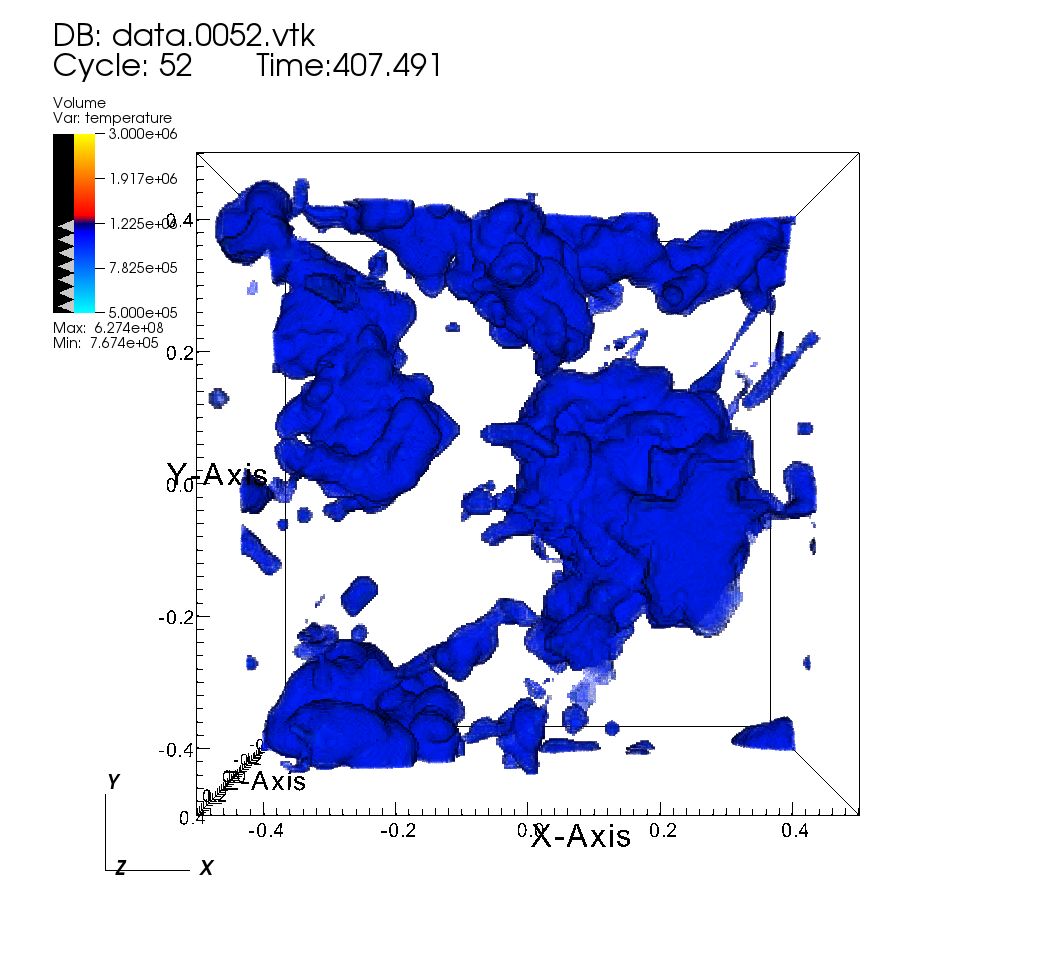
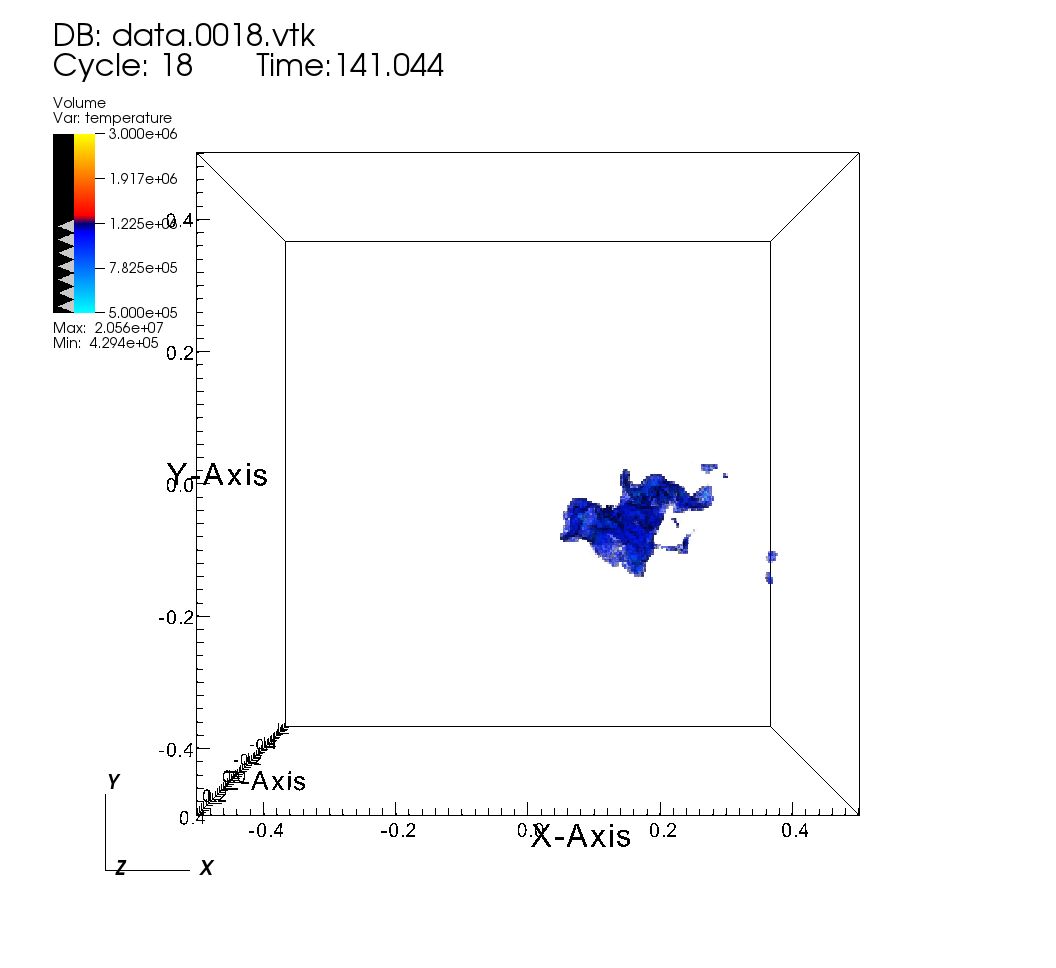
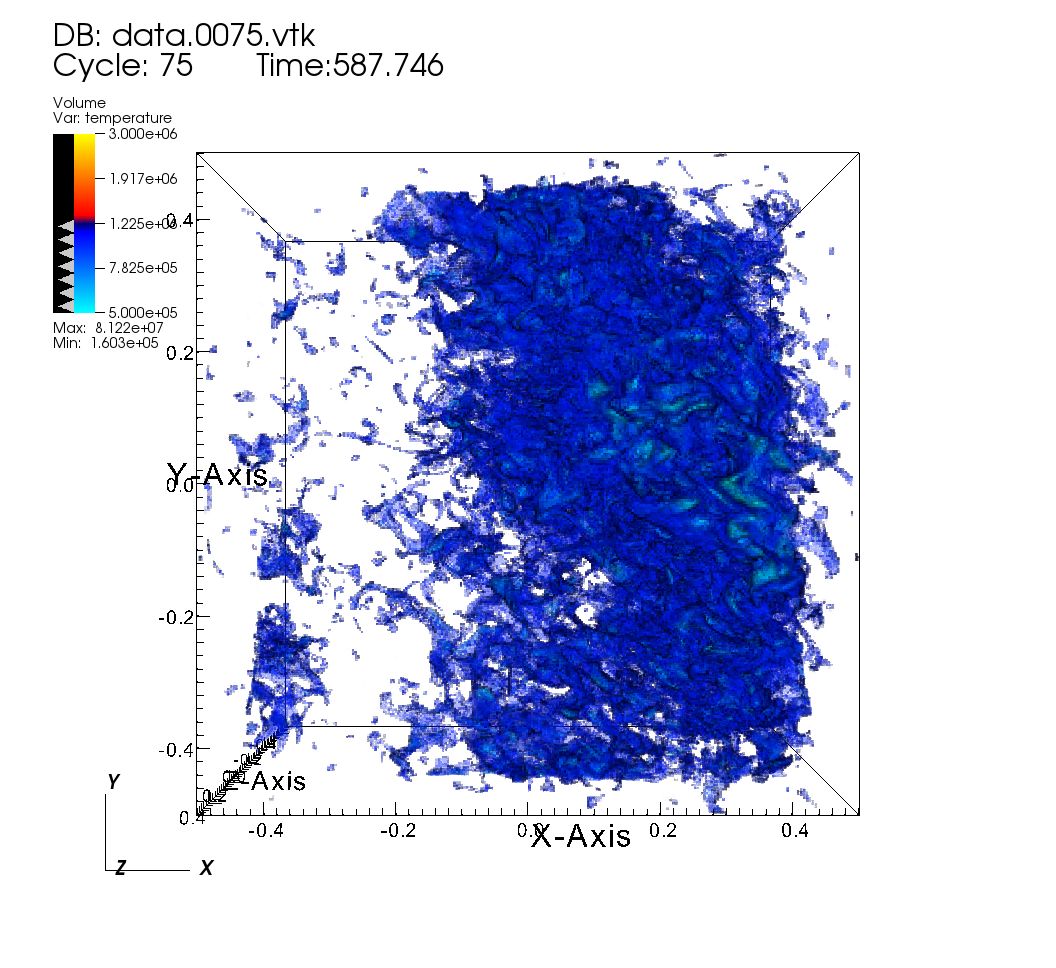
Turbulence mixes up gas at all length scales starting from the driving scale. Hence, large length scale driving mixes up the gas better on larger scales than small length scale driving. By mixing, turbulence smoothens the temperature PDF which is driven towards bimodality due to thermal instability. In these runs, turbulent driving itself generates larger amplitude of density fluctuations, since in the inertial range . Denser regions have faster runaway cooling, which leads to quick formation of multiphase gas, at around Myr. Top right panel of Figure 7 shows that the distribution of cold gas in run Tl is rather uniform throughout the simulation domain.
For small scale driving, it takes much longer than the cooling time scales for multiphase gas condensation ; Figure 5). In this case, cold gas condenses in more localised regions, and the cloud grows around it. In Figure 6 for Th the narrower transonic peak corresponds to hot gas and a small supersonic bump to cold gas clouds. We can attribute the long (time for multiphase condensation) in the small scale driving run (Th) to small density perturbations generated by small scale driving (e.g., see the inset in Figure 5; c.f. Figure 14). These small density perturbations are quickly mixed up by turbulence itself before runaway cooling can happen, thus preventing the formation of larger cool and overdense regions. Later in sections 4.2 & 4.3 we show that cold gas condenses early if large density perturbations and thermal (non-turbulent) heating are present.
In cool cluster cores the gas temperature distribution is bimodal (in reality the cooler phase will be emitting in H and CO and not in X-rays), and observations show that the hot ICM is subsonic (Aharonian et al. 2016). From our simulations, we conclude that it is unlikely that pure turbulent driving on cluster core length scales (10s of kpc) can balance radiative losses in the core for keV clusters, since this scenario gives a large amount of gas at intermediate temperatures and supersonic turbulence in the hot phase (subject to our assumptions as listed in subsection 5.1). Turbulent driving at small length scales could be important, except that in these runs multiphase gas takes too long to condense out and the Mach number peak in the hot phase is still larger than observations. In the following subsection (subsection 4.2), we look at the impact of introducing uniform thermal (non-turbulent) heating on these simulations.
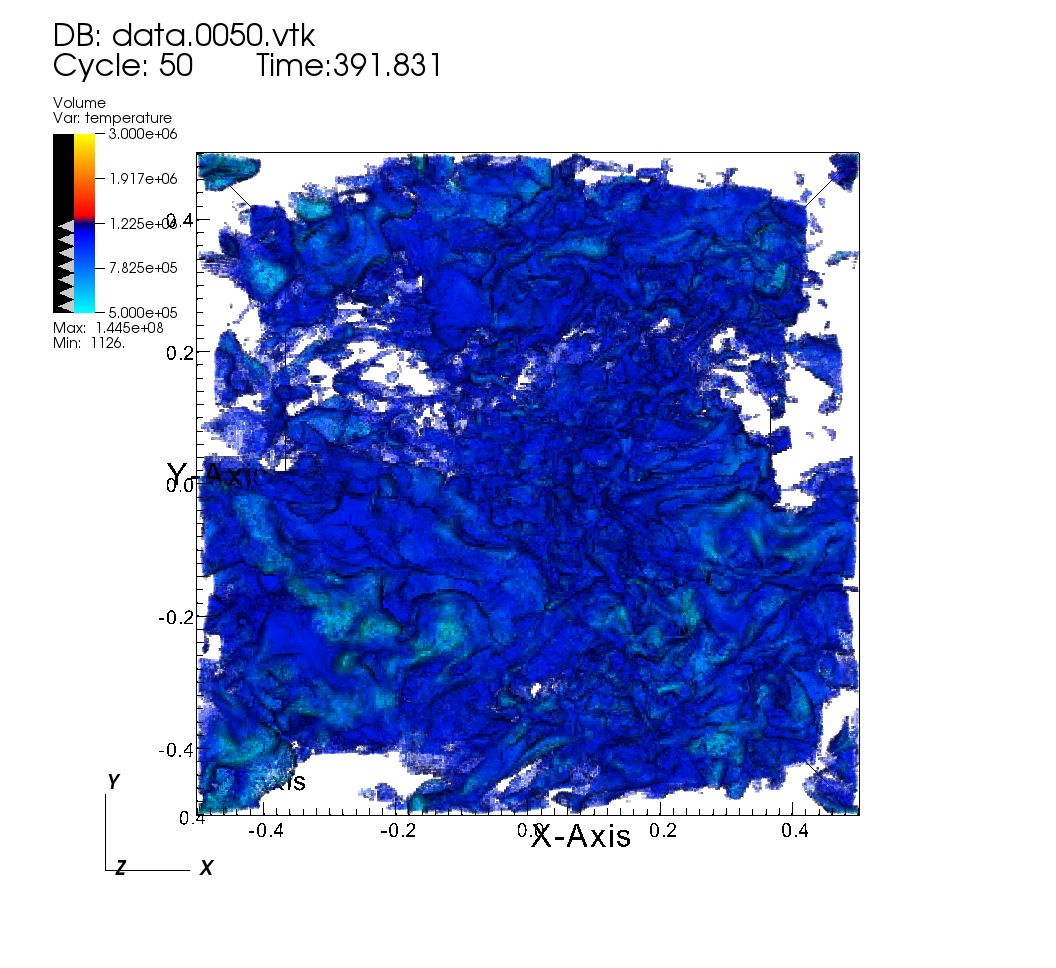
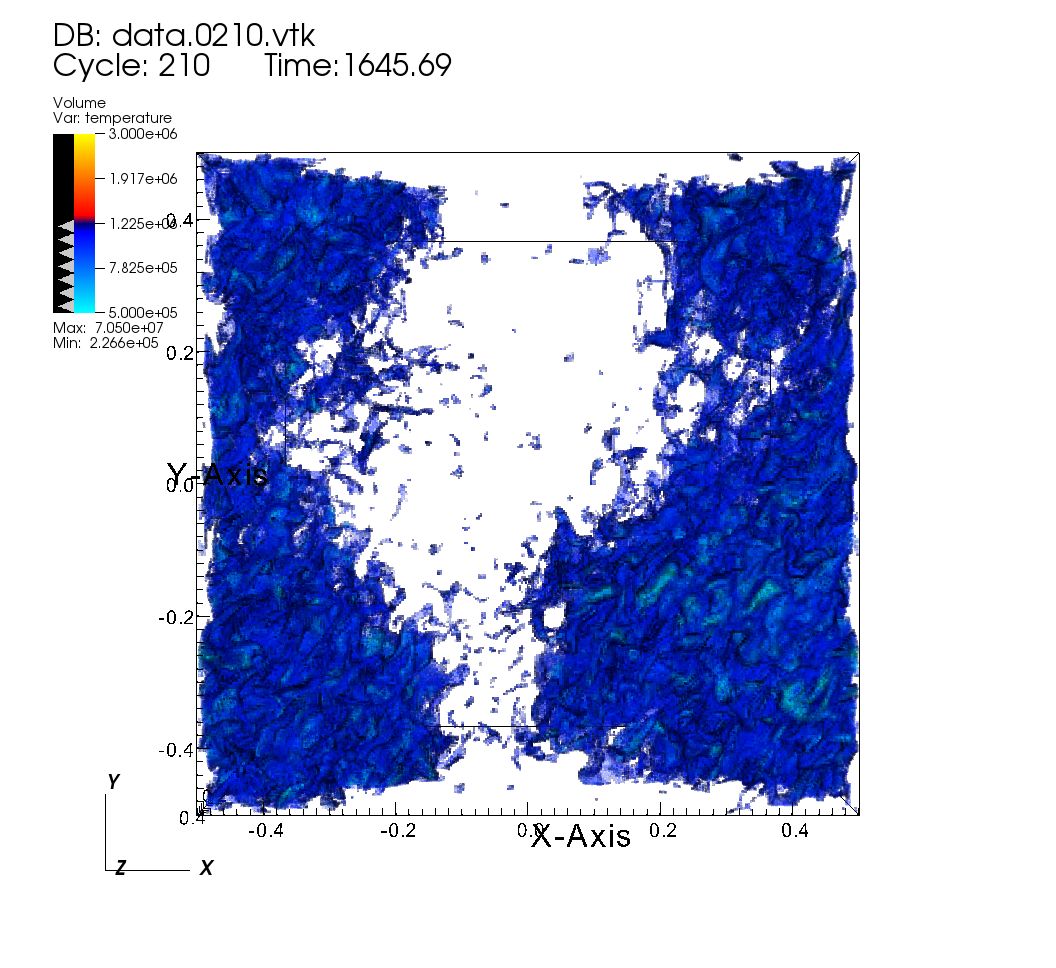
4.2 Both thermal and turbulent heating (Bl & Bh)
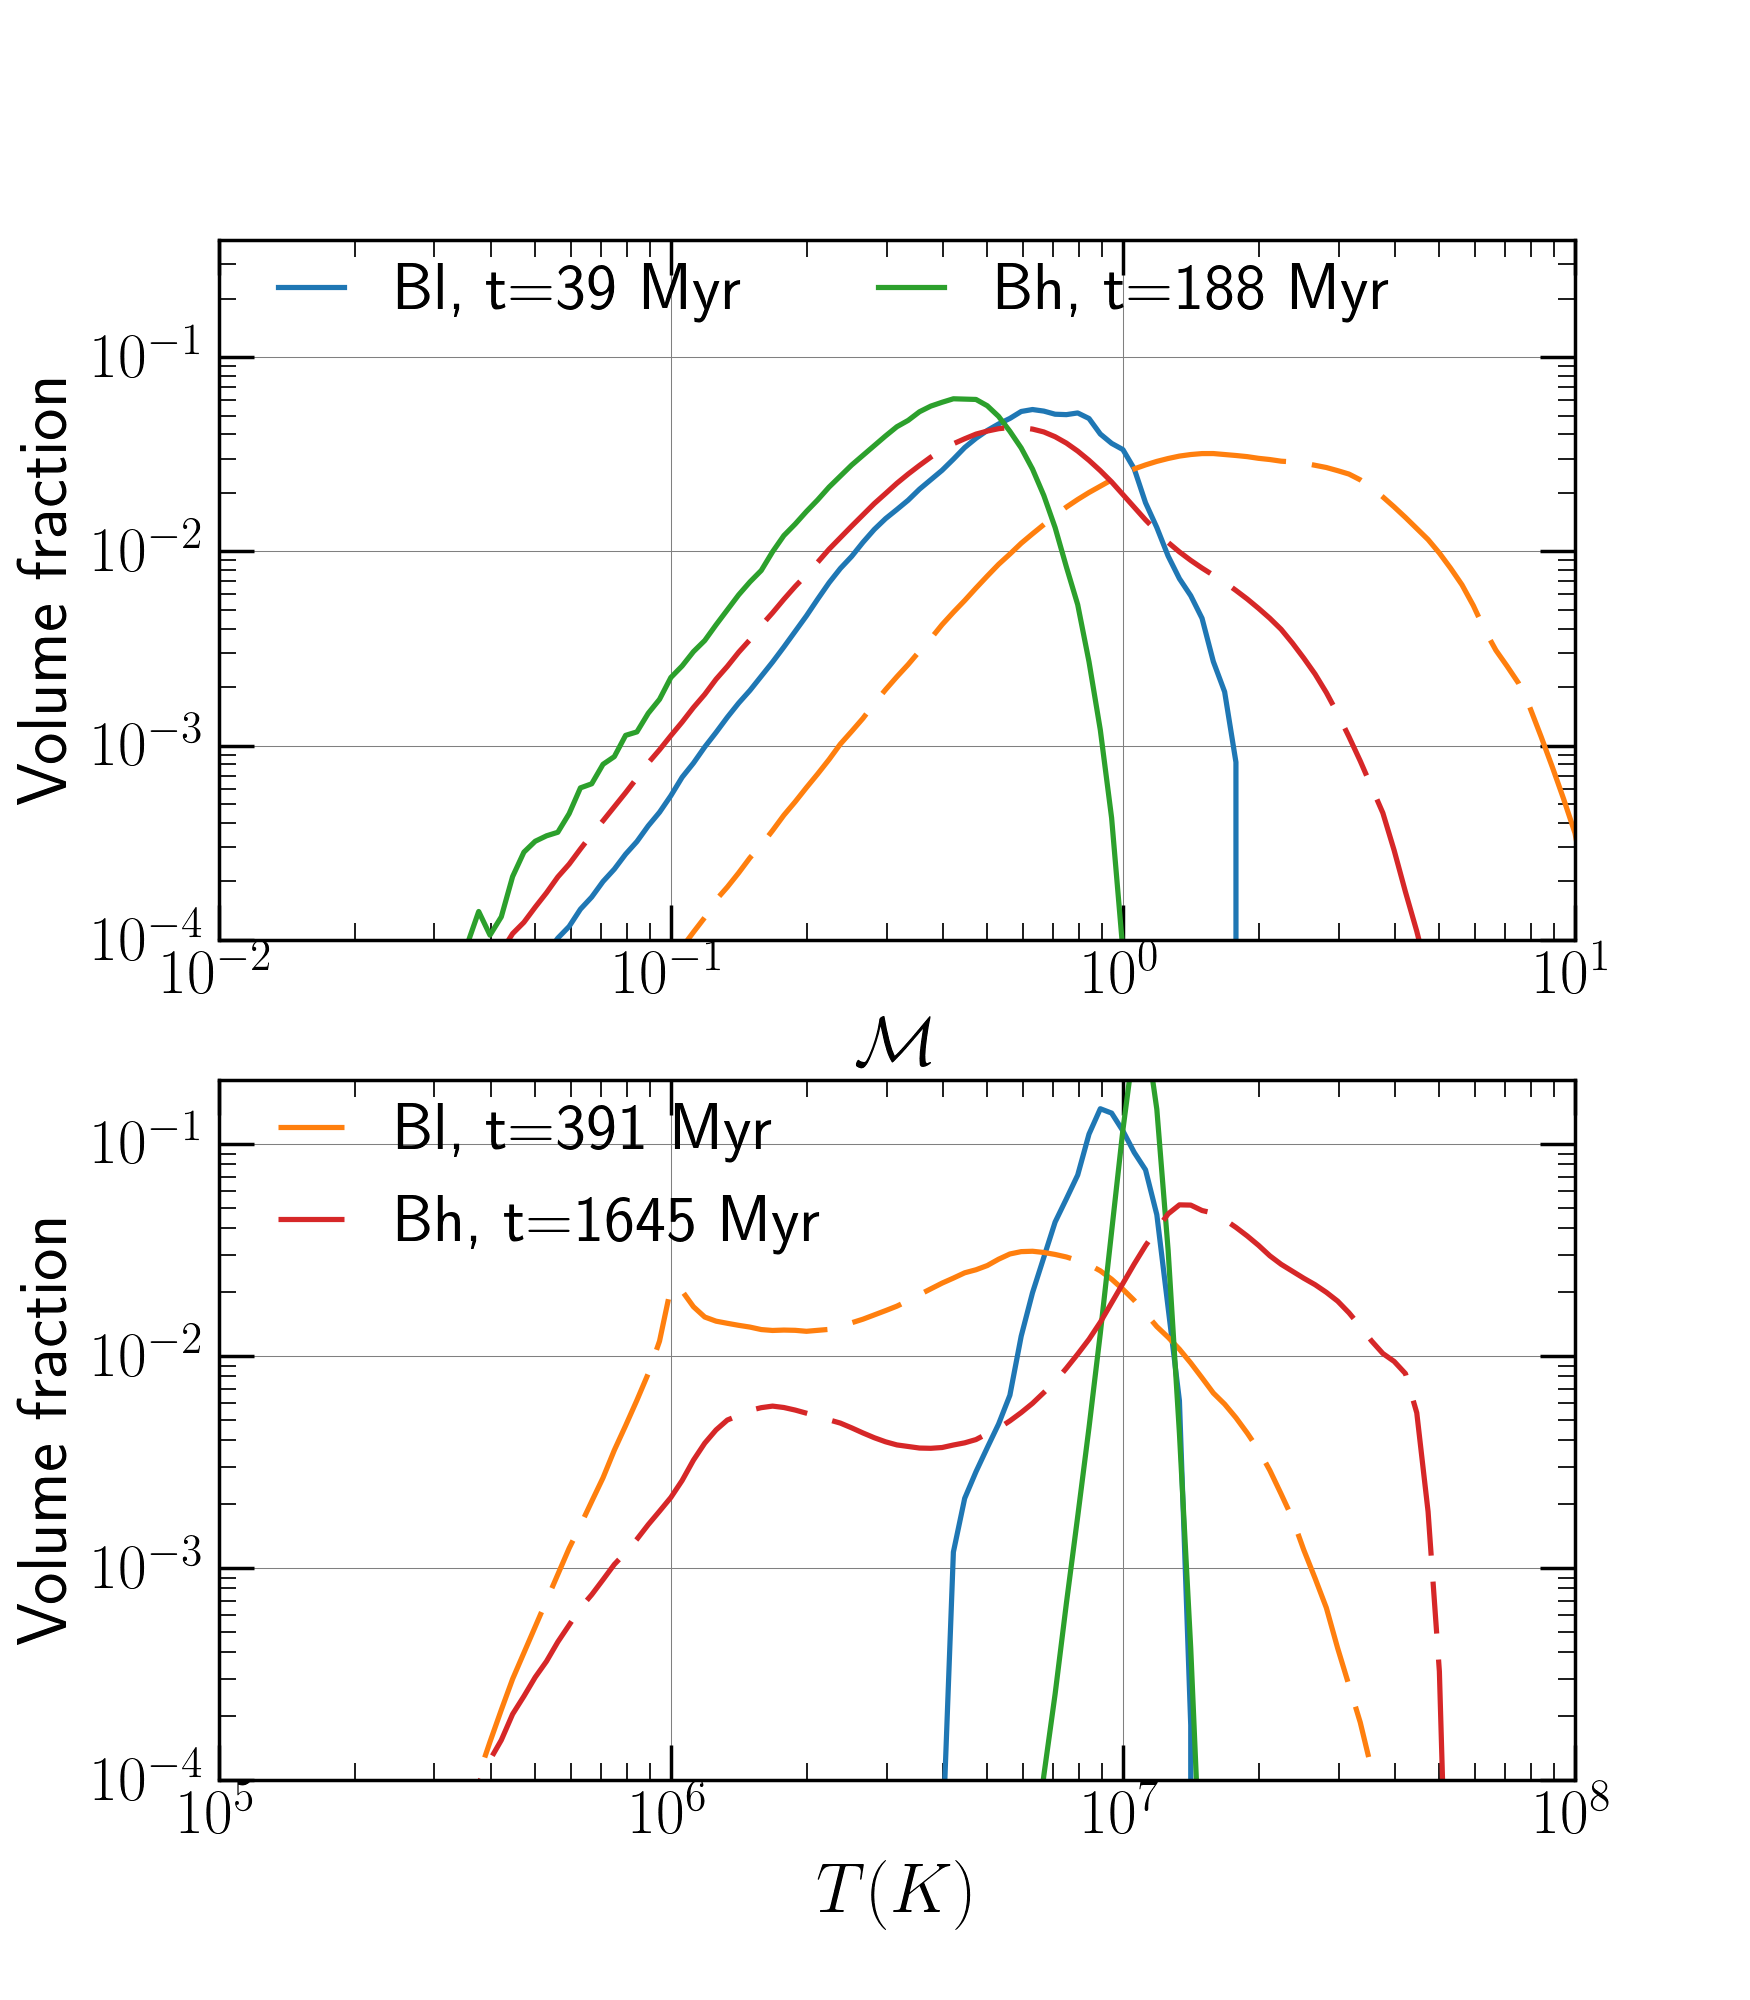
For the runs Bl and Bh we use ; i.e., half of the cooling losses are balanced by turbulent heating and the other half by the heat added uniformly throughout the volume.
Figure 5 shows that for large scale driving cold gas condenses out early, at around 160 Myr. Figure 8 shows that the amount of gas having temperature below the cut-off temperature is lower than the corresponding pure turbulent heating runs (shown in Fig. 6), because of a smaller turbulent forcing. However, we still have a lot of gas at intermediate temperatures, and a broad supersonic peak in the Mach number distribution.
For smaller scale forcing (high ), cold gas forms a bit earlier (at around 1200 Myr, compared to 1700 Myr for pure turbulent heating runs). This time is still an order of magnitude longer than the cooling time. For Bh runs (as compared to Th) cooler regions get more time to grow before they are mixed up with hotter regions, which leads to large density fluctuations and smoother temporal evolution. Figure 8 shows that the hot gas is fairly subsonic , and the cold gas is modestly supersonic for these simulations. The distribution of gas in different phases is more bimodal, with less gas at intermediate temperatures, as compared to runs with pure turbulent heating (compare Figs. 6 & 8). The volume rendering plots in Figure 9 are similar in nature to those of pure turbulent driving in Figure 7.
From the results of these simulations, we conclude that other thermal heating mechanisms that do not drive strong turbulence (e.g., thermal conduction [e.g., Wagh et al. 2014], turbulent mixing [e.g., Hillel & Soker 2017], cosmic ray streaming [e.g., Guo & Oh 2008], shocks/sound waves [e.g., Ruszkowski et al. 2004]) play an important role in closing the AGN feedback loop (at least in an average sense). Non-turbulent heating leads to more bimodality in temperature distribution and subsonic gas velocities in the hot phase (for small scale driving runs). In the next subsection, we introduce initial density perturbations (over and above what is produced by turbulence), and assess their impact on the multiphase gas.
4.3 Initial density perturbations (QD, TDh & BDh)
The density perturbations in the ICM may be primarily seeded by sources other than turbulence such as cooling/heating (as in our simulations presented in section 4), galaxy wakes, rising bubbles and sloshing. Therefore, for the runs discussed in this section, we initialize isobaric (since sound crossing time over the cluster core scales is shorter than the cooling time) density perturbations according to the prescription in subsection 2.4. In this section we discuss the following runs with initial density perturbations: a pure thermal heating run QD (, D stands for initial density perturbations), a pure turbulent run with small-scale driving TDh , and a thermalturbulent heating run BDh . We focus on small-scale driving because the Mach number in the hot phase is smaller (and closer to observations) than large-scale driving.
The amplitude of relative initial density perturbations is , roughly twice the rms density perturbations in the turbulent steady state of run Th before cold gas condensation (compare Th and TDh in Fig. 5). We have also tried runs with smaller initial density perturbations, which only show a slightly longer , but the Mach number and temperature distributions are similar to the run with smaller/without any density perturbations. Thus, small density perturbations do not significantly affect the occurrence of multiphase gas.
4.3.1 Thermal heating only (QD)
This run is similar to the simulations presented in Sharma et al. (2010), in that there is no externally imposed turbulence and the fluid motions are caused by thermal instability itself. The key differences are that our simulations are 3-D hydro, while the earlier paper was based on 2-D MHD runs. Figure 5 shows that cold gas starts condensing out at around Myr, comparable to the cooling time. The rms perturbations are larger and much smoother in time compared to the runs with turbulence because turbulence mixes the phases in latter, preventing a large stationary density/temperature contrast.
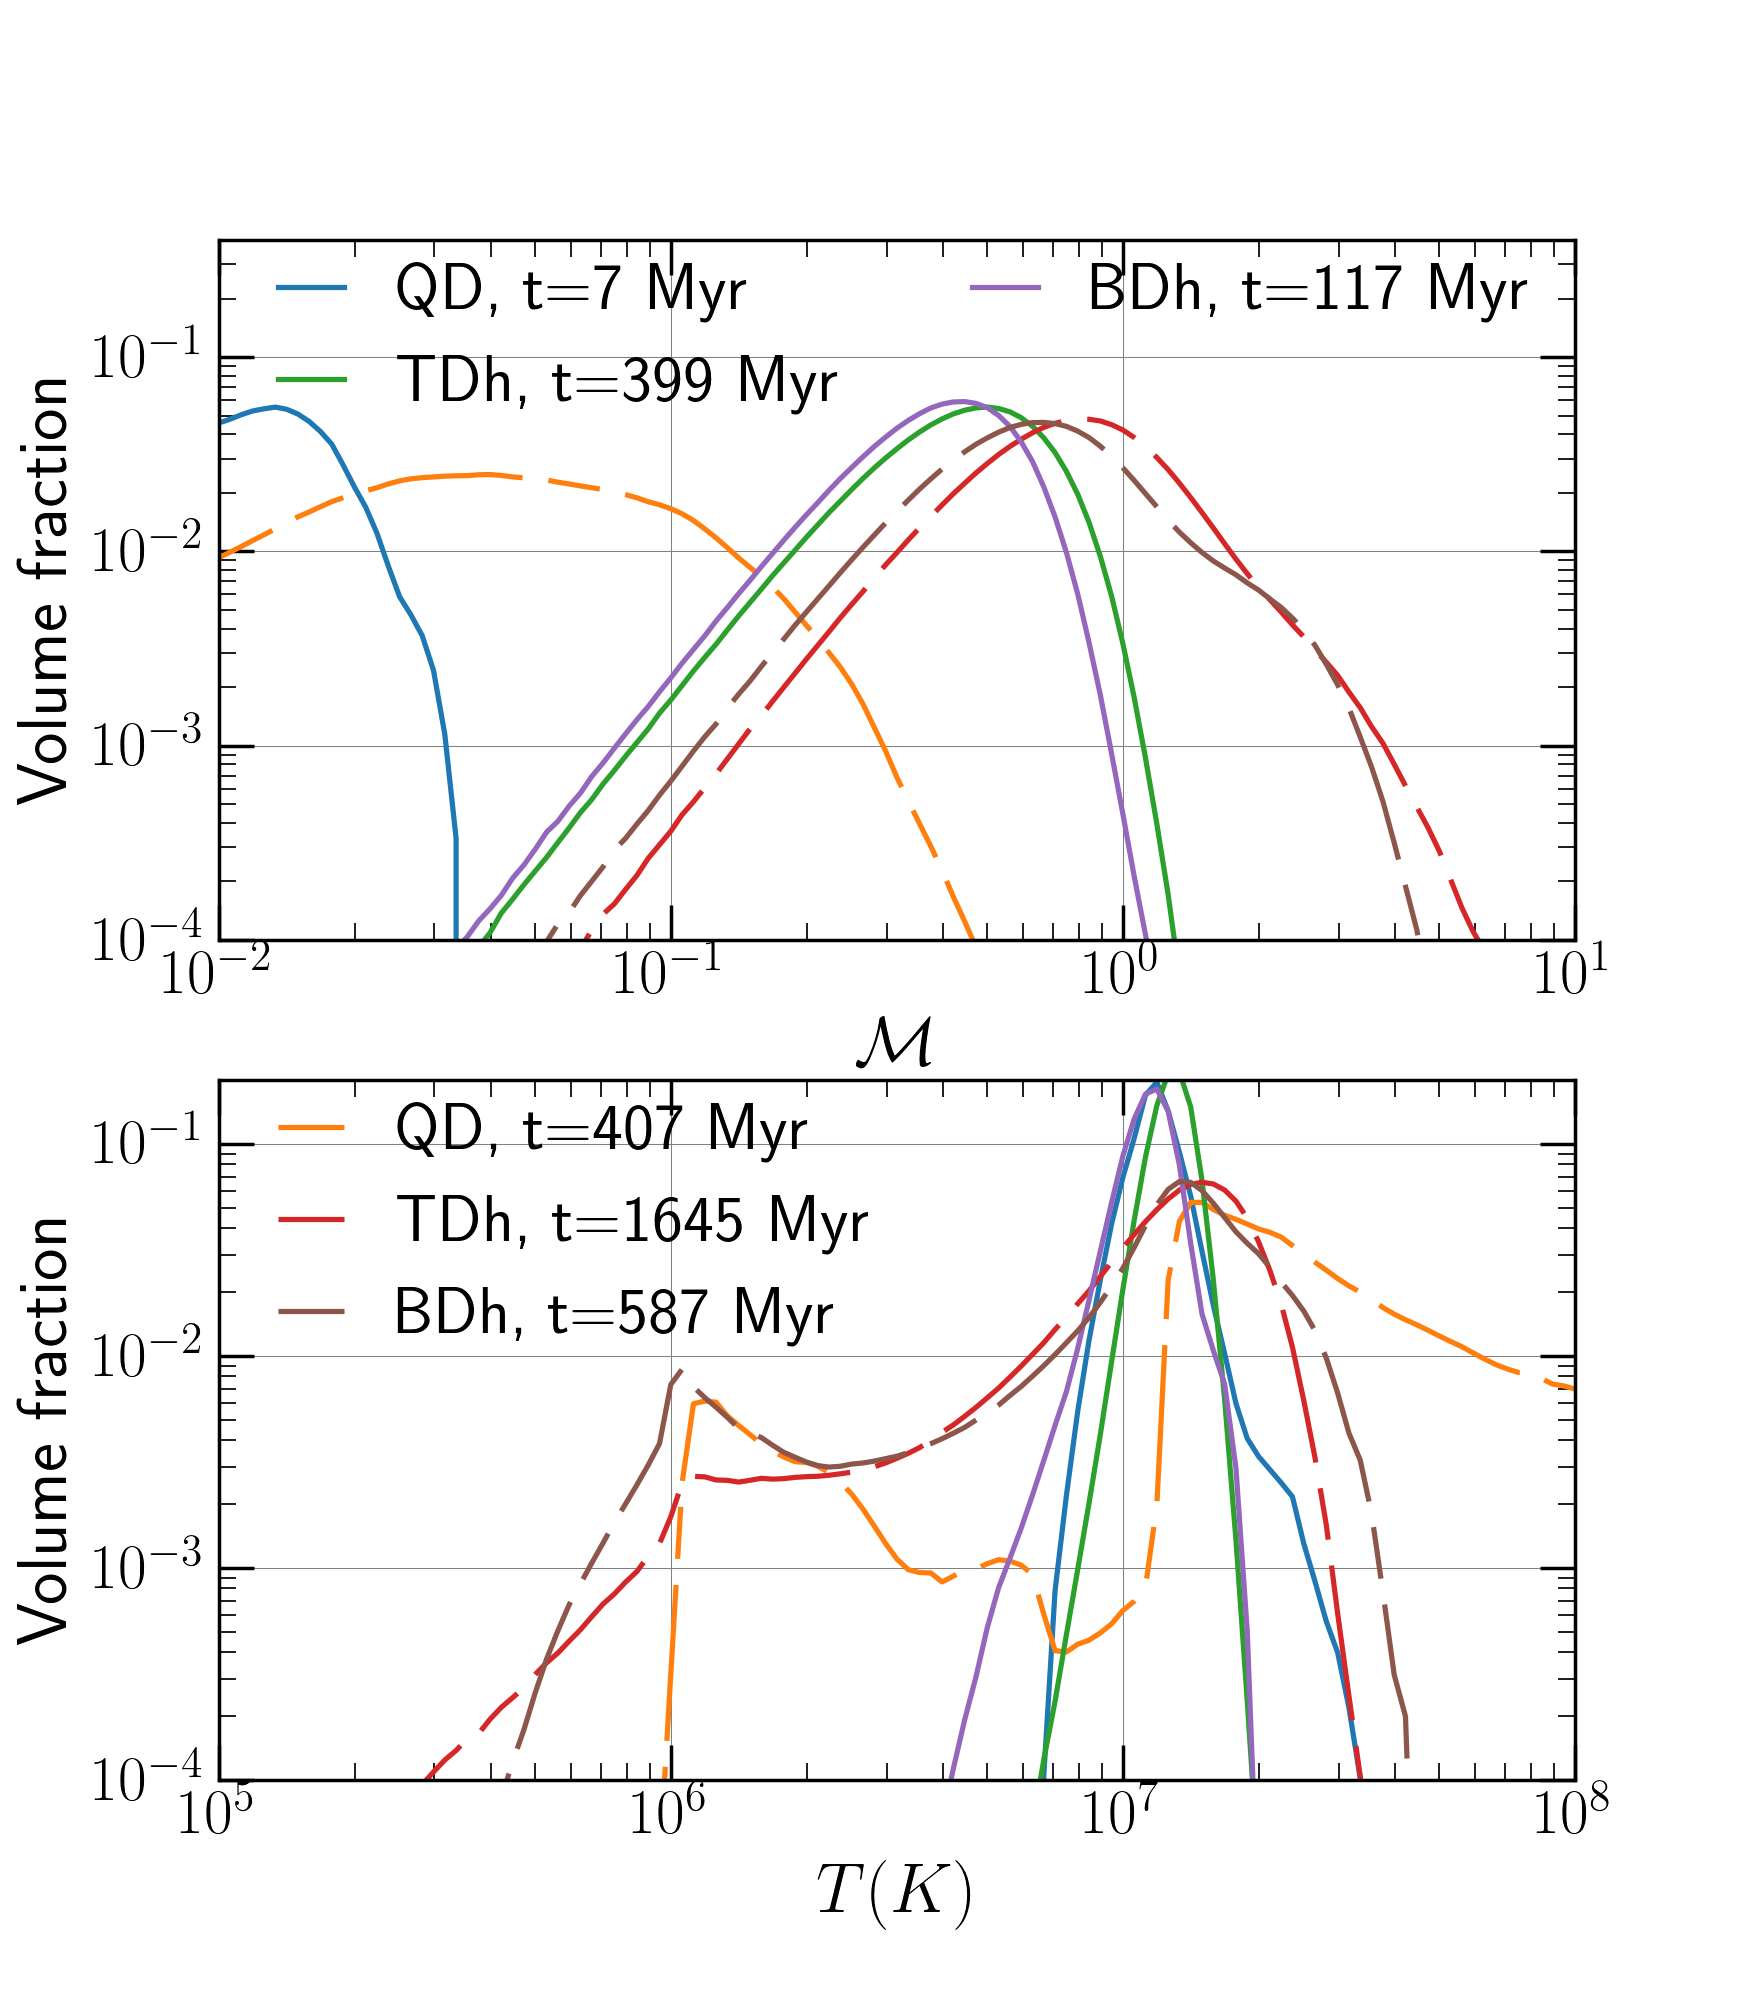
Due to much weaker turbulence in this run, the temperature PDF also shows a strong bimodality in Figure 10. There is much less gas at intermediate temperatures, almost no gas at temperatures below , but a tail at large temperatures going as high as K. All this is a consequence of much weaker turbulence. Figure 10 shows that the initial Mach numbers are very low . The Mach number PDF even at shows a single broad peak below , for both the hot and cold phases. The flow is entirely subsonic, including the gas in the cold ( K) phase.
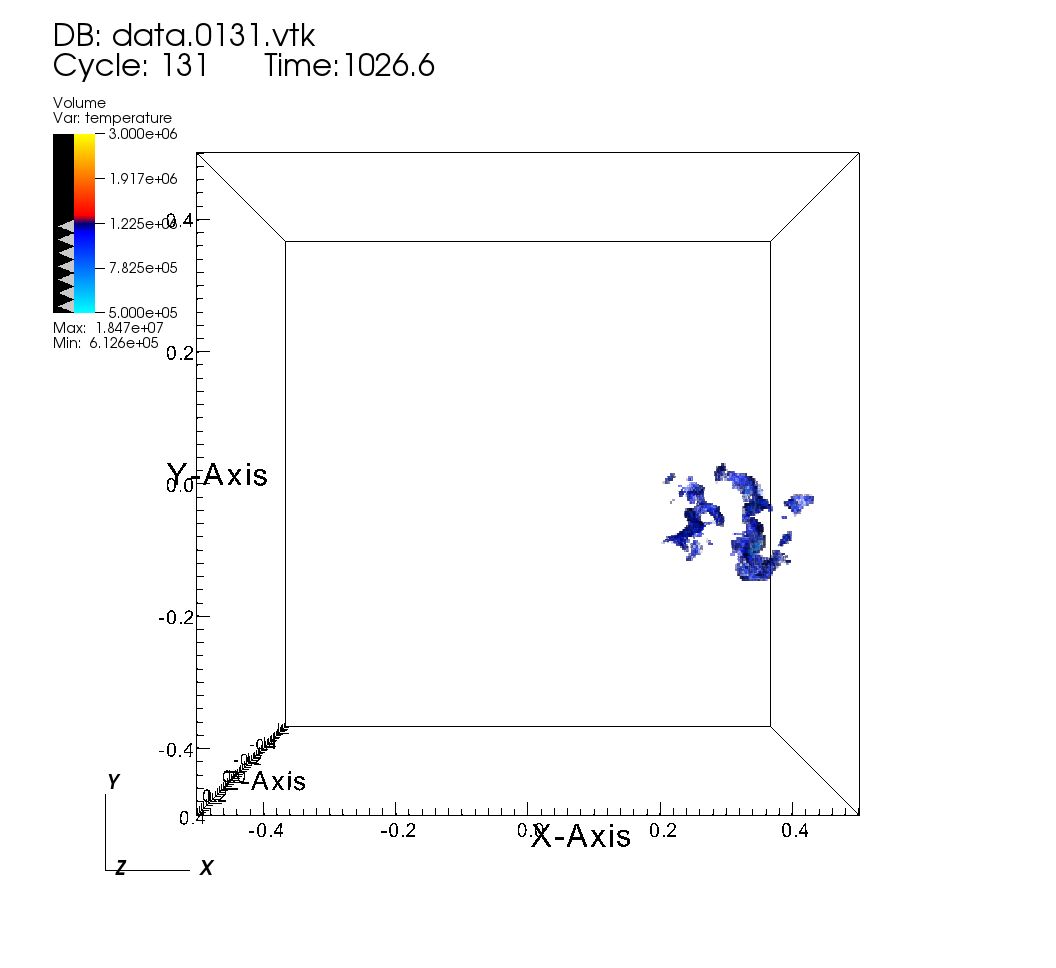
The volume-rendering of cold gas in Figure 11 (top panels) for the thermal heating run shows that the clouds of cold gas grow at the same location as the initial density peaks. The clumps merely grow with time, and have little or no motion, as expected from their low Mach numbers. In the absence of additional driving, the cold and hot gas phases remain well separated in space and in density/temperature.
4.3.2 Small scale driving (TDh)
Figure 5 shows that multiphase gas in the high driving run with initial perturbations (TDh) condenses out only slightly earlier (1500 Myr) than the run without initial density perturbations (Th; Myr). This is much longer than multiphase condensation without turbulence (QD), which happens on a cooling time. In fact, Figure 5 shows that is larger initially but attains the same amplitude as Th after Myr, suggesting that turbulence wipes out initially imposed isobaric density fluctuations on an eddy-turnover time. The run with high driving shows much gas below and at intermediate temperatures (Figure 10). The temperature of the hottest gas is not as high as QD. The multiphase PDFs are similar to those of the Th run (Figure 6).
4.3.3 Turbulent & thermal heating (BDh)
Initial density perturbations have a much bigger impact on the run with both turbulent and thermal heating (BDh; , ) than with just turbulent heating (Th). Figure 5 shows that cold gas condenses out for BDh at Myr, almost three times shorter than the run without initial density perturbations (Bh). The shorter time scale of multiphase gas condensation is because of the decreased efficiency of turbulent mixing (since ). Hence, the denser regions can cool to the stable temperature on a much shorter time scale. This time is still a factor of a few longer than for pure thermal heating (QD).
Figure 10 shows that the Mach number and temperature PDFs are qualitatively similar to the runs without density perturbations, but with a Mach number peak at , somewhat lower than the pure turbulence run (Th; see Figure 6). Volume rendering plots of density in Figure 11 (lower panels) are also qualitatively similar to the run Th (see Figure 7) but with less mixing.
Most of the hot gas with partial thermal heating and initial density perturbations (BDh) is subsonic, and the timescale for multiphase condensation is not unrealistically long. These properties match the observations qualitatively. In subsection 5.2 we further quantify the fraction of turbulent heating () by comparing with Hitomi observations.
5 Discussion
This work has two key aims: (i) quantify the efficacy of unstratified turbulence in generating density, pressure and surface brightness fluctuations; and (ii) quantify the extent to which turbulent heating can heat cool cores of clusters within the context of our idealized thermal balance simulations.
In the first set of runs, we drive turbulence (mostly on large scales) with different forcing amplitudes and check the scaling of pressure, density and surface brightness fluctuations of the gas with the turbulent Mach number of the flow. We also calculate the power spectra of the same quantities and their variation with the wavenumber and Mach number. In the second set of runs we impose thermal balance – the sum of turbulent and thermal heating balances net cooling – to mimic cluster cool cores. In some of these simulations we also drive turbulence at an order of magnitude smaller scale so that we get a smaller turbulent velocity (, the energy input rate from turbulence; for the same ), close to observations.
5.1 Comparison with previous works
We differ in two fundamental ways compared to the previous analyses (e.g., Gaspari & Churazov 2013; Zhuravleva et al. 2014b, a) of this topic. First, we do not include the background gravitational stratification and second, in our thermal balance setup cold gas can only form by condensation from the hot ICM. Both these assumptions have profound effects on our results and can essentially explain the seemingly different outcomes of our work compared to the previous studies. In the following paragraphs we motivate our choices and highlight their impact on the outcomes of our study.
Gaspari & Churazov (2013) simulated hydro turbulence in the ICM of the Coma cluster and reported that even for subsonic driving. This appears contradictory to the results from our fiducial simulations, but note that unlike us they use a stably stratified ICM. In a stably stratified atmosphere, turbulent driving can excite internal gravity waves for which the density perturbations are large relative to the pressure fluctuations (), and the power spectra are different from isotropic homogeneous turbulence (e.g., Lindborg 2006; see the recent book Verma 2018). Even for stably-stratified turbulence there seems to be a disagreement in the scaling of density and velocity power spectra. The high resolution simulations of Kumar et al. (2014) show the velocity and density power to be different ( and respectively, in agreement with Bolgiano 1959 but different from K41 scaling for both found by Gaspari et al. 2014). Thus, more work is needed to understand the relation between density and velocity fluctuations at different scales for parameters appropriate for galaxy clusters.
The ratio of the restoring buoyancy force and the nonlinear turbulent force can be defined as the scale-dependent turbulent Richardson number,
| (16) |
which is smaller at small scales () for K41 turbulence; i.e., turbulent force dominates over the buoyancy force at small scales (Ruszkowski & Oh 2010). Here we assume the average vertical displacement to be the same as the size of the (isotropic) turbulent eddy (). If magnetized (anisotropic) conduction is of order the Spitzer value, the effective Richardson number is and even smaller (Sharma et al. 2009b).
Thus, for turbulent velocities expected in both cool-core and non-cool-core clusters ( km s-1) the effects of stratification may be small, especially at smaller scales. Cosmological simulations of relaxed clusters (without cooling) agree with scaling (e.g., see Figs. 2, 3 in Zhuravleva et al. 2014b), but this may break down at the smaller (10s of kpc) scales of cool cores where observations are probing below the Ozmidov scale (scale at which ; e.g., see the Extended Data Figure 4 in Zhuravleva et al. 2014a). Zhuravleva et al. (2014b) argue that the scaling between the density and velocity fluctuations at small scales is inherited from the buoyancy-dominated larger scales. This must be checked with high resolution simulations since kinetic energy flux crossing different s is not expected to be a constant (unlike in K41) as it is converted into potential energy in a scale-dependent way. Moreover, turbulence is expected to be K41-like at small scales, irrespective of the behavior at large scales.
Coming to our thermal balance simulations, note that the only way cold gas can be produced in these is via condensation from the hot phase through thermal instability in a medium with global thermal balance. For this to happen, the turbulent mixing time of gas must be longer than the cooling time. This requirement puts an upper-limit on the turbulent velocity in our setup (see section 5.2). However, if most cold gas in the ICM is due to other mechanisms, such as the uplifting of cold gas from the central galaxy, then can be much longer than any other time scale, since cold gas does not condense out of the hot ICM. In Zhuravleva et al. (2014a) the cooling timescale is longer than the other relevant timescales because they do not assume the cold gas to condense out of the ICM.
5.2 Adjusting to match Hitomi observations
A necessary condition for the condensation of cold gas in a turbulent medium is that the turbulent mixing time be longer than the cooling time. However, in presence of gravity, cold gas may not condense out even in absence of external turbulence if the ratio (McCourt et al. 2012; Choudhury & Sharma 2016). In this regime, the amplitude of density perturbations is smaller for larger e.g., see the right panel of Fig. 3 in McCourt et al. 2012). However, our idealized set up without stratification is applicable for cool cluster cores with in which multiphase gas is able to condense due to local thermal instability.
The ratio of the cooling time (, which is independent of length scale) and the turbulent mixing time () is longer for smaller length scales for K41 turbulence). With thermal balance,
| (17) |
where turbulent energy dissipation rate is scale independent, is the turbulent heating fraction, and is the thermal energy density. Thus, at the driving scale
| (18) |
where is the kinetic energy density at the driving scale (). For smaller scales the ratio is longer () and condensation is more difficult.
It is worth noting that the turbulent heating rate is very sensitive to , and can be matched with the average core cooling rate by only changing slightly (and to some extent). However, if the cold gas is to condense out of the hot phase due to thermal instability, the cooling time must be shorter than the turbulent mixing time. This constraints the Mach number in the hot phase to be for turbulent heating to fully balance radiative losses (; see Eq. 18). For subsonic motions consistent with observations, turbulent heating fraction () needs to be small and/or turbulent driving must occur at small scales. This is what we argue next.
On scales () larger than the driving scale, turbulent diffusion happens due to eddies of size because energy only flows to smaller scale in K41 turbulence. The turbulent diffusion coefficient for is given by and the mixing time scale is
| (19) |
Thus, the condition for multiphase condensation due to thermal instability becomes
| (20) |
which can be satisfied with (or equivalently ) only for scales much larger than the driving scale () and/or for . Our simulation results are consistent with this criterion. Large scale driving with (run Tl) indeed shows the Mach number peak in the hot phase at (see Fig. 6). With driving at small scales (run Th), but still with , the peak Mach number is smaller (), and the run with small scale driving and shows an even smaller Mach number peak (run Bh; see Fig. 8).
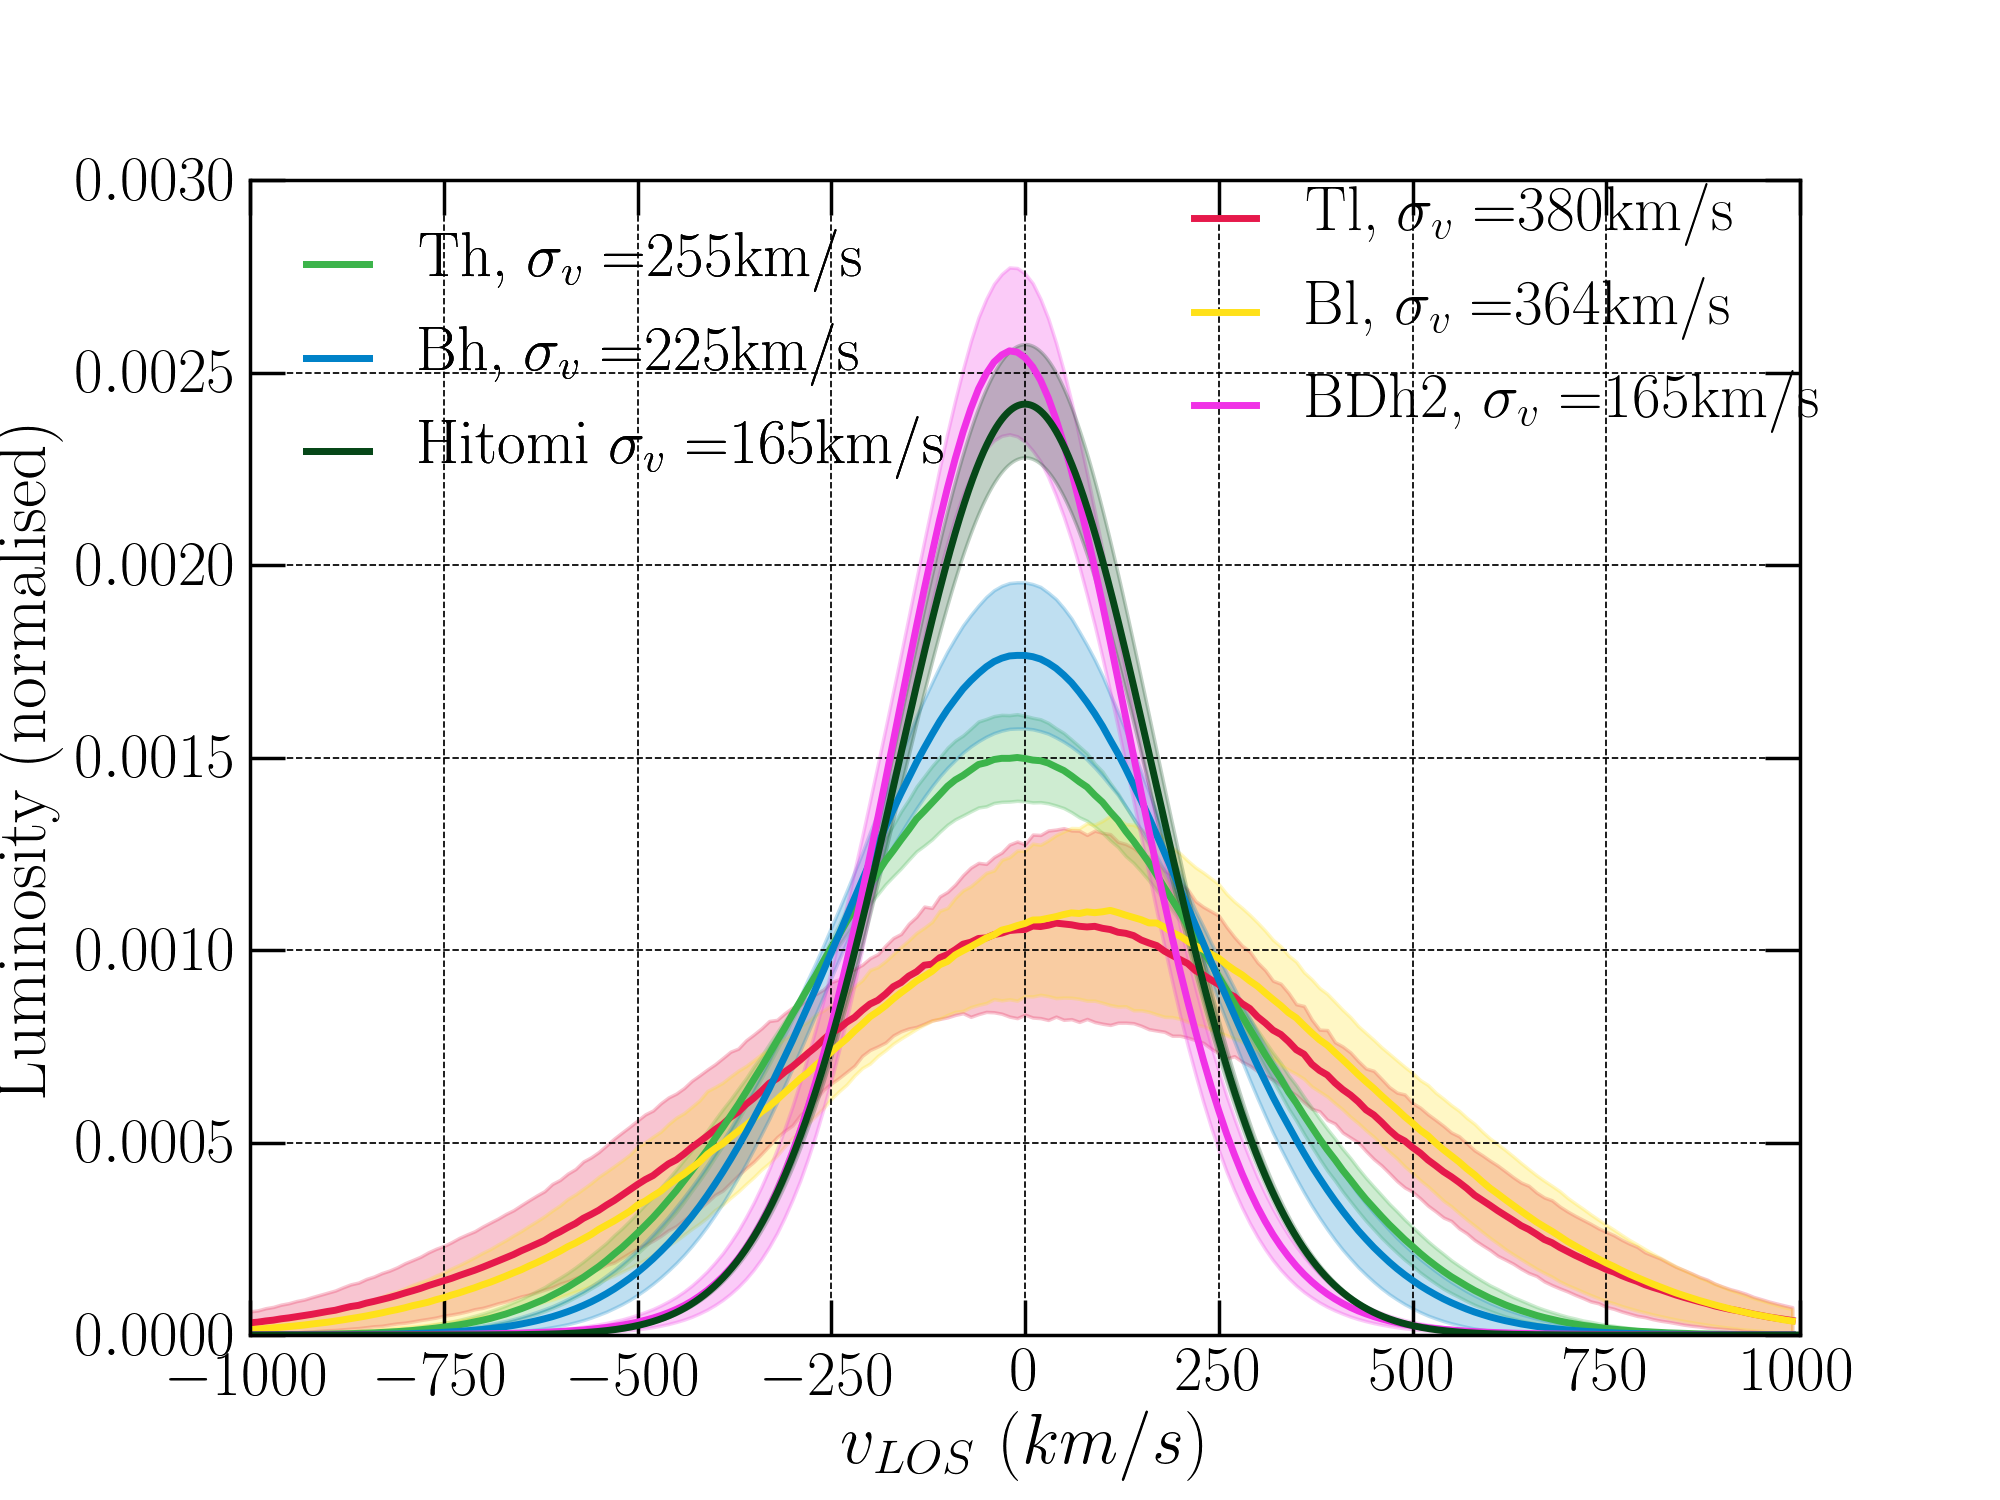
The turbulent velocities for runs with (Bh, BDh; see Table 2) are larger than what is measured by Hitomi observations of Perseus core. We therefore reduce turbulent forcing fraction () further to produce a line of sight velocity dispersion that is consistent with the observed value ( km s-1; see the last few rows in Table 2). Figure 12 shows the PDF of X-ray luminosity contributed at different line of sight (LOS) velocities for some of our thermal balance runs. We can produce the small LOS velocity dispersion measured by Hitomi only with small turbulent heating (; run BDh2 in Table 2). ICM simulations with feedback AGN jets are also able to produce a velocity dispersion of similar magnitude for a substantial time, but it is more time variable than our idealized runs (Li et al. 2017; Lau et al. 2017; Prasad et al. 2018). Another desirable feature of the run BDh2 is that cold gas condenses out in a few cooling times (and not tens of cooling times as is the case for larger and small scale driving; e.g., runs Th, TDh, Bh in Table 2).
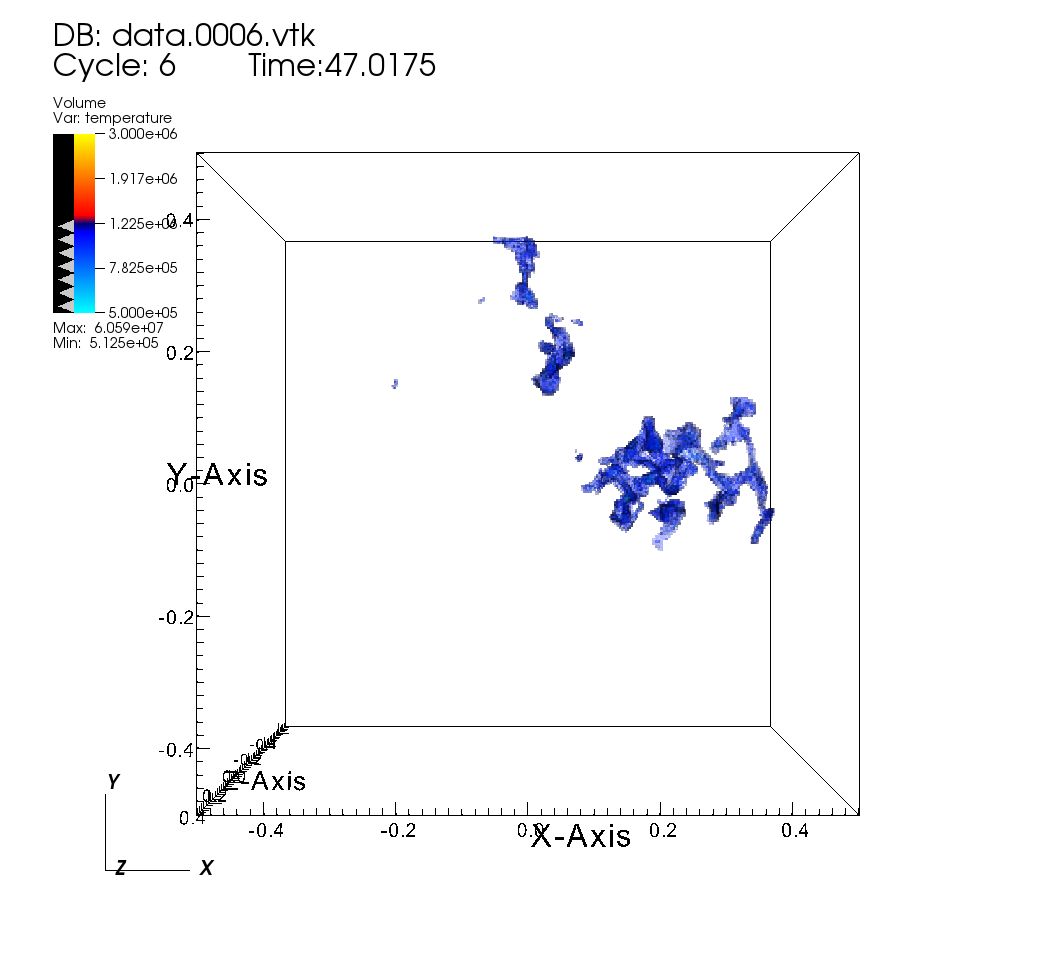
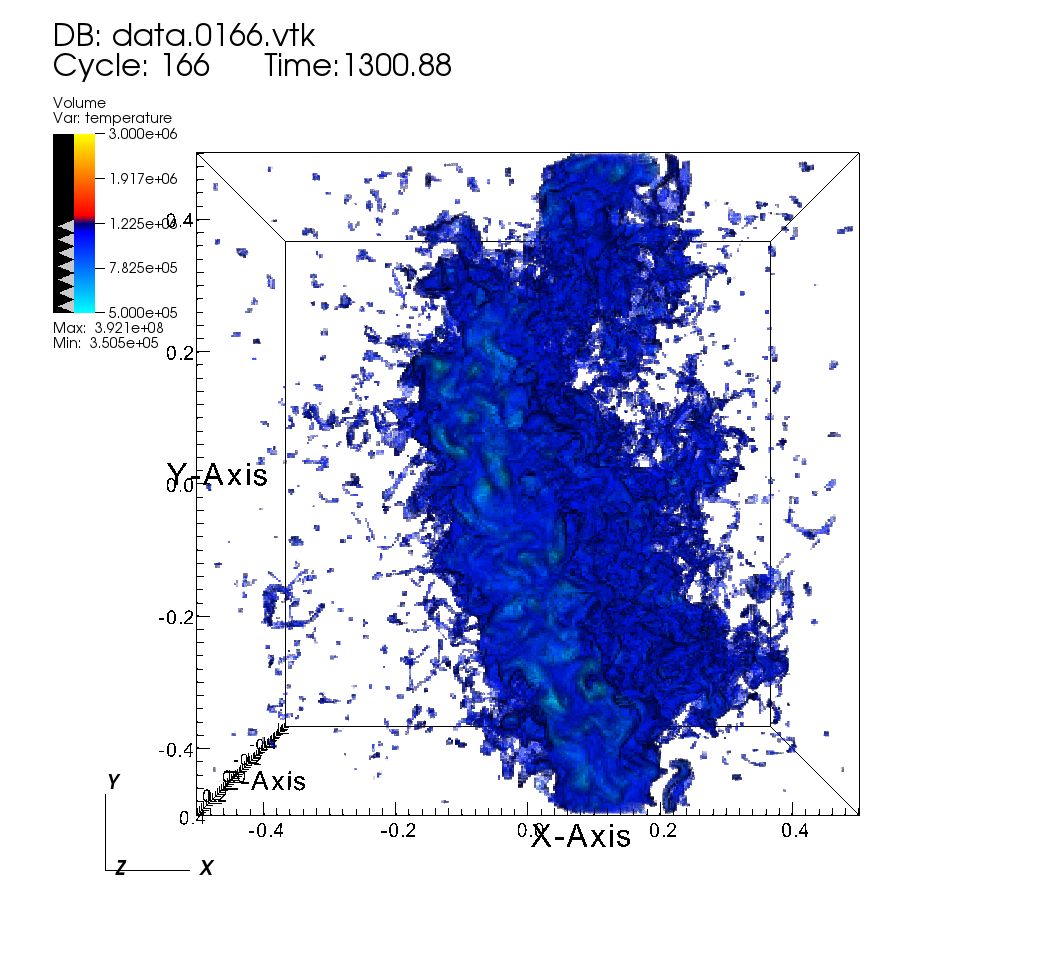
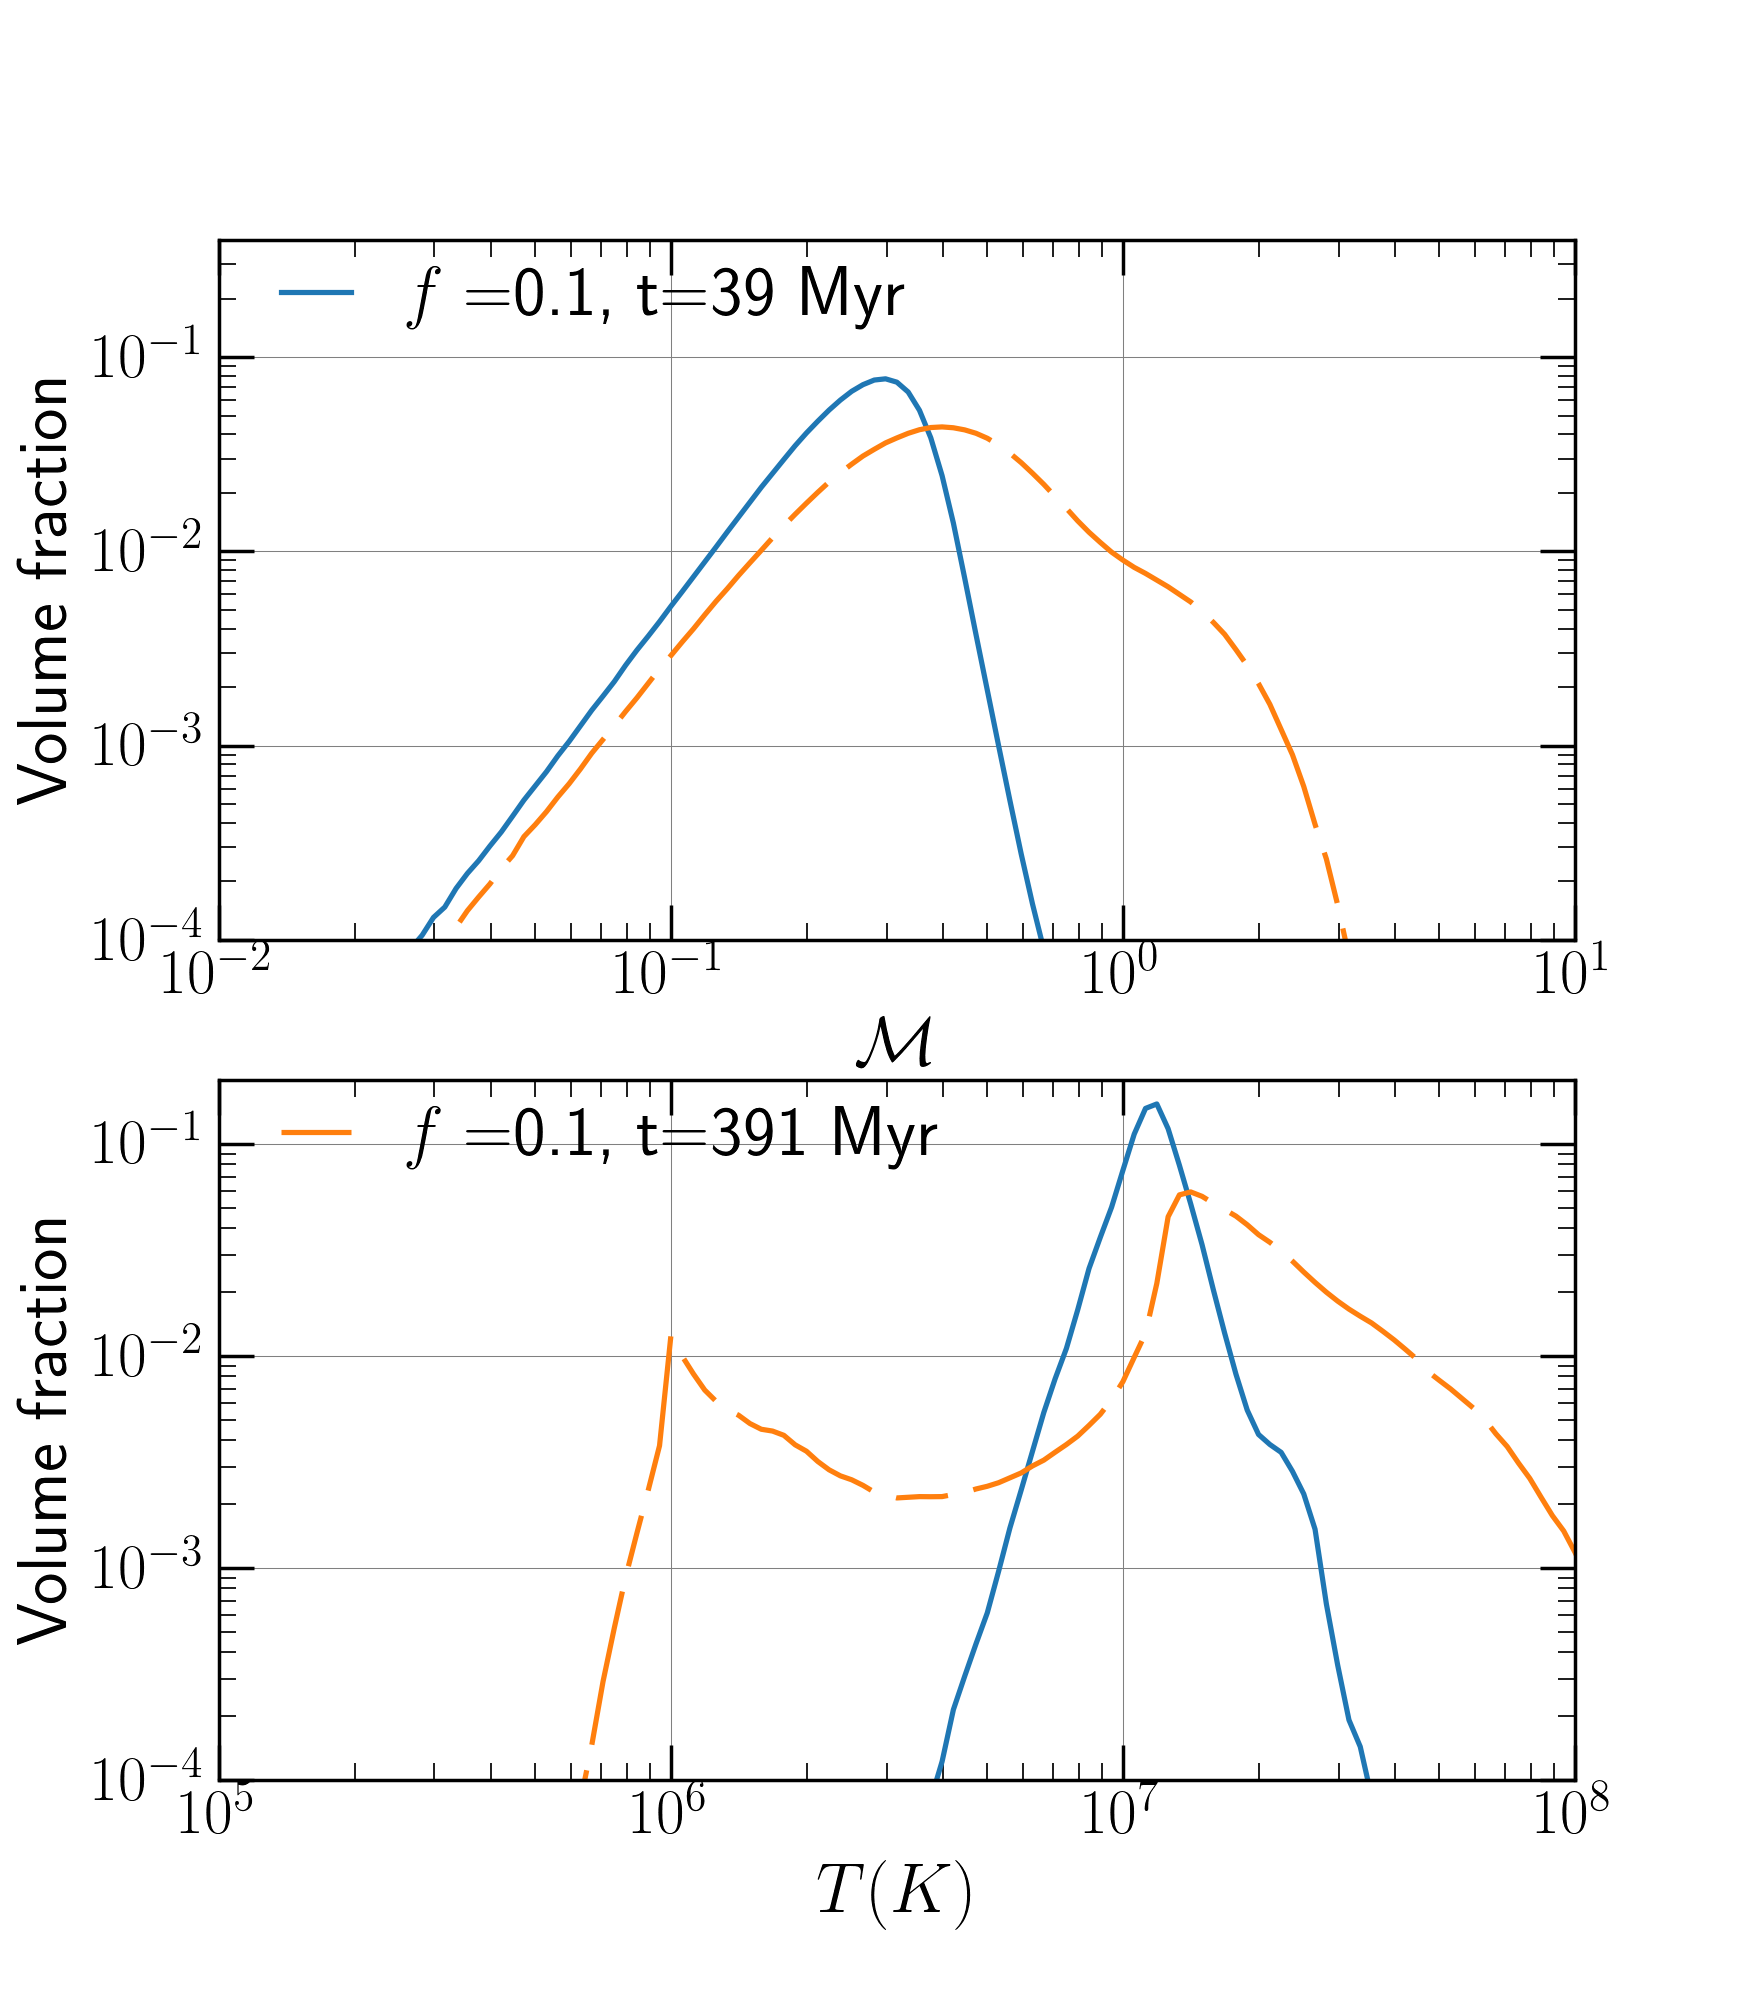
The top panels of Figure 13 show the cold gas volume rendering plot of our weak turbulence run (; run BDh2) that matches Hitomi LOS velocity dispersion, just after condensation starts and later. The distribution of cold gas appears intermediate between pure turbulent heating runs (Fig. 7) and pure thermal heating run (top panels of Fig. 11). In particular, the cold gas cloud as a whole appears stationary but its surface is turbulent. Of course, the addition of thermal conduction will wipe out small scale features in temperature and density of the hot phase (e.g., see Fig. 4 in Gaspari et al. 2014 and Fig. 1 in Wagh et al. 2014), and anisotropic conduction makes the cold gas more filamentary (Sharma et al. 2010). The bottom two panels of Figure 13 show the Mach number and temperature PDF for the same run at early and late times. The late time Mach number peak occurs at a reasonable value of and the temperature of the hot phase peaks between 1 and 2 keV (a factor of two smaller than Perseus core so the comparison with Hitomi observations is not quantitative). The temperature distribution after condensation is bimodal with a lack of gas at intermediate temperatures.
5.3 Scaling of density, pressure & surface brightness perturbations
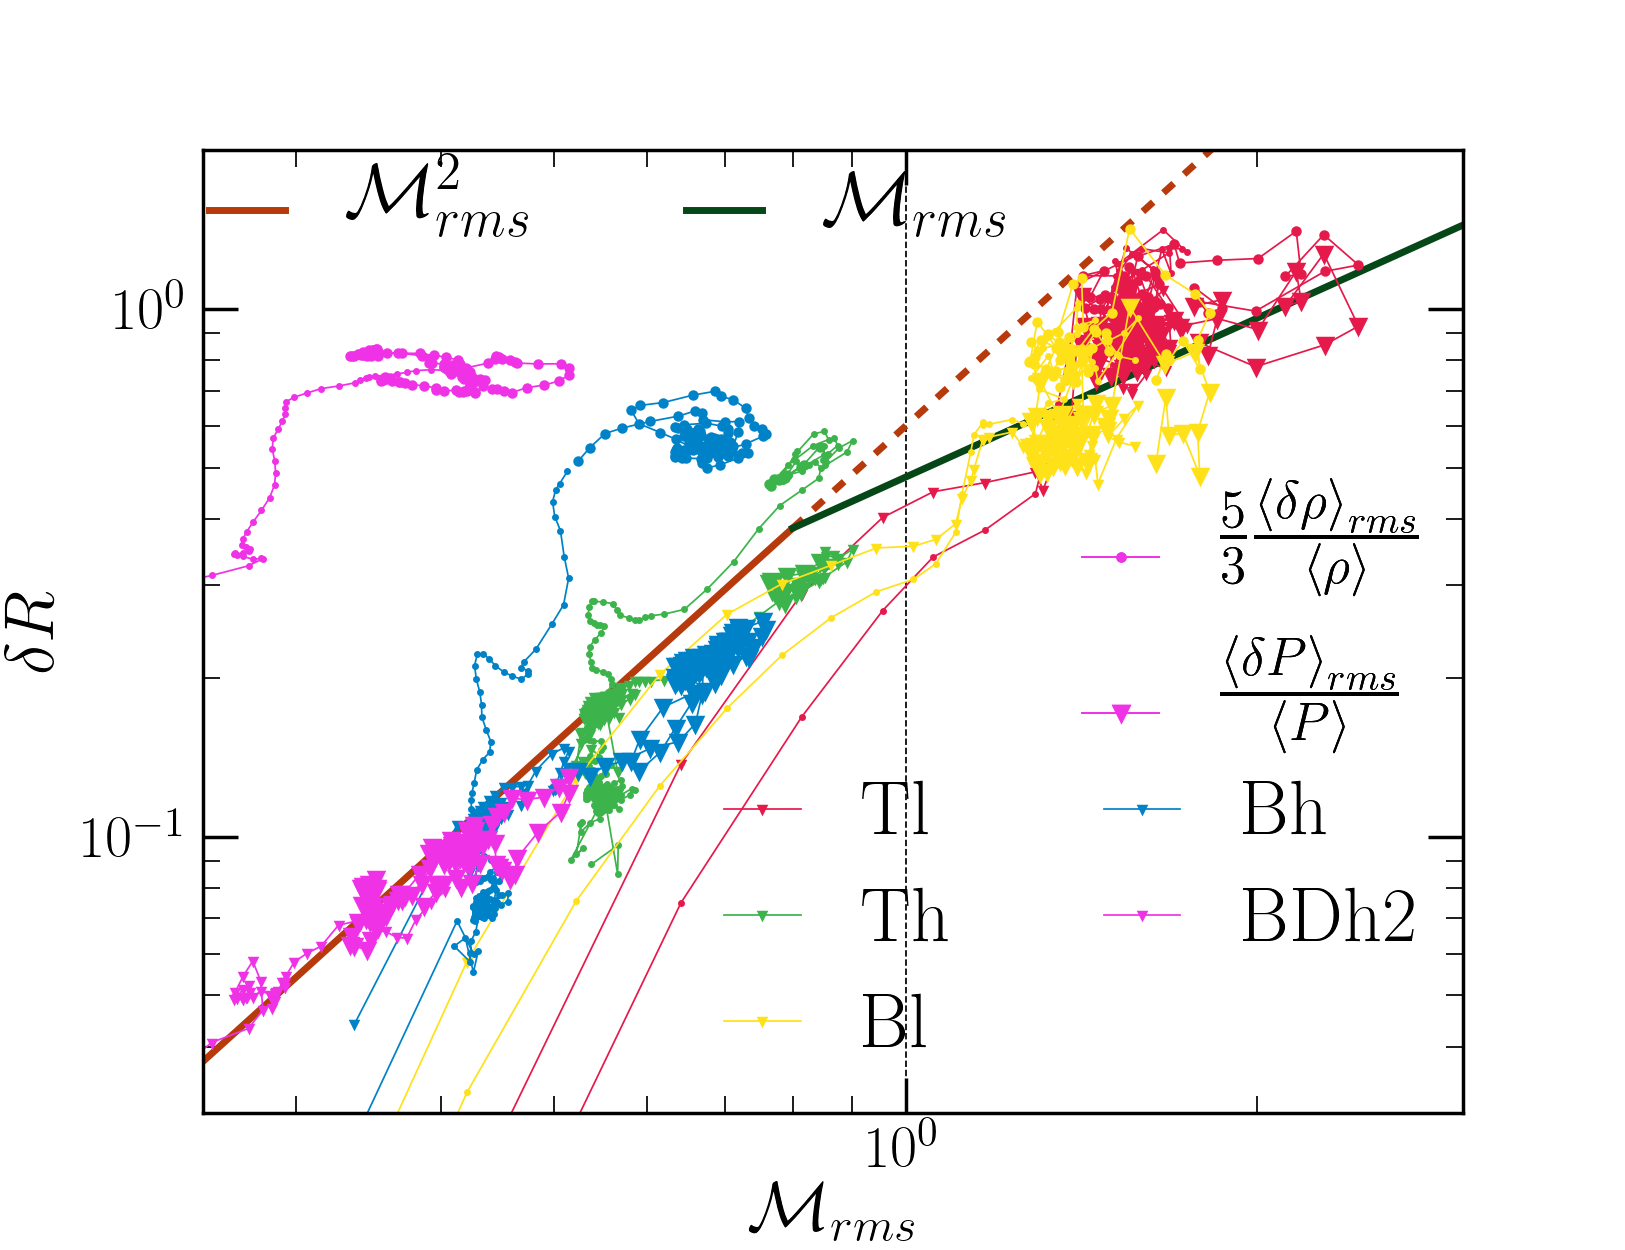
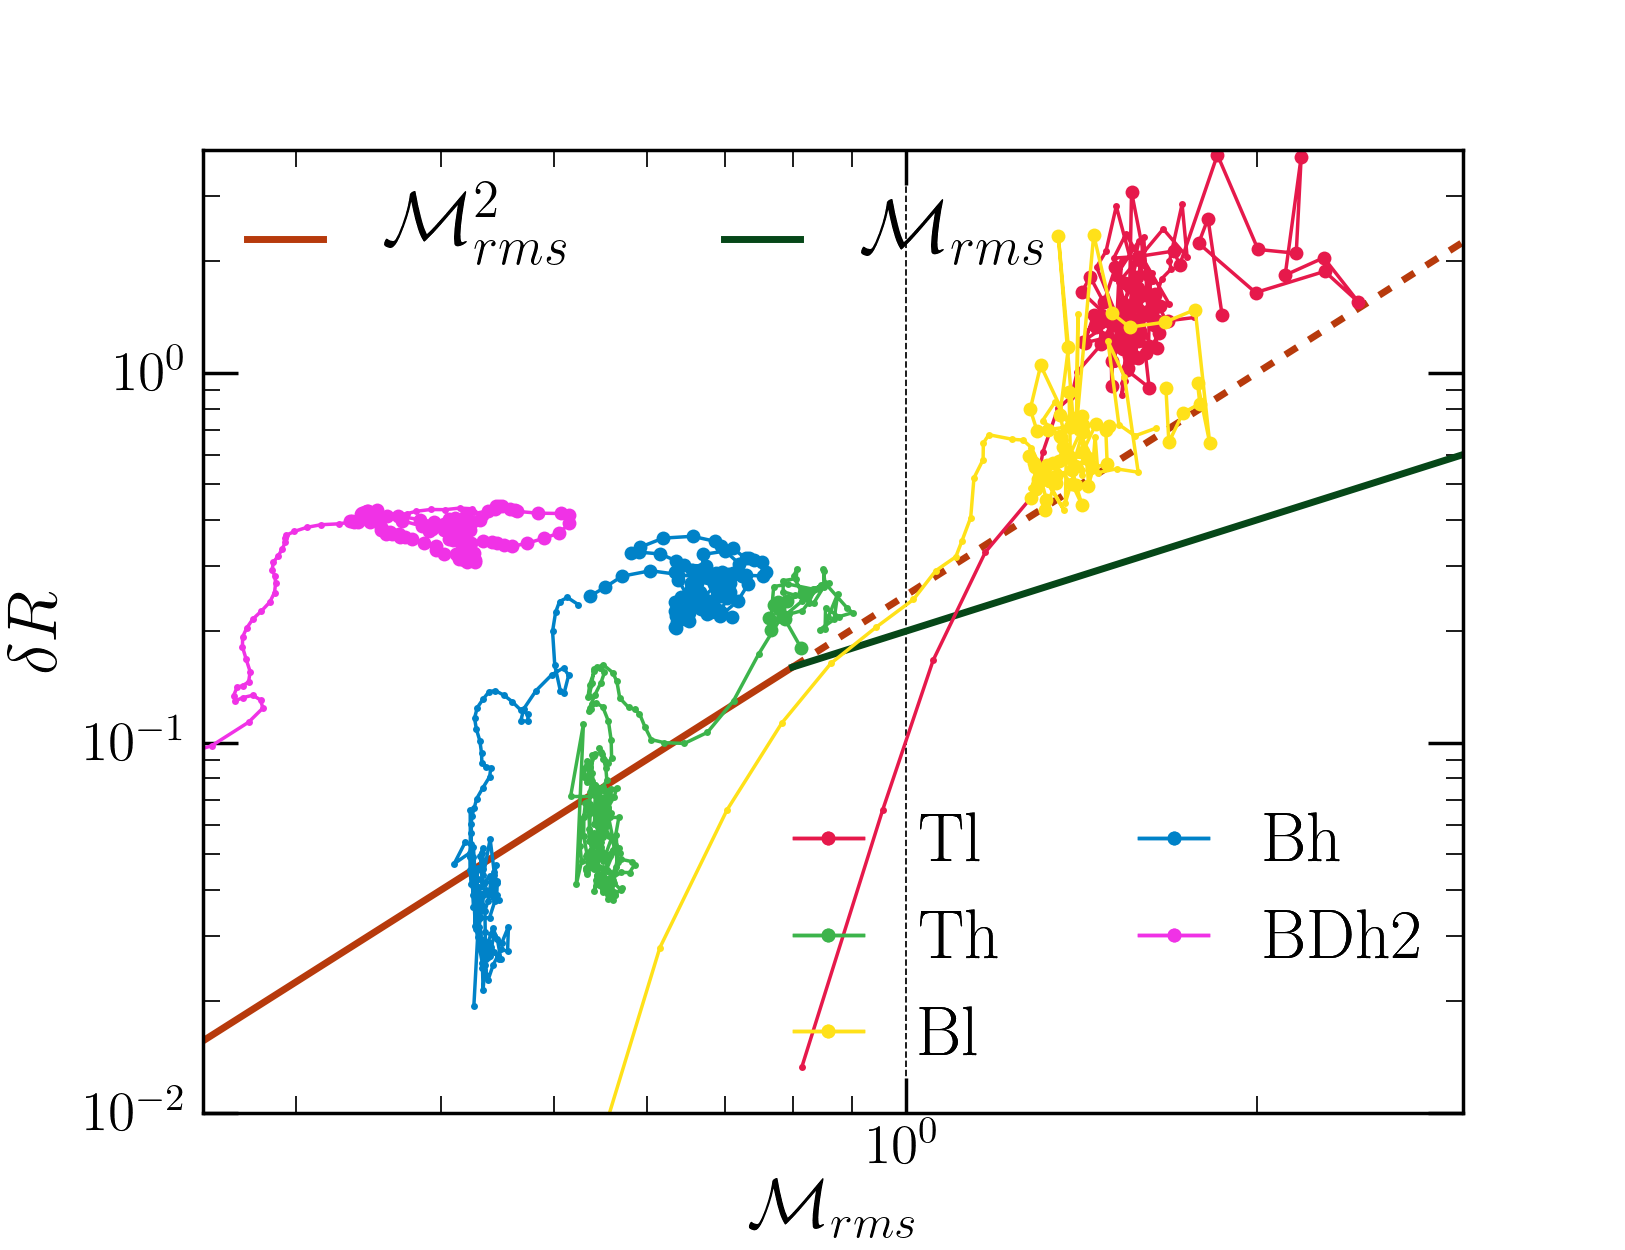
Most of the work relating density and surface brightness fluctuations (measured from X-ray observations) in the ICM to the level of turbulence has not included the effects of cooling and heating. While this is justifiable for non-cool core clusters and for cluster outskirts that have long cooling times, the cool cores are fundamentally affected by cooling and heating. Our idealized thermal balance runs (see section 4) are a step towards making the cool-core turbulence models more realistic. In fact, the density perturbations because of local thermal instability, which can lead to multiphase gas, are much larger than what is expected from K41 turbulence. The caveat, however, is that we do not include the cluster gravity which can suppress condensation and density fluctuations to some extent.
Figure 14 shows the rms density and pressure fluctuations as a function of the rms Mach number for some of our thermal balance runs. The thick solid lines show the scaling from pure turbulence runs (Fig. 1). The density fluctuations are much larger than pure turbulence because isobaric (because sound crossing time is shorter than cooling time) thermal instability leads to large density fluctuations but not large turbulent velocities. Note that density perturbations are large even before condensation. Not only are the density fluctuations much larger than the scaling for isotropic/homogeneous turbulence, they are also larger than the linear extrapolation of supersonic scaling or scaling of density perturbations with internal gravity waves in a stratified atmosphere ().
Similarly, in Figure 15 the surface brightness fluctuations are also much larger. The implication is that the turbulent velocities inferred from density fluctuations can be much higher if thermal instability is ignored (as in Zhuravleva et al. 2014a). The pressure fluctuations, in contrast, are smaller and consistent with isotropic/homogeneous turbulence (Fig. 14). Also note that the pressure fluctuations for subsonic internal gravity waves are much smaller than density fluctuations. Table 3 lists the nature of density, pressure and velocity perturbations for different regimes relevant to the ICM. Future comparison of X-ray surface brightness maps (from Chandra/XMM maps), Sunyaev-Zeldovich fluctuations (which probe the line of sight pressure fluctuations) and turbulent broadening in X-ray lines (e.g., by successors of Hitomi) can teach us much about the nature of dominant fluctuations in the ICM.
| Fluctuations | for |
|---|---|
| isotropic/homogeneous turbulence | |
| internal gravity waves | , |
| thermal instability + turbulence | , |
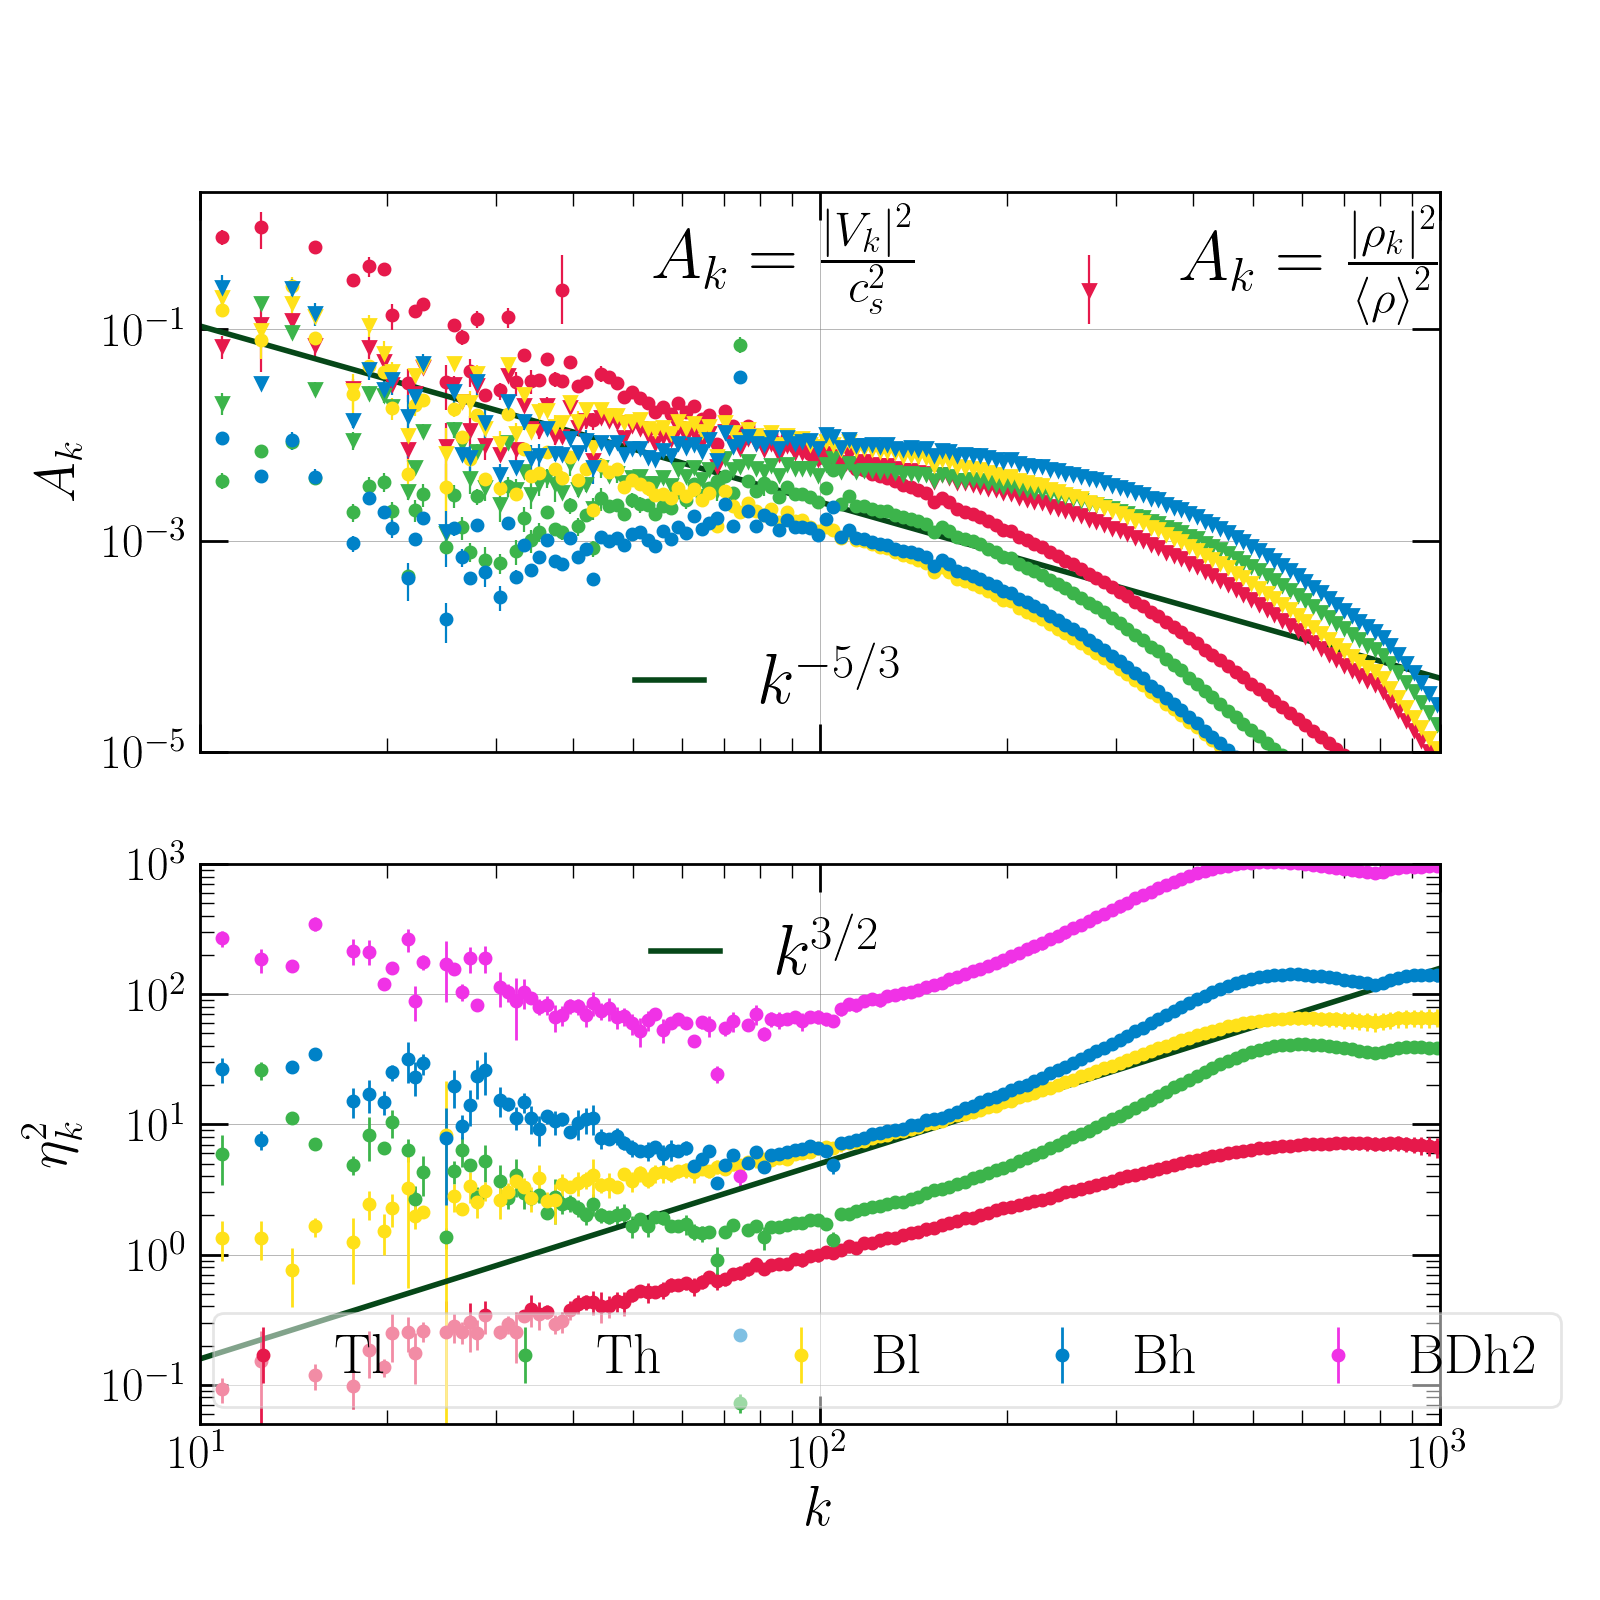
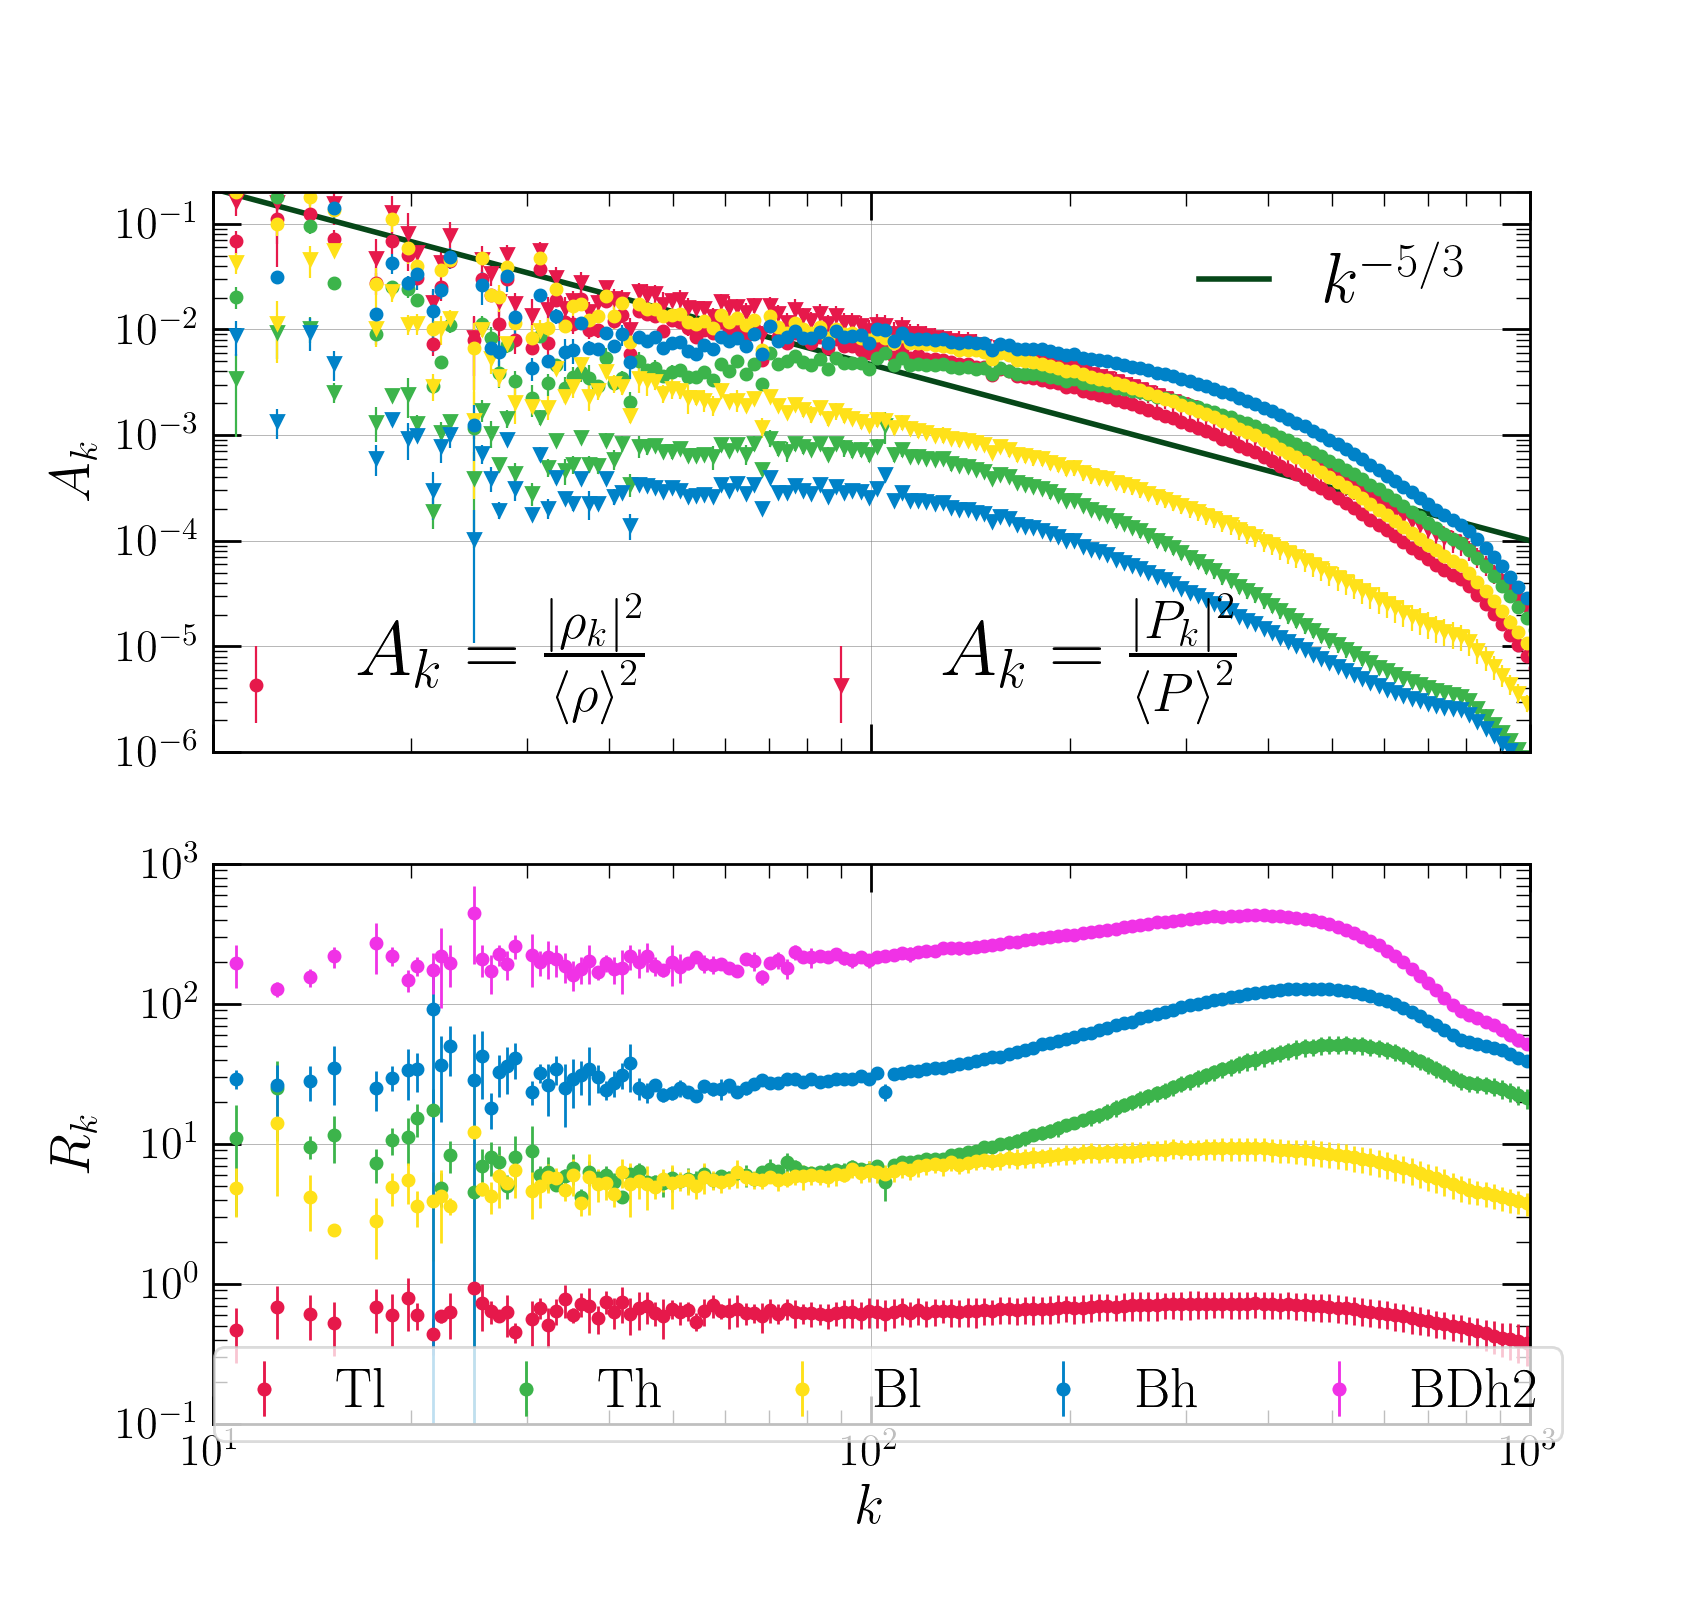
Figures 16 and 17 show the density, pressure and velocity power spectra as a function of wavenumber (). The amplitude of density fluctuations is much higher (as expected from Figure 14) and the density fluctuation spectrum is much shallower than K41 spectrum (expected in absence of cooling/heating). The velocity and pressure power spectra in the subsonic regime are consistent with K41 turbulence (see Fig. 2). A similar nature for the power spectra is also seen for the pure thermal heating run QD (not shown in these figures).
6 Conclusions
We have carried out high resolution simulations of turbulence relevant to the intracluster medium (ICM), and analysed scaling of various physical quantities and observables. Unlike most previous works, we explicitly consider the influence of cooling and heating in the cluster core on density, pressure and velocity fluctuations. Based on our simulations, following are our key conclusions.
-
•
The turbulent heating rate is very sensitive to , and can be matched with the average core cooling rate by changing slightly (and to some extent by changing ; e.g., see section 6.2 of Zhuravleva et al. 2018).However, if the cold gas is to condense out of the hot phase due to thermal instability, the cooling time must be shorter than the turbulent mixing time. This constraints the Mach number in the hot phase to be for driving on 10s of kpc, which is ruled out by observations. Driving at smaller scales somewhat reduces the Mach number in the hot phase (; see Eq. 17), but it is still much larger than observations. Moreover, small-scale driving delays cold gas condensation because of short mixing time on the driving scale. In the context of our thermal balance models with multiphase condensation, the only satisfactory way of matching the turbulent velocity measured by Hitomi in the core of Perseus cluster is by reducing the fraction of turbulent heating to of the cooling rate (see subsection 5.2). Thus, turbulent heating does not seem to be the dominant heating source in cool cores. Other sources that do not contribute much fluid motion in the hot phase provide of the feedback heating. Turbulent heating fraction is even smaller for driving at larger scales. Also with cooling present, density and surface brightness fluctuations due to local thermal instability can be much larger than what is anticipated from turbulence-driven internal gravity waves.
-
•
The ratio between the density and velocity power spectra is much higher and scale dependent for thermal balance runs (see subsection 5.3). For pure isotropic/homogeneous turbulence in the subsonic regime, this ratio is independent of scale () but increases linearly with the Mach number (see Fig. 2). For comparison, this ratio seems to be close to and independent of when the background stable stratification is important, and cooling and heating are ignored (Gaspari & Churazov (2013); Zhuravleva et al. (2014b); see section 5.1).
-
•
For thermal balance simulations, the density and surface brightness (SB) fluctuations are much larger than their scaling with the Mach number for turbulence simulations, and even compared to the density fluctuations seeded by internal gravity waves (see Table 3 & subsection 5.3). Matching the X-ray surface brightness fluctuations with turbulence or gravity wave scaling would lead to an overestimate of turbulent velocities. The power spectrum of density with heating/cooling is much larger and shallower compared to K41 scaling, but the pressure power spectrum is similar to the velocity power spectrum, which follows K41 scaling (Figs. 16, 17). Thus, comparing X-ray surface brightness, high resolution spectra of X-ray lines, and the fluctuations of the Sunyaev-Zeldovich signal can tell us about the nature of perturbations in the ICM.
An important caveat of our simulations is that we do not include gravitational stratification, so internal gravity waves that can be excited by turbulence and lead to density fluctuations are absent. Although stratification is weak in galaxy clusters, it is necessary to include it in combination with cooling and heating to draw firm conclusions about the nature of fluctuations in cluster cores. These fluctuations are a treasure-trove of information about physical processes in the ICM.
Acknowledgements
We acknowledge the high performance computing facilities (in particular SahasraT) at the Supercomputer Education and Research Centre (SERC), Indian Institute of Science. This work was partially supported by an India-Israel joint research grant (6-10/2014[IC]) and a Swarnajayanti Fellowship from the Department of Science and Technology (DST/SJF/PSA-03/2016-17). PS thanks the Humboldt Foundation to enable his sabbatical at MPA. PS acknowledges very helpful discussions with Eugene Churazov. RM thanks Naveen Yadav for his valuable inputs during the start of this project. RM thanks Christoph Federrath for his valuable suggestions on the paper. We thank Xun Shi and Noam Soker for helpful email exchanges and the referee Irina Zhuravleva for a constructive report.
Additional links
The movies for the evolution of cold gas in different simulations in the paper is available at: https://www.mso.anu.edu.au/~rajsekha/BT_movies.html.
References
- Aharonian et al. (2016) Aharonian F., et al., 2016, Nature, 535, 117
- Balbus (2000) Balbus S. A., 2000, ApJ, 534, 420
- Bambic et al. (2018) Bambic C. J., Pinto C., Fabian A. C., Sanders J., Reynolds C. S., 2018, Monthly Notices of the Royal Astronomical Society: Letters, 478, L44
- Banerjee & Sharma (2014) Banerjee N., Sharma P., 2014, Monthly Notices of the Royal Astronomical Society, 443, 687
- Bolgiano (1959) Bolgiano R., 1959, Journal of Geophysical Research, 64, 2226
- Cavagnolo et al. (2008) Cavagnolo K. W., Donahue M., Voit G. M., Sun M., 2008, ApJ, 683, L107
- Choudhury & Sharma (2016) Choudhury P. P., Sharma P., 2016, MNRAS, 457, 2554
- Churazov et al. (2012) Churazov E., et al., 2012, Monthly Notices of the Royal Astronomical Society, 421, 1123
- Corrsin (1951) Corrsin S., 1951, Journal of Applied Physics, 22, 469
- Edge (2001) Edge A. C., 2001, MNRAS, 328, 762
- Eswaran & Pope (1988) Eswaran V., Pope S., 1988, Computers & Fluids, 16, 257
- Fabian (1994) Fabian A. C., 1994, Annual Review of Astronomy and Astrophysics, 32, 277
- Falceta-Gonçalves et al. (2010) Falceta-Gonçalves D., de Gouveia Dal Pino E. M., Gallagher J. S., Lazarian A., 2010, ApJ, 708, L57
- Field (1965) Field G. B., 1965, The Astrophysical Journal, 142, 531
- Gaspari & Churazov (2013) Gaspari M., Churazov E., 2013, Astronomy & Astrophysics, 559, A78
- Gaspari et al. (2014) Gaspari M., Churazov E., Nagai D., Lau E. T., Zhuravleva I., 2014, A&A, 569, A67
- Guo & Oh (2008) Guo F., Oh S. P., 2008, MNRAS, 384, 251
- Hillel & Soker (2017) Hillel S., Soker N., 2017, MNRAS, 466, L39
- Hu (1992) Hu E. M., 1992, ApJ, 391, 608
- Kannan et al. (2017) Kannan R., Vogelsberger M., Pfrommer C., Weinberger R., Springel V., Hernquist L., Puchwein E., Pakmor R., 2017, ApJ, 837, L18
- Khatri & Gaspari (2016) Khatri R., Gaspari M., 2016, MNRAS, 463, 655
- Kolmogorov (1941) Kolmogorov A. N., 1941, in Dokl. Akad. Nauk SSSR. pp 16–18, doi:10.1098/rspa.1991.0076
- Konstandin et al. (2012) Konstandin L., Girichidis P., Federrath C., Klessen R. S., 2012, ApJ, 761, 149
- Koyama & Inutsuka (2004) Koyama H., Inutsuka S.-i., 2004, The Astrophysical Journal Letters, 602, L25
- Kumar et al. (2014) Kumar A., Chatterjee A. G., Verma M. K., 2014, Phys. Rev. E, 90, 023016
- Lau et al. (2017) Lau E. T., Gaspari M., Nagai D., Coppi P., 2017, ApJ, 849, 54
- Lesieur (2008) Lesieur M., 2008, Turbulence in fluids, Fluid mechanics and its applications, vol. 84
- Levinson & Eichler (1992) Levinson A., Eichler D., 1992, ApJ, 387, 212
- Li et al. (2015) Li Y., Bryan G. L., Ruszkowski M., Voit G. M., O’Shea B. W., Donahue M., 2015, ApJ, 811, 73
- Li et al. (2017) Li Y., Ruszkowski M., Bryan G. L., 2017, ApJ, 847, 106
- Lindborg (2006) Lindborg E., 2006, Journal of Fluid Mechanics, 550, 207
- McCourt et al. (2012) McCourt M., Sharma P., Quataert E., Parrish I. J., 2012, MNRAS, 419, 3319
- McCourt et al. (2018) McCourt M., Oh S. P., O’Leary R., Madigan A.-M., 2018, MNRAS, 473, 5407
- McDonald et al. (2012) McDonald M., Veilleux S., Rupke D. S. N., 2012, ApJ, 746, 153
- McNamara & Nulsen (2007) McNamara B. R., Nulsen P. E. J., 2007, ARA&A, 45, 117
- Mignone et al. (2007) Mignone A., Bodo G., Massaglia S., Matsakos T., Tesileanu O., Zanni C., Ferrari A., 2007, in JENAM-2007, “Our Non-Stable Universe”. IOP Publishing, p. 228, doi:10.1086/513316
- Nolan et al. (2015) Nolan C. A., Federrath C., Sutherland R. S., 2015, MNRAS, 451, 1380
- O’Dea et al. (2008) O’Dea C. P., et al., 2008, ApJ, 681, 1035
- Ozmidov (1965) Ozmidov R. V., 1965, Atmos. Oceanic Phys., 1, 861
- Prasad et al. (2015) Prasad D., Sharma P., Babul A., 2015, ApJ, 811, 108
- Prasad et al. (2018) Prasad D., Sharma P., Babul A., 2018, ApJ, 863, 62
- Quataert (2008) Quataert E., 2008, ApJ, 673, 758
- Rafferty et al. (2006) Rafferty D. A., McNamara B., Nulsen P., Wise M., 2006, The Astrophysical Journal, 652, 216
- Revaz et al. (2008) Revaz Y., Combes F., Salomé P., 2008, A&A, 477, L33
- Roberg-Clark et al. (2016) Roberg-Clark G. T., Drake J. F., Reynolds C. S., Swisdak M., 2016, ApJ, 830, L9
- Ruszkowski & Oh (2010) Ruszkowski M., Oh S. P., 2010, ApJ, 713, 1332
- Ruszkowski et al. (2004) Ruszkowski M., Brüggen M., Begelman M. C., 2004, ApJ, 611, 158
- Schmidt et al. (2006) Schmidt W., Hillebrandt W., Niemeyer J. C., 2006, Computers & Fluids, 35, 353
- Schuecker et al. (2004) Schuecker P., Finoguenov A., Miniati F., Böhringer H., Briel U. G., 2004, A&A, 426, 387
- Sharma et al. (2009a) Sharma P., Chandran B. D. G., Quataert E., Parrish I. J., 2009a, ApJ, 699, 348
- Sharma et al. (2009b) Sharma P., Chandran B. D. G., Quataert E., Parrish I. J., 2009b, in Heinz S., Wilcots E., eds, American Institute of Physics Conference Series Vol. 1201, American Institute of Physics Conference Series. pp 363–370 (arXiv:0909.0270), doi:10.1063/1.3293077
- Sharma et al. (2010) Sharma P., Parrish I. J., Quataert E., 2010, The Astrophysical Journal, 720, 652
- Sharma et al. (2012) Sharma P., McCourt M., Quataert E., Parrish I. J., 2012, Monthly Notices of the Royal Astronomical Society, 420, 3174
- Sutherland & Dopita (1993) Sutherland R. S., Dopita M. A., 1993, The Astrophysical Journal Supplement Series
- Verma (2018) Verma M., 2018, Physics of Buoyant Flows. World Scientific, New Jersey
- Wagh et al. (2014) Wagh B., Sharma P., McCourt M., 2014, MNRAS, 439, 2822
- Zhuravleva et al. (2014a) Zhuravleva I., et al., 2014a, Nature, 515, 85
- Zhuravleva et al. (2014b) Zhuravleva I., et al., 2014b, The Astrophysical Journal Letters, 788, L13
- Zhuravleva et al. (2018) Zhuravleva I., Allen S. W., Mantz A., Werner N., 2018, ApJ, 865, 53
Appendix A Computing power spectra
Since we use a discrete 3-D grid, the Fourier transform is obtained by taking a discrete Fourier transform (DFT) of the real space data ,
| (21) |
where each component of takes a values ( is the box size and the number of grid points in each direction) along the three directions. We can create spherical shells in space and define the power spectrum as
| (22) | ||||
| (23) |
where is the bin size.
Since we have a large range of s, we use a uniformly spaced grids in , with
| (24) |
where is the number of bins into which we divide the -space, and and are the maximum and minimum wave numbers given by
| (25) | ||||
| (26) |
Note that , the maximum value of . So the bin-boundary is given by
| (27) |
with , and
| (28) |
The power spectrum is then given by
| (29) |
Appendix B Calculating density and surface brightness spectra
The central region of a cluster is its brightest part and is the major contributor to the surface brightness profile of the cluster. In our simulations, we model the central core of a cluster. This region is roughly spherical. However, we model it in a 3D Cartesian setup. So, while calculating the density and surface brightness power spectra, we use a roughly spherical density profile given by
| (30a) | |||
| (30b) | |||
where is the mean density, is the density at a given location in our simulations, and is the modified spherical density that we use for calculating the power spectrum of surface brightness. The transition scale of density perturbations, , has been set to , where is the size of our Cartesian box.
The weighting function decreases smoothly from one at to zero at around . The 2-D surface brightness map is given by
| (31) |
where = . This analysis method only affects the low- (large scale) modes of the surface brightness power spectrum. The inertial range remains unaffected by this method.