Negative thermal expansion near the precipice of structural stability in open perovskites
Abstract
Negative thermal expansion (NTE) describes the anomalous propensity of materials to shrink when heated. Since its discovery, the NTE effect has been found in a wide variety of materials with an array of magnetic, electronic and structural properties. In some cases, the NTE originates from phase competition arising from the electronic or magnetic degrees of freedom but we here focus on a particular class of NTE which originates from intrinsic dynamical origins related to the lattice degrees of freedom, a property we term structural negative thermal expansion (SNTE). Here we review some select cases of NTE which strictly arise from anharmonic phonon dynamics, with a focus on open perovskite lattices. We find that NTE is often present close in proximity to competing structural phases, with structural phase transition lines terminating near =0 K yielding the most superlative displays of the SNTE effect. We further provide a theoretical model to make precise the proposed relationship among the signature behavior of SNTE, the proximity of these systems to structural quantum phase transitions and the effects of phase fluctuations near these unique regions of the structural phase diagram. The effects of compositional disorder on NTE and structural phase stability in perovskites are discussed.
I Introduction
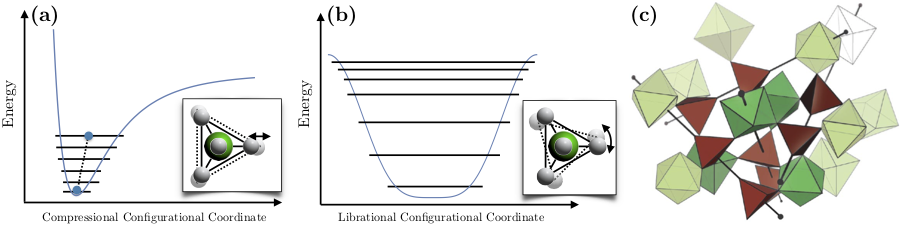
Thermal expansion is among the most widely recognized thermodynamic properties of materials. From a textbook perspective Ashcroft and Mermin (1976), thermal expansion occurs through anharmonic free energy terms arising from nuclear lattice degrees of freedom. The dominant appearance of the positive thermal expansion (PTE) found in both research-grade and industrial materials is heuristically ascribed Barrera et al. (2005); Miller et al. (2009); Takenaka et al. (2012) to the expected anharmonic behavior of a generic interatomic potential, which is hard at short distance and soft at large distance (Figure 1a). As temperature is raised, higher energy excitations are populated which have an ever increasing mean separation, dilating the bond and presumably lattice dimensions. Of course this is not a theorem any more than crystals are molecules and collective motion of lattices permit various potential landscapes, such as a librational coordinate of tetrahedral molecular solids Prager and Heidemann (1997), which possess clear qualitative differences (Figure 1b).
Mention of negative thermal expansion (NTE), a material’s tendency to shrink when heated, often evokes discussion of liquid water-ice expansion responsible for icebergs and the 4K temperature window above the ice-water phase boundary where phase fluctuations occur. This is an example of a route to achieving NTE which relies on broadened phase transitions between a low-temperature high-volume phase fluctuating into a high-temperature low-volume phase, other examples of which include the industrial alloy InVar Guillaume (1920) (Fe64Ni36) and more recently discovered NTE materials Azuma et al. (2011); Takenaka and Takagi (2005); Qu et al. (2012); Chen et al. (2013a, b) (for more details on this approach, see Takenaka’s review in this volume Takenaka (2018)). While this route to realizing NTE is promising for many applications requiring only dimensional concerns, NTE at these broadened transitions occurs only in heavily restricted regions of the magnetic and electronic phase diagrams, constraining a thermodynamic number of degrees of freedom to achieve a single mechanical characteristic. Thus, these types of NTE materials will be severely restricted in their potential for multifunctional applications.
Remarkably, there exists a growing class of materials with strong, isotropic, robust, and thermally persistent NTE that arises from structural motifs Mary et al. (1996); Evans et al. (1997a, b); Pryde et al. (1997); Perottoni and Jornada (1998); Ramirez and Kowach (1998); Ernst et al. (1998); Ramirez et al. (2000); Mittal et al. (2001); Cao et al. (2002); Ouyang et al. (2002); Cao et al. (2003); Drymiotis et al. (2004); Mittal et al. (2004); Hancock et al. (2004b); Tucker et al. (2005); Kennedy and White (2005); Pantea et al. (2006); Keen et al. (2007); Tucker et al. (2007); Figueirêdo and Perottoni (2007); Schlesinger et al. (2008); Keen et al. (2011); Gallington et al. (2013); Gupta et al. (2013); Gallington et al. (2014); Bridges et al. (2014); Sanson (2014); Greve et al. (2010); Morelock et al. (2013a); Martinek and Hummel (1968); Zhou et al. (2008); Han and Goddard (2007); Lee et al. (2005); Mittal et al. (2018). NTE in these systems is often discussed in connection with transverse fluctuations of a linkage between volume-defining vertices, which may accompany the librational, or hindered rotational motion of polyhedral subunits. The energy landscape for such motion tends to be much softer (0-2 THz) than bond-stretching motion (10-30 THz in oxides) which is often the implicated culprit of PTE. Here, NTE arises from the cooperative fluctuations of the bond network on THz time scales under very strong anharmonic influences and appears without necessarily constraining the magnetic or electronic phase diagram, permitting one to envisage new multifunctional materials with diverse mechanical, spin, orbital, thermal, electronic, superconducting, and more exotic order coexisting with NTE. Study of the unusual physics behind this type of NTE informs discovery efforts to find new contexts for this remarkable phenomenon. In addition, NTE materials hold promising application potential in stabilizing fiber Bragg gratings for high-speed telecommunication Kowach and Ramirez (2002); Fleming et al. (1997), substrates for devices which benefit from thermally controlled stresses and the formation of rigid composite structural materials with engineered thermal characteristics through combinations of PTE and NTE components Balch and Dunand (2004); De Buysser et al. (2004); Lommens et al. (2005); Sullivan and Lukehart (2005); Lind et al. (2011).
This second circumstance for NTE, which we term structural NTE (SNTE), is the focus of the present article. The field of SNTE has been met with sustained interest from the physics, chemistry, and materials science communities since the re-discovery of the strong SNTE in ZrW2O8 in 1996 Mary et al. (1996); Martinek and Hummel (1968). The SNTE effect here persists over the temperature range 4-1050 K and has a sizable linear coefficient of thermal expansion (CTE) of ppm/K near room temperature, which is isotropic due to the cubic symmetry maintained at all observed temperatures under ambient pressure. The low-symmetry -phase structure of ZrW2O8 (Figure 1c) consists of ZrO6 octahedra and WO4 tetrahedra in the space group, which has a screw axis along . An order-disorder structural transition to a (cubic) -phase occurs at zero pressure and K. The NTE effect survives the structural transition, with a small discontinuity and reduction in the CTE to ppm/K. Furthermore, application of hydrostatic pressure at K first induces an orthorhombic transition at GPa, followed by pressure-induced amorphization realized between GPa Ravindran et al. (2001); Evans et al. (1997a); Perottoni and Jornada (1998). Both the - and -phases contain four formula units, atoms, in each unit cell, leading to a complex phononic structure with 3 acoustic and optical branches.
Despite decades of intense research, the complex structure and associated dynamics of the ZrW2O8 lattice and the related O8 compounds complicates the interpretation of both theoretical and experimental investigations into the mechanisms of SNTE. For instance, a commonly identified feature in the low-temperature -phase is the two WO4 tetrahedra with unshared “terminal” oxygen atoms aligned along the screw axis. The under-constrained freedom of these tetrahedra along this axis are often cited as being responsible for the softness of the crucial NTE modes, but there is much debate as to the precise nature of the mode and its contributions to NTE Ramirez et al. (2000); Hancock et al. (2004b). Several attempts at describing the soft mode as either a translation or rotation of the WO4 polyhedron were addressed via the space group symmetry - both rotational and translational motion are permitted and necessarily coupled due to the lost inversion symmetry. Another level of controversy in ZrW2O8 is the extent to which the molecular subunits may be regarded as rigid Cao et al. (2002); Tucker et al. (2007); Bridges et al. (2014); Dove and Fang (2016); Sanson (2014). Although ZrW2O8 presents clear scientific challenges, its discovery is significant in that it ignited a flurry of research into the microscopic origins of the SNTE, both theoretical and experimental, employing both thermodynamic Ramirez et al. (2000) and spectroscopic Ernst et al. (1998); Hancock et al. (2004b); Pantea et al. (2006); Drymiotis et al. (2004) probes of the low-energy lattice behavior. Some essential, guiding observations were revealed during the ensuing years: (i) ZrW2O8 has unusually low-energy lattice modes near 2-3meV Ramirez et al. (2000); Hancock et al. (2004b), (ii) structural phase transitions are readily induced via light hydrostatic pressure Ravindran et al. (2001); Evans et al. (1997a); Perottoni and Jornada (1998) and (iii) the SNTE arises from a delicate balance of the degrees of freedom and constraint in the host lattice framework Cao et al. (2002); Tucker et al. (2007); Bridges et al. (2014); Dove and Fang (2016); Sanson (2014).
One central question motivating SNTE research is why some materials show SNTE and others do not? To address this question will open avenues to discovery of new NTE materials and advancing technology born from its unique properties. While the precise mechanisms behind the dramatic SNTE in ZrW2O8 are still under contention, a variety of other simpler systems with equally impressive SNTE have been discovered in recent years Greve et al. (2010); Rodriguez et al. (2009); Hancock et al. (2015). In moving towards the goal of a deeper understanding of SNTE mechanisms, we sharpen our focus on the growing class of perovskite materials exhibiting NTE, including ScF3, ReO3 and related structural family members. We consider the rich structural phase diagrams of the perovskite structure and their description in terms of octahedral tilts and the corresponding slow lattice dynamics associated with the structural transitions. Although numerous, the hierarchy of phases is well understood and documented, making perovskites a particularly simple framework on which to study the interplay of lattice dynamics and macroscopic phenomena like NTE. In particular, we note how the corresponding dynamic modes of the perovskite lattice relate to soft-mode instabilities that accompany the approach to realized and incipient structural phase transitions and how these are coupled to mechanisms resulting in SNTE. Most importantly, we further develop the apparent connection between the emergence of SNTE alongside phase fluctuations that occur near =0K structural quantum phase transitions (SQPTs), for which we present the available experimental evidence and develop a systematic modeling scheme to explain the coupling between phase fluctuations and thermal expansion anomalies in perovskite materials.
II Perovskites, Structural Phases and Soft-Mode Induced Transitions
The perovskite lattice structure may well be identified as the double-helix of the solid state - a framework which is highly functionalizable, tunable, robust, and underpins perhaps every known category of physical behavior. This includes high-temperature superconducting, itinerant ferromagnetic, local ferromagnetic, ferroelectric, insulating, metallic, glassy, as well as a plethora of antiferromagnetic and other poorly understood phases which appear to compete, coexist, and cooperate within typically rich and complex phase diagrams Kimura et al. (2002); Maekawa et al. (2004); Takagi et al. (2010); Ngai et al. (2014). The cubic perovskites are lattice structures with formula unit , where the -site is typically an alkali or alkaline earth metal ion, is a transition metal and is the anion, most commonly forming an oxide or a halide. The highest-symmetry solid phase is shown below in Figures 2a and 3a, with a cubic space group symmetry and the -site ions in an octahedral coordination environment of -site anions. A hierarchy of structural phases in the perovskites are achieved through various concerted rotations of the coordination octahedra. These phases have been cataloged and a relationship between octahedral tilts and the lower-symmetry space groups due to these structural distortions have been developed Glazer (1972); Glazer and IUCr (1975) and are well-known in the ferroelectric community Benedek and Fennie (2013).
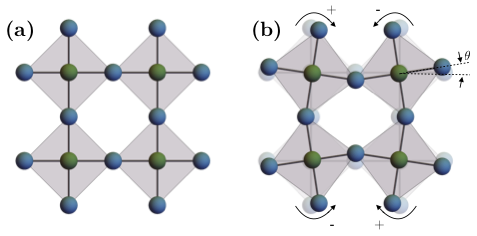
The scheme for indexing the possible octahedral tilts begins with a 2x2x2 unit cell of the cubic perovskite and considers rotations of the octahedra about each of the 3 fourfold () axes of the cubic phase. In the plane normal to a given rotation axis, neighboring octahedra are constrained to rotate at equal angles () of opposite sign, since neighboring -sites are bonded to a common -site anion (Figure 2b); there is, however, a choice in the phase of rotations for columns of octahedra along the rotation axis. Which phase pattern is realized is denoted by a superscript of or for in- and out-of-phase stacking, respectively, or a superscript of indicating a null rotation. The equality of rotation angles around each axis is given by using repeated characters. For instance, in Glazer notation represents three unequal rotations about , and , with all rotations in phase along each respective axis. Overall, there are 23 distinct possibilities of perovskite space groups and octahedral tilting patterns, which can be cubic to triclinic and anything in between. Several relevant examples of perovskite distortions and the Glazer notation are given in Figure 3.
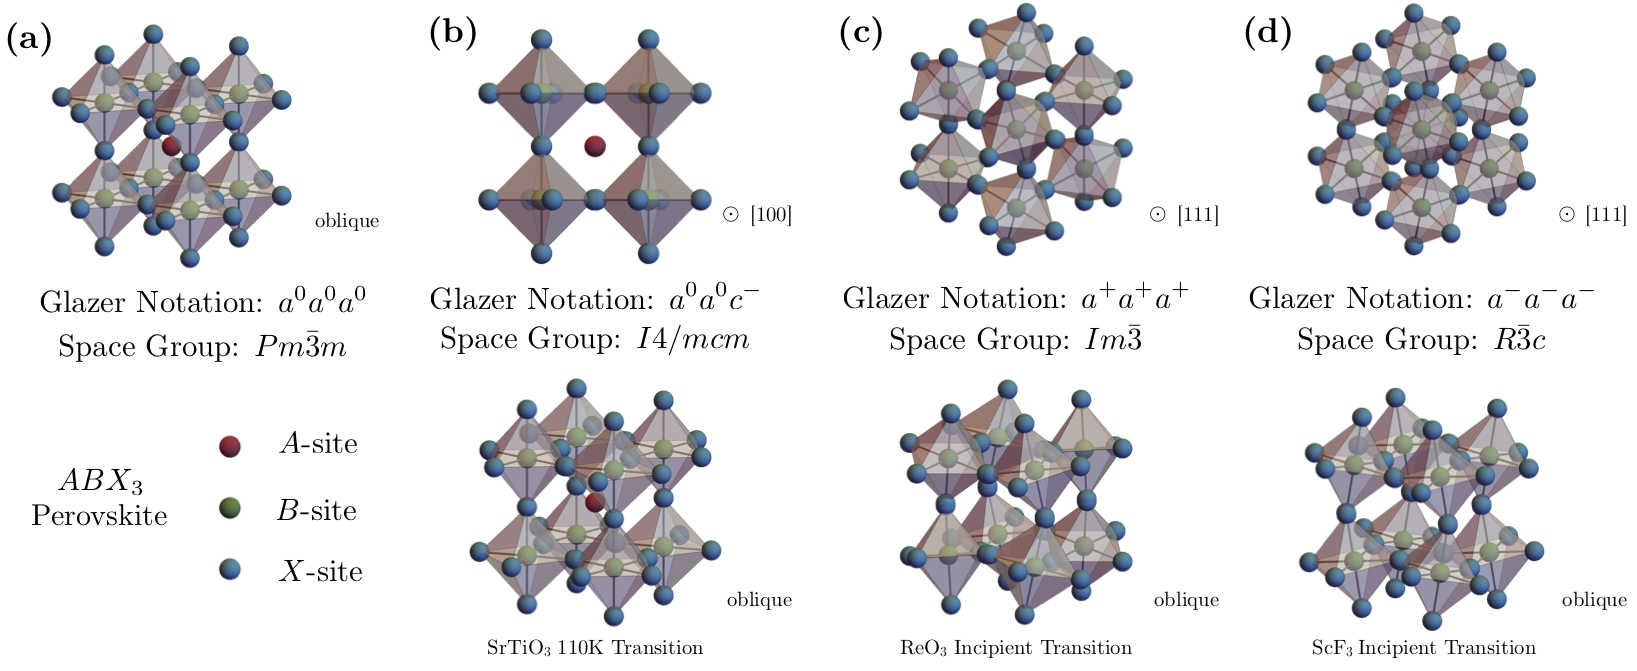
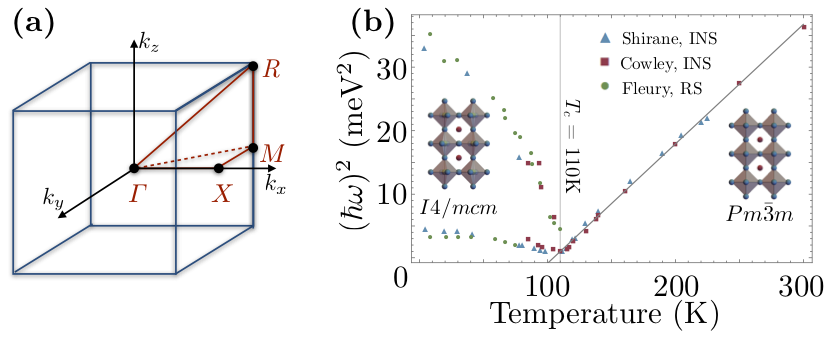
One of the best-studied structural instabilities in a perovskite structure is the transition at K in SrTiO3, first identified with electron spin resonance (ESR) spectra by Unoki and Sakudo Unoki and Sakudo (1967) and later confirmed by many others Cowley et al. (1969); Cowley (1964); Shirane and Yamada (1969); Fleury et al. (1968) via inelastic neutron scattering (INS), X-ray diffraction and Raman spectroscopy (RS). The room-temperature structure of SrTiO3 is that of the common space group depicted in Figure 3a, but signatures of tetragonal symmetry in the ESR and Raman Fleury et al. (1968) spectra are observed below K, along with anomalies in the elasticity Bell and Rupprecht (1963). Details of the atomic displacements reveal the lower-symmetry structure is the tetragonal space group, which corresponds to a -phase-staggered rotation of the TiO6 octahedra about a rotation axis, that is an octahedral tilting pattern of (Figure 3b). The displacements are related to the polarization of a zone-boundary optical phonon (irrep. ) existing at the -point of cubic Brillouin zone (BZ) (Figure 4a). In real space, the lowered-symmetry results in an effective doubling of the unit cell dimensions along one axis. In reciprocal space, however, the symmetry lowering occurs through a halving of the Brillouin zone and results in formation of new Bragg peaks as seen in an elastic scattering pattern (X-ray, neutron, electron). Dynamically, one can associate the transition to a slowing down of an optical phonon near the () point at the corner of the cubic Brillouin zone, corresponding to a “freezing” or “condensation” of one component of the triply degenerate -point “soft” mode.
SrTiO3 is the first material in which soft modes were measured using inelastic scattering, and their concomitance with structural phase transitions was subsequently established through their observation in many other perovskites, e.g. LaAlO3, KMnF3, PbTiO3 and BaTiO3 Shirane (1974). A soft-mode can generally be defined as any normal mode of the dynamic lattice whose energy or, equivalently, frequency of vibration decreases anomalously. When such a vibrational frequency reaches , the lattice becomes structurally unstable with respect to the displacements of this normal mode, and a subsequent symmetry-lowering, static deformation occurs to restore stability. For the simplest case of Landau-Ginsburg-Devonshire theory treated at the mean-field level, one expects a temperature dependence for the soft mode frequency Cowley (1980); Shirane (1974); Scott (1974):
| (1) |
This dependence for the -point soft-mode in SrTiO3 is shown in Figure 4b. This transition can be described by an order parameter, a quantity that is zero above and develops non-zero average values below , which follows the angle of rotation of the TiO6 octahedra about the principal axis in the low-symmetry tetragonal structure. The transition in SrTiO3 is, by all experimental accounts, second-order (continuous) in nature, but for many structural phase transitions signatures of the more common first-order (discontinuous) behavior renders the soft-mode approach invalid a priori. Nonetheless, soft modes can be used to interpret weakly first-order transitions and their frequency can be indicative of an incipient transition due to soft-mode coupling to other, primary order parameters. The 110K transition in SrTiO3 is also a prototypical example of critical behavior that can emerge in the vicinity of a structural transition, most notably the “central-peak” phenomenon discovered through an anomalous quasi-elastic peak in INS energy-transfer spectra, which can be explored elsewhere Halperin and Varma (1976); Topler et al. (1977); Riste et al. (1993).
In extreme cases, a material can approach dynamic instability with lowering temperature to near-zero soft mode energy, yet no temperature-induced transition is observed. In this situation, subsequent application of pressure, introduction of compositional disorder (doping) or other non-thermal parameters can perturb the ground-state of the system to drive the transition at K, realizing a quantum phase transition (QPT) Sachdev and Keimer (2011). Research surrounding the breakdown of canonical physical behavior near these quantum critical points (QCPs) is interesting in its own right Coleman and Schofield (2005); Gegenwart et al. (2008) but we below focus on QCPs within the structural phase diagrams and their relationship to the development of SNTE in a subset of the perovskites.
III NTE in Perovskite Frameworks
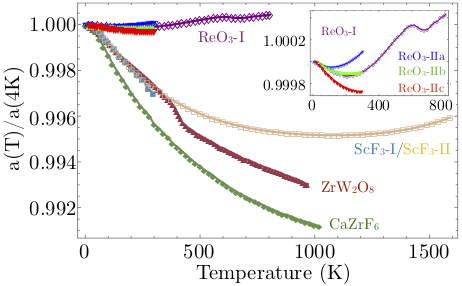
Most oxide perovskites O3 form with an -site, otherwise requiring a rare hexavalent electronic configuration for charge balance. One prominent exception is ReO3, which forms with no -site and maintains its cubic space group symmetry down to the lowest measured temperatures. In addition, ReO3 has been known to exhibit SNTE for many years, which is often attributed to soft modes permitted by the open-perovskite (-site-free) structure. The lack of the -site puts fewer dynamical constraints on the motion of the ReO6 octahedra in comparison to the constraints imposed by the -site in other perovskites. This permits large anisotropic thermal displacements of the linking oxygen atoms perpendicular to the Re-O-Re bond direction, making ReO3 more susceptible to lattice instabilities corresponding to these octahedral tilt patterns. This openness to the structure has also been noted as a key feature in many other SNTE materials, including ZrW2O8, leading to a larger set of soft, low-energy phonons that have mainly been identified as the cause of SNTE. Reports on the size of the SNTE effect in ReO3 vary, but in one report, SNTE was observed in two separated temperature windows of - K and - K Chatterji et al. (2009a) with a maximum measured linear thermal CTE of ppm/K Dapiaggi and Fitch (2009) (Figure 5).
ReO3 undergoes several structural phase transitions under hydrostatic pressure and is most studied at room temperature. Early INS investigations at ambient temperature established that ReO3 undergoes a pressure-induced second-order phase transition at GPa Axe et al. (1985). Further studies of transport at K showed that the lowest structural phase boundary terminates at a light hydrostatic pressure of only GPa, observed through a change of Fermi surface cross section Schirber and Morosin (1979); however, few reports are available in this difficult - region. Based on early high-temperature data, the pressure-induced phase is likely the tetragonal , although recent indications of a direct transition to a cubic phase have also been reported Axe et al. (1985); Jørgensen et al. (1986). Neutron diffraction at elevated hydrostatic pressures revealed that the phase is stable in the pressure range to GPa, above which the phase changes to the rhombohedral space group Jørgensen et al. (2004). The soft mode driving the pressure and temperature induced structural transition between the and cubic phases was shown to be three-component phonon mode involving anti-phase rotation of the neighboring ReO3 octahedra in an tilt pattern (Figure 3c). The temperature-dependence of the mode frequency as a function of temperature at ambient pressure is shown in Figure 6b, along with a fit to the mean-field result (Eq. 1). This mode is significant in that it is used to understand NTE behavior of open-perovskite systems but is also identified as an order parameter of the phase transition Chatterji et al. (2009b).
Unlike oxides, fluorides commonly form stable -site-free perovskite structures F3 due to the wider array of available ion valence configurations among the transition metals. Prominent among these open-perovskite fluorides is ScF3, which was discovered in 2010 by Greve et al. Greve et al. (2010) to exhibit a robust NTE effect, which has significant maximal magnitude of the linear CTE ppm/K, persisting over the broad temperature range of -K (Figure 5). At room temperature, ScF3 crystallizes isostructurally to ReO3 with space group symmetry and has been found to possess related structural instabilitiies corresponding to zone-boundary optical phonons. In ReO3, the condensing soft mode responsible for the low- high- structural phase transition is the distortion, while ScF3 and other 3-transition metal trifluorides fall into the lower-symmetry rhombohedral space group symmetry, attributed to the condensation of the optical phonon.
Although the cubic phase of ScF3 is stable at ambient pressure over the entire temperature of the solid phase down to K Romao et al. (2015), X-ray diffraction Aleksandrov et al. (2009); Greve et al. (2010) and Raman spectroscopy Aleksandrov et al. (2009) results have revealed that ScF3 undergoes several pressure-induced phase transitions. The first is from cubic to rhombohedral (-) after GPa at =300K, with a subsequent rhombohedral to orthorhombic transition occurring above GPa. The - transition has an observed pressure dependence of K/GPa Greve et al. (2010); Aleksandrov et al. (2009, 2011). Measurement of the lattice dynamics and the soft mode responsible for the rhombohedral transition were performed using inelastic x-ray scattering (IXS), which revealed a 1D manifold of soft optical phonons that circumscribe the entire cubic Brillouin zone-edge. At room temperature, this manifold of modes along - have energy meV, softening nearly uniformly to meV at cryogenic temperatures (see Figure 6b) Handunkanda et al. (2015). The IXS results combined with structural data permit an estimation that pressures as small as GPa would be sufficient to drive the transition to 0 K. The sensitivity of the phase boundary suggests that the nature of the cubic phase is delicate at low temperature and has been shown to be susceptible to even mild perturbations Morelock et al. (2013b, 2014, 2015), implying that the ground state of this ionic insulator lie in close proximity to a SQPT.
Phase stability and thermal expansion effects in the open-perovskite trifluoride structure have also been investigated thoroughly through chemical substitution. Chemical substitutions of Sc by Ti Morelock et al. (2014), Al Morelock et al. (2015), and Y Morelock et al. (2013b) have been reported and the effects of this compositional disorder will be discussed in detail in Sec. IV and V. Other investigations of changing the stoichiometry have resulted in a related class of hexafluoride compounds, one of which is CaZrF6. This material has space group symmetry and is related to the structure of ReO3 but with a staggered -site ion; that is, alternating CaF6 and ZrF6 octahedra tiling a simple cubic point-group structure. The resultant () pattern is likely a key feature when attempting to relate these materials, and is in particular likely to impact the (simple cubic) - BZ edge mode dispersion and dimensional reduction observed in ScF3 Handunkanda et al. (2015). Compared to ScF3, this system has isotropic NTE of larger magnitude ppm/K over a temperature range (Figure 5). At the system also remains cubic at all temperatures above K but a pressure-induced transition to a disordered state occurs near GPa Hancock et al. (2015), closer in the - diagram than the - transition in ScF3 ( GPa ) Greve et al. (2010); Aleksandrov et al. (2003, 2009). Early computational work suggests the manifold in the cubic BZ for this compound contribute most strongly to NTE Gupta et al. (2018), but inelastic scattering measurements of the phonon dynamics are needed to assess the influence of the staggered substitution on the critical SNTE dynamics.
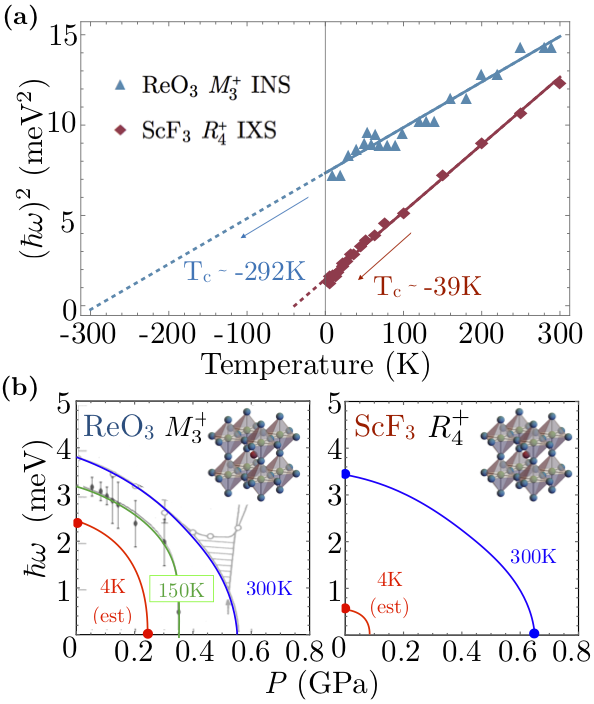
The open-perovskites presented above demonstrate this frameworks’ favorable environment for harboring SNTE, but begs the question of why most other purely stoichiometric transition metal trifluorides and perovskites show more conventional thermal expansion. The lattice parameters of each of these SNTE perovskites are plotted in comparison to the prototypical SNTE material ZrW2O8 in Figure 5, which gives a clear ranking of SNTE perovskites by the magnitude of the NTE effect ((1) CaZrF6, (2) ScF3, (3) ReO3). This ranking is the opposite ordering one gets in terms of pressure required to induce the structural phase transition nearest ambient conditions, a correlation suggestive that proximity to a SQPT and strength of NTE are interrelated. We demonstrate this point for ReO3 and ScF3 in Figure 6. These plots consider the soft-mode in each system, the phonon in ReO3 and the in ScF3 and the available data for the energy of these modes as a function of pressure and temperature. First considering the -dependent data at in Figure 6a, extrapolation of the squared mode energies by Eq. 1 provides a quantitative measure of the proximity to a dynamically-driven SPT, yielding K in ReO3 Chatterji et al. (2009b) and K in ScF3 Handunkanda et al. (2015). Furthermore, isothermal measurements of the soft-mode energy versus hydrostatic pressure are provided in Figure 6b, showing that decreasing temperature and increasing pressure in both systems trend towards a QCP.
Together, the results of these data clearly show in all respects that ScF3 is closer to a SQPT than ReO3. Although data at this level in unavailable for CaZrF6, the amorphization boundary at GPa and K is a lower pressure threshold for the pressure-induced transitions at K in both ReO3 ( GPa) and ScF3 ( GPa). It is thus likely that ground-state of this compound is the closest to a structural instability at cryogenic temperature, while also exhibiting the most superlative SNTE effect in this class. Our central hypothesis in the context of the materials described is that the K termination of a structural phase boundary defines a structural quantum critical point (SQCP) where strong geometrical fluctuations associated with octahedral tilts drives NTE. In our view, the significance of the SQCP is a flattening of the energy landscape with respect to transverse fluctuation of the linkage unit: O in ReO3, and F in ScF3 and CaZrF6. It is worth noting that NTE arising from phase fluctuations and the displacements of a low- soft-mode is not unique to the antiferrodistortive (zone-boundary) phonons in perovskites, but has also predicted SNTE in materials with broadly distinct structures and geometrical motifs, e.g. the Hg dimer in Hg2I2 Occhialini et al. (2017), the CN molecule in Prussian blue analogs and related compoundsGoodwin et al. (2008); Fairbank et al. (2012); Mittal et al. (2009).
NTE is often understood through the response of the phonon spectrum to the application of hydrostatic pressure, which has been formalized in the quasi-harmonic approximation (QHA) known as the Grüneisen approach Ashcroft and Mermin (1976). Each phonon in the Brillouin zone of frequency and wavevector is assigned a mode Grüneisen parameter , defined as,
| (2) |
where is the isothermal compressibility. Performing an average over all , weighted by the mode contribution to the heat capacity , gives the overall lattice Grüneisen constant which is thermodynamically proportional to the volumetric thermal expansion for isotropic materials. At low-temperatures, the thermodynamic properties are dominated by contributions from the lowest energy excitations. If the low-energy phonon spectrum has large magnitude, negative mode Grüneisen parameters (negative contributions to CTE), then the -averaged CTE will decrease as temperature is lowered. If strong enough to overcome the many high-energy excitations commonly attributed to conventional PTE, the overall expansion may turn negative in sign, strengthening at lower temperature, which is the typical functional form among the SNTE perovskites (Figure 5), before relaxing and limiting to a thermodynamically-required as K. From this viewpoint, soft-modes with NTE contributions are natural candidates for inducing overall NTE, since their energy softens with lowering temperature, enhancing the mode occupation and weighted contributions to the thermodynamics at low- in comparison to thermally-stable low energy excitations.
In the SNTE perovskites and other SNTE materials like ZrW2O8, these lowest energy lattice excitations are commonly attributed to quasi-rigid dynamics of polyhedral subunits Dove and Fang (2016), i.e. the geometrically rigid octahedra as shown in Figure 2 which could correspond to octahedra in ScF3, ReO3 or CaZrF6. These rigid unit mode (RUM) analyses model rigidity by freezing out portions of the phonon spectrum, such as high-energy bond-stretch and internal polyhedral bond-bend modes that are commonly attributed to causing PTE. For ScF3 and ReO3, the antiferrodistortive, zone-edge soft modes have an interpretation as RUMs. Moving beyond the commonly employed QHA and Landau mean-field approaches, we make the hypothesized relationship among soft RUMs, phase fluctuations and the development of SNTE precise within a systematic model in Sec. IV below.
IV Theory of SNTE from RUM Fluctuations
The purpose of this section is to present a microscopic description of NTE arising from soft modes in ReO3-type lattice structures. Such modes break the symmetry of the lattice and lead to displacive structural phase transitions Giddy et al. (1993). Typical examples are the mode at the point of the Brillouin zone of the cubic (c) phase in MF3 (M=Sc, Al, Cr, V, Fe, Ti) metal fluorides which upon condensation gives rise to a rhombohedral (r) lattice structure and the mode at in ReO3 which generates a tetragonal () phase.
The structural transitions observed in these materials are generally described by Landau theories Axe et al. (1985); Corrales-Salazar et al. (2017). Typically, they include an order parameter (OP) associated with cooperative tilts of a rigid unit (e.g. the MF6 octahedron in the metal fluorides) coupled to long-wavelength acoustic phonons that generate volume, deviatoric and shear strains. While such mean field theories provide a fair description of the structural transitions, they fail to describe NTE, e.g., they predict zero thermal expansion in their high- cubic phase.
Here, we present a microscopic phenomenology that describes NTE in these open perovskite frameworks. The model includes the usual rigid tilts coupled to long-wavelength strain-generating acoustic modes as well as a cooperative interaction between tilts that drives the structural transition, e.g., dipolar interactions in the metal trifluorides Chen et al. (2004); Chaudhuri et al. (2004); Allen et al. (2006). Our main result is that any solution of the model must include fluctuations of the OP to generate NTE. We illustrate this within a so-called self-consistent phonon approximation (SCPA) in which single site fluctuations are considered while inter-site fluctuations are neglected. This point has been appreciated before Volker et al. (2004), however, no systematic approach has been constructed so far. In addition, our model allow us to parametrize measured macroscopic quantities in terms of microscopic parameters, which provides guidance for materials design. Our model closely follows those of the well-known antiferrodistortive transitions of SrTiO3 and LaAlO3 Feder and Pytte (1970), with the important distinction that we include hydrostatic pressure and account for compositional disorder. The latter is aimed at describing compounds with tunable NTE through composition such as mixed solid solutions of metal triflurides Morelock et al. (2014, 2015, 2013a). For concreteness, we will consider a c-r transition similar to that in ScxTi1-xF3 in which the threefold zone-boundary phonon splits into a low-energy doublet and a high energy singlet at a transition temperature Daniel et al. (1990).
Our model analysis is by no means exhaustive. More elaborate descriptions that go beyond the picture of rigid tilts involving, for instance, distortions and translations of such building units are usually needed to describe the observed TE Li et al. (2011). Also the observed structural transitions are frequently of first-order, which we do not consider here for the sake of simplicity. Nonetheless, our semi-analytic approach accounts for microscopic aspects of the phonon dynamics and its relation to NTE and help in finding general trends of the solution. Moreover, it provides the basis to build other frameworks that capture atomistic details such as first-principles-based effective model Hamiltonians Rabe et al. (2007).
IV.1 Model Hamiltonian
We consider a cubic lattice with sites and choose normal mode coordinates in the unit cell associated with the mode, the condensation of which leads to the rhombohedral phase. is proportional to the local displacements generated by the cooperative tilts of the MF6 octahedra. In addition, we introduce the strain tensor in Voigt notation , in unit cell , which is induced by displacements of the centers of mass of the unit cells with respect to the acoustic-branch phonons. In order to determine the optical phonon contribution to the thermal expansion, we must couple the displacements with strains , leading to a 3-term Hamiltonian of the form,
| (3) |
Here, accounts for harmonic and anharmonic energy contributions from the soft optical phonon up to quartic order in ; is the strain-induced energy depending on the elasticity through the bulk modulus , shear moduli and hydrostatic pressure ; and models the coupling between these displacements and strain degrees of freedom with the coupling constant between the displacements and the volume strain. The explicit form of these terms is given in the supplementary material (SM). To solve the statistical mechanical problem posed by the Hamiltonian in Eq. 3, we use a variational formulation of a SCPA, in which the temperature and pressure dependence of the phonon energies , displacements, strain order parameters and phase fluctuations are determined self-consistently from the minimization of the free energy Pytte (1972). We here focus on the main results. The details of the model Hamiltonian and its approximate solution are given in the SM.
IV.2 Thermal expansion, CTE, and Grüneisen parameters.
We first focus on the volume strain , which gives the change in volume with temperature and pressure with respect to a reference volume . We use the notation to denote thermal average. By minimizing the free energy associated with the Hamiltonian in Eq. 3, we find that the volume strain is given as follows,
| (4) |
where is the thermal average of the squared magnitude of the MF6 tilt. Eq. 4 already illustrates one of the the main points of our work: in a mean-field theory and in the absence of pressure, above ; thus fluctuations around the OP must be included to describe NTE. For instance, within the SCPA and for temperatures much greater than the phonon energy, we find that in the cubic phase and Eq. 4 gives,
| (5) |
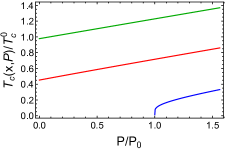
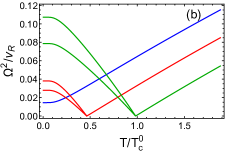
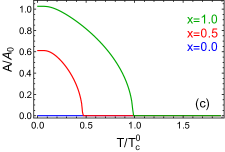
where is the CTE at high temperatures and is the strength of the cooperative interaction. Figures 7 (a) and (b) show, respectively, our results for the volume change obtained from Eq. 4 and its CTE ( ) in the full temperature range. Model parameters were obtained by fitting to experiments Handunkanda et al. (2015); Morelock et al. (2014) and are given in the SM. Despite its simplicity, our model produces the observed trends Morelock et al. (2014); Handunkanda et al. (2015): NTE with a nearly linear dependence in the c-phase, except near K; PTE in the r-phase; and a discontinuity in at the phase transition. Quantitatively, the model is in good agreement in the c-phase, but is about and order of magnitude less than the observed one in the r-phase. We attribute this to having neglected the first-order character of the transition and additional phonons along the M-R line of the BZ which are known to contribute to the NTE van Roekeghem et al. (2016).
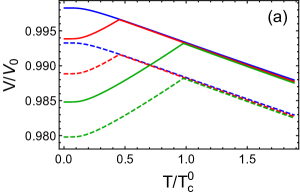
We note that Eq. 5 gives in terms of the microscopic model parameters. It shows that mechanically compliant materials with low bulk moduli () and strong strain-phonon couplings () favor thermal expansion. also increases by weakening the strength of the cooperative interaction at the expense of decreasing the transition temperatures since , as it is shown in the SM. It also shows that the sign of this coupling plays an essential role in the thermal expansion: for NTE while for PTE.
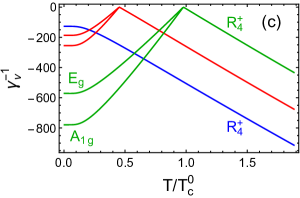
Another physically relevant quantity is the the Grüneisen parameter associated with each lattice mode . We find that the temperature and pressure dependence of is entirely determined by the phonon energy ,
| (6) |
and thus diverges near the c-r transition as . This is in agreement with previous analytic work Volker et al. (2004) and ab-initio calculations, where large, negative values for have been found for ScF3 van Roekeghem et al. (2016); Liu et al. (2015); Li et al. (2011). Figure 7 (b) shows that at the onset of the phase transition for and thus matches the result from Landau theory. For , there is no transition and the deviations from linear behavior are due to zero-point fluctuations.
V The Role of Disorder in Perovskite SNTE materials
Disorder is an inevitable part of any real material system. Here we discuss and develop the role of disorder in on the SNTE effect within the open perovskite structural class.
ReO3 has been known as a SNTE material for many years, but there are varying reports of the strength and also extent in temperature over which the effect occurs, which is summarized for recent data by Chatterji Chatterji and McIntyre (2006); Chatterji et al. (2009a) and Rodriguez Rodriguez et al. (2009) in Figure 5 inset. Generally, “open” perovskite oxides are rare due to the requirement of a hexavalent -site and controlled substitutional studies have not been reported to our knowledge. However, the controlled disorder study by Rodriguez Rodriguez et al. (2009) compared crystals synthesized using different growth techniques and clearly showed that the highest quality crystals grown by chemical vapor transport method exhibited the largest and most thermally persistent SNTE effect. As with the physical properties of many perovskite oxides, controlled post-growth annealing procedure studies may be need to be developed to ensure the optimal NTE effect even in studies of its fundamental causes.
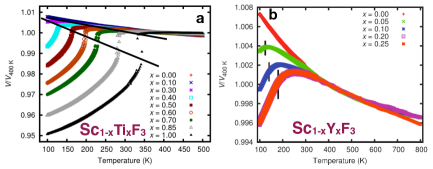
ScF3 is an unusually clean material - single crystals have been synthesized with 0.002 degree mosaic Handunkanda et al. (2016), free of color centers, with high chemical and isotopic purity with readily available components. The flexibility afforded by the trivalent -site in the trifluorides permits wide chemical tunability and provides new opportunities to observe disorder effects on SNTE. So far, the most thorough and complete studies of the substitutional series ScF3 have been performed with high inorganic synthesis and high quality structural synchrotron and neutron scattering efforts of the Wilkinson group at Georgia Tech. In a series of papers Morelock et al. (2013a, 2014, 2015), substitutions of =Al,Y,Ti have been reported, particularly the behavior of the cubic-to-rhombohedral phase boundary in this system upon these isovalent substitutions (Figures 8 and 9a). Here we develop a combined analysis of these data which permits conclusions regarding the interaction of disorder and the SNTE effect.
Following the spirit of Attfield, who has studied compositional disorder effects on the -site of transition metal oxide phase transitions Attfield (1998, 2001, 2002), we borrow the hypothesis that the ionic radius of the substituted ions represents a local energetic influence on the stability of the ordered phase and discuss in our case the probability distribution of finding a -site ion of radius in the series ScF3. We calculate the first two moments of this distribution and associate the mean ionic radius (1st moment) to an energetic effect on the transition and the variance (2nd moment) of the distribution as representative of disorder. For the simple binary distributions shown in Figure 9c, these quantities are simply calculated from the nominal composition F3:
| (7) | |||||
| (8) | |||||
| (9) |
These relations are general for any binary mixture, and are applied for =Sc and =Y,Al,Ti in Figure 9b using the Shannon ionic radius for these trivalent ions. Appropriately, is zero for the endpoints of the compositional series and is maximum at the 50-50 composition as expected in all cases. Note that for =Ti, the ion best size matched to Sc, this maximum is small and the effects of disorder are expected to be weaker than for other substitutions, whereas for the much larger Y and much smaller Al ions, disorder increases substantially throughout these series. Further, substitutions of Y have opposite effects on than substitutions of Ti and Al, therefore the three substitutional series cover well the transition in terms of both energetics and disorder.
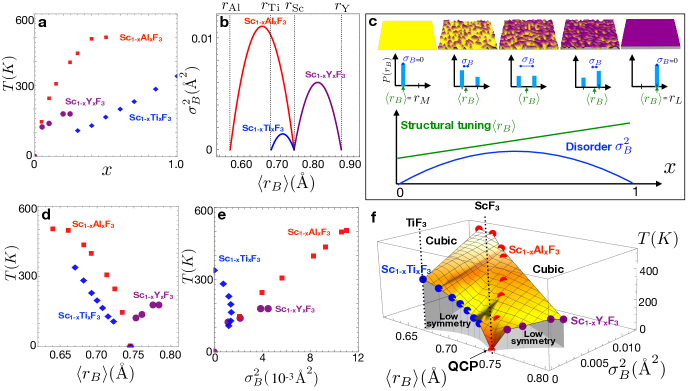
Figures 9d,e show the transition temperatures plotted as a function of and . There is not a clear common trend in either plot, except that the Y and Al substitution series are linear in , implying that quenched disorder is the dominant contribution toward driving the transition, as we have pointed out previously Handunkanda et al. (2015). For the substitution =Ti, the transition temperature is linear in , suggesting a dominantly energetic effect, as hypothesized based on its similar size and treated theoretically in the weak-disorder limit of the last section. Figure 9f shows a combined plot of all three series =Ti,Al,Y as a function of the structural tuning parameter and the disorder parameter . This generalized disorder-energy analysis unifies the compositional dependencies of three different series with important implications, showing that disorder is deleterious to SNTE and that ScF3 is situated in a very special place which is difficult to reach in the presence of any disorder. These conclusions and the known variation in the SNTE effect of ReO3 indicate that disorder generally suppresses the SNTE effect and that careful work optimizing this property with respect to sample history may be necessary in some cases.
ScF3 has the most dramatic SNTE effect of all members of these series and also appears at a QCP in the diagram of Figure 9f. Figure 8 reproduces the figure panels for thermal expansion in each series and shows that strong SNTE persists above the transition for light substitutional levels, but weakens in all cases. We point out that no known materials exist in the large , small limit, but if such a composition could be produced, would be of high interest toward exploring the robustness of SNTE to disorder. Furthermore, routine structural refinement experiments performed at liquid helium temperatures would help immensely toward refining the QCP in these systems where SNTE seems to arise near the =0 termination of a structural phase boundary.
VI Summary
We have discussed the broad issue of SNTE with particular focus on perovskite-structured SNTE materials. We have identified the presence of several competing octahedral tilt instabilities occurring near the zero-temperature state of these materials and their associated fluctuations in the high-symmetry phase as key to the SNTE effect in these materials. We have provided a model treatment beyond mean field theory to account for these fluctuations and identified key elements that move toward control of negative thermal expansion and may be invoked for rational design and discovery of future SNTE systems. We also find that quantum mechanical effects are non-negligible and play an important role in SNTE. Finally, we have described existing data in a new analysis which attempts to isolate the influences of energetics and disorder and presented a holistic and generalizable approach leading to the conclusion that disorder disrupts the balance which drives the SNTE effect in ScF3, ReO3, and other SNTE materials. Our thorough combined analysis of the physical properties and special circumstances in this simple structural class has identified trends and influences that we hope will guide discovery of new SNTE materials.
Conflict of Interest Statement
The authors declare that the research was conducted in the absence of any commercial or financial relationships that could be construed as a potential conflict of interest.
Author Contributions
CAO, SUH and JNH wrote sections 1-3 and 5. GGGV developed the modeling in section 4 and the SM. All authors contributed to writing and revising the manuscript and figures.
Funding
Work at the University of Connecticut was provided by National Science Foundation Award No. DMR-1506825 with additional support from the US Department of Energy, Office of Science, Office of Basic Energy Sciences, under Award No. DE-SC0016481. Work at the University of Costa Rica is supported by the Vice-rectory for Research under project no. 816-B7-601, and work at Argonne National Laboratory is supported by the U.S. Department of Energy, Office of Basic Energy Sciences, Material Sciences and Engineering Division under contract no. DE-AC02-06CH11357.
Acknowledgments
The authors would like to acknowledge valuable conversations with Peter Littlewood, Richard Brierley, Premala Chandra, and Alexander Balatsky. GGGV acknowledges Churchill College, the Department of Materials Science and Metallurgy and the Cavendish Laboratory at the University of Cambridge where part of this work was done.
References
- Ashcroft and Mermin (1976) N. W. Ashcroft and N. David Mermin, Solid State Physics (Holt, Rinehart and Winston, 1976).
- Barrera et al. (2005) G D Barrera, J A O Bruno, T H K Barron, and N L Allan, “Negative thermal expansion,” Journal of Physics: Condensed Matter 17, R217–R252 (2005).
- Miller et al. (2009) W. Miller, C. W. Smith, D. S. Mackenzie, and K. E. Evans, “Negative thermal expansion: a review,” Journal of Materials Science 44, 5441–5451 (2009).
- Takenaka et al. (2012) K. Takenaka, T. Hamada, D. Kasugai, and N. Sugimoto, “Tailoring thermal expansion in metal matrix composites blended by antiperovskite manganese nitrides exhibiting giant negative thermal expansion,” Journal of Applied Physics 112, 083517 (2012).
- Prager and Heidemann (1997) M. Prager and A. Heidemann, “Rotational Tunneling and Neutron Spectroscopy: A Compilation,” Chemical Reviews 97, 2933–2966 (1997).
- Hancock et al. (2004a) Jason Hancock, Tim McKnew, Zack Schlesinger, John Sarrao, and Zach Fisk, “Kondo Scaling in the Optical Response of YbIn1-xAgxCu4,” Physical Review Letters 92, 186405 (2004a).
- Guillaume (1920) C E Guillaume, “The Nobel Prize in physics, 1920: Invar alloys,” Stockholm, Sweden: Royal Swedish Academy of Sciences , 1–16 (1920).
- Azuma et al. (2011) Masaki Azuma, Wei-tin Chen, Hayato Seki, Michal Czapski, Smirnova Olga, Kengo Oka, Masaichiro Mizumaki, Tetsu Watanuki, Naoki Ishimatsu, Naomi Kawamura, Shintaro Ishiwata, Matthew G Tucker, Yuichi Shimakawa, and J Paul Attfield, “Colossal negative thermal expansion in BiNiO3 induced by intermetallic charge transfer,” Nature communications 2, 347 (2011).
- Takenaka and Takagi (2005) K. Takenaka and H. Takagi, “Giant negative thermal expansion in Ge-doped anti-perovskite manganese nitrides,” Applied Physics Letters 87, 261902 (2005).
- Qu et al. (2012) BY Qu, HY He, and BC Pan, “Origin of the Giant Negative Thermal Expansion in Mn3(Cu0.5Ge0.5)N,” Advances in Condensed Matter Physics 2012, 4903–4906 (2012).
- Chen et al. (2013a) Jun Chen, Longlong Fan, Yang Ren, Zhao Pan, Jinxia Deng, Ranbo Yu, and Xianran Xing, “Unusual Transformation from Strong Negative to Positive Thermal Expansion in PbTiO3-BiFeO3 Perovskite,” Physical Review Letters 110, 115901 (2013a).
- Chen et al. (2013b) Jun Chen, Fangfang Wang, Qingzhen Huang, Lei Hu, Xiping Song, Jinxia Deng, Ranbo Yu, and Xianran Xing, “Effectively control negative thermal expansion of single-phase ferroelectrics of PbTiO3-(Bi,La)FeO3 over a giant range.” Scientific reports 3, 2458 (2013b).
- Takenaka (2018) Koshi Takenaka, “Progress of Research in Negative Thermal Expansion Materials: Paradigm Shift in the Control of Thermal Expansion,” Frontiers in Chemistry 6, 267 (2018).
- Mary et al. (1996) T. A. Mary, J. S. O. Evans, T. Vogt, and A. W. Sleight, “Negative Thermal Expansion from 0.3 to 1050 Kelvin in ZrW2O8,” Science 272, 90–92 (1996).
- Evans et al. (1997a) JSO Evans, TA Mary, and AW Sleight, “Negative thermal expansion in a large molybdate and tungstate family,” Journal of Solid State Chemistry 275, 61–65 (1997a).
- Evans et al. (1997b) JSO Evans, Z Hu, JD Jorgensen, and DN Argyriou, “Compressibility, phase transitions, and oxygen migration in zirconium tungstate, ZrW2O8,” Science 132, 15496–15498 (1997b).
- Pryde et al. (1997) Alexandra K.A. Pryde, Kenton D. Hammonds, Martin T. Dove, Volker Heine, Julian D. Gale, and Michele C. Warren, “Rigid unit modes and the negative thermal expansion in ZrW2O8,” Phase Transitions 61, 141–153 (1997).
- Perottoni and Jornada (1998) CA Perottoni and JAH Da Jornada, “Pressure-induced amorphization and negative thermal expansion in ZrW2O8,” Science 280, 886–889 (1998).
- Ramirez and Kowach (1998) A. Ramirez and G. Kowach, “Large Low Temperature Specific Heat in the Negative Thermal Expansion Compound ZrW2O8,” Physical Review Letters 80, 4903–4906 (1998).
- Ernst et al. (1998) G Ernst, C Broholm, GR Kowach, and AP Ramirez, “Phonon density of states and negative thermal expansion in ZrW2O8,” Nature 583, 580–583 (1998).
- Ramirez et al. (2000) A.P Ramirez, C.L Broholm, R.J Cava, and G.R Kowach, “Geometrical frustration, spin ice and negative thermal expansion – the physics of underconstraint,” Physica B: Condensed Matter 280, 290–295 (2000).
- Mittal et al. (2001) R. Mittal, S. Chaplot, H. Schober, and T. Mary, “Origin of Negative Thermal Expansion in Cubic ZrW2O8 Revealed by High Pressure Inelastic Neutron Scattering,” Physical Review Letters 86, 4692–4695 (2001).
- Cao et al. (2002) D. Cao, F. Bridges, G. Kowach, and A. Ramirez, “Frustrated Soft Modes and Negative Thermal Expansion in ZrW2O8,” Physical Review Letters 89, 215902 (2002).
- Ouyang et al. (2002) Lizhi Ouyang, Yong-Nian. Xu, and W. Ching, “Electronic structure of cubic and orthorhombic phases of ZrW2O8,” Physical Review B 65, 113110 (2002).
- Cao et al. (2003) D Cao, F Bridges, GR Kowach, and AP Ramirez, “Correlated atomic motions in the negative thermal expansion material ZrW2O8: A local structure study,” Physical Review B 79, 184302 (2003).
- Drymiotis et al. (2004) F. Drymiotis, H. Ledbetter, J. Betts, T. Kimura, J. Lashley, A. Migliori, A. Ramirez, G. Kowach, and J. Van Duijn, “Monocrystal Elastic Constants of the Negative-Thermal-Expansion Compound Zirconium Tungstate (ZrW2O8),” Physical Review Letters 93, 025502 (2004).
- Mittal et al. (2004) R. Mittal, S. L. Chaplot, H. Schober, A. I. Kolesnikov, C.-K. Loong, C. Lind, and A. P. Wilkinson, “Negative thermal expansion in cubic ZrMo2O8: Inelastic neutron scattering and lattice dynamical studies,” Physical Review B 70, 214303 (2004).
- Hancock et al. (2004b) Jason Hancock, Chandra Turpen, Zack Schlesinger, Glen Kowach, and Arthur Ramirez, “Unusual Low-Energy Phonon Dynamics in the Negative Thermal Expansion Compound ZrW2O8,” Physical Review Letters 93, 225501 (2004b).
- Tucker et al. (2005) Matthew Tucker, Andrew Goodwin, Martin Dove, David Keen, Stephen Wells, and John Evans, “Negative Thermal Expansion in ZrW2O8: Mechanisms, Rigid Unit Modes, and Neutron Total Scattering,” Physical Review Letters 95, 255501 (2005).
- Kennedy and White (2005) CA Kennedy and MA White, “Unusual thermal conductivity of the negative thermal expansion material, ZrW2O8,” Solid state communications 134, 271–276 (2005).
- Pantea et al. (2006) C. Pantea, A. Migliori, P. Littlewood, Y. Zhao, H. Ledbetter, J. Lashley, T. Kimura, J. Van Duijn, and G. Kowach, “Pressure-induced elastic softening of monocrystalline zirconium tungstate at 300K,” Physical Review B 73, 214118 (2006).
- Keen et al. (2007) David Keen, Andrew Goodwin, Matthew Tucker, Martin Dove, John Evans, Wilson Crichton, and Michela Brunelli, “Structural Description of Pressure-Induced Amorphization in ZrW2O8,” Physical Review Letters 98, 225501 (2007).
- Tucker et al. (2007) Matthew G Tucker, David A Keen, John S O Evans, and Martin T Dove, “Local structure in ZrW2O8 from neutron total scattering,” Journal of physics. Condensed matter 19, 335215 (2007).
- Figueirêdo and Perottoni (2007) C. Figueirêdo and C. Perottoni, “B3LYP density functional calculations on the ground-state structure, elastic properties, and compression mechanism of -ZrW2O8,” Physical Review B 75, 184110 (2007).
- Schlesinger et al. (2008) Z. Schlesinger, J. A. Rosen, J. N. Hancock, and A. P. Ramirez, “Soft Manifold Dynamics behind Negative Thermal Expansion,” Physical Review Letters 101, 015501 (2008).
- Keen et al. (2011) David A. Keen, Andrew L. Goodwin, Matthew G. Tucker, Joseph A. Hriljac, Thomas D. Bennett, Martin T. Dove, Annette K. Kleppe, Andrew P. Jephcoat, and Michela Brunelli, “Diffraction study of pressure-amorphized ZrW2O8 using in situ and recovered samples,” Physical Review B 83, 064109 (2011).
- Gallington et al. (2013) Leighanne C Gallington, Karena W Chapman, Cody R Morelock, Peter J Chupas, and Angus P Wilkinson, “Orientational order-dependent thermal expansion and compressibility of ZrW2O8 and ZrMo2O8,” Physical chemistry chemical physics : PCCP 15, 19665–72 (2013).
- Gupta et al. (2013) M. K. Gupta, R. Mittal, and S. L. Chaplot, “Negative thermal expansion in cubic ZrW2O8: Role of phonons in the entire Brillouin zone from ab initio calculations,” Physical Review B 88, 014303 (2013).
- Gallington et al. (2014) Leighanne C. Gallington, Karena W. Chapman, Cody R. Morelock, Peter J. Chupas, and Angus P. Wilkinson, “Dramatic softening of the negative thermal expansion material HfW2O8 upon heating through its WO4 orientational order-disorder phase transition,” Journal of Applied Physics 115, 053512 (2014).
- Bridges et al. (2014) F. Bridges, T. Keiber, P. Juhas, S. J. L. Billinge, L. Sutton, J. Wilde, and Glen R. Kowach, “Local Vibrations and Negative Thermal Expansion in ZrW2O8,” Physical Review Letters 112, 045505 (2014).
- Sanson (2014) Andrea Sanson, “Toward an Understanding of the Local Origin of Negative Thermal Expansion in ZrW2O8: Limits and Inconsistencies of the Tent and Rigid Unit Mode Models,” Chemistry of Materials 26, 3716–3720 (2014).
- Greve et al. (2010) Benjamin K Greve, Kenneth L Martin, Peter L Lee, Peter J Chupas, Karena W Chapman, and Angus P Wilkinson, “Pronounced negative thermal expansion from a simple structure: cubic ScF3,” Journal of the American Chemical Society 132, 15496–8 (2010).
- Morelock et al. (2013a) Cody R. Morelock, Benjamin K. Greve, Leighanne C. Gallington, Karena W. Chapman, and Angus P. Wilkinson, “Negative thermal expansion and compressibility of Sc1-xYxF3 (),” Journal of Applied Physics 114, 213501 (2013a).
- Martinek and Hummel (1968) Charles Martinek and F. A. Hummel, “Linear Thermal Expansion of Three Tungstates,” Journal of the American Ceramic Society 51, 227–228 (1968).
- Zhou et al. (2008) W. Zhou, H. Wu, T. Yildirim, J. Simpson, and A. Walker, “Origin of the exceptional negative thermal expansion in metal-organic framework-5 Zn4O(1,4-benzenedicarboxylate)3,” Physical Review B 78, 054114 (2008).
- Han and Goddard (2007) Sang Soo Han and William A. Goddard, “Metal–Organic Frameworks Provide Large Negative Thermal Expansion Behavior,” The Journal of Physical Chemistry C 111, 15185–15191 (2007).
- Lee et al. (2005) Kwanghee Lee, Reghu Menon, C. Yoon, and A. Heeger, “Direct observation of a transverse vibrational mechanism for negative thermal expansion in Zn(CN)2: an atomic pair distribution function analysis.” Journal of the American Chemical Society 127, 15630–6 (2005).
- Mittal et al. (2018) R. Mittal, M.K. Gupta, and S.L. Chaplot, “Phonons and anomalous thermal expansion behaviour in crystalline solids,” Progress in Materials Science 92, 360–445 (2018).
- Kowach and Ramirez (2002) Glen R. Kowach and A. P. Ramirez, Handbook of Materials Selection (John Wiley & Sons, Inc., New York, 2002).
- Fleming et al. (1997) D.A. Fleming, D.W. Johnson, and P.J. Lemaire, “A Temperature Compensated Optical Fiber Refractive Index Grating,” (1997).
- Balch and Dunand (2004) Dorian K. Balch and David C. Dunand, “Copper-zirconium tungstate composites exhibiting low and negative thermal expansion influenced by reinforcement phase transformations,” Metallurgical and Materials Transactions A 35, 1159–1165 (2004).
- De Buysser et al. (2004) Klaartje De Buysser, Petra Lommens, Christy De Meyer, Els Bruneel, Serge Hoste, and Isabel Van Driessche, “ZrO2-ZrW2O8 composites with tailor-made thermal expansion,” Ceramics-Silikaty 48, 139–144 (2004).
- Lommens et al. (2005) P. Lommens, C. De Meyer, E. Bruneel, K. De Buysser, I. Van Driessche, and S. Hoste, “Synthesis and thermal expansion of ZrO2/ZrW2O8 composites,” Journal of the European Ceramic Society 25, 3605–3610 (2005).
- Sullivan and Lukehart (2005) Lisa M. Sullivan and Charles M. Lukehart, “Zirconium Tungstate (ZrW2O8)/Polyimide Nanocomposites Exhibiting Reduced Coefficient of Thermal Expansion,” Chemistry of Materials 17, 2136–2141 (2005).
- Lind et al. (2011) Cora Lind, Maria R. Coleman, Leah C. Kozy, and Gayathri R. Sharma, “Zirconium tungstate/polymer nanocomposites: Challenges and opportunities,” Physica Status Solidi B 248, 123–129 (2011).
- Ravindran et al. (2001) T R Ravindran, Akhilesh K Arora, and T A Mary, “High-pressure Raman spectroscopic study of zirconium tungstate,” Journal of Physics-Condensed Matter 13, 11573–11588 (2001).
- Dove and Fang (2016) Martin T Dove and Hong Fang, “Negative thermal expansion and associated anomalous physical properties: review of the lattice dynamics theoretical foundation,” Reports on Progress in Physics 79, 066503 (2016).
- Rodriguez et al. (2009) Efrain E. Rodriguez, Anna Llobet, Thomas Proffen, Brent C. Melot, Ram Seshadri, Peter B. Littlewood, and Anthony K. Cheetham, “The role of static disorder in negative thermal expansion in ReO3,” Journal of Applied Physics 105, 114901 (2009).
- Hancock et al. (2015) Justin C. Hancock, Karena W. Chapman, Gregory J. Halder, Cody R. Morelock, Benjamin S. Kaplan, Leighanne C. Gallington, Angelo Bongiorno, Chu Han, Si Zhou, and Angus P. Wilkinson, “Large Negative Thermal Expansion and Anomalous Behavior on Compression in Cubic ReO3 - Type ABF6 : CaZrF6 and CaHfF6,” Chemistry of Materials 27, 3912–3918 (2015).
- Kimura et al. (2002) T. Kimura, S. Ishihara, H. Shintani, T. Arima, K. T. Takahashi, K. Ishizaka, and Y. Tokura, “Distorted Perovskite with Configuration as a Frustrated Spin System,” Physical Review B 68, 060403 (2002), arXiv:0211568 [cond-mat] .
- Maekawa et al. (2004) S. Maekawa, T. Tohyama, S.E. Barnes, S. Ishihara, W. Koshibae, and G. Khaliullin, eds., Physics of Transition Metal Oxides (Springer-Verlag, 2004).
- Takagi et al. (2010) Shigeyuki Takagi, Alaska Subedi, David J. Singh, and Valentino R. Cooper, “Polar behavior of the double perovskites BiZnNbO6 ( Pb and Sr) from density-functional calculations,” Physical Review B 81, 134106 (2010).
- Ngai et al. (2014) J.H. Ngai, F.J. Walker, and C.H. Ahn, “Correlated oxide physics and electronics,” Annual Review of Materials Research 44, 1–17 (2014).
- Glazer (1972) A. M. Glazer, “The classification of tilted octahedra in perovskites,” Acta Crystallographica Section B Structural Crystallography and Crystal Chemistry 28, 3384–3392 (1972).
- Glazer and IUCr (1975) A. M. Glazer and IUCr, “Simple ways of determining perovskite structures,” Acta Crystallographica Section A 31, 756–762 (1975).
- Benedek and Fennie (2013) Nicole A. Benedek and Craig J. Fennie, “Why Are There So Few Perovskite Ferroelectrics?” The Journal of Physical Chemistry C 117, 13339–13349 (2013).
- Unoki and Sakudo (1967) Hiromi Unoki and Tunetaro Sakudo, “Electron Spin Resonance of Fe3+ in SrTiO3 with Special Reference to the 110K Phase Transition,” Journal of the Physical Society of Japan 23, 546–552 (1967).
- Cowley et al. (1969) R. A. Cowley, W. J.L. Buyers, and G. Dolling, “Relationship of normal modes of vibration of strontium titanate and its antiferroelectric phase transition at 110K,” Solid State Communications 7, 181–184 (1969).
- Cowley (1964) R. A. Cowley, “Lattice Dynamics and Phase Transitions of Strontium Titanate,” Physical Review 134 (1964), 10.1103/PhysRev.134.A981.
- Shirane and Yamada (1969) G. Shirane and Y. Yamada, “Lattice-dynamical study of the 110K phase transition in SrTiO3,” Physical Review 177, 858–863 (1969).
- Fleury et al. (1968) P. A. Fleury, J. F. Scott, and J. M. Worlock, “Soft phonon modes and the 110K phase transition in SrTiO3,” Physical Review Letters 21, 16–19 (1968), arXiv:arXiv:1011.1669v3 .
- Bell and Rupprecht (1963) R. O. Bell and G. Rupprecht, “Elastic constants of strontium titanate,” Physical Review 129, 90–94 (1963).
- Shirane (1974) G. Shirane, “Neutron scattering studies of structural phase transitions at Brookhaven,” Reviews of Modern Physics 46, 437–449 (1974).
- Cowley (1980) R.A. Cowley, “Structural phase transitions I. Landau theory,” Advances in Physics 29, 1–110 (1980).
- Scott (1974) J. F. Scott, “Soft-mode spectroscopy: Experimental studies of structural phase transitions,” Reviews of Modern Physics 46, 83–128 (1974).
- Halperin and Varma (1976) B. Halperin and C. Varma, “Defects and the central peak near structural phase transitions,” Physical Review B 14, 4030–4044 (1976).
- Topler et al. (1977) J Topler, B Alefeld, and A Heidemann, “Study of the central peak of SrTiO3 by neutron spectroscopy with high energy resolution,” Journal of Physics C: Solid State Physics 10, 635–643 (1977).
- Riste et al. (1993) T. Riste, E. J. Samuelsen, K. Otnes, and J. Feder, “Critical behaviour of SrTiO3 near the 105K phase transition,” Solid State Communications 88, 901–904 (1993).
- Sachdev and Keimer (2011) Subir Sachdev and Bernhard Keimer, “Quantum criticality,” Physics Today 64, 29–35 (2011), arXiv:1102.4628 .
- Coleman and Schofield (2005) Piers Coleman and Andrew J Schofield, “Quantum criticality,” Nature 433, 226–229 (2005).
- Gegenwart et al. (2008) Philipp Gegenwart, Qimiao Si, and Frank Steglich, “Quantum criticality in heavy-fermion metals,” Nature Physics 4, 186–197 (2008).
- Chatterji et al. (2009a) Tapan Chatterji, Thomas C. Hansen, Michela Brunelli, and Paul F. Henry, “Negative thermal expansion of ReO3 in the extended temperature range,” Applied Physics Letters 94, 241902 (2009a).
- Dapiaggi and Fitch (2009) Monica Dapiaggi and Andy N. Fitch, “Negative (and very low) thermal expansion in ReO3 from 5 to 300 K,” Journal of Applied Crystallography 42, 253–258 (2009).
- Handunkanda et al. (2015) Sahan U. Handunkanda, Erin B. Curry, Vladimir Voronov, Ayman H. Said, Gian G. Guzmán-Verri, Richard T. Brierley, Peter B. Littlewood, and Jason N. Hancock, “Large isotropic negative thermal expansion above a structural quantum phase transition,” Physical Review B 92, 134101 (2015).
- Axe et al. (1985) J. D. Axe, Y. Fujii, B. Batlogg, M. Greenblatt, and S. Di Gregorio, “Neutron scattering study of the pressure-induced phase transformation in ReO3,” Physical Review B 31, 663–667 (1985).
- Schirber and Morosin (1979) J. E. Schirber and B. Morosin, “”Compressibility Collapse” Transition in ReO3,” Physical Review Letters 42, 1485–1487 (1979).
- Jørgensen et al. (1986) J.-E. Jørgensen, J. Jorgensen, B. Batlogg, J. Remeika, and J. Axe, “Order parameter and critical exponent for the pressure-induced phase transitions in ReO3,” Physical Review B 33, 4793–4798 (1986).
- Jørgensen et al. (2004) J.-E. Jørgensen, W. G. Marshall, R. I. Smith, J. Staun Olsen, and L. Gerward, “High-pressure neutron powder diffraction study of the Im phase of ReO3,” Journal of Applied Crystallography 37, 857–861 (2004).
- Chatterji et al. (2009b) Tapan Chatterji, P. Freeman, M. Jimenez-Ruiz, R. Mittal, and S. Chaplot, “Pressure- and temperature-induced phonon softening in ReO3,” Physical Review B 79, 184302 (2009b).
- Romao et al. (2015) Carl P. Romao, Cody R. Morelock, Michel B. Johnson, J. W. Zwanziger, Angus P. Wilkinson, and Mary Anne White, “The heat capacities of thermomiotic ScF3 and ScF3–YF3 solid solutions,” Journal of Materials Science 50, 3409–3415 (2015).
- Aleksandrov et al. (2009) K. S. Aleksandrov, V. N. Voronov, A. N. Vtyurin, A. S. Krylov, M. S. Molokeev, M. S. Pavlovskiĭ, S. V. Goryaĭnov, A. Yu. Likhacheva, and A. I. Ancharov, “Pressure-induced phase transition in the cubic ScF3 crystal,” Physics of the Solid State 51, 810–816 (2009).
- Aleksandrov et al. (2011) K. S. Aleksandrov, N. V. Voronov, A. N. Vtyurin, A. S. Krylov, M. S. Molokeev, A. S. Oreshonkov, S. V. Goryainov, A. Yu. Likhacheva, and A. I. Ancharov, “Structure and lattice dynamics of the high-pressure phase in the ScF3 crystal,” Physics of the Solid State 53, 564–569 (2011).
- Morelock et al. (2013b) Cody R. Morelock, Benjamin K. Greve, Mehmet Cetinkol, Karena W. Chapman, Peter J. Chupas, and Angus P. Wilkinson, “Role of Anion Site Disorder in the Near Zero Thermal Expansion of Tantalum Oxyfluoride,” Chemistry of Materials 25, 1900–1904 (2013b).
- Morelock et al. (2014) C. R. Morelock, L. C. Gallington, and A. P. Wilkinson, “Evolution of negative thermal expansion and phase transitions in Sc1-xTixF3,” Chem. Mater. 26, 1936 (2014).
- Morelock et al. (2015) C. R. Morelock, L. C. Gallington, and A. P. Wilkinson, “Solid solubility, phase transitions, thermal expansion, and compressibility in Sc1-xAlxF3,” J. Solid State Chem. 222, 96 (2015).
- Aleksandrov et al. (2003) K. S. Aleksandrov, V. N. Voronov, A. N. Vtyurin, S. A. Goryainov, N. G. Zamkova, V. I. Zinenko, and A. S. Krylov, “Pressure-Induced Phase Transitions in ScF3 Crystal–Raman Spectra and Lattice Dynamics,” Ferroelectrics 284, 31–45 (2003).
- Gupta et al. (2018) M K Gupta, Baltej Singh, R Mittal, and S L Chaplot, “Negative Thermal Expansion Behaviour in ZrF6 ( Ca, Mg, Sr): Ab-initio Lattice Dynamical Studies,” arXiv (2018).
- Occhialini et al. (2017) Connor A Occhialini, Sahan U Handunkanda, Ayman Said, Sudhir Trivedi, G G Guzmán-Verri, and Jason N Hancock, “Negative thermal expansion near two structural quantum phase transitions,” Physical Review Materials 1, 070603(R) (2017).
- Goodwin et al. (2008) Andrew L Goodwin, Mark Calleja, Michael J Conterio, Martin T Dove, John S O Evans, David A Keen, Lars Peters, and Matthew G Tucker, “Colossal positive and negative thermal expansion in the framework material Ag3[Co(CN)6],” Science 319, 794–7 (2008).
- Fairbank et al. (2012) Vanessa E. Fairbank, Amber L. Thompson, Richard I. Cooper, and Andrew L. Goodwin, “Charge-ice dynamics in the negative thermal expansion material Cd(CN)2,” Physical Review B 86, 104113 (2012).
- Mittal et al. (2009) R. Mittal, S. L. Chaplot, and H. Schober, “Measurement of anharmonicity of phonons in the negative thermal expansion compound Zn(CN)2 by high pressure inelastic neutron scattering,” Applied Physics Letters 95, 201901 (2009).
- Giddy et al. (1993) A.P. Giddy, M.T. Dove, G.S. Pawley, and V. Heine, “The determination of rigid-unit modes as potential soft modes for displacive phase transitions in framework crystal structures,” Acta Crystallographica Section A: Foundations of Crystallography 49 (1993), 10.1107/S0108767393002545.
- Corrales-Salazar et al. (2017) A. Corrales-Salazar, R. T. Brierley, P. B. Littlewood, and G. G. Guzmán-Verri, “Landau theory and giant room-temperature barocaloric effect in F3 metal trifluorides,” Physical Review Materials 1, 053601 (2017).
- Chen et al. (2004) Y.-R. Chen, V. Perebeinos, and P. B. Allen, “Density-functional study of the cubic-to-rhombohedral transition in -AlF3,” Physical Review B 69, 054109 (2004).
- Chaudhuri et al. (2004) S. Chaudhuri, P. J. Chupas, M. Wilson, P. Madden, and C. P. Grey, “Study of the nature and mechanism of the rhombohedral-to-cubic phase transition in -AlF3 with molecular dynamics simulations,” J. Phys. Chem. B 108, 3437 (2004).
- Allen et al. (2006) P. Allen, Y.-R. Chen, S. Chaudhuri, and C. Grey, “Octahedral tilt instability of ReO3-type crystals,” Physical Review B 73, 172102 (2006).
- Volker et al. (2004) H. Volker, P. R. L. Welche, and M. T. Dove, “Geometrical origin and theory of negative thermal expansion in framework structures,” Journal of the American Ceramic Society 82, 1793 (2004).
- Feder and Pytte (1970) J. Feder and E. Pytte, “Theory of a structural phase transition in perovskite-type crystals. ii. interaction with elastic strain,” Physical Review B 1, 4803–4810 (1970).
- Daniel et al. (1990) P. Daniel, A. Bulou, M. Rousseau, J. Nouet, J. L. Fourquet, M. Leblanc, and R. Burriel, “A study of the structural phase transitions in AlF3: x-ray powder diffraction, differential scanning calorimetry (DSC) and Raman scattering investigations of the lattice dynamics and phonon spectrum,” J. Phys. Condens. Matter 2, 5663 (1990).
- Li et al. (2011) Chen W. Li, Xiaoli Tang, J. A. Muñoz, J. B. Keith, S. J. Tracy, D. L. Abernathy, and B. Fultz, “Structural Relationship between Negative Thermal Expansion and Quartic Anharmonicity of Cubic ScF3,” Physical Review Letters 107, 195504 (2011).
- Rabe et al. (2007) K. Rabe, C.H. Ahn, and J.-M. Triscone, eds., Physics of Ferroelectrics: A modern perspective (Springer-Verlag, Berlin, 2007).
- Pytte (1972) E. Pytte, “Theory of perovskite ferroelectrics,” Physical Review B 5, 3758–3769 (1972).
- van Roekeghem et al. (2016) A. van Roekeghem, J. Carrete, and N. Mingo, “Anomalous thermal conductivity and suppression of negative thermal expansion in ScF3,” Physical Review B 94, 020303 (2016).
- Liu et al. (2015) Yaming Liu, Zhenhong Wang, Mingyi Wu, Qiang Sun, Mingju Chao, and Yu Jia, “Negative thermal expansion in isostructural cubic ReO3 and ScF3: A comparative study,” Computational Materials Science 107, 157–162 (2015).
- Chatterji and McIntyre (2006) Tapan Chatterji and G.J. McIntyre, “Pressure-induced structural phase transition in ReO3,” Solid State Communications 139, 12–15 (2006).
- Handunkanda et al. (2016) Sahan U. Handunkanda, Connor A. Occhialini, Ayman H. Said, and Jason N. Hancock, “Two-dimensional nanoscale correlations in the strong negative thermal expansion material ScF3,” Physical Review B 94, 214102 (2016).
- Attfield (1998) J. Paul Attfield, “A Simple Approach to Lattice Effects in Conducting Perovskite-Type Oxides,” Chemistry of Materials 10, 3239–3248 (1998).
- Attfield (2001) J.P Attfield, “Structure–property relations in doped perovskite oxides,” International Journal of Inorganic Materials 3, 1147–1152 (2001).
- Attfield (2002) J.P. Attfield, “‘A’ cation control of perovskite properties,” Crystal Engineering 5, 427–438 (2002).
Supplmentary Material: Negative thermal expansion in open perovskites near the precipice of structural stability
I Model Hamiltonian
We consider a cubic lattice with sites and choose normal mode coordinates that describe local displacements in the unit cell that are associated with the relevant soft phonon mode, the condensation of which leads to a structural transition to a rhombohedral phase. In addition, we introduce symmetry adapted strains and , as well as shear strain components , and in the usual Voigt notation: , , and . is the displacement of the center of mass of the unit cell from its equilibrium position due to the acoustic phonon mode. Physically, and are, respectively, volume and tetragonal strains. We consider the model Hamiltonian,
| (S1) |
where,
| (S2) |
| (S3) |
and
| (S4) |
Here, and are, respectively, the conjugate momenta of and . is an interaction between the soft mode coordinates with Fourier transform . This form is typical of cubic lattices with dependent on the direction of the unit wave-vector and independent of the magnitude . Cowley (1980) Within the local SCPA, the equations derived from the stationary property of the free energy are independent of the particular form of as long as there is no self-interaction. Pytte (1972) is the bulk modulus, and , are deviatoric and shear moduli, respectively. , and are coupling constants between the lattice and the strain degrees of freedom, and is an applied hydrostatic pressure. is the lattice stiffness at site ; and are coefficients of the isotropic and anisotropic cubic anharmonicites, respectively.
To account for quenched compositional disorder in mixed-compounds, we note that at the mean field level the energy barriers between different lattice stuctures depend on the ratio between the harmonic and anharmonic coefficients of the model. Cowley (1980) For simplicity, we thus consider a probability distribution for the ’s while assuming that the remaining parameters remain fixed.
II Statistical Mechanical Solution
We consider the trial probability distribution,
| (S5) |
where is the Hamiltonian of the local uncoupled problem,
| (S6) |
| (S7) | ||||
| (S8) |
is its normalization. and are the spontaneous displacement and strain order parameters which will be determined by minimization of the free energy; is the dynamical matrix with eigenfrequencies of the non-ineracting problem (). Here, denotes thermal average over the trial probability distribution (S5). We set the long-range ordering associated with the condenstation of the mode at , by writing , where is the position vector the lattice site . This corresponds to out-of-phase tilts where changes sign from site to site.
II.1 Free energy
The free energy is calculated in the usual way ,
| (S9) |
where,
| (S10) |
| (S11) |
and,
| (S12) |
with
| (S13a) | ||||
| (S13b) | ||||
are the local OP fluctuations given as follows,
| (S14) |
where is an unitary transformation that diagonalizes . the lattice stiffness averaged over compositional disorder. In writing Eq. (S9), we have ignored all terms that do not depend on , and as they do not have an effect on the miminization procedure.
Minimization of the free energy (S9) with respect to the strains gives the following result,
| (S15a) | ||||
| (S15b) | ||||
| (S15c) | ||||
| (S15d) | ||||
II.2 Soft Mode Frequencies
The soft mode frequencies are computed from the free energy (S9) with the constant and then must be evaluated at the equilibrium points given in Eq (S15). This is because the frequency of the acoustic modes associated with uniform strains vanishes in the long-wavelength limit. Slonczewski and Thomas (1970)
II.3 Cubic phase
In the cubic phase, . Thus, the dynamical matrix is given as follows,
The diagonalization of gives a triply degenerate zone-boundary soft mode frequency,
| (S17) |
Here, is the frequency of a purely harmonic model. are the local OP fluctuations in the cubic phase,
| (S18) |
with . The change in volume is given by the volumetric strain,
| (S19) |
where is a reference volume.
II.4 Rhombohedral phase
In the r-phase, and,
| (S21) |
Thus, the dynamical matrix is given as follows,
The diagonalization of together with the minimization of the free energy (II.1) with respect to gives the following result,
| (S22a) | ||||
| (S22b) | ||||
| (S22c) | ||||
and are volume and shear strains, respectively
| (S23a) | ||||
| (S23b) | ||||
and are fluctuations of the OP in the r-phase,
| (S24a) | ||||
| (S24b) | ||||
where .
As mentioned above, the temperature and pressure dependence of the the Grüneisen parameters of the and phonons are again entirely determined by their corresponding energies,
| (S25) |
Equations (S22)-(S24), determine self-consistently the temperature and pressure dependence of , , and .
II.4.1 Classical Limit
It is useful to consider the classical limit of the above results, as it allow us to derive analytical expressions for several relevant macroscopic quantities in terms of microscopic parameters. We consider the high- cubic phase.
In the classical limit () and near the structural transition, , thus,
| (S26) |
where is the coefficient of thermal expansion (CTE).
We find that he and dependence of matches that of Landau theory, as expected, Pytte (1972)
| (S27) |
where is a reduced temperature and is a pressure dependent transition temperature given as follows,
| (S28) |
where is the transiton temperature at ambient pressure,
| (S29) |
with . Note that when there is a c-r transition, the high symmetry phase is unstable in the purely harmonic approximations and thus . The dependence in is through , which in turn depends , i.e., the lattice stiffness averaged over compositional disorder. Note that for , hydrostatic pressure destabilizes the c-phase. From Eq. (S28), we find a proportionality relation between the slope of the phase diagram and the CTE,
| (S30) |
We conclude the presentation of our model here.
III Model parameters
The model parameters are given in Table 1 and were obtained from fits to experiments in ScxTi1-xF3. Handunkanda et al. (2015); Morelock et al. (2014) We have assumed independent bimodal distributions for the stiffnesses , with and are the lattice stiffnesses of the pure compounds. With this choice, . The resulting phase diagram, phonon frequencies and order parameter for several compositions are shown in Fig. S1.
| [meV2] | |
|---|---|
| [meV2] | |
| [meV2] | |
| [meV3] | |
| [meV3] | |
| [meV2] | |
| [meV2] | |
| [meV] | |
| [meV] |
References
- Cowley (1980) R. A. Cowley, Adv. Phys. 29, 1 (1980).
- Pytte (1972) E. Pytte, Phys. Rev. B 5, 3758 (1972).
- Slonczewski and Thomas (1970) J. C. Slonczewski and H. Thomas, Phys. Rev. B 1, 3599 (1970).
- Volker et al. (004a) H. Volker, P. R. L. Welche, and M. T. Dove, J. Am. Ceram. Soc. 82, 1793 (2004a).
- Handunkanda et al. (2015) S. U. Handunkanda, E. B. Curry, V. Voronov, A. H. Said, G. G. Guzmán-Verri, R. T. Brierley, P. B. Littlewood, and J. N. Hancock, Phys. Rev. B 92, 134101 (2015).
- Morelock et al. (2014) C. R. Morelock, L. C. Gallington, and A. P. Wilkinson, Chem. Mater. 26, 1936 (2014).