The first ultraviolet detection of the Large Magellanic Cloud pulsar PSR B054069 and its multi-wavelength properties
Abstract
We observed the young ( yrs) pulsar PSR B054069 in the near-ultraviolet (UV) for the first time with the Space Telescope Imaging Spectrograph (STIS) aboard the Hubble Space Telescope. Imaging observations with the NUV- and FUV-MAMA detectors in TIME-TAG mode allowed us to clearly detect the pulsar in two bands around 2350Å and 1590Å, with magnitudes and . We also detected the pulsar-wind nebula (PWN) in the NUV-MAMA image, with a morphology similar to that observed in the optical and near-infrared (IR). The extinction-corrected NUV and FUV pulsar fluxes are compatible with a very steep power law spectrum with spectral index , non compatible with a Rayleigh Jeans spectrum, indicating a non-thermal origin of the emission. The comparison with the optical/near-IR power-law spectrum (spectral index ), indicates an abrupt turnover at wavelengths below 2500 Å, not yet observed in other pulsars. We detected pulsations in both the NUV and FUV data at the 50 ms pulsar period. In both cases, the folded light curve features a broad pulse with two peaks closely spaced in phase, as observed in the optical and X-ray light curves. The NUV/FUV peaks are also aligned in phase with those observed in the radio (1.4 GHz), optical, X, and -ray light curves, like in the Crab pulsar, implying a similar beaming geometry across all wavelengths. PSR B054069 is now the fifth isolated pulsar, together with Crab, Vela, PSR B0656+14, and the radio-quiet Geminga, detected in the optical, near-UV, near-IR, X-rays and -rays, and seen to pulsate in at least four of these energy bands.
Subject headings:
(stars:) pulsars: individual (PSR B054069)1. Introduction
Pulsars are rapidly spinning neutron stars that emit electromagnetic radiation (mostly) at the expenses of their rotational energy (Pacini 1968; Gold 1968), hence also referred to as rotation-powered pulsars. Apart from the radio band, where the first of the over 2500 radio pulsars known to date111See, ATNF pulsar catalogue (Manchester et al. 2005) was originally discovered (Hewish et al. 1968), pulsars are also observed in X-rays, -rays, optical, infrared (IR), ultraviolet (UV), and the sub-mm (Mignani et al. 2017).
Owing to their intrinsic faintness, the number of pulsar detections at optical energies by and large lag behind those at high energies. After the Crab pulsar (PSR B0531+21; Cocke et al. 1969), which was the first one identified through its optical pulsations at the radio period (Cocke et al. 1969), only eight isolated pulsars (i.e., not in binary systems) have been firmly identified in the optical plus two candidates (see, Mignani 2011 for a review), and three more identifications have been recently proposed (Moran et al. 2013; Mignani et al. 2016a; Rangelov et al. 2017). Optical pulsations have been detected only for some of them, though. Indeed, apart from the Crab (Cocke et al. 1969), only for four other pulsars have optical pulsations been detected: the Vela pulsar (PSR B083345; Wallace et al. 1977), PSR B054069 (Middleditch & Pennypacker 1985), PSR B0656+14 (Shearer et al. 1997) and Geminga (Shearer et al. 1998). Eight of the isolated pulsars identified in the optical have also been detected in the UV with the Hubble Space Telescope (HST) and four of them (Crab, Vela, PSR B0656+14, and Geminga) pulsate in the UV (Percival et al. 1993; Romani et al. 2005; Shibanov et al. 2005; Kargaltsev et al. 2005), beside the optical band. These four pulsars have also been identified in the near-IR (Mignani et al. 2012 and references therein), but pulsations in this band have been detected only for the Crab (e.g., Eikenberry et al. 1997).
The near-UV/optical/near-IR (hereafter UVOIR) spectra of young pulsars ( kyrs), where is the characteristic age222This is defined as , where and are the pulsar spin period and its first derivative, respectively., show the signature of non-thermal, likely synchrotron, emission from the neutron star magnetosphere (see, e.g. Mignani 2011), characterised by power-law (PL) spectra (0–1). Differences in the spectral index across the three bands are observed in some cases, e.g. the Crab pulsar (Sollerman 2003), but not in others, e.g. the Vela pulsar (Zyuzin et al. 2013). In middle-aged pulsars (–1 Myr), a second emission component is present in the optical/UV, associated with thermal emission from the neutron star surface and characterised by a Rayleigh-Jeans (RJ) spectrum with a brightness temperature K (Mignani 2011).
Despite the optical and UV being very close in wavelengths, differences in the pulsar light curves333Through the text we implicitly refer to the light curves folded at the pulsar spin period. exist. In particular, HST observations showed that the widths and separations of the two peaks in the Crab light curve (a.k.a. Main Pulse and Interpulse) are larger in the optical than in the UV (Percival et al. 1993), perhaps related to the difference in the PL slope between these two bands (Sollerman 2003). In the case of Vela possible differences in the widths and separations of the two main peaks between the optical and the UV light curves cannot be appreciated owing to the lower statistics, although they differ in the structure of the smaller peaks (Romani et al. 2005). At variance with the Crab, there is no difference in the PL slope from the optical to the UV (Zyuzin et al. 2013). HST observations of the middle-aged pulsars PSR B0656+14 (Shibanov et al. 2005) and Geminga (Kargaltsev et al. 2005) also showed differences in their light curves from the optical to the UV. This might also be due to the rising contribution of the RJ component in the UV relative to the PL component, with extra modulations possibly produced by hot spots on the neutron star surface. Detecting more optical/UV pulsars is important to study the evolution of the light curve and spectrum across these two bands and to infer the characteristics and geometry of the corresponding emission regions.
PSR B054069 in the Large Magellanic Cloud (LMC) is the second brightest optical pulsar () after the Crab and an obvious target for UV observations, which have thus far not been performed. It is referred to as the Crab “twin” because it is very similar in spin period ( ms), period derivative (s s-1), characteristic age ( kyr), rotational energy loss ( erg s-1), and surface magnetic field ( G)444The latter two values have been derived from the standard formulae erg s-1 and G, derived by assuming for the neutron star a moment of inertia g cm2..
The LMC distance (48.970.09 kpc; Storm et al. 2011) makes PSR B054069 one of the faintest radio pulsars (Manchester et al. 1993). Indeed, it was discovered in X-rays (Seward et al. 1984) becoming the first extragalactic pulsar detected at any wavelength. PSR B054069 is the latest pulsar to have been detected in the near-IR (Mignani et al. 2012) and has also been recently detected as a -ray pulsar (Ackermann et al. 2015) by the Fermi Large Area Telescope (LAT). Like other young pulsars (Kargaltsev et al. 2017), it is embedded in a bright pulsar wind nebula (PWN) visible from the near-IR to the soft/hard X-rays (Mignani et al. 2012; Petre et al. 2007; Słowikowska et al. 2007). Optical pulsations were detected by Middleditch & Pennypacker (1985), while the pulsar counterpart was later identified via high-resolution imaging (Caraveo et al. 1992; Shearer et al. 1994). The optical light curve (Middleditch et al. 1987; Gouiffes et al. 1992; Boyd et al. 1995) features a broad pulse, which is actually resolved in two peaks (see also, Gradari et al. 2011).
The optical spectrum of PSR B054069 is characterised by a PL (e.g., Serafimovich et al. 2004). The measurement of significant phase-averaged polarisation with the HST (Mignani et al. 2010a; Lundqvist et al. 2011) confirmed the magnetospheric origin of its optical emission. HST and Very Large Telescope (VLT) adaptive optics images (Mignani et al. 2010a; 2012) clearly resolved PSR B054069 from its compact (4″) PWN, making it possible to precisely measure the pulsar flux. This yielded the most accurate measurement of its PL spectral index in the optical/near-IR (), which is similar to that in the X-rays (), measured from Chandra spectroscopy (Kaaret et al. 2001). However, the optical fluxes fall below the extrapolation of the X-ray PL (Mignani et al. 2010a), suggesting a spectral flattening in the UV. Determining the pulsar spectrum in the UV is, then, key to confirm the expected flattening, whereas measuring the UV light curve is key to determine whether such flattening is associated with different optical and UV light curve profiles, as possibly observed in the Crab pulsar (Percival et al. 1993).
Here, we present the results of the first UV observations of PSR B054069, carried out with the HST. This manuscript is organised as follows: observations and data analysis are described in Section 2, whereas the results are presented and discussed in Sections 3 and 4, respectively. Summary and conclusions follow in Section 5.
2. Observations
2.1. Observation Description
We observed PSR B054069 with the HST during Cycle 23 (Prog. ID: 14250; PI: Mignani) on February 27 and 28 2017, as part of the UV Initiative Program. We used the Space Telescope Imaging Spectrograph (STIS) and collected data with both its NUV- and FUV-MAMA (Multi-Anode Micro-channel Array) detectors that are sensitive in the 1600–3100Å and 1150–1700Å spectral ranges, respectively.
The detectors were operated in imaging ( field–of–view) TIME-TAG mode, chosen for two principal reasons: (i) to clearly resolve the pulsar emission from that of the surrounding PWN ( diameter), thanks to a spatial resolution of 0024/pixel, and (ii) to search for pulsations at the pulsar period (50 ms) and accurately sample the light curve, thanks to a time resolution of s. For the NUV- and FUV-MAMA detectors we used their F25QTZ filters555Since the filters have the same name for both MAMA detectors, hereafter we simply distinguish the two data sets by the detector name (NUV and FUV for short)., which have central wavelengths and FWHM bandwidths of Å, Å and Å, Å, respectively (Riley et al. 2017). These combinations provide high-throughput broad-band UV imaging, minimising the background contribution from geo-coronal emission lines and maximising the spectral coverage achievable with the STIS MAMAs.
The planned exposures were allocated in six spacecraft orbits, equally distributed between the NUV and FUV observations (three orbits each), and split in two different visits to cope with the HST scheduling constraints. The same roll angle of 324934 (measured east of north) was used in both visits. The exposure time per orbit was defined to fully exploit the target visibility window666Owing to scheduling constraints in Cycle 23 it was not possible to observe our target in Continuous Viewing Zone and the maximum visibility window before Earth occultation was about 3500 s per orbit.. After accounting for instrument overheads and guide star acquisitions, we acquired one 3050 s and two 3300 s exposures (1000 s buffer time) in each visit for a net total integration time of 9650 s for both the NUV and FUV observations.
2.2. Data Analysis
We retrieved our data from the Mikulski Archive for Space Telescopes (MAST777https://archive.stsci.edu/hst/search.php) after routine data reduction and calibrations steps have been applied through the CALSTIS pipeline under the STSDAS package. These steps are: dark subtraction, flat fielding, geometric distortion and detector non-linearity corrections, flux calibration, which have all been implemented using the calibration frames and tables closest-in-time to our observations. In order to increase the signal–to–noise, for each data set we then co-added the single exposures using the STSDAS task combine which also applies rejection of cosmic ray hits.
We checked the astrometry of the NUV and FUV images, determined by the HST aspect solution, against the HST/WFPC2 images of Mignani et al. (2010a), whose astrometry was re-calibrated in the 2MASS (Skrutskie et al. 2006) reference frame with an overall accuracy of 012–015. To account for the measured absolute offsets of and in the NUV and FUV image astrometry, respectively, we used a grid of reference stars detected in a radius around PSR B054069 to register the MAMA images onto the astrometry reference frame of the WFPC2 images with an accuracy of better than 001. We used the NUV and FUV images with the re-calibrated astrometry as a reference for the pulsar identification.
3. Results
3.1. Imaging and Photometry
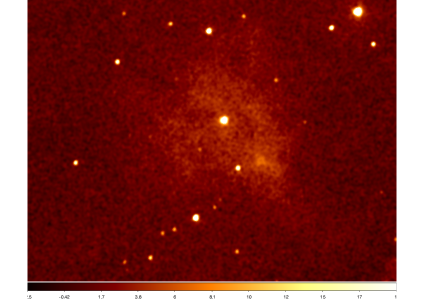
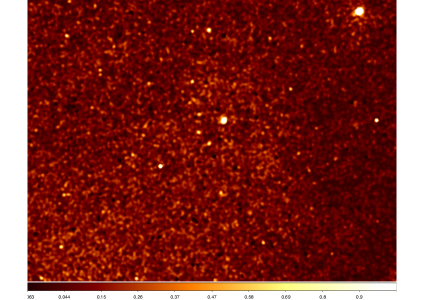
Fig. 1 shows the NUV- and FUV-MAMA images of the PSR B054069 field obtained after the processing described in the previous section. We clearly detected PSR B054069 in both the NUV and FUV images at a position coincident with its optical coordinates computed by Mignani et al. (2010a): (0009), (005)888The errors refer to the average of the pulsar coordinates computed on four independent WFPC2 data sets, see Mignani et al. (2010a) for details.. Ours is the first detection ever of PSR B054069 in the UV, which also makes it the fifth isolated pulsar, among the known, that has been detected in the near-IR, optical, UV, X-rays and -rays, after the Crab and Vela pulsars, PSR B0656+14, and Geminga (the fourth among radio pulsars999Geminga (PSR J0633+1746) has not yet been unambiguously detected as a radio pulsar despite many searches, see Maan (2015) and references therein.). We also detected the PSR B054069 PWN in our NUV image (Fig. 1, left), with a structure and extent similar to what is observed in the optical and near-IR (Mignani et al. 2010a; 2012). The PWN is at most barely visible, however, in the FUV image (Fig. 1, right). The bright emission knot in the PWN detected at south west of the pulsar in HST/WFPC2 images (De Luca et al. 2007) is also visible in the STIS/NUV-MAMA observation, aligned with the major axis of the PWN. Since our paper is focused on the pulsar, a coherent multi-wavelength spectral and spatial analysis of the PWN and its features will be the subject of a subsequent paper.
For both the NUV and FUV images, we computed the pulsar fluxes through aperture photometry employing the tools in the IRAF101010IRAF is distributed by the National Optical Astronomy Observatories, which are operated by the Association of Universities for Research in Astronomy, Inc., under cooperative agreement with the National Science Foundation. package PHOT. We used an aperture radius of 10 pixel (024) to maximise the signal–to–noise and we sampled the sky background within an annulus of 25 pixel inner radius (06) to avoid contamination from the wings of the pulsar PSF, which are particularly bright in the NUV-MAMA F25QTZ filter, and of 35 pixel outer radius (084) to avoid including bright stars close to the pulsar. Since the PWN is the main source of background, which is itself not spatially uniform, we carefully checked that our photometry is not very sensitive to the choice of the annulus width. We then applied the aperture correction to compute the pulsar count-rates in an infinite aperture using the values of the encircled energy fractions for the chosen radius reported in the STIS Instrument Handbook Version 16.0 (Riley et al. 2017) for the NUV- and FUV-MAMA F25QTZ filters. The aperture-corrected, background-subtracted count-rates (CR) are 1.530.02 and 0.0530.005 counts s-1 for the NUV and FUV images, respectively. The large difference in CR can be visually appreciated by the comparison of the two images (Fig. 1), which were obtained through the same integration time (9650 s) and are, thus, directly comparable to each other. We converted the corresponding instrumental magnitudes into ST magnitudes (STMag) using the photometric calibration parameter PHOTFLAM, which is closest in time to our observations and reported in the image header, according to the definition: STMag. The observed magnitudes, i.e. uncorrected for the interstellar extinction, are and , where the associated errors are purely statistical.
3.2. Timing
We looked for pulsations in the NUV and FUV data of PSR B054069 at its 50 ms period. We extracted the time series from the event files using an aperture with a radius of 10 pixels (024), which corresponds to 82% of the pulsar flux (Riley et al. 2017). Then, we used the task hstephem in STSDAS to account for the spacecraft position and velocity during the observations, and the IRAF task otimedelay to convert the photon arrival times from the topocentric reference frame to the solar system barycentre. As a reference for the pulsar position we used the most precise coordinates known (Mignani et al. 2010a). Since the pulsar has a proper motion of mas yr-1 (Mignani et al. 2010a) any displacement between the epoch of our STIS observations (MJD 57811) and that of the reference position (MJD 54272) is much smaller than the absolute uncertainty on the pulsar coordinates (70 mas).
We folded the NUV and FUV time series around the expected pulsar period using as a reference the most recent timing solution for PSR B054069 (Marshall et al., in preparation), obtained by monitoring the pulsar period evolution with the X-ray Telescope (XRT; Burrows et al. 2005) aboard the Neil Gehrels Swift Observatory after the change in the spin-down frequency derivative occurred between December 3 2011 and December 17 2011 (Marshall et al. 2015). Results from this monitoring program, which started on February 17 2015, have been presented in Marshall et al. (2016) and Marshall et al. (2018). In particular, the data set consists of all the XRT observations of PSR B054069 that covers the full time span from February 17 2015 to March 28 2018 (MJD 57070–58205), for a total of 176.893 ks.
The analysis of the data from the XRT used the same procedure described in Marshall et al. (2015) and Marshall et al. (2016). All the observations were made using the Window Timing mode. The data were processed using the software tool xrtpipeline, and events were screened to maximize the signal from the pulsar. Arrival times were corrected to the solar system barycentre using the pulsar position from Mignani et al. (2010a) and the JPL Planetary Ephemeris DE-200 (Standish et al. 1982)111111In this, we followed the prescription of the HEASoft tool barycorr that recommends DE-200 for the Swift data, which are based on the FK5 reference frame. More recent ephemeris files, such as DE-405, use the ICRS reference frame. According to the notes to the barycorr tool, using DE-405 instead of DE-200 will cause a maximum error of 2 ns for satellites in low-Earth orbit, which is completely negligible for PSR B054069. Moreover the STIS data analysis threads recommend the use of DE-200.. Events were folded on multiple candidate periods, and a sine wave was fit to the best folded light curve. The resulting frequencies and phases at the epochs of the observations were then fit with a spin model using a Taylor expansion of spin frequency and its derivatives through . Small glitches in the pulsar on MJD 57546 and 57946 were added to the model to produce a good fit for the entire span of observations. The resulting ephemeris was used to produce a folded X-ray light curve of all the events. The updated timing solution, together with a detailed analysis of the spin frequency evolution, will be presented in a separate publication (Marshall et al., in preparation).
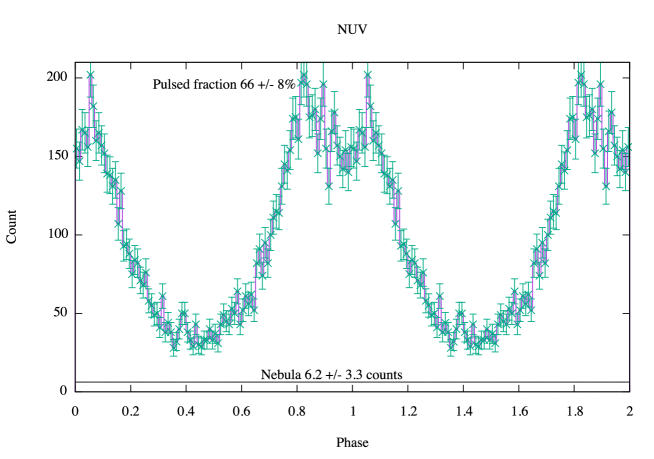
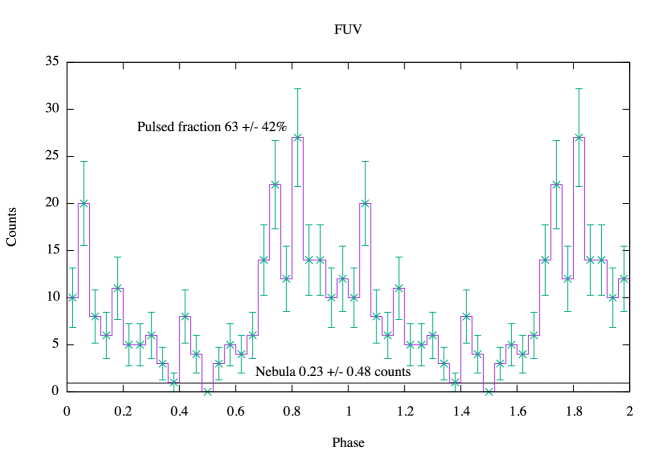
By folding the NUV and FUV data at the expected pulsar period, we found a clear pulsed signal in both the NUV and FUV time series (Fig. 2a,b), albeit at a different significance level owing to the difference in the pulsar count-rate in the two data sets (see §3.1). The detection significance for the NUV and FUV pulsations is and respectively, which we computed based on the statistic (Buccheri et al. 1983). We also computed the detection significance based on a analysis and obtained comparable results, with values of 2800 (64 d.o.f.) and 82 (20 d.o.f.) for the NUV and FUV light curves, respectively. The final probability was determined with Monte Carlo simulations for the case of non-normal distributions. The detection of the expected periodicity clearly and independently confirms the pulsar UV identification, initially based upon position match with the optical coordinates. Therefore, PSR B054069 is also the fifth isolated pulsar for which pulsations have been detected in the UV, optical, X and -rays. A comprehensive cross-comparison of the multi-wavelength light curves and spectra of these five pulsars is beyond the goals of this work and will be reported elsewhere.
Both the folded NUV and FUV light curves feature a broad pulse resolved in two peaks separated by 0.3 in phase (Fig. 2). The two peaks in the NUV light curve look more structured than in the FUV one, but this is only an effect of the better count statistics and smaller binning. Although similar, the NUV and FUV light curves show some small differences. For instance, in the FUV light curve the intensity of the second peak seems to be lower than the first one, whereas in the NUV one the intensity of the two peaks is comparable. Obtaining a FUV light curve with an improved signal–to–noise would help to determine whether this difference in the intensity of the two peaks is real or it is an effect of the low count statistics. A difference between the relative intensity of the two main peaks is also observed, e.g. in the STIS NUV and FUV light curves of the Vela pulsar, where the intensity of the primary peak with respect to the secondary one increases in the FUV (Romani et al. 2005). On the other hand, in the case of the Crab pulsar there is no appreciable difference in the relative intensity of the primary and secondary peaks between the STIS NUV and FUV light curves (Sollerman et al. 2000). A hint of a third peak between the two main ones is visible in the NUV light curve of PSR B054069, which looks more or less prominent depending on the binning. Its estimated significance is 2–3 only and it is even lower in the FUV light curve, where such a third peak is barely visible. A possible precursor to the broad pulse is also visible in the FUV light curve, but not as clearly in the NUV one, indicating that it might be an effect of the different binning. Also in this case, obtaining NUV and FUV light curves with an improved signal–to–noise would help to assess the existence of these features. This complex structure might be reminiscent of that observed in the NUV and FUV light curves of the Vela pulsar, where two small peaks are present in addition to the primary and secondary ones (Romani et al. 2005). At present, however, we cannot determine whether the sub-structures seen in the PSR B054069 light curves are real or not. Investigations through deeper observations may be worthwhile.
As it can be seen from Fig.2, the signal from PSR B054069 is almost totally pulsed in the NUV and FUV light curves. In particular, the pulsed fraction (PF) is 66%8% and 63%42% in the NUV and FUV light curves, respectively, where we computed PF from the component above the flux level in the phase interval defined as the off-pulse region, often refereed to as the direct current (DC) level. The DC level is much higher in the NUV light curve than in the FUV one (Fig. 2), as expected from the higher PWN background present in the NUV image (Fig. 1). This, however, only partially accounts for the DC level, which is well above the nebula background. Indeed, the DC level, calculated in the phase intervals 0.355–0.515 (NUV) and 0.34–0.54 (FUV), is 35.86.9 counts and 3.22.8 counts, respectively. On the other hand, the nebula background, which we sampled in annulus centred on the pulsar of 25 pixel inner radius and 10 pixel width (See § 3.1), is only 6.23.3 counts and 0.230.48 counts in the NUV and FUV images, respectively.
Such a difference suggests that there is a significant continuous emission component from a source very close to the pulsar, which is not associated with the PWN. A significant DC component is also seen in the Crab pulsar light curve and is associated with the unresolved emission from the bright knot in the PWN, at 065 from the pulsar (Słowikowska et al. 2009). No such structure, however, is seen in our high-spatial resolution HST images of PSR B054069 (see, also Mignani et al. 2010). Given the small aperture used to extract the pulsar counts (024 radius), about twice the size of the image PSF, we deem it unlikely that this DC component is associated with a source other than the pulsar itself. Therefore, there must be an emission component from the pulsar which is not pulsed. This would be the case, for instance, if such a component were emitted isotropically from the pulsar magnetosphere, within the last closed magnetic field lines. Time-resolved UV spectroscopy observations are needed to verify this hypothesis by studying the pulsar spectrum as a function of the rotation phase. In this way, it would be possible to determine whether the spectrum of the DC component differs from that of the pulsed component and, more importantly, whether it varies with the rotation phase. This would help to confirm that the source of the DC component is isotropic emission from the pulsar magnetosphere, as we speculated above.
4. Discussion
4.1. The pulsar UVOIR spectrum
We corrected the observed NUV and FUV magnitudes for the effects of the interstellar extinction. As was done done in Mignani et al. (2010a; 2012), we assumed a reddening (see also discussion in Serafimovich et al. 2004). We assumed the interstellar extinction law of Fitzpatrick (1999) that gives extinction correction terms and at Å and Å, respectively. We remark that our choice of the interstellar extinction correction was made so as to not bias the comparison with the optical and near-IR fluxes of Mignani et al. (2010a; 2012), which were also corrected using the extinction law of Fitzpatrick (1999). By correcting the observed magnitudes according to the computed and , we obtain extinction-corrected fluxes of Jy and Jy for the NUV and FUV bands, respectively.
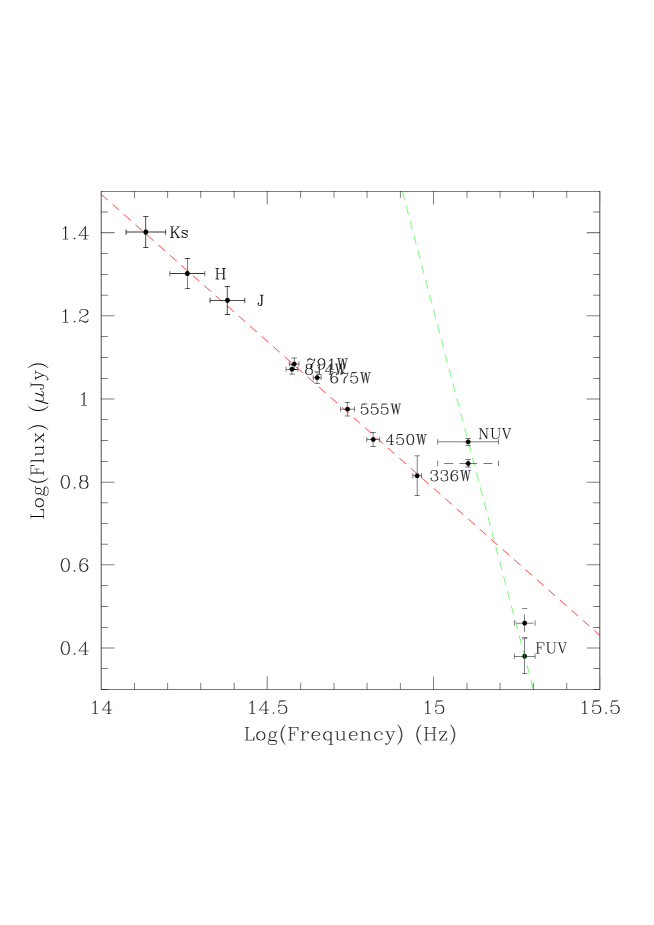
We used these flux values to characterise the PSR B054069 spectrum from the near-IR to the near-UV. Here we are aware that we are comparing flux measurements taken at different epochs, in particular before and after the large change (Marshall et al. 2015). Since the effects of this event on the pulsar UVOIR flux and spectrum are unknown, such comparison must be taken with due care. Fig.3 shows the UVOIR spectrum of PSR B054069 together with the best-fit PL to the optical/near-IR fluxes (Mignani et al. 2012). In all cases, the plotted fluxes have been computed through aperture photometry on the time-integrated images. Therefore, the fluxes are integrated over the pulse phase, which means that they account for both pulsed and unpulsed emission components. As it can be seen, the NUV and FUV fluxes are clearly incompatible with the slope of the optical/near-IR PL (), with the former above and the latter below its extrapolation by and , respectively, suggesting a drastic turnover in the spectrum at wavelengths below 2400 Å. In particular, the NUV and FUV fluxes are not consistent with a flattening of the optical/near-IR PL, as one would expect from the comparison between the optical and X-ray spectra (see Fig. 3 of Mignani et al. 2010a), but instead show a steeper PL in the UV, with spectral index . Such a steep PL slope has never been seen in the UVOIR spectra of any other pulsar, where the spectral index is usually –1 (Mignani et al. 2011). Since this result is unexpected, we double-checked for possible bugs in our end–to–end procedure as follows.
Firstly, we checked that our photometry is neither affected by systematics, such as the aperture correction, nor by calibration issues, such as the zero-point definition, for which we straightforwardly applied values reported in the instrument handbook and in the image headers. As a safe measure, we verified that the tabulated aperture correction factors are consistent with those measured directly on the image and that the values of the PHOTFLAM keywords in the image headers were consistent with those reported in other sources (e.g., Proffitt 2006). Therefore, we are confident that the observed magnitudes have been computed and calibrated correctly. We note that most of the fluxes plotted in Fig. 3 have been measured with the HST and calibrated in a similar fashion, which minimises the risk of cross-calibration problems.
As a test, we computed the pulsar photometry using methods different from those described in §3.1, e.g. by employing different software tools for the photometry, by using different apertures and background areas and, consequently, different values for the aperture correction, and obtained fully compatible magnitude values, which confirms that our results are robust and method-independent. For consistency, we also compared our measured pulsar CRs in the NUV and FUV images with those predicted by the STIS Exposure Time Calculator (ETC). We assumed the de-reddened NUV and FUV fluxes at the peak wavelength of the F25QTZ filter, the PL connecting these two values (Fig. 3) as a template spectrum, an , and the zodiacal light at the PSR B054069 coordinates. The ETC predicts CRs of 1.48 (NUV) and 0.053 (FUV), after accounting for the sky background from the PWN, which are fully consistent with ours.
In principle, our photometry might have been affected by issues other than those just discussed, such as a glitch in the instrument performances. However, no variations in the detector throughput or other anomalies have been reported in the STIS instrument science reports121212http://www.stsci.edu/hst/stis/documents/isrs for the time frame around our observations. To rule out that the large difference between the pulsar NUV and FUV CRs is due to instrument effects of some sort we computed the difference between the co-aligned NUV and FUV images and found that the CR residuals for all stars in the field of view are randomly distributed above and below those for the pulsar, as one would expect if the data are free of instrument systematics.
Finally, we have carefully checked the applied UV extinction correction against those derived in more recent works and ruled out that the de-reddened NUV and FUV flux values that we derived are substantially mis-estimated. For instance, assuming the extinction law of Gordon et al. (2003), which is derived both for the LMC as a whole and, more specifically, also for the 30 Doradus region, would only marginally change the extinction correction in the NUV and FUV, whereas the extinction correction in the near-IR and the optical bands would be undistinguishable from that derived from the extinction law of Fitzpatrick (1999). Although this would result in a lower de-reddened NUV flux, and in a similarly higher de-reddened FUV flux, it would only partially account for the NUV/FUV flux difference with respect to the optical/near-IR PL extrapolation, which would still be at and , respectively (Fig. 3). Since PSR B054069 is embedded in its supernova remnant, one can speculate of a difference in the interstellar extinction law on a more local scale, owing to a different chemical composition of the remnant with respect to the surrounding environment. This speculation, however, cannot be easily verified with the available data, especially given the small angular extent of the remnant (). Even so, since PSR B054069 lies within the 30 Doradus nebula () its effects on the interstellar extinction law dominate over those produced by local environment fluctuations.
Having done all the due checks, and having found no obvious bug in our procedure, we are prone to conclude that the source of the large difference between the pulsar NUV and FUV fluxes is intrinsic to the pulsar. This suggests that, unexpected as it may be, the abrupt turnover observed in the pulsar PL spectrum is intrinsic to the source, although the evidence must be supported by more flux measurements in the UV.
Thinking of a physical origin, one may speculate whether the larger (smaller) NUV (FUV) flux with respect to the optical/near-IR PL extrapolation might be (at least partially) explained by a DC component in the pulsar emission which is stronger in the NUV than at longer wavelengths, whereas it is almost absent in the FUV (see § 3.2). If the PF were similar at all wavelengths, such a different DC component fraction in the UV would raise the phase-integrated NUV flux above the expected value, and decrease the FUV flux, affecting the slope of the phase-integrated spectrum. Unfortunately, there are no published light curves of PSR B054069 obtained in bands other than V (see, Gradari et al. 2011 and references therein131313Middleditch et al. (1987) indeed obtained light curves of PSR B054069 in the UBVRI bands but these were never published.), so that we do not know the value of the PF at different wavelengths. Moreover, these light curves were all obtained with non-imaging photon counting detectors, making it more problematic to subtract the PWN background and disentangle a genuine DC component in the pulsar emission. Therefore, we can neither compare the pulsed nor the DC component fraction at different wavelengths. Future multi-band, high-time and high-spatial resolution observations of PSR B054069 with imaging photometers would be crucial to test our hypothesis.
Another, but less likely, possibility is that of long-term variability in the pulsar UV flux since the epochs of the optical (June–November 2007) and near-IR (October–December 2010) observations of Mignani et al. (2010a; 2012). Pulsars are generally known to be stable sources on long time scales and, in the case of the Crab, it has been shown that optical flux variations can be at the level of just a few milli-magnitudes per year (Sandberg & Sollerman 2009). Larger variations, such as those observed in -rays for PSR J2021+4026 (Allafort et al. 2013), cannot be ruled out a priori. However, in this case one would expect the NUV and FUV fluxes, as well as the optical and near-IR fluxes, to vary in the same direction, unless the flux variation is accompanied by a spectrum variation. Unfortunately, there are no multi-epoch sets of UVOIR flux measurements of PSR B054069 to look for possible flux/spectral variations. Therefore, obtaining a new set of UVOIR flux measurements as close in time as possible to one another is the required step to search for possible long-term variability at these wavelengths. In the X-rays, no significant long-term variability had been observed from the analysis of RXTE observations of PSR B054069 (Ferdman et al. 2015), which cover a time span of 15.8 years. However, these observations only extend up to December 3 2011, i.e. right before the large change, which occurred somewhen between December 3 and 17 2011 (Marshall et al. 2015).
As anticipated earlier in this section, we cannot rule out that an erratic phenomenon such as the large change might have produced a variation in the pulsar UVOIR flux and/or spectrum, making the UV fluxes not directly comparable with the optical/near-IR fluxes, which have been measured before 2011. Since there are neither UV flux measurements taken before the change nor new optical/near-IR flux measurements taken after this event to compare with, we cannot establish whether a consequent variation in the pulsar UVOIR flux and/or spectrum ever occurred. The same new set of UVOIR flux measurements required to look for long-term variability (see above) will also help to determine whether the change has affected the pulsar emission at these wavelengths. Interestingly, the last two RXTE observations of PSR B054069, on December 17 and 31 2011, i.e. after the large change, do not show any significant difference in the X-ray flux with respect to the historical trend (Marshall et al. 2015). However, no other information on the X-ray flux evolution after the event has ever been reported. Therefore, we looked for X-ray variability on a more recent time frame. As a first order test, we compared the pulsar X-ray flux measured at two epochs closest in time to our near-IR (October–December 2010) and UV (February 2017) observations using data available in X-ray observatory archives. To this aim, the only suitable X-ray data are those in the Swift/XRT archive, taken on November 10 2010 (13.5 ks) and February 14 2017 (1.1 ks) in PHOTON and WT mode, respectively. However, from the measured X-ray flux we found no evidence of significant variability between the two epochs. This suggests that the large change did not affect the X-ray flux, as implied by the post-event RXTE observations (Marshall et al. 2015). A systematic analysis of all the Swift/XRT observations of PSR B054069 from February 17 2015 on (Marshall et al., in preparation) will allow us to look for possible X-ray flux variability over the epoch range of interest in more detail.
The possibility that the NUV flux excess with respect to the optical/near-IR PL extrapolation is due to an emission feature centred at 2350 Å, perhaps associated with an ion cyclotron line produced in the pulsar magnetosphere is, at present, no more than a speculation. The possible presence of emission/absorption features in pulsar optical spectra had been claimed for the Crab (Nasuti et al. 1996), Geminga (Mignani et al. 1998) and PSR B0656+14 (Durant et al. 2011) but the existence of these features has either not been confirmed by independent observations or it is still to be proved. An unsubtracted spectral feature in the PSR B054069 supernova remnant (SNR) emitted from a region very close to the pulsar may be another possibility. High spatial-resolution near-UV spectroscopy observations of the pulsar and of its SNR are needed to verify these two possibilities. So far, the only optical/near-UV spectrum of PSR B054069 was obtained by Hill et al. (1997) with the Faint Object Spectrograph aboard HST but the spectral coverage (2500–5000 Å) did not extend to the wavelength range of interest.
4.2. The pulsar multi-wavelength spectrum
Regardless of the unusual PL slope in the UV, it is clear that the NUV and FUV fluxes measured for PSR B054069 would be incompatible with a RJ spectrum. This speaks in favour of a non-thermal (synchrotron) origin of the UV emission, as it is believed to be for the optical and near-IR emission, powered by the pulsar rotational energy. Under the hypothesis that the pulsar change did not introduce a flux/spectrum variation (see discussion in §4.1), the difference in the PL slope from the optical/near-IR to the UV would, then, imply a break in the pulsar non-thermal UVOIR spectrum.
Breaks in the pulsar non-thermal UVOIR spectra are not unheard of. Indeed, a spectral break is observed in the Crab pulsar in the transition from the optical/near-IR to the near-UV, where the PL spectral index features a turnover from to (Sollerman 2003). This break, however, is clearly not as dramatic as that observed in PSR B054069. The Vela pulsar, on the other hand, features a single PL that fits the spectrum all the way from the near-IR to the near-UV (Zyuzin et al. 2013). Whether the presence or absence of breaks in the pulsar UVOIR spectra depends on the characteristic age, with Vela being a factor of 10 older than the Crab, or on other pulsar parameters is not clear yet (see, e.g. Mignani et al. 2016b.) In the case of PSR B0656+14 and Geminga, the other two pulsars that had been detected in the UVOIR, the spectral break between the optical and near-UV is only due to the onset of the RJ component, which dominates over the PL one in the near-UV (e.g., Kargaltsev & Pavlov 2007), and not to a genuine turnover in the optical PL spectral index.
The characterisation of the overall pulsar spectral energy distribution (see Fig. 3 in Ackermann et al. 2015) is not significantly advanced by our new NUV and FUV fluxes, given their limited spectral coverage. However, they confirm that the optical/near-IR and X-ray spectra cannot be described by a single PL, as pointed out by Mignani et al. (2010a) and Serafimovich et al. (2004) based on the optical fluxes only. Observations at shorter UV wavelengths would help to bridge the pulsar emission in these two spectral regions. Unfortunately, HST observations cannot push the wavelength limit any further than Å, whereas PSR B054069 would have not been spatially resolved by the imaging detectors aboard the Extreme Ultraviolet Explorer (Bowyer & Malina 1991) and has not been observed by the Far Ultraviolet Spectroscopic Explorer (Moos et al. 2000). A more robust characterisation of the pulsar spectrum in the near-UV through HST spectroscopy, though, would help to make its extrapolation towards higher frequencies more accurate.
4.3. The pulsar UV luminosity
| Name | d | – | Instrument | |||||
|---|---|---|---|---|---|---|---|---|
| (ms) | (kyrs) | ( G) | ( erg s-1) | ( erg s-1) | (kpc) | (Å) | ||
| Crab1 | 33.39 | 1.26 | 3.79 | 4.50 | 1.04 | 2 | 1600–3200 | STIS/NUV-MAMA G230L |
| B0540692 | 50.05 | 1.67 | 4.98 | 4.98 | 1.27 | 48.97 | 1500–3500 | STIS/NUV-MAMA F25QTZ |
| Vela3 | 89.32 | 11.3 | 3.38 | 0.069 | 1.1 | 0.287 | 1800–3000 | STIS/NUV-MAMA F25SRF2 |
| B0656+144 | 384.89 | 111 | 4.66 | 3.8 | 4.2 | 0.288 | 1150–1700 | STIS/FUV-MAMA G140L |
| Geminga5 | 237.09 | 342 | 1.63 | 3.2 | 1.1 | 0.200 | 1800–3000 | STIS/NUV-MAMA F25SRF2 |
| B1055526 | 197.10 | 535 | 1.09 | 3.0 | 2.3 | 0.35 | 1350–2000 | ACS/SBC F140LP |
| B1929+107 | 226.51 | 3.1 | 0.51 | 3.9 | 4.6 | 0.33 | 1500–3500 | STIS/NUV-MAMA F25QTZ |
| B0950+088 | 253.06 | 1.75 | 0.24 | 5.6 | 4.3 | 0.262 | 1250–2000 | ACS/SBC F125LP |
| J212433589 | 4.93 | 3.8 | 3.2 | 6.8 | 5.8 | 0.410 | 1250–2000 | ACS/SBC F125LP |
| J0437471510 | 5.96 | 4.9 | 5.8 | 3.8 | 4.7 | 0.139 | 1150–1700 | STIS/FUV-MAMA G140L |
1Sollermann et al. (2000); 2this work; 3Romani et al. (2005); 4Shibanov et al. (2005); 5Kargaltsev et al. (2005); 6Mignani et al. (2010b); 7Mignani et al. (2002); 8Pavlov et al. (2017); 9Rangelov et al. (2017); 10Kargaltsev et al. (2004)
PSR B054069 is the tenth pulsar detected in the UV by the HST (see Table 1 for a summary). The list includes the recycled millisecond pulsar PSR J04374715 which is in a binary system and was spectroscopically resolved from its white dwarf (WD) companion (Kargaltsev et al. 2004; Durant et al. 2012). We note that the double pulsar system PSR J07373039A/B was also detected in the UV (Durant et al. 2014) but it was not possible to disentangle the contribution of the two pulsars in the time-integrated HST images. For this reason, neither of the two pulsars is included in Table 1.
We computed the PSR B054069 UV luminosity and compared it with that of other pulsars detected in the UV. For PSR B054069, the isotropic luminosity in the NUV F25QTZ filter (Riley et al. 2017) is d erg s-1, where is the LMC distance in units of 48.97 kpc (Storm et al. 2011). This corresponds to a fraction of of its rotational energy loss ( erg s-1). In the FUV F25QTZ filter, the luminosity is d erg s-1 and the fraction is correspondingly lower by a factor . For comparison, in the near-IR (K band) this fraction is d (Mignani et al. 2012), whereas in the optical (V band) is d (Mignani et al. 2010a), which means that PSR B054069 radiates a factor of five more energy in the NUV than at longer wavelengths.
For the other two young pulsars, Crab and Vela, the UV emission is also non-thermal. For the Crab, integrating its STIS/NUV-MAMA spectrum (Sollerman et al. 2000) over the NUV F25QTZ wavelength range gives erg s-1 for a distance of 2 kpc (Manchester et al. 2005), about the same luminosity as PSR B054069. In the case of the Crab, however, owing to its three times larger with respect to PSR B054069, this corresponds to an fraction of only . For Vela, the UV luminosity, obtained from STIS/NUV-MAMA images but in the F25SRF2 filter (Romani et al. 2005), which is similar to the F25QTZ one, is erg s-1 for the radio parallactic distance of 287 pc (Dodson et al. 2003). This corresponds to a fraction as low as of its ( erg s-1), a factor of ten higher than the corresponding fraction emitted in the optical, though (; Moran et al. 2014). This shows that also in the UV, like in the optical, Vela emits a lower fraction of its with respect to the very young pulsars Crab and PSR B054069.
Strictly speaking, a direct comparison with the UV luminosity of the middle-aged pulsars PSR B0656+14, Geminga, PSR B105552 (Shibanov et al. 2005; Kargaltsev et al. 2005; Mignani et al. 2010b) would not be very informative because of the difference in the underlying emission mechanisms. For the middle-aged pulsars the UV emission is dominated by thermal radiation from the cooling neutron star surface and not by non-thermal radiation from the neutron star magnetosphere, as in the case of the young Crab, Vela, and PSR B054069. The UV emission is also thermal for the Myr-old PSR B0950+08 (Pavlov et al. 2017) and the Gyr-old recycled millisecond pulsar PSR J04374715 (Kargaltsev et al. 2004), whereas for both the Myr-old PSR B1929+10 (Mignani et al. 2002) and the Gyr-old recycled millisecond pulsar PSR J21243358 (Rangelov et al. 2017) the available spectral information is not sufficient to determine whether the UV emission is thermal or non-thermal. As a further complication, in many cases the UV flux values reported in the literature have been obtained with different HST instruments, different techniques (imaging photometry or spectroscopy) and in different wavelength ranges, which makes the inferred UV luminosities not directly comparable to each other.
Therefore, given the very small sample (Crab, Vela, and PSR B054069) it is difficult to speculate about possible trends in the pulsar non-thermal UV luminosity as a function of the pulsar parameters, e.g. the surface magnetic field or the rotational energy loss . On the other hand, for the other pulsars the thermal UV luminosity is expected to be insensitive to these parameters, if emitted from a large fraction of the neutron star surface and not from hot polar caps, but to be sensitive to the temperature of the emitting region. Since in the UV we see only the RJ part of the thermal spectrum, the brightness temperature is parametrised by the second power of the ratio between the pulsar distance and the radius of the emitting region, which cannot be easily determined. Indeed, in the lack of modulations at the pulsar spin period in the thermal UV emission the only hard limit is imposed by the neutron-star radius predicted by different equations of state. This means that deriving a temperature value for comparison with, e.g. neutron star cooling models comes with significant uncertainties. For the sake of completeness, in Table 1 we reported the luminosity values for all pulsars detected in the UV regardless of the nature of the emission. For illustrative purposes, Fig. 4 shows the pulsar UV luminosity as a function of the characteristic age for all pulsars in Table 1. As it can be seen, the UV luminosity quickly drops for ages above 10 kyrs, i.e. about that of the Vela pulsar, and the trend more or less flattens above 100 kyrs. This is expected since the contribution of the UV non-thermal emission becomes less important for pulsars older than 100 kyrs. A similar trend has been found for the pulsar optical luminosity (e.g., Zharikov & Mignani 2013), marking also in this case the difference between young and middle-aged/old pulsars, although for the latter the contribution of the non-thermal emission can still be important.
4.4. The pulsar UV and optical light curves
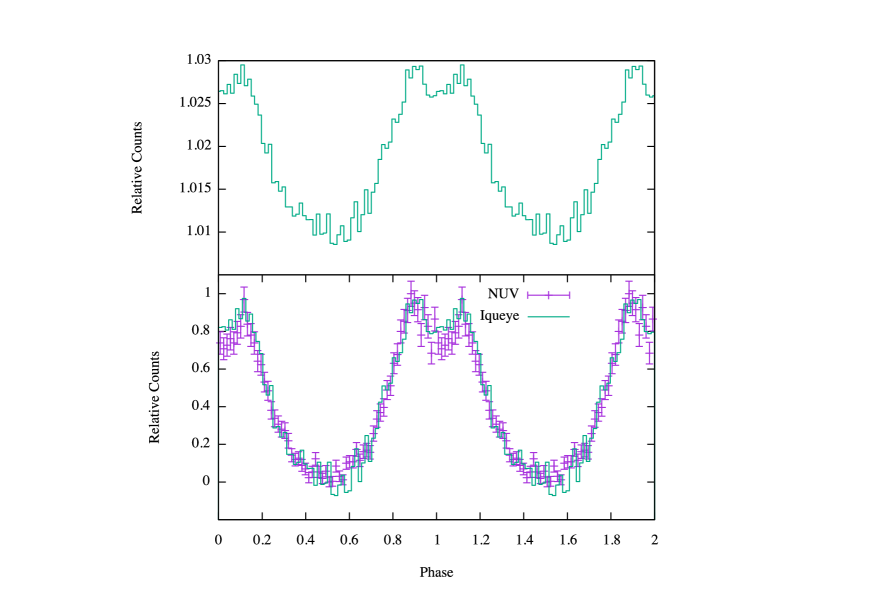
Being close in wavelength, it is natural to compare first the UV light curves of PSR B054069 to those in the optical band.141414PSR B054069 has been detected in the near-IR (Mignani et al. 2012), but pulsations in these band have not yet been measured. In the optical, its most recent light curve has been published by Gradari et al. (2011) based on data obtained with the Iqueye instrument (Naletto et al. 2009) at the ESO New Technology Telescope (NTT) on January and December 2009. Iqueye observations taken during the same observing runs were also used to produce an updated optical light curve of the Vela pulsar (Spolon et al. 2019). The PSR B054069 light curve profile clearly revealed a two-peak structure, with the two peaks separated in phase by , in agreement with all the PSR B054069 optical light curves reported in the literature (see Gradari et al. 2011 and refs. therein). Fig. 5 (top) shows the light curve built from the Iqueye data of Gradari et al. (2011), as published in Fig. 2 of Ackermann et al. (2015).
We note that Gradari et al. (2011) found possible evidence (at the level) of a third peak in the light curve interposed between the two main peaks (see their Fig. 1) but this is not visible in Fig. 5 (top). The reason behind this discrepancy, never addressed so far, is that the Iqueye data have been fully re-processed by Ackermann et al. (2015) with an upgraded version of the data reduction software, which improved the determination of the photon time of arrival. Another, and likely more important, reason is the use of a different ephemeris for the light curve folding. Gradari et al. (2011) did not have simultaneous ephemeris available and then folded and aligned the data on the basis of their own period measurements, whereas Ackermann et al. (2015) used the ephemeris derived from observations with the Rossi X-ray Timing Explorer (RXTE) Proportional Counter Array (PCA), between May 16 2008 and December 3 2011 (MJD 54602–55898). Therefore, the third peak seen in the Iqueye data by Gradari et al. (2011) was probably an artifact of the data analysis. Interestingly, this peak might correspond to that possibly seen between the two main peaks in the NUV light curve (Fig. 2, top), whose significance, however, is also marginal (see § 3.2). Although two coincidences may represent a clue, only follow-up optical/UV observations, possibly with different telescope/instrumental set-ups, can provide more convincing evidence of the existence of this putative third peak. Confirming its existence would unveil a more complex light curve morphology than initially thought, which might encode thus far missing information on the pulsar viewing and beaming angles and the structure of the optical/UV emission cone.
As it can be seen from the comparison between Fig. 2 and Fig. 5 (top), the NUV/FUV light curve profiles bear resemblance to the optical one, with two peaks separated in phase by approximately the same amount. This resemblance is more noticeable for the NUV light curve, as shown by a direct comparison in Fig. 5 (bottom), where the two peaks have similar relative intensities, as in the optical light curve. This means that the difference in the pulsar PL spectrum between the optical and the UV (§ 4.1) did not affect the light curve profile. The UV and optical light curves are also aligned in phase, although they correspond to different epochs (2017 and 2009) and have been folded using different sets of ephemerides owing to the large change in the pulsar that occurred between December 3 and December 17 2011 (Marshall et al. 2015). The UV light curves have been folded using the February 17 2015–March 28 2018 Swift/XRT ephemeris (Marshall et al., in preparation), as explained in § 3.2, whereas the optical light curve has been folded using the May 16 2008–December 3 2011 RXTE/PCA ephemeris (Ackermann et al. 2015), as explained above. A question then arises about whether the observed alignment is real or whether the large change of December 2011 might have introduced a systematic phase offset, so that the 2017 (UV) and 2009 (optical) light curves of PSR B054069 would not be directly comparable to each other. This is a key point for our analysis, aimed at determining whether the observed break between the optical/near-IR and UV PL spectra has consequences not only on the profile of the optical and UV light curves but also on their alignment in phase. Since there are no UV (optical) light curves of PSR B054069 obtained before (after) December 3 2011 for a direct comparison we cannot directly clarify this point. In the X- and -rays, however, the comparison between light curves obtained before and after the large change does not show any obvious misalignment (see § 4.5). This suggests that this event did not introduce a major phase offset, at least at high energies, and we can reasonably assume that this is also the case for the optical and UV, although our hypothesis can only be confirmed by new optical timing observations for comparison with those of Gradari et al. (2011).
Therefore, the difference in slope of the pulsar PL spectrum between the optical/near-IR and the UV, if intrinsic to the UVOIR spectrum and not ascribed to spectral/flux variability (see discussion in § 4.1), would have no consequences on the phase alignment of the optical and UV light curves. Their close resemblance (Fig. 5, bottom) independently supports the evidence based on the spectrum that, as in the optical, the UV radiation is of magnetospheric origin. In particular, it suggests that the optical and UV radiation have a very similar emission geometry, whereas the almost perfect phase alignment between the peaks suggests that the emission region in these two bands is most likely the same.
4.5. The pulsar multi-epoch light curves
As anticipated in the previous section, here we describe the results of the comparison between the X and -ray light curves of PSR B054069 obtained at different epochs, carried out in this work for the first time.
Fig. 6 shows two sets of X and -ray light curves of PSR B054069. The first set (panels a and c) corresponds to an epoch range antecedent to the beginning of 2012 (hereafter ”pre-2012”), i.e. before the large change that occurred between December 3 2011 and December 17 2011 (Marshall et al. 2015). In particular, Fig. 6a shows the RXTE/PCA X-ray light curve built by integrating all data taken between May 16 2008 and December 3 2011 (MJD 54602–55898), whereas Fig. 6c shows the Fermi/LAT -ray light curve built from contemporary data taken between August 5 2008 and December 3 2011 (MJD 54682–55898). Both the RXTE/PCA and Fermi/LAT data are the same as used in Ackermann et al. (2015). In both panels, the light curves have been folded using the pre-2012 ephemeris obtained from the full (MJD 54602–55898) RXTE/PCA data set, as done in Ackermann et al. (2015). The second set (panels b and d) corresponds to an epoch range subsequent to the end of 2014 (hereafter ”post-2014”), i.e. after the large change. The X and -ray light curves are built by integrating all data taken with the Swift/XRT between February 17 2015 and March 28 2018 (MJD 57070–58205) and with the Fermi/LAT between February 17 2015 and June 1 2018 (MJD 57070–58270), respectively. Therefore, both data sets cover the epoch range around our HST observations. The Swift/XRT data are the same as described in § 3.2 and have been partially published in Marshall et al. (2015, 2016), whereas the new Fermi/LAT data have not been published before. In both panels, the light curves have been folded using the post-2014 ephemeris obtained from the full (MJD 57070–58205) Swift/XRT data set (Marshall et al., in preparation), which has been used to fold our HST/STIS light curves (§ 3.2).
For consistency, we analyzed both the pre-2012 and post-2014 Fermi/LAT data sets, which cover virtually identical time spans ( 1200 d), using exactly the same procedure. In particular, we produced -ray light curve profiles for PSR B054069 by using Pass 8 Source class events, analyzing photons with energies above 0.1 GeV and with reconstructed directions within 8∘ of the pulsar. Events with zenith angles above 105∘ were rejected, to limit the contamination caused by the Earth’s limb. Phase calculations were carried out using the Fermi plugin (Ray et al. 2011) of TEMPO2 (Hobbs et al. 2006). In order to improve the signal-to-noise ratio of the -ray light curve for both the pre-2012 and post-2014 time intervals, we assigned weights to the individual photons using the weighting method described in Bruel et al. (in preparation). The weights give the probabilities that the individual photons originated from PSR B054069. We find that using where is the reference energy in MeV of the weighting algorithm (see Bruel et al. for a description) optimizes the signal-to-noise ratio of the profiles. The pre-2012 Fermi/LAT light curve profile (Fig. 6c), built using the weighting method described above, is consistent with that presented in Ackermann et al. (2015), indicating that we did not introduce any bias or systematic effect.
As it can be seen from the comparison between the RXTE/PCA and Swift/XRT light curves (Fig. 6a,b), the X-ray light curve profile has not changed appreciably between the two epochs. The light curves are qualitatively similar, both featuring two peaks superimposed on a broad pulse, although the RXTE/PCA light curve benefits from a better statistics. Furthermore, the two light curves appear to be essentially aligned in phase. This is also true for the pre-2012 and post-2014 Fermi/LAT light curves (Fig. 6c,d). No significant variation is observed between the pre-2012 and post-2014 LAT light curve profiles either, although the former seems to feature a more pronounced emission in the phase interval corresponding to the off-pulse region. This off-pulse emission component was already noticed by Ackermann et al. (2015), who could not determine whether this was associated with the pulsar or its PWN/SNR or with residual emission from the LMC. A more detailed analysis of the -ray data, which is beyond the goals of this work, is needed to determine how the significance of this excess depends on the modelling and subtraction of the background, on the binning used in the light curve, and, peraphs, on the count statistics.
Ours is the first high-energy follow-up of PSR B054069 after its large change (Marshall et al. 2015). The above comparison shows that this event did not introduce either a major phase offset or profile variation in the pulsar light curves, implying that the emission geometry did not change appreciably between the two explored epoch ranges. Furthermore, the comparison between two pre-2012 and post-2014 Swift/XRT observations (§ 4.1) shows that the change did not introduce a variation in the X-ray flux. A qualitative comparison of the counts in the pre-2012 and post-2014 Fermi/LAT light curves (Fig. 6c,d), which are directly comparable to each other (see above), suggests that no variation has occurred in the -ray flux either. This conclusion will be verified by an in-depth analysis of the two Fermi/LAT data sets, whose results will be published in a follow-up paper. Therefore, based on current evidence, we conclude that the event had no consequence on the pulsar high-energy emission properties.
4.6. The pulsar multi-wavelength light curves
Here, we briefly describe the comparison between the optical/UV and the X/-ray light curves and discuss the implications on our understanding of the pulsar emission geometry.
In general, the UV light curves of PSR B054069 (Fig. 2) fit very well the picture of a multi-wavelength light curve profile characterised by a broad pulse with two peaks, as emerged from optical (Fig. 5) and X-ray (Fig. 6a,b) observations; see Fig. 2 of Ackermann et al. (2015). There is no noticeable shift in the pulse phase across the UV/optical/X-ray light curves and there is no evidence of a variation either in the peak separation or in the relative peak intensity as a function of energy. These two peaks are not apparent in the -ray light curve (Fig. 6c,d), though, possibly because of the lower count statistics and larger errors, whereas the alignment in phase with the UV/optical/X-ray light curves is maintained. For comparison, Fig. 6d shows the PSR B054069 radio light curve at 1.4 GHz obtained in August 2003 from the Parkes radio telescope (Johnston et al. 2004), also shown in Ackermann et al. (2015). Unfortunately, owing to the pulsar faintness in radio, it was not possible to obtain more recent observations. Indeed, the radio light curve shown in Fig. 6d, the last to be published, was built exploiting the occurrence of 18 bright giant radio pulses (Johnston et al. 2004). As it can be seen, the radio light curve profile, with two well-distinct narrow and structured peaks, is visually different from those at higher energies, suggesting a different emission geometry. Interestingly, the radio peaks are essentially aligned in phase with those observed in the X-ray, optical and UV light curves, assuming in this last case no major phase offset in radio after the large change (Marshall et al. 2015).
Such a self-similar and phase-aligned light curve profile across different energy ranges is quite remarkable if compared to other young pulsars, such as Vela (Romani et al. 2005). In particular, while the similarity of the light curve profiles suggests a similar emission geometry, their alignment in phase suggests that the pulsed multi-wavelength emission in PSR B054069 originates from regions very close to one another in the neutron star magnetosphere. A more or less self-similar and phase-aligned light curve profile across the optical–to–-ray energy ranges is also observed in the Crab pulsar. These are the only two pulsars featuring this distinctive characteristic, which strengthens the link between PSR B054069 and its ”twin”. However, the still-limited number of pulsars seen to pulsate from the optical to the -rays (five; § 3.2) makes it difficult to establish whether such an alignment is the rule or the exception. Detecting multi-wavelength pulsations from a larger pulsar sample is obviously needed to address this issue. The middle-aged ( Myrs) pulsar PSR B105552 ( ms), detected in radio, optical, UV, X-rays and -rays but not yet in the near-IR (Mignani et al. 2010b), is the most obvious target to search for UV pulsations151515The pulsar is at 4″ from a 14.6 magnitude star and it has been detected in the optical with the HST which, however, has no instrument for high-time resolution observations above 3000Å after the decommissioning of the High Speed Photometer. and compare the light curve profile with those already measured in radio, X-rays and -rays. The other young ( yrs) LMC pulsar PSR J05376910 ( ms) in the N157B SNR would be, ideally, the best target owing to an erg s-1, the largest in the pulsar family. However, so far it has eluded detections at energies other than in X-rays, where it was discovered as an X-ray pulsar (Marshall et al. 1998), and in -rays, although pulsations have not yet been detected in the latter case (Ackermann et al. 2015), whereas no radio, optical, UV counterpart has been found despite multiple attempts (e.g., Crawford et al. 2005; Mignani et al. 2005; Mignani et al. 2007).
Searching for near-IR pulsations from PSR B054069, never detected in any pulsar other than the Crab (Eikenberry et al. 1997), would be the next goal towards completing the multi-wavelength picture for this source and allow for a full band–to–band comparison with its ”twin”. In particular, high-time and spatial resolution near-IR observations would help to disentangle the light curve contribution from a possible DC component in the pulsar emission from that of the PWN background. From the comparison with our UV light curves, and with those in the optical band, also to be obtained through high-time and spatial resolution observations, it will then be possible to determine whether the DC component fraction remains constant or evolves with wavelength. As discussed in § 4.1, a different DC component contribution in the UV with respect to the optical/near-IR could help to explain the abrupt UV turnover in the pulsar spectrum.
5. Summary and Conclusions
Using the STIS-MAMAs aboard HST, we detected the LMC pulsar PSR B054069 in two near-UV bands centred around 2350Å (NUV) and 1590Å (FUV) and measured pulsations at the pulsar spin period in both bands. This is the first time that PSR B054069 has been detected and seen to pulsate in the UV. Aside from the radio, PSR B054069 is now one of the five pulsars (counting the radio-quiet Geminga) detected in five different energy bands (near-IR, optical, UV, X-rays, -rays) and seen to pulsate in at least four of them. PSR B105552, detected in all these bands but the near-IR (Mignani et al. 2010b), could be next in the list. We also detected the PSR B054069 PWN in our NUV observation, with a morphology similar to that observed in the optical and near-IR, but not in the FUV, which indicates a sharp decrease of the PWN surface brightness at shorter wavelengths.
The UV light curves of PSR B054069 feature a prominent broad pulse with two peaks very close in phase, similarly to that observed in the optical and X-rays. A significant DC component is also observed in the NUV light curve, possibly associated with unpulsed isotropic emission from the neutron star magnetosphere. Like in the Crab pulsar, the UV light curves are also aligned in phase with those in the radio, optical, X and -rays, although these are not always contemporary to one another. Thus, it seems that the large change in the spin frequency derivative that occurred at the end of 2011 (Marshall et al. 2015) did not introduce a major phase offset, as we demonstrated, at least at high energies, from the qualitative comparison between the RXTE/PCA, Swift/XRT and Fermi/LAT light curves of PSR B054069 obtained before and after the event. The pulsar UV fluxes clearly deviate from the extrapolation at shorter wavelengths of the best-fit PL to the optical/near-IR fluxes (; Mignani et al. 2012). Under the hypothesis of no long-term flux variability, this would point at an abrupt steepening of the PL spectrum in the UV (). This has not yet been observed in other pulsars and its explanation remains a challenge.
More HST observations are necessary to independently confirm the difference in the pulsar PL slope in the UV and obtain a better characterisation of the pulsar spectrum at wavelengths below 3000Å, which so far is based on our two flux measurements only. This would require multi-band UV photometry with the Advanced Camera for Survey or, better yet, UV spectroscopy observations with either the STIS or the Cosmic Origin Spectrograph. In particular, time-resolved UV spectroscopy with the STIS (125 s resolution) would enable one to better decouple the spectrum of the pulsar from that of its PWN and look, for the first time, for possible variations in the pulsar PL spectrum as a function of the neutron star rotation phase. This would be important to track possible differences in the properties of the emitting particles (density, velocity) in different regions of the neutron star magnetosphere, which are seen as the neutron star rotates.
References
- (1) Ackermann, M., Albert, A., Baldini, L., et al. 2015, Science, 365, 801
- (2) Allafort, A., Baldini, L., Ballet, J., et al. 2013, ApJL, 777, L2
- (3) Boyd, P.T., van Citters, G.W., Dolan, J.F., et al. 1995, ApJ, 448, 365
- (4) Bowyer, S. & Malina, R. F. 1991, AdSpR, 11, 205
- (5) Buccheri, R., Bennett, K.;, Bignami, G. F., et al. 1983, A&A, 128, 245
- (6) Burrows, D. N., Hill, J. E., Nousek, J. A., et al. 2005, SSRv, 120, 165
- (7) Caraveo, P. A., Bignami, G. F., Mereghetti, S., Mombelli, M. 1992, ApJ, 395, L103
- (8) Cocke, W.J., Disney, M.J., Taylor, D.J. 1969, Nature, 221, 525
- (9) Crawford, F., McLaughlin, M., Johnston, S., Romani, R., Sorrelgreen, E. 2005, Advances in Space Research, 35, 1181
- (10) De Luca, A., Mignani, R. P., Caraveo, P. A., Bignami, G. F. 2007, ApJ, 667, L77
- (11) Dodson, R., Legge, D., Reynolds, J. E., Mc Culloch, P. M. 2003, ApJ 596, 1137
- (12) Durant, M., Kargaltsev, O., Pavlov, G. G. 2011, ApJ, 743, 38
- (13) Durant, M., Kargaltsev, O., Pavlov, G. G., et al. 2012, ApJ, 746, 6
- (14) Durant, M., Kargaltsev, O., Pavlov, G. G. 2014, ApJ, 783, L22
- (15) Eikenberry, S. S., Fazio, G. G., Ransom, S. M., Middleditch, J., Kristian, J., Pennypacker, C. R.1997, ApJ, 477, 465
- (16) Ferdman, R. D., Archibald, R. F., Kaspi, V. M. 2015, ApJ, 812, 95
- (17) Fitzpatrick, E. L. 1999, PASP, 111, 63
- (18) Gold, T. 1968, Nature, 218, 731
- (19) Gordon, K. D., Clayton, G. C., Misselt, K. A., Landolt, A. U., Wolff, Michael J. 2003, ApJ, 594, 279
- (20) Gouiffes, C., Finley, J.P., Ögelman, H. 1992, ApJ, 394, 581
- (21) Gradari, S., Barbieri, M., Barbieri, C., et al. 2011, MNRAS, 412, 2689
- (22) Johnston, S., Romani, R. W., Marshall, F. E., Zhang, W. 2004, MNRAS, 355, 31
- (23) Hewish A., Bell S. J., Pilkington J. D. H., Scott P. F., Collins, R. A. 1968, Nature, 217, 709
- (24) Hill, R. J., Dolan, J. F., Bless, R. C., et al. 1997, ApJ, 486, L99
- (25) Hobbs, G. B., Edwards, R. T., Manchester, R. N. 2006, MNRAS, 369, 655
- (26) Kaaret, P., Marshall, H.L., Aldcroft, T.L., et al. 2001, ApJ, 546, 1159
- (27) Kargaltsev, O. Y., Pavlov, G. G., Romani, R. W. 2004, ApJ, 602, 372
- (28) Kargaltsev, O. Y., Pavlov, G. G., Zavlin, V. E., Romani, R. W. 2005, ApJ, 625, 307
- Kargaltsev & Pavlov (2007) Kargaltsev, O. & Pavlov, G, G. 2007, ApSS, 308, 287
- (30) Kargaltsev, O., Klingler, N., Chastain, S., Pavlov, G. G. 2017, Journal of Physics: Conference Series, Vol. 932, Issue 1
- Lundqvist et al. (2011) Lundqvist, N., Lundqvist, P., Björnsson, C.-I., et al. 2011, MNRAS, 413, 611
- (32) Maan, Y. 2015, ApJ, 815, 126
- (33) Manchester, R.N, Mar, D.P., Lyne, A.G., et al. 1993, ApJ, 1993, 403, L29
- (34) Manchester, R. N., Hobbs, G. B., Teoh, A., Hobbs, M. 2005, AJ, 129, 1993
- (35) Marshall, F. E., Gotthelf, E. V., Middleditch, J., Wang, Q. D., Zhang, W. 2004, ApJ, 603, 682
- (36) Marshall, F. E., Guillemot, L., Harding, A. K., Martin, P., Smith, D. A. 2015, ApJ, 807, L27
- (37) Marshall, F. E., Guillemot, L., Harding, A. K., Martin, P., Smith, D. A. 2016, ApJ, 827, L39
- Marshall et al. (2018) Marshall, F. E., Guillemot, L., Harding, A. K., Martin, P., Smith, D. A. 2018, American Astronomical Society Meeting Abstracts #231, #243.05
- (39) Middleditch, J. & Pennypacker, C. 1985, Nature, 313, 659
- (40) Middleditch, J., Pennypacker, C.R., Burns, M.S. 1987, ApJ, 315, 142
- (41) Mignani, R. P., Caraveo, P. A., Bignami, G. F. 1998, A&A, 332, L37
- (42) Mignani, R., De Luca, A., Caraveo, P.A., & Becker, W. 2002, ApJ, 580, L47
- (43) Mignani, R. P., Pulone, L., Iannicola, G., Pavlov, G. G., Townsley, L., Kargaltsev, O. Y. 2005, A&A, 431, 659
- (44) Mignani, R. P., Bagnulo, S., de Luca, A.et al. 2007, Ap&SS, 308, 203
- (45) Mignani, R.P., Sartori, A., De Luca, A., et al. 2010a, A&A, 515, 110
- (46) Mignani, R.P., Pavlov, G.G., Kargaltsev, O. 2010b, ApJ, 720, 1635
- (47) Mignani, R.P., 2011 AdSpR, 47, 1281
- (48) Mignani, R.P., De Luca, A., Hummel, W., et al. 2012, A&A, 544, 100
- (49) Mignani R. P., Testa, V., Marelli, M., et al., 2016a ApJ, 825, 151
- (50) Mignani, R. P., Rea, N., Testa, V., et al. 2016b, MNRAS, 461, 4317
- (51) Mignani, R. P., Paladino, R., Rudak, B., et al. 2017, ApJL, 851, L10
- (52) Moos, H. W., Cash, W. C., Cowie, L. L., et al. 2000, ApJ, 538, L1
- (53) Moran, P., Mignani, R.P., Collins, S., et al. 2013, MNRAS, 436, 401
- (54) Naletto, G., Barbieri, C., Occhipinti, T., et al. 2009, A&A, 508, 531
- (55) Nasuti, F. P., Mignani, R., Caraveo, P. A., Bignami, G. F. 1996, A&A, 314, 849
- (56) Pacini, F., Nature 1968, 219, 145
- (57) Pavlov, G. G., Rangelov, B., Kargaltsev, O., Reisenegger, A., Guillot, S., Reyes, C. 2017, ApJ, 850, 79
- (58) Percival, J. W., Biggs, J. D., Dolan, J. F., et al. 1993, ApJ, 407, 276
- (59) Petre, R., Hwang, U., Holt, S. S. 2007, ApJ, 662, 988
- (60) Proffit, C. R. 2006, The 2005 HST Calibration Workshop: Hubble After the Transition to Two-Gyro Mode, 234
- (61) Rangelov, B., Pavlov, G. G., Kargaltsev, O., et al. 2017, ApJ, 835, 264
- (62) Ray, P. S., Kerr, M., Parent, D., et al. 2011, ApJS, 194, 17
- (63) Romani, R. W., Kargaltsev, O., Pavlov, G. G. 2005, ApJ, 627, 383
- (64) Riley, A., et al. 2017, ”STIS Instrument Handbook”, Version 16.0, (Baltimore: STScI)
- (65) Sandberg, A. & Sollerman, J. 2009, A&A, 504, 525
- (66) Serafimovich, N. I., Shibanov, Yu A., Lundqvist, P., Sollerman, J. 2004, A&A, 425, 1041
- (67) Seward, F.D., Harnden, F. R. Jr., Helfand, D. J. 1984, ApJ, 287, L19
- (68) Shearer, A., Redfern, M., Pedersen, H., et al. 1994, ApJ, 423, L51
- (69) Shearer, A., Redfern, M., Gorman, G., et al. 1997, ApJ, 487, L181
- (70) Shearer, A., Golden, A., Harfst, S., et al. 1998, A&A, 335, L21
- (71) Shibanov, Y. A., Sollerman, J., Lundqvist, P., Gull, T., Lindler, D. 2005, A&A, 440, 693
- (72) Skrutskie, M. F., Cutri, R. M., Stiening, R., et al. 2006, AJ, 131, 1163
- (73) Słowikowska, A., Kanbach, G., Borkowski, J., Becker, W. 2007, in Neutron Stars and Pulsars 40 years after the discovery, MPE-Report 291, 44
- (74) Słowikowska, A., Kanbach, G., Kramer, M., Stefanescu, A. 2009, MNRAS, 397, 103
- (75) Sollerman, J., Lundqvist, P., Lindler, D., al. 2000, ApJ, 537, 861
- (76) Sollerman, J. 2003, A&A, 406, 639
- (77) Standish, E.M. 1982, A&A, 114,297
- (78) Spolon, A., Zampieri, L., Burtovoi, A., et al. 2019, MNRAS, 482, 175
- (79) Storm, J., Gieren, W., Forqué, P., et al. 2011, A&A, 534, A95
- (80) Wallace, P. T., Peterson, B. A., Murdin, P. G., et al. 1977, Nature, 266, 692
- (81) Zharikov S. & Mignani R. P. 2013, MNRAS, 435, 2227
- (82) Zyuzin, D., Shibanov, Yu., Danilenko, A., Mennickent, R. E., Zharikov, S. 2013, ApJ, 775, 101