|
|
Transition rates for slip-avalanches in soft athermal disks under quasi-static simple shear deformations† |
| Kuniyasu Saitoh,∗a,b‡ Norihiro Oyama,c Fumiko Ogushi,d,e and Stefan Ludingf | |
|
|
We study slip-avalanches in two-dimensional soft athermal disks by quasi-static simulations of simple shear deformations.
Sharp drops in shear stress, or slip-avalanches, are observed intermittently during steady state.
Such the stress drop is caused by restructuring of the contact networks, accompanied by drastic changes of the interaction forces, .
The changes of the forces happen heterogeneously in space, indicating that collective non-affine motions of the disks are most pronounced when slip-avalanches occur.
We analyze and predict statistics for the force changes, , by transition rates of the force and contact angle,
where slip-avalanches are characterized by their wide power-law tails.
We find that the transition rates are described as a -Gaussian distribution regardless of the area fraction of the disks.
Because the transition rates quantify structural changes of the force-chains, our findings are an important step towards a microscopic theory of slip-avalanches in the experimentally accessible quasi-static regime.
The mechanics of amorphous solids, e.g. glasses, ceramics, colloidal suspensions, and granular materials, is of crucial importance in engineering science 1. Continuously shearing amorphous solids, one observes plastic deformations after a yielding point, where stress exhibits intermittent fluctuations around a mean value 2. If the system consists of grains (as granular materials 3), the stress fluctuations, or so-called slip-avalanches 4, are triggered by complicated rearrangements of the constituents 5, 6, 7, 8, 9. It is difficult to make a connection between the macroscopic mechanical response, like at slip-avalanches, and the micro-scale mechanics during yielding of amorphous materials 1.
Recently, researchers have extensively studied mechanical (and rheological) properties of yielding amorphous materials 2. Especially, molecular dynamics (MD) or quasi-static (QS) simulation is a powerful tool to provide insights into the micro-structure of the materials. For example, it is found by MD simulations of soft athermal disks in two dimensions 10, 11, 12, 13, 14 (as well as particles in three dimensions 15) that the resistance to shear is a result of anisotropic force-chains, i.e. contact and force anisotropies, where probability distributions of contact forces show clear directional dependence under shear. In addition, MD and QS simulations well reproduce characteristic avalanche-size distributions 16, 17, 18, 19, 20 observed in experiments of, e.g. bulk metallic glasses 21, 22 and granular materials 23, 24, 25, 26. The merit of QS simulations is that the strain-rate is approximated to zero, which is more relevant to laboratory experiments. It is then revealed that non-affine displacements of the constituents are unusually enhanced and span the system when slip-avalanches occur 27, 28, 29. Many researchers have studied the statistics for contact forces, avalanche-sizes (stress fluctuations), and non-affine displacements, however, their connections to structural changes of force-chains, i.e. “micro-scale mechanics of amorphous solids" 30, are still unclear.
In this Communication, we investigate microscopic structural changes of force-chain networks by QS simulations. As a model of amorphous solids, we simulate disordered soft athermal disks in two dimensions. In our system, slip-avalanches are caused by restructuring of the force-chain networks (accompanied by drastic changes of the forces between the disks) under shear. These structural changes of force-chains are analyzed by introducing transition rates as previously studied for isotropic deformations 31. The transition rates describe the development of force distributions through a master equation. We find that (i) despite the anisotropic nature of the force distributions and the strain field, fluctuations of the force changes are isotropic and (ii) slip-avalanches are characterized by power-law tails of the transition rates, which are described as -Gaussian distributions regardless of the area fraction of the disks.
Numerical methods.— To study force-chains under shear, we use QS simulations of two-dimensional soft athermal disks. The interaction force between the disks ( and ) in contact is modeled by a linear elastic spring, i.e. for , where is the stiffness and is defined as the overlap between the disks with their radii, and , and interparticle distance, . To avoid crystallization, we prepare binary mixtures of the disks, where different kinds of disks have the same mass, , and different radii, and (with ratio, ). We randomly distribute the disks in a square periodic box such that the area fraction is defined as . Then, we relax the system to a static state by the FIRE algorithm 32 until the maximum of disk acceleration becomes less than with the mean disk diameter, 33, 34. In this study, we choose the area fraction higher than the value at isotropic jamming, 35.
We apply simple shear deformations to the system by the Lees-Edwards boundaries 36, where the amount of shear strain is given by with integer, , and small strain increment, . In each strain step, from to , every disk position, , is replaced with and then the system is relaxed to a new static state by FIRE. Therefore, our system is driven by quasi-static deformations 19, 27, 28, 20, 37, where the shear rate is approximately zero, . In the following, we analyze the data in steady state (the applied strain ranges between ) and scale every mass and length by and , respectively.
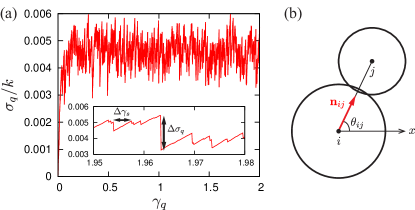
Distributions of avalanche-size and interval.— We measure the macroscopic mechanical response of the system by the shear stress. Figure 1(a) displays stress-strain curve, where the shear stress at is calculated according to the virial, i.e. . Here, () and are the -components of the unit vector, (parallel to the relative position), and the contact angle between and the -axis, respectively (see Fig. 1(b)). As shown in the inset of Fig. 1(a), the shear stress in steady state () exhibits characteristic slip-avalanches: suddenly drops to a lower value, , after the (almost) linear increase with .
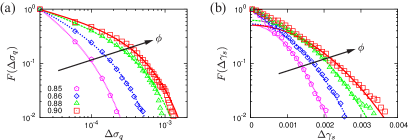
To quantify the statistics of slip-avalanches, we define avalanche-size 16, 17, 18 as for each and avalanche-interval as , where the shear stress linearly increases in the previous past steps. Figure 2 shows the cumulative distributions of (a) the avalanche-size, , and (b) avalanche-interval, 444 The cumulative distribution is introduced as , where is the probability distribution of 29., where the area fraction, , increases as indicated by the arrows. In Fig. 2(a), the distributions are well captured by a power-law with an exponential cutoff, (lines) 19. The exponent ranges from to , which is in rough accord with previous works 16, 17, 22, 19. The typical avalanche-size, , monotonously increases with . On the other hand, the distributions of the avalanche-interval decay faster than exponential, exhibiting Gaussian tails (lines in Fig. 2(b)). This means that the avalanches are uncorrelated (if ) and randomly occur in steady state. Note that both of the distributions are sensitive to the area fraction and their connections to the micro-scale mechanics are still unclear.
Non-affine responses of contact forces.— At microscopic scale, slip-avalanches are caused by changes of the micro-structure, i.e. contact and force-chain networks, accompanied by changes of the contact forces, (the arguments represent strain steps). Since we apply affine deformation to the system, where every disk position, , is replaced with in each strain step, every contact force changes to
| (1) |
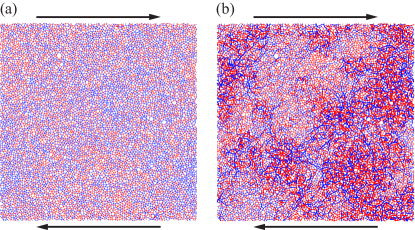
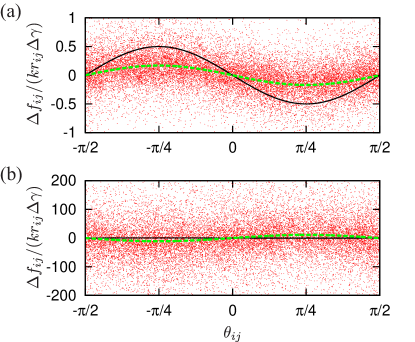
immediately after the affine deformation (see ESI†). The affine response, Eq. (1), predicts homogeneous anisotropic changes of the contact forces, e.g. slight increase and decrease in the compression () and decompression () directions, respectively. Because the disks are randomly arranged, their force balance is broken by the affine deformation. Thus, the disks are rearranged to relax the system to mechanical equilibrium. Then, the contact force changes to after the energy minimization, which we call non-affine response of the contact forces. Figure 3 displays snapshots of force-chains in situations with (a) a linear increase of the shear stress and (b) a slip-avalanche. The width of force-chains (at strain step, ) is proportional to the difference 33, 34, , while the sign is represented by color. As in Fig. 3(b), the non-affine response exhibits significantly large differences, , and a heterogeneous structure in space, when the system undergoes a slip-avalanche. Figure 4 displays the angular dependence of the difference, , where the affine response, Eq. (1), is indicated by a sinusoidal, (solid lines). In Fig. 4(a), the dependence of on is the same as for the affine response, where the mean value is given by (dashed lines). However, its amplitude, , is weakened through the relaxation process and there are huge fluctuations around . The amplitude and fluctuations extremely increase in the case of a slip-avalanche (Fig. 4(b)) 555If a slip avalanche occurs, the amplitude becomes negative, , such that and the avalanche-size is positive, .. It is also remarkable that the fluctuations are isotropic, i.e. independent of , despite the anisotropic nature of the mean value, , which is governed by the strain field.
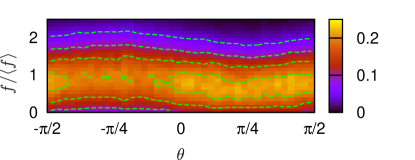
A stochastic description of the non-affine responses.— To connect the avalanche-size, , with structural changes of the force-chain networks (Fig. 3), we apply methods for the analysis of stochastic processes 38 to the non-affine responses of contact force and angle, i.e. and for . The development of the force and angle is assumed to be stochastic, i.e. and are considered as stochastic variables. Then, introducing their probability distribution function (PDF) as with , we express the shear stress as a statistical average of the virial, 10, where the subscripts, , are omitted from , , and . As shown in Fig. 5, the PDF exhibits a sinusoidal dependence on the contact angle, 11, 12, 15, 13, 14. Now, the avalanche-size is given by with the difference of the PDF, . If any correlations between the forces (angles) in different strain steps are neglected, i.e. if the stochastic processes are assumed to be Markovian, the development of the PDF is described by a master equation 38,
| (2) |
where represents another set of contact force and angle, and the shear strain, , is replaced with a continuous one, (corresponding to the limit, ). On the right-hand-side of Eq. (2), is introduced as the transition rate from to , which is directly obtained from numerical data of contact forces and angles (see ESI† for full details). Note that the master equation (2) is established and well tested for the case of isotropic (de)compression of soft athermal disks 31, 39.
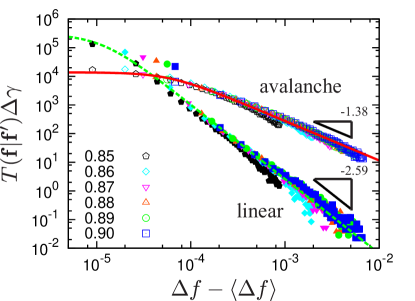
The transition rates, , are equivalent to conditional probability distributions of the force and angle (which are intuitively understood to be the distributions of (dots) around (dashed lines) in Fig. 4) divided by the strain increment 38. It quantifies the statistical weight of the changes from to . For example, the affine response, Eq. (1), is deterministic so that the transition rate is given by a delta function, i.e. with 666 The affine response of contact angle is given by in first-order approximation of the strain increment, . See also ESI†.. On the other hand, the non-affine responses fluctuate around the mean values (Fig. 4) so that the transition rates, , must have finite widths. Figure 6 shows the transition rates, where the angles are fixed to the compression direction, . In this figure, all the data with different area fractions are nicely collapsed and well fitted by the q-Gaussian distribution 6 (lines) 777Eq. (3) is a function of and . We show its three-dimensional plot in ESI†.,
| (3) |
Here, with the gamma function, , and the prefactor, , are necessary to satisfy the normalization condition, (see ESI†), where is the difference between the contact angles. The shape of the distribution is controlled by the q-index, e.g. corresponds to normal distributions. When we observe slip-avalanches (open symbols in Fig. 6), the transition rates exhibit strong non-Gaussianity with (solid line). In addition, the wide power-law tails with the exponent, , i.e. , are reminiscent of the large heterogeneous changes of force-chain networks (Fig. 3(b)). The width of the transition rate, , monotonously increases with such that drastic changes of contact force and angle tend to happen simultaneously†. Moreover, the transition rates are insensitive to the initial angle†, , consistent with isotropic fluctuations of the force change around its mean value (Fig. 4). For comparison, we also measure the transition rates for the case of linear increases of shear stress (solid symbols in Fig. 6), where (dotted line) and the power-law tails are narrowed to (but still remarkably non-Gaussian) as the force-chain networks change only slightly and more homogeneously in space (Fig. 3(a)).
Summary and outlook.— We have studied slip-avalanches in a model of amorphous solids by QS simulations. Our focus is the relationship between the avalanche-size, (a sharp drop in shear stress), and the change of contact force, . The average force change, , follows the strain field with sinusoidal dependence on the contact angle, , while the huge fluctuations of are isotropic (independent of ). The avalanche-size is connected with the PDF of contact forces and angles through a master equation, where the statistical weight of the changes of force, , and angle, , is measured by the transition rates. It is found that slip-avalanches are characterized by wide power-law tails of the transition rate, and remarkably, the transition rates are uniquely determined by a -Gaussian distribution, Eq. (3). This is in marked contrast to the avalanche-size distribution and the PDF of contact forces and angles, where both are very sensitive to the area fraction of the disks.
Because the transition rates can be used for the master equation (2), it is possible to predict the development of the shear stress by solving the master equation. Therefore, our numerical finding is useful for theoretical predictions of the rheology and mechanics of amorphous solids 40, 41, 42, 43, 44, 45, 46. In this study, however, we did not analyze the cases of opening (breaking) contacts, , and closing contacts, . These contact changes 47, 48 will introduce additional transition rates, i.e. and , in the master equation 31, which is beyond the scope of this paper and will be discussed elsewhere. Because we performed quasi-static deformations, the shear rate is approximately zero, , such that our results do not include any dynamical effects. Thus, it is interesting to study also the dependence of transition rates on finite shear rates, 49, 50. Furthermore, it is important to investigate the effects of realistic interaction forces, e.g. friction 39 and cohesive forces 51, on the transition rates and three-dimensional analyses 29 are crucial to practical applications of this study.
Acknowledgements
We thank V. Magnanimo and B.P. Tighe for fruitful discussions. This work was financially supported by KAKENHI Grant 16H04025 and 18K13464 from JSPS and the NWO-STW VICI grant 10828. F.O. was partly supported by MI2I project of the Support Program for Starting Up Innovation Hub from the JST.
Conflicts of interest
There are no conflicts to declare.
Notes and references
- Lemaitre and Chaboche 1990 J. Lemaitre and J.-L. Chaboche, Mechanics of Solid Materials, Cambridge University Press, Cambridge, UK, 1990.
- Bonn et al. 2017 D. Bonn, M. M. Denn, L. Berthier, T. Divoux and S. Manneville, Rev. Mod. Phys., 2017, 89, 035005.
- Jaeger et al. 1996 H. Jaeger, S. Nagel and R. Behringer, Rev. Mod. Phys., 1996, 68, 1259.
- Uhl et al. 2015 J. T. Uhl, S. Pathak, D. Schorlemmer, X. Liu, R. Swindeman, B. A. W. Brinkman, M. LeBlanc, G. Tsekenis, N. Friedman, R. Behringer, D. Denisov, P. Schall, X. Gu, W. J. Wright, T. C. Hufnagel, A. T. Jennings, J. R. Greer, P. K. Liaw, T. Becker, G. Dresen and K. A. Dahmen, Sci. Rep., 2015, 5, 16493.
- Radjai and Roux 2002 F. Radjai and S. Roux, Phys. Rev. Lett., 2002, 89, 064302.
- Combe et al. 2015 G. Combe, V. Richefeu, M. Stasiak and A. P. F. Atman, Phys. Rev. Lett., 2015, 115, 238301.
- Saitoh and Mizuno 2016 K. Saitoh and H. Mizuno, Soft Matter, 2016, 12, 1360.
- Saitoh and Mizuno 2016 K. Saitoh and H. Mizuno, Phys. Rev. E, 2016, 94, 022908.
- Saitoh and Mizuno 2017 K. Saitoh and H. Mizuno, Phys. Rev. E, 2017, 96, 012903.
- Radjai et al. 1998 F. Radjai, D. E. Wolf, M. Jean and J.-J. Moreau, Phys. Rev. Lett., 1998, 80, 61.
- Snoeijer et al. 2006 J. H. Snoeijer, W. G. Ellenbroek, T. J. H. Vlugt and M. van Hecke, Phys. Rev. Lett., 2006, 96, 098001.
- Voivret et al. 2009 C. Voivret, F. Radjai, J.-Y. Delenne and M. S. E. Youssoufi, Phys. Rev. Lett., 2009, 102, 178001.
- Azéma et al. 2017 E. Azéma, S. Linero, N. Estrada and A. Lizcano, Phys. Rev. E, 2017, 96, 022902.
- Estrada and Oquendo 2017 N. Estrada and W. F. Oquendo, Phys. Rev. E, 2017, 96, 042907.
- Azéma and Radjai 2014 E. Azéma and F. Radjai, Phys. Rev. Lett., 2014, 112, 078001.
- Durian 1997 D. J. Durian, Phys. Rev. E, 1997, 55, 1739.
- Tewari et al. 1999 S. Tewari, D. Schiemann, D. J. Durian, C. M. Knobler, S. A. Langer and A. J. Liu, Phys. Rev. E, 1999, 60, 4385.
- Hatano et al. 2015 T. Hatano, C. Narteau and P. Scebalin, Sci. Rep., 2015, 5, 12280.
- Maloney and Lemaître 2004 C. Maloney and A. Lemaître, Phys. Rev. Lett., 2004, 93, 016001.
- Heussinger et al. 2010 C. Heussinger, P. Chaudhuri and J.-L. Barrat, Soft Matter, 2010, 5, 12280.
- Friedman et al. 2012 N. Friedman, A. T. Jennings, G. Tsekenis, J.-Y. Kim, M. Tao, J. T. Uhl, J. R. Greer and K. A. Dahmen, Phys. Rev. Lett., 2012, 109, 095507.
- Antonaglia et al. 2014 J. Antonaglia, W. J. Wright, X. Gu, R. R. Byer, T. C. Hufnagel, M. LeBlanc, J. T. Uhl and K. A. Dahmen, Phys. Rev. Lett., 2014, 112, 155501.
- Behringer et al. 2008 R. P. Behringer, D. Bi, B. Chakraborty, S. Henkes and R. R. Hartley, Phys. Rev. Lett., 2008, 101, 268301.
- Geller et al. 2015 D. A. Geller, R. E. Ecke, K. A. Dahmen and S. Backhaus, Phys. Rev. E, 2015, 92, 060201(R).
- Denisov et al. 2016 D. V. Denisov, K. A. Lörincz, J. T. Uhl, K. A. Dahmen and P. Schall, Nat. Commun., 2016, 7, 10641.
- Barés et al. 2017 J. Barés, D. Wang, D. Wang, T. Bertrand, C. S. O’Hern and R. P. Behringer, Phys. Rev. E, 2017, 96, 052902.
- Maloney and Lemaître 2004 C. Maloney and A. Lemaître, Phys. Rev. Lett., 2004, 93, 195501.
- Maloney and Lemaître 2006 C. Maloney and A. Lemaître, Phys. Rev. E, 2006, 74, 016118.
- Bailey et al. 2007 N. P. Bailey, J. Schiøtz, A. Lemaître and K. W. Jacobsen, Phys. Rev. Lett., 2007, 98, 095501.
- Alexander 1998 S. Alexander, Phys. Rep., 1998, 296, 65.
- Saitoh et al. 2015 K. Saitoh, V. Magnanimo and S. Luding, Soft Matter, 2015, 11, 1253.
- Bitzek et al. 2006 E. Bitzek, P. Koskinen, F. Gähler, M. Moseler and P. Gumbsch, Phys. Rev. Lett., 2006, 97, 170201.
- Ellenbroek et al. 2006 W. G. Ellenbroek, E. Somfai, M. van Hecke and W. van Saarloos, Phys. Rev. Lett., 2006, 97, 258001.
- Ellenbroek et al. 2009 W. G. Ellenbroek, M. van Hecke and W. van Saarloos, Phys. Rev. E, 2009, 80, 061307.
- O’Hern et al. 2003 C. S. O’Hern, L. E. Silbert, A. J. Liu and S. R. Nagel, Phys. Rev. E, 2003, 68, 011306.
- Lees and Edwards 1972 A. W. Lees and S. F. Edwards, J. Phys. C: Solid State Phys., 1972, 5, 1921.
- Krijgsman and Luding 2016 D. Krijgsman and S. Luding, Comp. Part. Mech., 2016, 3, 463.
- van Kampen 2007 N. G. van Kampen, Stochastic Processes in Physics and Chemistry, 3rd edition, Elsevier B. V. Amsterdam, The Netherlands, 2007.
- Saitoh et al. 2016 K. Saitoh, V. Magnanimo and S. Luding, Comp. Part. Mech, 2016, 4, 409.
- Sethna et al. 2001 J. P. Sethna, K. A. Dahmen and C. R. Myers, Nature, 2001, 410, 242.
- Dahmen et al. 2011 K. A. Dahmen, Y. Ben-Zion and J. T. Uhl, Nat. Phys., 2011, 7, 554.
- Linz and Hänggi 1995 S. J. Linz and P. Hänggi, Phys. Rev. E, 1995, 51, 2538.
- Dahmen et al. 2009 K. A. Dahmen, Y. Ben-Zion and J. T. Uhl, Phys. Rev. Lett., 2009, 102, 175501.
- Lacks 2001 D. J. Lacks, Phys. Rev. Lett., 2001, 87, 225502.
- Lemaître 2002 A. Lemaître, Phys. Rev. Lett., 2002, 89, 064303.
- Lemaître 2002 A. Lemaître, Phys. Rev. Lett., 2002, 89, 195503.
- van Deen et al. 2014 M. S. van Deen, J. Simon, Z. Zeravcic, S. Dagois-Bohy, B. P. Tighe and M. van Hecke, Phys. Rev. E, 2014, 90, 020202(R).
- van Deen et al. 2016 M. S. van Deen, B. P. Tighe and M. van Hecke, Phys. Rev. E, 2016, 94, 062905.
- Lemaître and Caroli 2009 A. Lemaître and C. Caroli, Phys. Rev. Lett., 2009, 103, 065501.
- Salerno et al. 2012 K. M. Salerno, C. E. Maloney and M. O. Robbins, Phys. Rev. Lett., 2012, 109, 105703.
- Singh et al. 2014 A. Singh, V. Magnanimo, K. Saitoh and S. Luding, Phys. Rev. E, 2014, 90, 022202.