Models of Rosetta/OSIRIS 67P dust coma phase function
Abstract
The phase function of the dust coma of comet 67P has been determined from Rosetta/OSIRIS images (Bertini et al., 2017). This function show a deep minimum at phase angles near 100∘, and a strong backscattering enhancement. These two properties cannot be reproduced by regular models of cometary dust, most of them based on wavelength-sized and randomly-oriented aggregate particles. We show, however, that an ensamble of oriented elongated particles of a wide variety of aspect ratios, with radii 10 m, and whose long axes are perpendicular to the direction of the solar radiation, are capable of reproducing the observed phase function. These particles must be absorbing, with an imaginary part of the refractive index of about 0.1 to match the expected geometric albedo, and with porosity in the 60-70% range.
1 Introduction
One of the goals of the Rosetta mission was the characterization of the dust environment of comet 67P, with several instruments being devoted to this task. In particular, the dust phase function has been measured in the optical range from images taken by the OSIRIS cameras (Bertini et al., 2017). The phase function was retrieved in a wide range of phase angles in a time interval of about two hours. As these conditions cannot be met from the ground, the OSIRIS measurements are unique. So far, only for a handful of short-period comets observed from Earth the phase function is available, albeit being most of the times restricted to the backscattering domain (see Bertini et al., 2017, and references therein). In addition, for Earth based observations the phase angle dependence is always inherently mixed with temporal and heliocentric distance variability in the coma, so that it is often difficult to disentangle the intrinsic activity from the phase effect. Notwithstanding this, an overall agreement of the OSIRIS phase functions with those derived from the ground is found (Bertini et al., 2017).
2 The OSIRIS phase function
Bertini et al. (2017) have retrieved phase functions from OSIRIS WAC and NAC images, at varying heliocentric and nucleocentric distances, with the Orange F22 filter (effective wavelength =642.2 nm), and the Green F21 filter (=537.2 nm) (see their figure 4). During the phase function measurements, the phase angle Sun–comet-–spacecraft (i.e., the nucleus elongation) remained close to 90∘. The geometry of the observations can be seen in Figure 1b of Bertini et al. (2017).
For the purpose of comparison with models, we only consider the MTP020/071 phase function (obtained near perihelion), which is representative of most phase curves, although we also display in most figures the MTP025/092 curve (rh=2.18 au post-perihelion) for completeness. That phase curve is the one that shows the shallowest slope in the backscattering regime (see Figure 1). The corresponding spacecraft (S/C) ranges were 420 km and 80 km, respectively, indicating that the particles along the line of sight of the OSIRIS cameras were well outside the gas acceleration region (at 12 km, see Gerig et al., 2018). The large nucleocentric distances of the S/C (particularly during the perihelion measurements) and the fact that the pointing is directly away from the nucleus position would suggest that the phase function can only be minimally affected by different optical depth along distinct lines of sight. In any case, the true 3D+t nature of the dust distribution, which would be needed to obtain the optical depth along any line of sight, is unknown, and will only be unveiled by complex coupled gas and dust dynamics modeling (e.g. Crifo, 2006; Zakharov et al., 2018, and references therein).
3 Modeling the phase function
3.1 Models assuming size distributions of randomly-oriented particles
All previous models of cometary dust (e.g. Kimura et al., 2003; Bertini et al., 2007; Moreno et al., 2007; Lasue et al., 2009; Kolokolova et al., 2015; Zubko et al., 2016) are built under the hypothesis that the coma is a cloud of particles in random orientations. However, none of those models is able to reproduce the phase function curve derived from the OSIRIS images. In addition, the models based on fluffy, wavelength-sized, aggregate particles (e.g. Kimura et al., 2003) typically display a maximum in the degree of linear polarization that is too high in comparison with observations. Kimura et al. (2006) and Kolokolova & Mackowski (2012) explain this fact as a computer limitation associated to the limited amount of monomers, showing that the maximum of polarization decreases as the amount of monomers increase. A rough spheroid model has been introduced by Kolokolova et al. (2015), which consists of a wide size distribution of such spheroids. That model matches much better the observed degree of linear polarization and the color properties, but, as it has been stated, the modeled phase functions show only a modest backscattering enhancement, and have minima at phase angles much smaller than 100∘, otherwise in agreement with the composite phase function curve obtained from a compilation of ground-based observations from various comets by D. Schleicher (http://asteroid.lowell.edu/comet/dustphase.html). On the other hand, to explain accurately the observations of linear polarization versus phase angle, models of mixtures of compact and aggregate particles have been introduced by (e.g. Lasue et al., 2009; Das et al., 2011), as well as mixtures of weakly and highly absorbing agglomerated debris particles (Zubko et al., 2016).
All of those previous models assume either monodisperse distributions of wavelength-sized particles, or polydisperse distributions peaking in the submicrometer range. However, there are indications that the dominant scatterers in 67P might be larger, as indicated by the small amount of submicron and micron-sized particles detected by Rosetta/MIDAS, much less than initially expected (Mannel et al, 2017; Güttler et al., 2018). Also, the analysis of thermal spectra of the quiescent coma performed with Rosetta/VIRTIS-H implies a minimum radius of compact particles of 10 m (in combination with 25% of fluffy aggregate particles in number, whose contribution to the scattered light is minimal) (Bockelée-Morvan et al., 2017a, b). The study of the evolution of the 67P dust size distribution by Fulle et al. (2016b) confirms that the coma brightness at perihelion and later is in fact dominated by particles 100 m. In addition, the analysis of a large ground-based image dataset by Monte Carlo dust tail modeling (Moreno et al., 2017) agrees with that constraint. This model replicated tail images from the current apparition, from about 4.5 au pre-perihelion to 3 au post-perihelion, as well as trail data from the current and previous orbits. The minimum model particle size was 10 m in all cases.
Given these facts, we started by trying models having randomly-oriented particles of sizes larger than the nominal incident wavelength, assumed at =0.6 m. For this task, we used available light scattering codes such as the T-matrix code of spheroids (Mishchenko et al., 1996), the Multi-Sphere T-matrix (MSTM) code (Mackowski & Mishchenko, 2011), and the geometric optics code by Macke & Mishchenko (1996) for ellipsoids. Except for the geometric optics code, the computing time and memory requirements are a rapidly increasing functions of the size parameter, =2. This imposes strong limits to the simulations, for which we should keep the number of possible combinations of input parameters to a minimum.
One important constraint to the model is the observed geometric albedo. The nucleus geometric albedo at 649 nm is 0.06770.0039 (Fornasier et al., 2015), and it is reasonable to assume that large particles in the coma will have the same geometric albedo, provided they do not experience any change in their physical properties after ejection, such as sublimation of volatiles or fragmentation. These processes have been found to be negligible in the Rosetta studies of the 67P’s coma (Fulle et al., 2015).
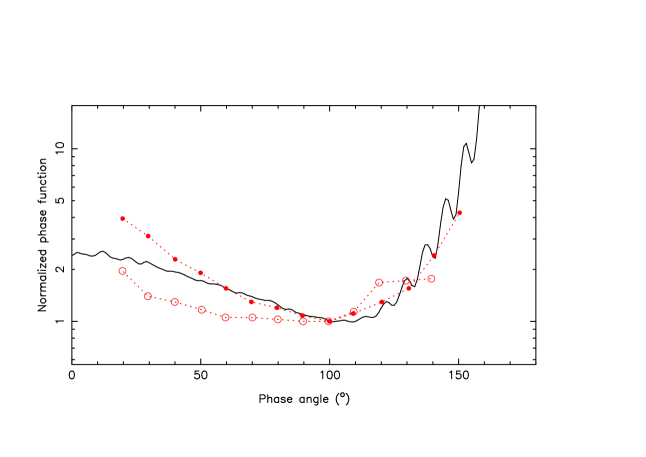
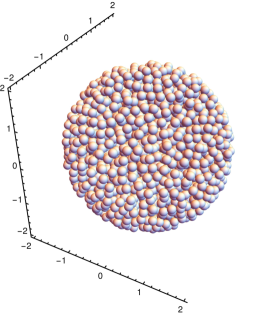
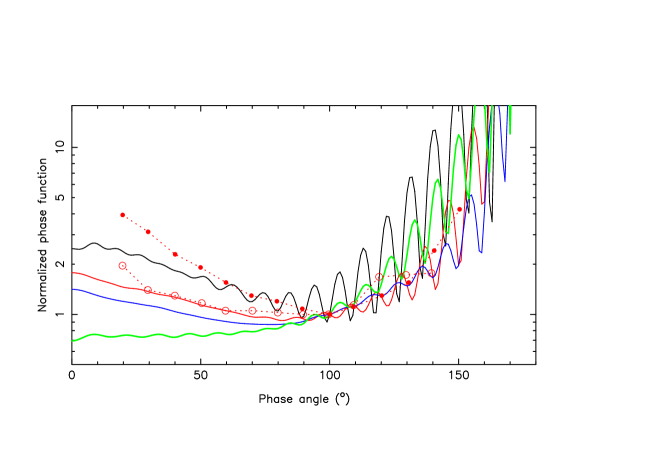
To meet the geometric albedo constraint we must assume absorbing particles. The precise value of the mean refractive index of 67P dust coma particles is unknown. We used a refractive index of =1.6+0.1, a value comprised between low-absorbing silicates and strongly absorbing organic and carbonaceous materials at red wavelengths (see e.g. Jenniskens, 1993). To calculate the scattering pattern of relatively large particles, we used the MSTM code for an array of spherules. Since we are searching for scatterers giving a high backscattering enhancement, we started by following a procedure similar to that devised by Mishchenko et al. (2007). To demonstrate the onset and development of the coherent backscattering mechanism, which is the responsible for the backscattering enhancement, Mishchenko et al. (2007) considered a certain scattering volume filled with an increasing number of small scatterers. We performed a similar calculation by considering a spherical volume of =2 m containing 500, 1000, and 2500 randomly placed 0.1-m radius spherules, giving a porosity, , of 93.7%, 87.5%, and 69.0%, respectively (see Figure 1, top panels). To obtain the scattering functions, we assumed that the array of scatterers is illuminated from a given direction, and then compute the azimuthally-averaged scattering matrix, i.e., the average scattering matrix for all the scattering planes about the direction of the incoming beam. Then, for a given number of spherules, we repeated the simulation for a large number of such randomly-generated targets. This procedure is much less CPU time consuming than generating the scattering matrix for a single randomly-oriented scatterer.
The resulting phase functions are displayed in Figure 1. Also shown are the results corresponding to a single homogeneous =2 m sphere calculated from Mie theory, just to show the large discrepancies of that simple model with the MSTM models in the phase function. Concerning the MSTM models, we see that as the number of spherules in the volume increases, the backscattering enhancement also increases. In order to check whether this trend is maintained for still lower porosities, we first increase the number of spheres up to 3100, corresponding to =61%, but we obtained very similar results to that of =69%. This =61% is essentially the lower limit reachable with our simple random packing procedure. To decrease , we had to use a more complex technique than random packing. Among the techniques available, we used a “falling down” algorithm (Fulle & Blum, 2017). With this code, we were able to generate spherical volumes having in the range 55%-45%, i.e., containing some 3600 to 4400 spherules. At these porosity levels, we noticed a reversal in the trend, i.e., a decrease in backscattering enhancement as compared with that found in the 60-70% range. We then conclude that this porosity range is the one that gives the highest backscattering enhancement. We underline that this conclusion is based on the specific spherical volume described above (see Figure 1, top panels). Larger volumes would have been desirable to test, but, as stated above, we are strongly constrained by computer memory and CPU time limitations.
It is interesting to note that the porosity range for which the highest backscattering enhancement is observed agrees with the nucleus porosity, estimated at 718% by Fulle et al. (2016a), and is also consistent with the value found specifically for the upper layers of the surface, which is below 74% from Philae SESAME/CASSE and MUPUS (Knapmeyer et al., 2018). It is also not far from the Rosetta/MIDAS and Rosetta/GIADA results for relatively compact particles (50%, see Fulle & Blum, 2017).
The following step was to explore other configurations of arrays of spherules of total size larger than the wavelength to test whether an improvement in the fits could be achieved. We built larger particles by increasing the number of spherical monomers, but owing to the limitations in computer time and memory, we had to combine larger spherical monomers with smaller ones, although we could not find a satisfactory fit in any case. An example of those configurations is shown in Figure 2, in which a cluster of four 2-m spheres is randomly peppered by a total of 2000 0.1 to 0.15 m radius spherules having a total equivalent spherical radius (radius of a sphere of equal volume), 3.4 m. This particular arrangement gives an overall better fit to the phase function, mainly for the forward lobe, but fails at reproducing the observed backscattering enhancement.
To test the performance of still larger particles, we had to resort to the geometric optics code. As mentioned, we used the code for ellipsoidal particles by Macke & Mishchenko (1996). We have tested a variety of ellipsoids of different sizes and axes ratios, but the computed phase functions are all flat at backscattering, similarly to large homogeneous spheres. In conclusion, none of the considered models of randomly-oriented particles at a wide range of sizes can reproduce reliably the OSIRIS phase function.
3.2 Models assuming size distributions of particles aligned to the solar radiation direction
The presence of aligned particles in the cometary environment has been subject of research for many years, since the early work of Dolginov & Mytrophanov (1976). In the nucleus acceleration region, comet gravity, and aerodynamic forces should dominate (Fulle et al., 2015; Ivanovksi et al., 2017a). Outside that region, radiative torques, although ignored for many years, might play an important role (see e.g. Draine & Weingartner, 1996; Lazarian, 2003; Rosenbush et al., 2007). Interestingly, alignment of the particles with respect to the solar radiation will place the long axes of the particles perpendicular to radiation (Rosenbush et al., 2007).
For the radiative torques to be efficient as the alignment mechanism, the characteristic time of alignment should be shorter than the flight time of the particles along the line of sight of the OSIRIS camera. Kolokolova et al. (2016), based on a study by Hoang & Lazarian (2014), estimate that for the 67P environment, a 10-m oblate spheroid would be aligned in 3105 s. Assuming a radial trajectory and a constant speed of 10 m s-1 (Lin et al., 2016), that particle would become aligned at a distance of 3000 km from the nucleus. Thus, it appears that this mechanism alone would not be sufficient to provide the required alignment, at least for those particles in the vicinity of the S/C. However, in addition to radiative torques, there is another mechanism that could be playing a role, which is the mechanical alignment by gas-particle relative motion (Gold, 1952) and aerodynamic force (e.g. Ivanovksi et al., 2017b). The Gold alignment mechanism, which is efficient for supersonic gas flow (as in a cometary coma, see e.g. Zakharov et al., 2018) would be characterized by particles having their longer axes directed preferentially along the gas flow due to the tendency of the particle to minimize its cross section in the gas flow (Rosenbush et al., 2007). The gas flow is radial at distances greater than about 20 km from the nucleus (Marschall et al, 2016). The particles experience this radial gas flow until the gas decoupling distance, at some 20 nuclear radii (i.e., about 30 km). After that, there is no other mechanism that can affect their orientation except radiative torque which produce alignment in the same direction - long axis perpendicular to the radiation, thus, keeping the original gas alignment. This direction is nearly perpendicular to the direction of the solar radiation for particles in the vicinity of the S/C during the perihelion phase function measurements (see Figure 1b by Bertini et al., 2017). Thus, the radiative torque and the Gold mechanism working together might explain the alignment of the particles. However, although a quantitative evaluation of the efficiency of those mechanisms in terms of the physical properties of the particles should be certainly performed, this is beyond the scope of this paper.
To model aligned scatterers, we consider that the particles have their long axes perpendicular to radiation, and calculate the azimuthally averaged scattering matrix. For these simulations, we assumed spheroidal particles, because in this way we can encompass a wide range of sizes with same geometry. The spheroids have axes (a,b,c), where a=bc for oblate, and ab=c for prolate spheroids, respectively. The axis ratio is defined as =a/c. Thus, oblate spheroids are set with the c-axis parallel to the solar radiation, and prolate spheroids are set with the a-axis perpendicular to the solar radiation.
Although we know that the dominant scatterers in 67P must be larger than the wavelength, for completeness, we performed simulations for a wider range of sizes, starting from the submicron domain. This will show that the dominant scatterers must be, in fact, much larger. Thus, for distributions of small sized particles, we used the T-matrix method for spheroids by Mishchenko et al. (1996). We start by considering oblate spheroids only, because they provide a higher backscattering enhancement than prolate spheroids for a given . In addition, oblate spheroids might indeed provide a good description of cometary dust particles as has been found from laboratory experiments by Stephens & Gustafson (1991), and recently by Bischoff et al. (2018). Both studies dealt with mixtures of volatile and refractory materials and showed that during the sublimation of volatile materials, the refractory materials form a thin mantle that eventually cracks, being lifted from the surface. Bischoff et al. show that these cracked pieces have a diameter of up to 5 to 10 times larger than the thickness of the mantle, i.e. they are flake-like particles resembling oblate spheroids of large axis ratio.
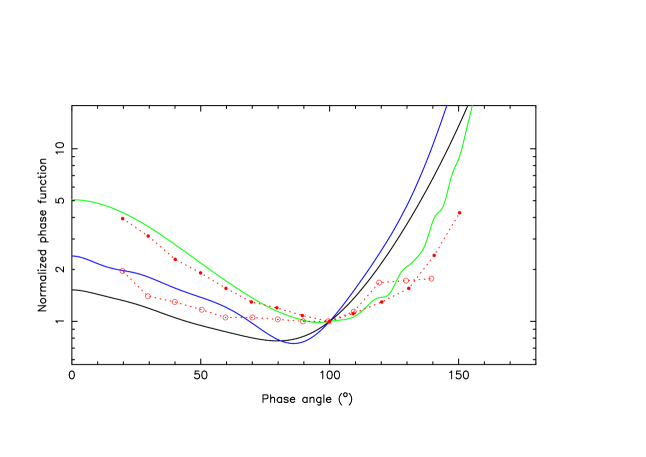
We generated scattering matrices for size distributions of such spheroidal particles, for which we assumed =2. Figure 3 shows two simulations with such spheroids being distributed according to a differential power law of index –3.5 (a typical value for 67P dust coma), and with three different values of the minimum size, 0.1, 0.3, and 1.5 m, the maximum size being rmax=2.5 m in all cases. From Figure 3, it is clear that the larger the sizes the better the agreement with the OSIRIS phase function. On the other end, submicron-dominated size distribution functions fail at fitting the phase function.
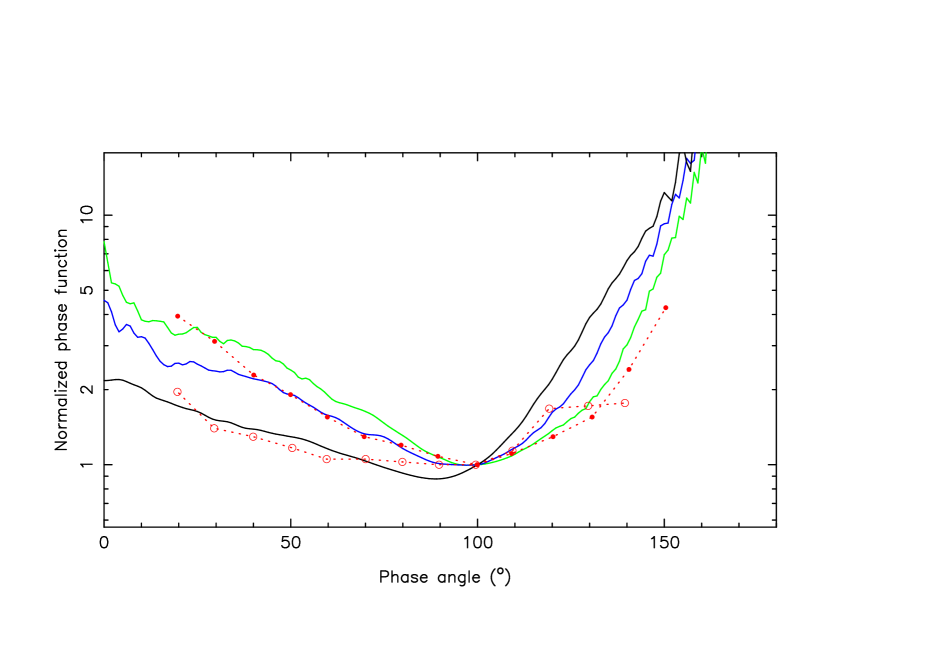
Sizes substantially larger than the maximum radius assumed in the previous model of spheroids (rmax=2.5 m with =2) cannot be efficiently handled with the T-matrix code. To build larger particles, we fill oblate spheroidal volumes with spherules of the order of the nominal wavelength or smaller, as input to the MSTM code, with an average porosity of 65-70%, i.e., near the optimal values found for the 2m spherical volume described in the previous section. We built oblate spheroidal volumes with axial ratios in the range =2-3, and with equivalent spherical radius of 3.1 m, 4.6 m, and 7.0 m, filled with approximately 1000, 1500, and 4000 spherules, respectively, where the radii of the spherules range from 0.1 to 0.6m. Owing to computing time limitations, the number of realizations for each size was limited to 256, 36, and 20, respectively. Figure 4 shows the resulting phase functions for the three sizes, where we can notice again how the agreement with the typical OSIRIS phase function tends to improve as the particle size increases, in both forward and backward lobes.
So far, only oblate spheroids up to a size of =7 m have been considered as model particles. We have to extend the upper size limit in the model to larger sizes, as measured by several instruments on board Rosetta, and inferred from the ground. In addition, we have to extend the particle shape distribution by taking into account a mixture of oblate and prolate particles, as would be required to simulate any natural dust sample. Thus, for a given equivalent spherical radius, we assumed a uniform distribution of axes ratios, i.e., the same amount of prolate and oblate spheroids.
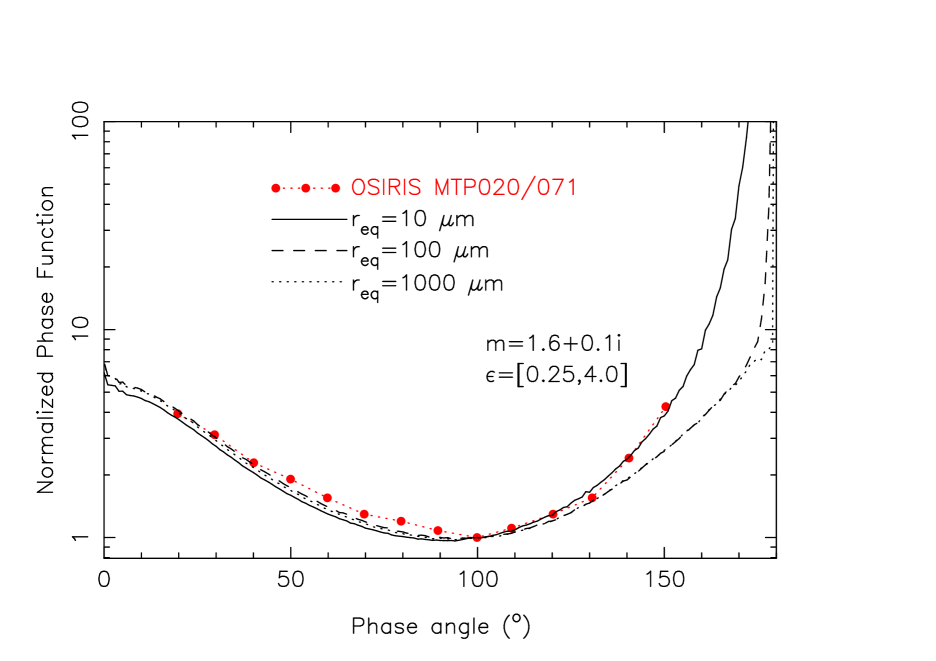
To generate the shape-averaged scattering matrix, we used the individual matrices calculated using the geometric optics code by Macke & Mishchenko (1996). Figure 5 shows a comparison of the results obtained for three equivalent spherical radii (=10 m, =100 m, and =1000 m) with the OSIRIS phase function, for a shape distribution having axes ratios in the interval =[0.25,4]. This wide axes ratio distribution is not surprising, in view of the findings by Fulle et al. (2017) who inferred aspect ratios of 5 or more in order to explain the bulk densities of the particles measured by GIADA during the whole mission.
As it is seen, the synthetic phase functions are close at backscattering, but the one for the smaller radius gives a better fit at large phase angles. In addition, the resulting geometric albedo is 0.06, very close to that obtained at the nucleus surface (Fornasier et al., 2015). The inferred particle size is consistent with the ground-based tail modeling, where differential power-law size distributions of index –3 and minimum particle radius of 10 m were found to be consistent with the observations (Moreno et al., 2017). This is also consistent with MIDAS results, where a very small amount of micron-sized particles or smaller were detected (Mannel et al, 2017; Güttler et al., 2018), and with VIRTIS-H thermal spectra modeling where minimum sizes of relatively compact 10 m particles (combined with 25% fractals in number) following a size distribution of power index –3 or smaller are found (Bockelée-Morvan et al., 2017a, b). It is also important to note that the phase function shape is maintained for up to mm-sized particles in the backscattering lobe, explaining in that way the results obtained by Fulle et al. (2018), in that the OSIRIS phase function should be applied to dust diameters up to 2.5 mm at least for the conversion of dust brightness into dust sizes.
4 Conclusions
We have shown that regular models of cometary dust based on wavelength-sized and randomly-oriented aggregate particles cannot reproduce the dust phase function determined from Rosetta/OSIRIS observations. Such phase function can, however, be adequately fitted by assuming that the main scatterers in 67P coma are large compared to the visual wavelengths (10 m), show a wide distribution of aspect ratios, and are aligned with their long axes perpendicular to the solar radiation direction. Porosity levels for the particles of 60-70% would be particularly favoured, since those particles would give the largest backscattering enhancement. For a refractive index of =1.6+0.1, the geometric albedo for such particles would be 0.06, i.e., close to that measured for the nucleus surface.
References
- Bertini et al. (2007) Bertini, I., Thomas, N., & Barbieri, C., 2007, A&A, 461, 351
- Bertini et al. (2017) Bertini, I., La Forgia, F., Tubiana, C. et al., 2017, MNRAS, 469, 404
- Bischoff et al. (2018) Bischoff, D., Gundlach, B., Neuhaus, M. et al., 2018, MNRAS, submitted
- Bockelée-Morvan et al. (2017a) Bockelée-Morvan, D., Rinaldi, G., Erard, S., et al., 2017a, MNRAS, 469, 443
- Bockelée-Morvan et al. (2017b) Bockelée-Morvan, D., Rinaldi, G., Erard, S., et al., 2017b, MNRAS, 469, 842
- Crifo (2006) Crifo, J.F., 2006, Adv. Space Res., 38, 1911
- Das et al. (2011) Das, H.S., Paul, D., Suklabaidya, A., et al., 2011, MNRAS, 416, 94
- Dolginov & Mytrophanov (1976) Dolginov, A.Z., & Mytrophanov, I.G., 1976, Astrophys. Space Sci., 43, 291
- Draine & Weingartner (1996) Draine, B.T., & Weingartner, J.C., 1996, ApJ, 470, 551
- Fornasier et al. (2015) Fornasier, S., Hasselmann, P.H., Barucci, M.A., et al., 2015, A&A, 583, 30
- Fulle et al. (2015) Fulle, M., Ivanovski, S.L., Bertini, I., et al., 2015, A&A, 583, A14
- Fulle et al. (2016a) Fulle, M., Della Corte, V., Rotundi, A., et al., 2016a, MNRAS, 462, 132
- Fulle et al. (2016b) Fulle, M., Marzari, F., Della Corte, V., et al., 2016b, ApJ, 821, 19
- Fulle & Blum (2017) Fulle, M., & Blum, J., 2017, MNRAS, 469, 39
- Fulle et al. (2017) Fulle, M., Della Corte, V., Rotundi, A., et al., 2017, MNRAS, 469, 45
- Fulle et al. (2018) Fulle, M., Bertini, I., Della Corte, V., et al., 2018, MNRAS, 476, 2835
- Gerig et al. (2018) Gerig, S.-B., Marschall, R., Thomas, N., et al., 2018, Icarus, 311, 1
- Gold (1952) Gold, T., 1952, MNRAS, 112, 215
- Güttler et al. (2018) Güttler, C., et al., 2018, in preparation
- Hoang & Lazarian (2014) Hoang, T., & Lazarian, A., 2014, MNRAS, 438, 680
- Ivanovksi et al. (2017a) Ivanovski, S.L., Della Corte, V., Rotundi, A., et al., 2017a, MNRAS, 469, 774
- Ivanovksi et al. (2017b) Ivanovski, S.L., Zakharov, V.V., Della Corte, V., et al., 2017b, Icarus, 282, 333
- Jenniskens (1993) Jenniskens, P., 1993, A&A, 274, 653
- Kimura et al. (2003) Kimura, H., Kolokolova, L., & Mann, I., 2003, A&A, 407, L5
- Kimura et al. (2006) Kimura, H., Kolokolova, L., & Mann, I., 2006, A&A, 449, 1243
- Knapmeyer et al. (2018) Knapmeyer, M., Fischer, H.-H., Knollenberg, J., et al., 2018, Icarus, 310, 165
- Kolokolova & Mackowski (2012) Kolokolova, L., & Mackowski, D., 2012, J. Quant. Spectrosc. Rad. Transfer, 113, 2567
- Kolokolova et al. (2015) Kolokolova, L., Das, H.S., Dubovik, O., et al., 2015, Planet. Space Sci., 116, 30
- Kolokolova et al. (2016) Kolokolova, L., Koenders, C., Goetz, C., et al., 2016, MNRAS, 462, 422
- Lasue et al. (2009) Lasue, J., Levasseur-Regourd, A.C., Hadamcik, E., et al. 2009, Icarus, 199, 129
- Lazarian (2003) Lazarian, A., 2003, J. Quant. Spectrosc. Rad. Transfer, 79, 881
- Levasseur-Regourd et al. (1996) Levasseur-Regourd, A.C., Hadamcik, E., & Renard, J.B., 1996, A&A, 313, 327
- Lin et al. (2016) Lin, Z.-Y., Lai, I.L., Su, C.C., et al., 2016, A&A, 588, L3
- Macke & Mishchenko (1996) Macke, A., & Mishchenko, M.I., 1996, Appl. Optics, 35, 429
- Mackowski & Mishchenko (2011) Mackowski, D.M., & Mishchenko, M.I., 2011, J. Quant. Spectrosc. Rad. Transfer, 112, 2182
- Mannel et al (2017) Mannel, T., Bentley, M.S., Boakes, P., et al., 2017, European Planetary Science Congress, id. EPSC2017-258
- Marschall et al (2016) Marschall, R., Su, C.C., Liao, Y., et al., 2016, A&A, 589, A90
- Mishchenko et al. (1996) Mishchenko, M.I., Travis, L.D., & Mackowski, D.W., 1996, J. Quant. Spectrosc. Rad. Transfer, 55, 535
- Mishchenko et al. (2007) Mishchenko, M.I., Liu, L., Mackowski, D.W., et al., 2007, Opt. Express, 15, 2822
- Moreno et al. (2007) Moreno, F., Muñoz, O., Guirado, D., et al., 2007, J. Quant. Spectrosc. Rad. Transfer, 106, 348
- Moreno et al. (2017) Moreno, F., Muñoz, O., Gutiérrez, P.J., et al., 2017, MNRAS, 469, 186
- Muñoz et al. (2017) Muñoz, O., Moreno, F., Vargas-Martín, F., et al., 2017, ApJ, 846, 85
- Rosenbush et al. (2007) Rosenbush, V., Kolokolova, L., Lazarian, A., et al., 2007, Icarus, 186, 317
- Stephens & Gustafson (1991) Stephens, J.R., & Gustafson, B.A.S., 1991, Icarus, 94, 209
- Zakharov et al. (2018) Zakharov, V.V., Ivanovski, S.L., Crifo, J.F., et al., 2018, Icarus, 312, 121
- Zubko et al. (2016) Zubko, E., Videen, G., Hines, D.C., et al., 2016, Planet. Space. Sci., 123, 63
 |
 |
 |
 |
||