Production cross section and decay study of 243Es and 249Md
Abstract
In the study of the odd-, even- nuclei 243Es and 249Md, performed at the University of Jyväskylä, the fusion-evaporation reactions 197Au(48Ca,2)243Es and 203Tl(48Ca,2)249Md have been used for the first time. Fusion-evaporation residues were selected and detected using the RITU gas-filled separator coupled with the focal-plane spectrometer GREAT. For 243Es, the recoil decay correlation analysis yielded a half-life of s, and a maximum production cross section of nb. In the same way, a half-life of s, an branching ratio of 75 5%, and a maximum production cross section of 300 80 nb were determined for 249Md. The decay properties of 245Es, the daughter of 249Md, were also measured: an branching ratio of 54 7% and a half-life of 65 6 s. Experimental cross sections were compared to the results of calculations performed using the kewpie2 statistical fusion-evaporation code.
I Introduction
Determining the boundaries of the nuclear chart, particularly in the region of super-heavy nuclei (SHN), is one of the key questions driving fundamental nuclear physics. The SHN owe their existence to shell effects as without them the Coulomb repulsion would make the nuclei beyond unstable against fission Ackermann (2017). In this context, detailed spectroscopy of very heavy nuclei (VHN) and SHN is of paramount importance to provide information on the nuclear landscape close to the high- limit of the nuclear chart, as well as on the nature of the predicted island of stability. The challenge of these experiments is related to low production cross sections and, in odd-mass nuclei, to the complexity of spectra where various collective and single-particle excitations may lie close in energy. On the other hand, the studies of odd-mass nuclei are rewarded by the wealth of information regarding single-particle states, exceeding what can be obtained for even-even nuclei Asai et al. (2015).
Regarding the known excited states of single-particle or collective nature, little data is available for Es () and Md () isotopes Asai et al. (2015); Theisen et al. (2015). Before in-beam spectroscopy of these odd- nuclei can be attempted, feasibility studies are a prerequisite, in particular, measurements of production cross sections. Such measurements also help to improve the description of the fusion-evaporation reaction mechanism, providing new constraints for the models.
In this paper, the production cross sections for 243Es and 249Md populated directly in the fusion-evaporation reactions 197Au(48Ca,2)243Es and 203Tl(48Ca,2)249Md are reported. The targets and projectiles were chosen as a compromise between the predicted production cross sections and the transmission in the separator. In particular, very asymmetric reactions using actinide targets were not considered, as in such cases: (i) The large angular dispersion due to the low recoil velocity and neutron emission results in a poor transmission, (ii) the low recoil energy reduces the detection efficiency at the focal plane, both effects being not fully compensated by enhanced cross sections.
The present study also allowed the half-lives and decay properties of these nuclei to be updated as well as those of 245Es, populated by the decay of 249Md. It should be noted that -decay branching ratios and, to a lesser extent, half-lives are needed to deduce production cross sections. Finally, the measured production cross sections for 243Es and 249Md are discussed in the context of the region and compared to the predictions of the kewpie2 statistical fusion-evaporation code Lü et al. (2016).
II Experimental setup
The experiments were performed at the Accelerator Laboratory of the University of Jyväskylä (JYFL). The fusion-evaporation residues, including 243Es and 249Md, were separated from the fission fragments, the primary 48Ca beam and the beam- and target-like reaction products using the Recoil Ion Transport Unit (RITU) gas-filled separator Leino et al. (1995); Sarén et al. (2011), which was operated at a He pressure of 0.4 - 0.6 mbar. The RITU transmission is estimated to be approximately 30% for the reactions considered here. The beam current was measured at regular intervals using a Faraday cup and monitored using the detectors counting rate, thus, allowing the beam dose to be deduced with an uncertainty of 20%.
At the focal plane of RITU, the separated fusion-evaporation residues were first detected in a position-sensitive multi-wire proportional counter (MWPC) and then implanted in two adjacent double-sided silicon strip detectors (DSSDs), both detectors being part of the Gamma Recoil Electron Alpha-Tagging (GREAT) spectrometer Page et al. (2003). The MWPC provided a time-of-flight (ToF) and energy loss () measurement, allowing: (i) selection of the fusion-evaporation residues using a ToF- identification matrix (ii) correlations with the DSSD, which enable the recoiling residues (coincidence) to be discriminated from the decay products (anti-coincidence). Each DSSD is 300 m thick and consists of strips with a 1 mm strip pitch. The side of the DSSD was calibrated using an external mixed 239Pu, 241Am, and 244Cm source. An energy offset is applied to account for the energy loss of the particle in the detector entrance window (in the case of an external source) and for the daughter nucleus recoil (decay from the detector after implantation) so that the resulting energy corresponds to the literature value for the nuclei studied in the present work. The side was amplified with a higher gain to measure low energy conversion electrons, and calibrated using an external 133Ba source. Signals from all detectors were processed by a trigger-less acquisition system known as the Total Data Readout (TDR) Lazarus et al. (2001). The recoil decay correlation analysis was performed using the software package grain Rahkila (2008): after a first selection using the ToF- identification matrix, the fusion-evaporation residues (recoils) were identified using the energy of the particles registered in the same pixel of the DSSD subsequent to the implantation of a recoil. The SAGE array Pakarinen et al. (2014) surrounded the target for the prompt gamma and conversion-electron detection, however, data from this detector were not used in the present work.
III 243Es decay properties and production cross section
III.1 Decay and half-life measurement
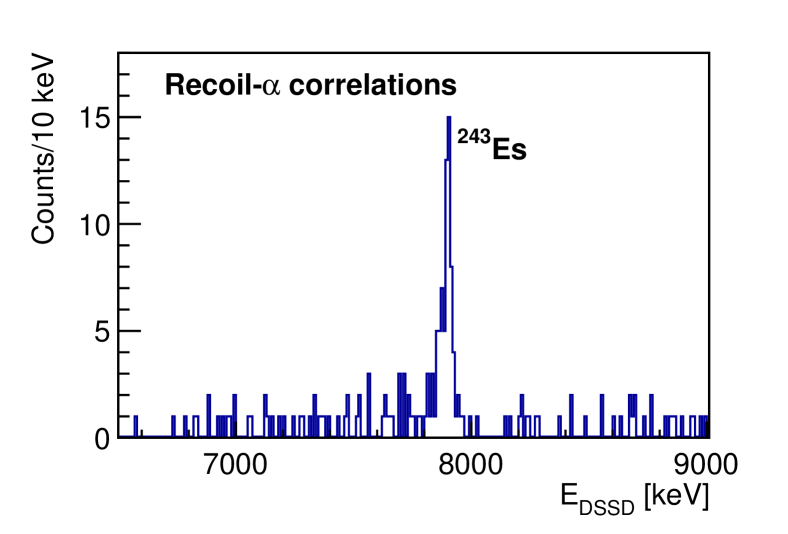
The 243Es isotope was discovered in the 1970s by Eskola et al. using the 233U(15N,5)243Es reaction Eskola et al. (1972, 1973), and later revisited in the 1990s by Hatsukawa et al. using the 233U(14N,4)243Es reaction Hatsukawa et al. (1989). A more recent study, performed with the SHIP separator at GSI by Antalic et al. Antalic et al. (2010), has shown that 243Es decays to its daughter via an -particle with an energy of 7893 10 keV, with a half-life of s and an -decay branching ratio of % . An -particle fine structure was tentatively observed with peaks at 7745 20 and 7850 20 keV. In the work of Antalic et al. 243Es was populated in the decay of the mother nucleus 247Md, whereas in the present study it was directly produced in the 197Au(48Ca,2)243Es reaction, with a 21 pnA 48Ca beam at MeV energy impinging on a 197Au target. The 48Ca + 197Au reaction has already been studied in the 1990s by Gäggeler et al. Gäggeler et al. (1989), however, few spectroscopic data were available at that time, preventing the discrimination of fusion-evaporation residues from and channels.
Fig. 1 presents the -particle energy spectrum measured in the DSSD resulting from recoil- correlations, with the decay of 243Es clearly visible.
The time distribution () of the decay with respect to the implantation, selecting the 243Es -decay energy, is presented in Fig. 2. In the inset, the time distribution is drawn as a function of using a maximum search time of 10 h. The peak at corresponds to the 243Es decay, whereas that around is related to random correlations occurring at an average time interval of 5000 s. The spectrum in the main panel can be fitted using the function Leino et al. (1981),
| (1) |
where is the decay constant of the nucleus of interest and is the random correlation rate. Similarly, the spectrum in the inset can be fitted following the method described in Ref. K. H. Schmidt (2000). As expected, both procedures give the same result, yielding the half-life of s, in agreement with the results of the experiment performed at SHIP Antalic et al. (2010).
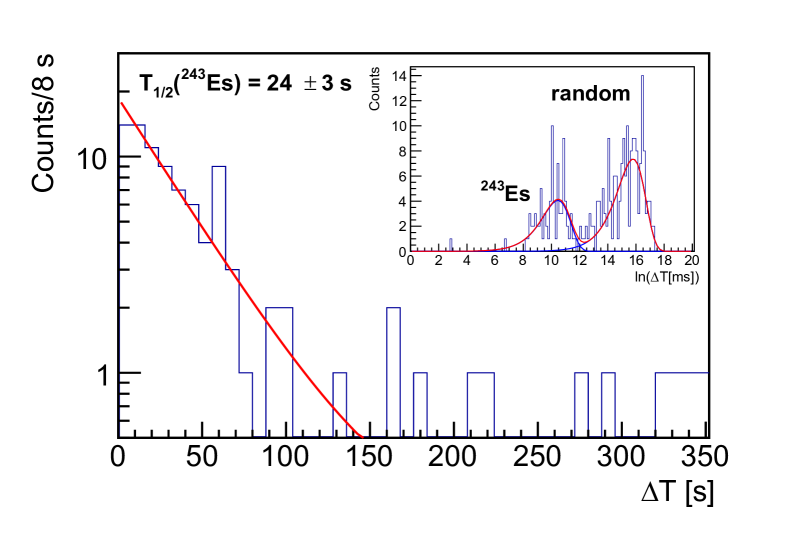
The inset of Fig. 2 demonstrates that the 243Es decay events can be well separated from the background in the defined range , which corresponds to a time window of 268 s after the recoil implantation. This search time is used in the next section in order to determine the number of events corresponding to the decay of 243Es.
The recoil-- correlations were used to search for the decay of 239Bk following the 243Es decay. The negative outcome of this search is again consistent with the results of the measurement at SHIP Antalic et al. (2010). The decay properties of nuclei studied in the present work are summarized in Table 1.
| Nucleus | Half-life (s) | -decay branching ratio (%) | Reference |
| 243Es | 24 3 | 239Bk not observed | This work |
| 23 3 | 61 6 | Antalic et al. (2010) | |
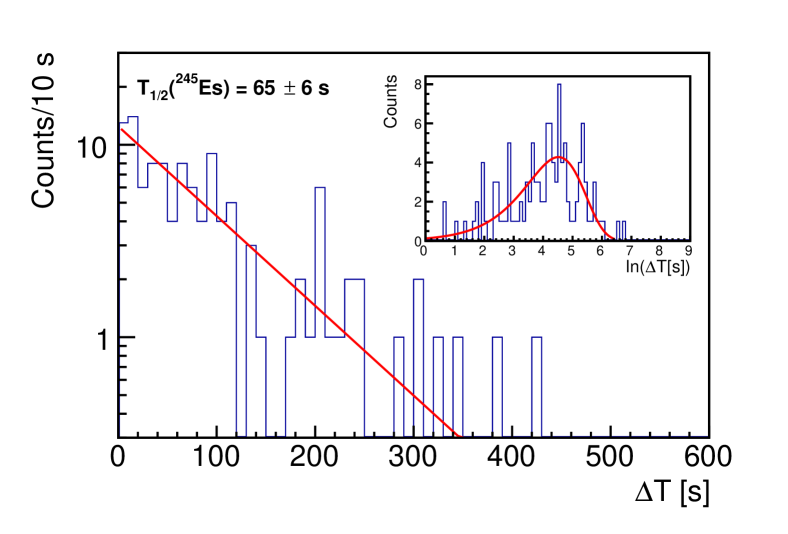
| 245Es | 65 6 | 54 7 | This work |
| 40 10 | Eskola (1973) | ||
| Heßberger et al. (1985) | |||
| 66 6 | Hatsukawa et al. (1989) | ||
| Gates et al. (2008) | |||
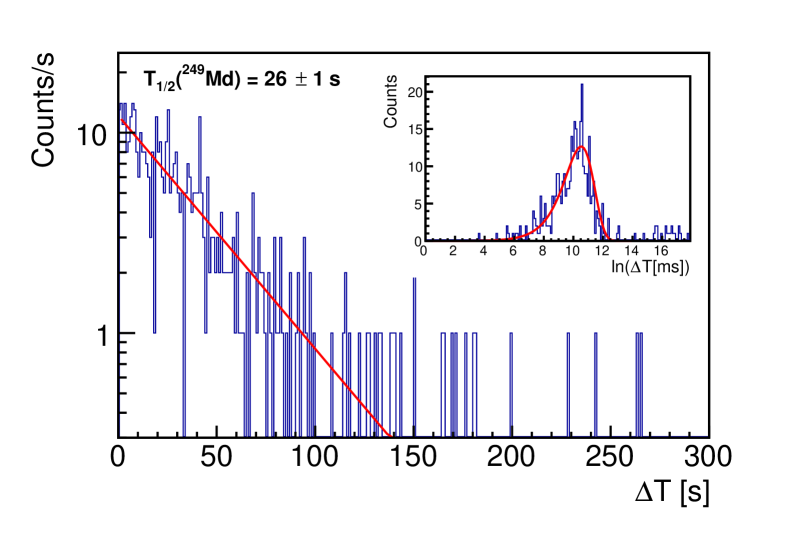
| 249Md | 26 1 | 75 5 | This work |
| 60 | Heßberger et al. (1985) | ||
| Heßberger et al. (2001) | |||
| Gates et al. (2008) | |||
| Heßberger et al. (2009) | |||
| 75 | Streicher (2006) |
III.2 Production cross section
In order to study the production cross section for 243Es using the fusion-evaporation reaction 197Au(48Ca,2)243Es, two different beam energies were used. The target used for this measurement was a g cm-2 thick 197Au self-supporting foil. The cyclotron delivered a MeV beam first passing through the 100 g cm-2 carbon window of the SAGE electron spectrometer. The first part of the study was performed with a beam energy in the Middle of the Target (MoT) estimated to be MeV. Then a carbon degrader foil of g cm-2 was placed upstream to reduce the incident energy (MoT) to MeV. The spectrum presented in Fig. 1 corresponds to the total statistics, namely with and without the degrader.
The number of counts attributed to the 243Es decay was obtained using a maximum search time of 268 s. The contribution from random correlations was estimated by integrating the random correlations component (second term in Eq. 1 in the case ) using this time window. After subtracting this background, the number of particles stemming from 243Es was determined to be 50 7 (32 6) without (with) the carbon degrader foil. The uncertainties were evaluated following the method described in Ref. W. Brüchle (2003). In the present work, the statistics is large enough to consider standard normal distributions, therefore, symmetric uncertainties are adopted.
During the acquisition time without and with the degrader, the number of 48Ca nuclei that impinged on the 197Au target was equal to ( and (, respectively. Taking into account the 197Au target thickness, the -decay branching ratio of % Antalic et al. (2010), the -detection efficiency of 55%, and assuming a RITU transmission of 30%, a production cross section Es nb was deduced for a beam energy of MeV (without the degrader), and Es nb for a beam energy of MeV (with the degrader). Only statistical uncertainties corresponding to the beam dose, number of -particles, and -decay branching ratio are given. The RITU transmission of 30% is actually a transmission detection efficiency including the transmission through the separator, the time-of-flight, and the DSSD detection efficiencies. The results are presented in Table 2.
| (MeV) | 48Ca dose | (nb) | |
|---|---|---|---|
| 210.0 1.0 | 50 7 | 37 10 | |
| 208.0 1.0 | 32 6 | 32 9 |
IV 249Md decay properties and production cross-section
The odd- nucleus 249Md was populated using the fusion-evaporation reaction 203Tl(48Ca,2)249Md in three different irradiation campaigns. The first campaign was focused on cross-section measurements at two different bombarding energies of 214.3 1.1 and 212.7 1.1 MeV. The results are reported in section IV.2. The two subsequent campaigns aimed principally at the in-beam and decay spectroscopy of 249Md, results of which will be reported in a forthcoming paper. The data collected in the three campaigns were used to derive the 245Es and 249Md half-lives and -decay branching ratios as presented in the following section.
IV.1 249Md and 245Es decay and half-life measurement
The -particle energy spectra obtained using recoil- and recoil-- correlations, with the statistics of the three campaigns summed together, are presented in Fig. 3. A maximum search time of 10 min after the identification of an implanted recoiling nucleus was used. 249Md features an electron capture (EC)/ decay branch feeding 249Fm. The decay of the latter is observed using recoil- correlations since the detection system is insensitive to the particle [see panel (a) of Fig. 3]. The 245Es decay observed using recoil- correlations corresponds to the events when the particle emitted from 249Md escapes from the DSSD without being detected. The decay of 249Fm is more clearly visible in Fig. 4, which represents the -decay time on a logarithmic scale as a function of the -particle energy. Using recoil-- correlations allows the mother, 249Md and daughter, 245Es decays to be isolated as shown in the (b) and (c) panels of Fig. 3. From the literature, the -particle energies are: Eα(249Md) keV Heßberger et al. (2009), and Eα(245Es) keV Hatsukawa et al. (1989). The satellite peaks in the decay of 249Md at 7956 and 8087 keV, suggested in Heßberger et al. (2009), are also tentatively observed in the present work.
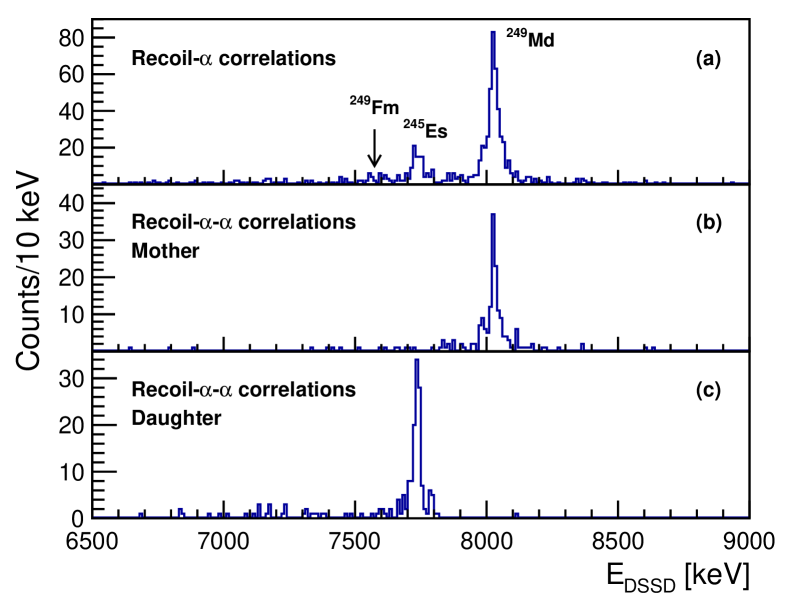
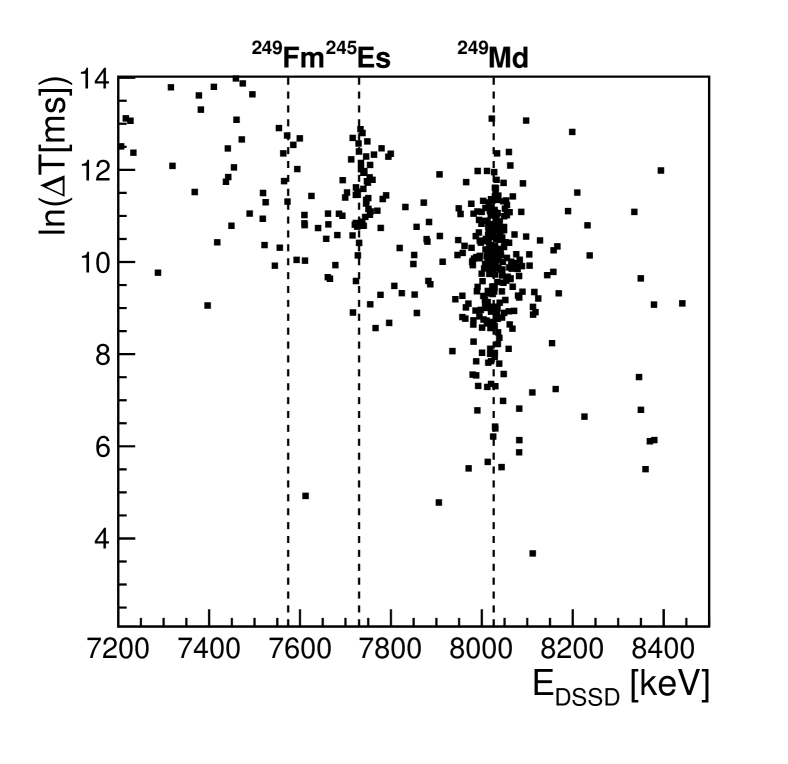
Figure 5 shows the time distribution of the 249Md decay with respect to the implantation time. The distribution plotted as a function of for a maximum search time of 24 h is shown in the inset. As shown in this plot, the random correlations are negligible, therefore, the time distribution displayed in the main panel can be fitted with a single exponential function. A half-life s is obtained using a maximum search time of 300 s. This value can be compared with previously measured half-lives. The 249Md decay has been studied at SHIP by Hessberger et al. following the decay of 257Db ( 253Lr 249Md) Heßberger et al. (1985, 2001) and the decay of 253Lr Heßberger et al. (2009), and by Gates et al. using the Berkeley Gas-Filled Separator following the decay of 257Db Gates et al. (2008). Our revised half-life of 249Md obtained via direct production and with higher statistics is compatible with the values obtained in these works: s Heßberger et al. (1985), s Heßberger et al. (2001), s Heßberger et al. (2009), s Gates et al. (2008); see also Table 1.
Similarly, Fig. 6 presents the time distribution of the 245Es decay with respect to that of 249Md, the time represented in both linear and as a function of scales. Again, the background is found to be negligible. The distribution was then fitted with a single component. The half-life Es) = 65 6 s was extracted, a value compatible with those obtained by Hessberger et al. following the decay of 257Db ( 253Lr 249Md 245Es): s Heßberger et al. (1985), by Hatsukawa et al. after direct synthesis using the fusion-evaporation reactions 238U(14N,7)245Es and 237Np(12C,4n)245Es: 66 6 s Hatsukawa et al. (1989), and by Gates et al. following the decay of 257Db: s Gates et al. (2008); see also Table 1.
The -decay branching ratio of 249Md is defined as the ratio of the -decay branch to 245Es, to the total decay strength, including the EC/ branch to 249Fm. The latter is evaluated using the number of events attributed to the 249Fm decay from Figs. 3 and 4, corrected for the 249Fm -decay branching ratio. A correction is also applied to take into account the fraction of 249Fm nuclei that decay during the search time of 600 s. The 249Fm half-life of 2.6 0.7 min is taken from the evaluated data Abusaleem (2011). The 249Fm -decay branching ratio of 15.6 1.0% is taken from Hessberger et al. Heßberger et al. (2012), which is more recent than the evaluation of Ref. Abusaleem (2011)111It should be noted that, in Ref. Heßberger et al. (2012), the half-life of 249Fm has not been re-measured. The value adopted in this reference is actually that of the evaluation Ref. Abusaleem (2011), i.e., 2.6 0.7 min. In the most recent nubase2016 evaluation Audi et al. (2017), the -decay branching ratio of 249Fm is taken from Ref. Abusaleem (2011) (33 9%), whereas for the half-life only the value from Heßberger et al. (2004) (96 6 s) is selected. . The resulting -decay branching ratio deduced in the present work is Md) = 75 5%. The evaluated value of Md) 60% Abusaleem (2011) corresponds to the measurement of Hessberger et al., which has been obtained in the study of the 257Db decay chain Heßberger et al. (1985). A more recent value of Md) = 75%, quoted without uncertainty in the PhD thesis of Streicher Streicher (2006), is in perfect agreement with our measurement; see also Table 1.
The -decay branching ratio of 245Es can be extracted in two distinct ways. The first possibility is to derive it as the ratio of the number of events corresponding to 249Md obtained using recoil-- and recoil- correlations, corrected for the DSSD efficiency for a full-energy measurement = 55% under the condition that the recoil-- correlations are obtained by gating on the full-energy peaks only,
| (2) |
The second option is to obtain it as the ratio of counts corresponding to 245Es and 249Md in the total -particle spectrum. Both methods lead to the same value of Es) = 54 7%. For comparison, the previously reported values were Es) = 40 10% (Eskola Eskola (1973)), Es) = % (Hessberger et al. Heßberger et al. (1985)). The decay properties of 249Md and 245Es are summarized in Table 1.
IV.2 Production cross section
The fusion-evaporation reaction 203Tl(48Ca,2)249Md was studied at two different bombarding energies. The cyclotron delivered a 218 MeV beam first passing through the 100 g cm-2 carbon window of the SAGE electron spectrometer. The 203Tl target having a thickness of 318 16 g cm-2 was evaporated on a carbon foil of 20 g cm-2, and covered by a 10 g cm-2 carbon protection layer. The resulting energy in the middle of the 203Tl target was estimated to be 214.3 1.1 MeV. Using in addition an 80 g cm-2 carbon degrader foil resulted in an energy of 212.7 1.1 MeV MoT.
The spectra were obtained using a search time of 207 s, i.e., eight 249Md half-lives. Contrary to the 243Es case, the background was found to be negligible.
The total number of 48Ca particles that impinged on the target was () for the measurement without (with) the carbon degrader foil. Using a 203Tl target thickness of 318 16 g cm-2, an branching ratio of 75 5%, a RITU transmission detection efficiency of 30% and a full-energy -detection efficiency of 55%, cross sections Md) of 300 80 nb and 70 40 nb are deduced for the incident energies of 214.3 and 212.7 MeV, respectively. Again, only statistical uncertainties are given. The results are summarized in Table 3.
| (MeV) | 48Ca dose | (nb) | |
|---|---|---|---|
| 214.3 1.1 | 63 8 | 300 80 | |
| 212.7 1.1 | 12 4 | 70 40 |
V Discussion
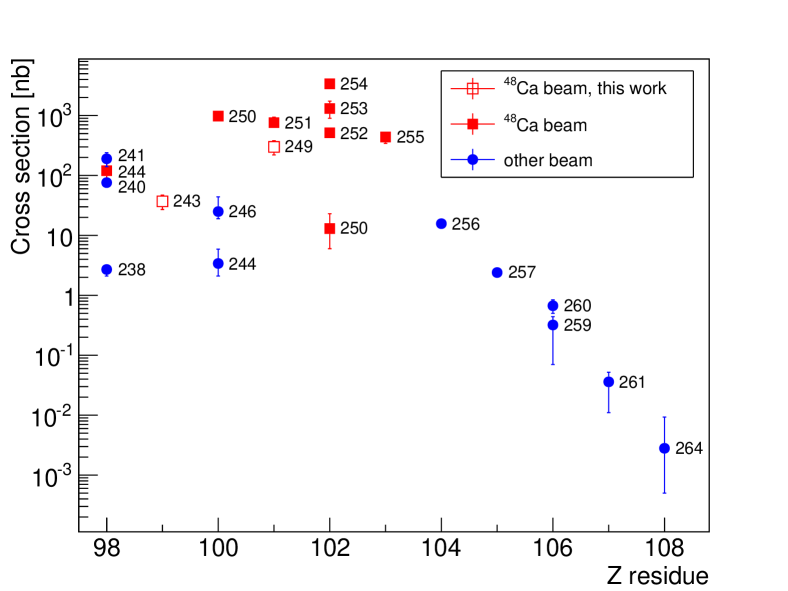
In this section we discuss the new cross-section measurements for 243Es and 249Md. These results are placed in the context of experimental cross sections for cold fusion-evaporation reactions and the 2 channel for , presented in Fig. 7 and compared to new reactions dynamics calculations using the statistical fusion-evaporation code kewpie2 Lü et al. (2016).
V.1 2 channel fusion-evaporation systematics
It is generally acknowledged that the fusion-evaporation reactions can be described as three subsequent independent processes: capture, compound-nucleus formation, and survival of the residual nucleus. The description of the capture step is rather well controlled in terms of barrier penetration, with no rapid evolution as a function of mass and charge when using similar projectiles and targets. The formation step results in a sharp decrease in the cross section for projectile-target combinations with , known as the fusion hindrance, which prevents the formation of a compound nucleus by leading the di-nuclear composite towards the quasi-fission route. This effect starts to act in the region considered here, and it can account for the exponential decrease in the cross sections observed for larger values in Fig. 7. Consequently, only the survival step can account for the decrease in cross sections below . The global trend displayed by the cross sections presented in Fig. 7 may be explained by a combination of two effects. First, the four-fold magic character of the 48Ca + 208Pb 256No∗ reaction leads to a low value and, therefore, a higher survival probability in the evaporation and de-excitation processes. This enhancement is observed for 254No and neighboring residual nuclei. Second, the semi-magicity at , leads to higher shell corrections (higher fission barrier) and, therefore, a higher survival probability around 252Fm. Note that if the cross sections are plotted as a function of the mass or neutron number, they also display a bell-shaped behavior.
V.2 Cross-section calculations
In the following, the fusion-evaporation cross sections illustrated with the new experimental results for 243Es and 249Md are discussed in terms of survival from the compound to the residual nucleus, with an emphasis on the effect of the fission barrier. The present measurements are performed in a mass region where the fusion hindrance is not yet significant. Consequently, the fusion process is modelled in the kewpie2 code by considering only the capture phase, which is computed using a proximity potential and the Wentzel-Kramers-Brillouin (WKB) approximation, see Ref. Lü et al. (2016) for details.

The kewpie2 code Lü et al. (2016) treats the competition between light-particle evaporation and fission, which occurs within an excited compound nucleus using the statistical formalisms of Weisskopf Weisskopf (1937) and Bohr-Wheeler Bohr (1939), respectively. The entire set of default parameters used in the kewpie2 code is presented in Ref. Lü et al. (2016). In the following we will only focus on a few parameters, which are not well-defined either theoretically or experimentally in this mass region Lü et al. (2016). These parameters are the reduced friction parameter , the shell-damping energy , and the shell corrections . These parameters are related to the viscosity of nuclear matter, the stability of shell corrections with temperature and the fission-barrier height, respectively, following Eq. 3 for the latter:
| (3) |
where is the fission-barrier height and is the liquid-drop fission barrier. The default values used in the kewpie2 code are s-1, MeV, whereas the finite-range droplet model (FRDM) shell corrections are taken from Ref. Möller et al. (1995). It should be stressed that those parameters mainly affect the fission process that is known to be dominant for heavy and super-heavy nuclei. Indeed, a small variation of the fission parameters, such as the strength of the dissipation or the fission-barrier heights, leads to a significant modification of the survival probability and, consequently, the related observables, in particular the production cross sections.
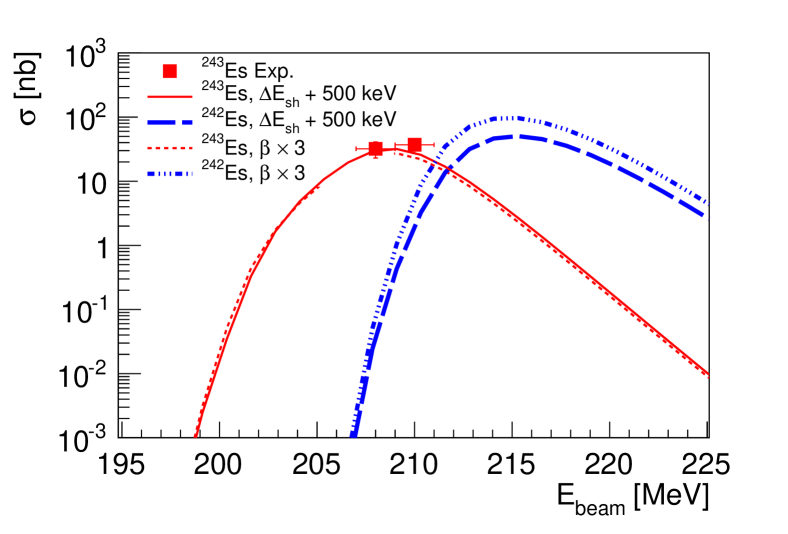
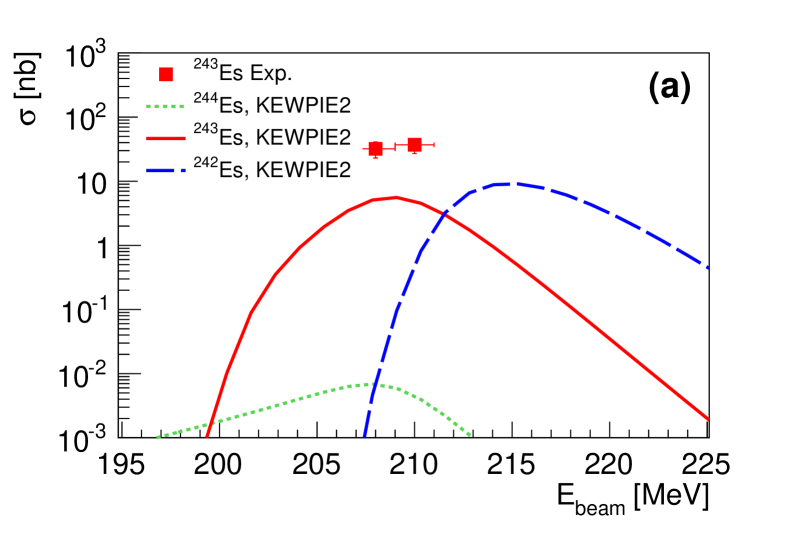
Figure 8 presents the experimental results for the production cross sections for 243Es and 249Md (Tables 2 and 3) compared to the calculations performed with the kewpie2 code using the default parameters. For 249Md, the calculation reproduces the measured production cross sections well, whereas it underestimates them by a factor of 5 for the 243Es case. The discrepancy for this latter case cannot be explained by a failure of the fusion model. Indeed, for a beam energy corresponding to the present measurement ( MeV), the fusion model provides a fusion cross section mb in good agreement with the measurement mb of Ref. Pacheco et al. (1992). Moreover, a discussion of the fusion cross-section for the 48Ca+208Pb reaction, for which the WKB approximation provides a good description without fusion hindrance considerations, can be found in Ref. Lü et al. (2016). In Fig. 9, the fission-barrier heights or the reduced friction parameters have been increased in order to reproduce the measurements for the evaporation channel. Concerning the fission-barrier heights, it is necessary to add 500 keV to the absolute value of the shell corrections [with the liquid-drop fission barrier kept unchanged, see Eq. 3], to obtain good agreement between the calculations and the data. Furthermore, the reduced friction parameter has to be increased by a factor of three, i.e., to s-1, in order to obtain the same agreement. It should be stressed that these adjustments remain within the uncertainty intervals for these parameters, as discussed in Refs. Lü et al. (2016, 2016). Moreover, no theoretical model can presently predict the fission-barrier heights with an accuracy better than MeV Heßberger (2017); Capote et al. (2009); Kowal et al. (2010). In the SHN region, differences between the models can be as large as 4 MeV Baran et al. (2015). Consequently, we cannot attribute the discrepancy observed for 243Es (Fig. 8) to any specific parameters used in the kewpie2 code nor to any inputs from other nuclear models, in particular, those related to the fission process. Hence, the measured production cross sections for the 243Es and 249Md isotopes can be fully explained within the uncertainties in nuclear models and phenomenological parametrizations implemented in the kewpie2 code.
A way to provide constraints on the parameters used in the kewpie2 code would be to use more precise measurements in the VHN and SHN mass regions for a whole set of different evaporation channels, including a large scan in excitation energy for each of them. Indeed, using relevant data can help to fix and/or eliminate the impact of a specific parameter. Such an approach based on the Bayesian inference is discussed in Lü et al. (2016); Lü (2013).
VI Conclusion
The odd- 243Es and 249Md were produced in the 197Au(48Ca,2)243Es and 203Tl(48Ca,2)249Md fusion-evaporation reactions, respectively. The half-life of 243Es, 249Md and its daughter 245Es were measured, and the results were found compatible with those obtained in previous measurements following -decay of heavier nuclei. The precisions of the half-lives of 249Md and 245Es were increased as well as those of the -decay branching ratios for those nuclei.
Production cross-sections of 243Es and 249Md have been measured for the first time using 48Ca-induced reactions and compared to the calculations performed with the kewpie2 code Lü et al. (2016).
Acknowledgements.
We acknowledge the accelerator staff at the University of Jyväskylä for delivering a high-quality beam during the experiments. The Au targets were kindly provided by GSI. Support has been provided by the EU 7th Framework Programme “Integrating Activities - Transnational Access” Project No. 262010 (ENSAR) and by the Academy of Finland under the Finnish Centre of Excellence Programme (Nuclear and Accelerator Based Physics Programme at JYFL contract No. 213503).References
- Ackermann (2017) D. Ackermann and C. Theisen, Physica Scripta 92, 083002 (2017).
- Asai et al. (2015) M. Asai, F. Heßberger, and A. Lopez-Martens, Nucl. Phys. A 944, 308 (2015).
- Theisen et al. (2015) C. Theisen, P. T. Greenlees, T.-L. Khoo, P. Chowdhury, and T. Ishii, Nucl. Phys. A 944, 333 (2015).
- Lü et al. (2016) H. Lü, A. Marchix, Y. Abe, and D. Boilley, Comput. Phys. Commun. 200, 381 (2016).
- Leino et al. (1995) M. Leino, J. Äystö, T. Enqvist, P. Heikkinen, A. Jokinen, M. Nurmia, A. Ostrowski, W. Trzaska, J. Uusitalo, K. Eskola, P. Armbruster, and V. Ninov, Nucl. Instrum. Methods Phys. Res. B 99, 653 (1995).
- Sarén et al. (2011) J. Sarén, J. Uusitalo, M. Leino, and J. Sorri, Nucl. Instrum. Methods Phys. Res. A 654, 508 (2011).
- Page et al. (2003) R. D. Page, A. N. Andreyev, D. E. Appelbe, P. A. Butler, S. J. Freeman, P. T. Greenlees, R.-D. Herzberg, D. G. Jenkins, G. D. Jones, P. Jones, et al., Nucl. Instrum. Methods Phys. Res. B 204, 634 (2003).
- Lazarus et al. (2001) I. H. Lazarus, D. E. Appelbe, P. A. Butler, P. J. Coleman-Smith, J. R. Cresswell, S. J. Freeman, R. D. Herzberg, I. Hibbert, D. T. Joss, S. C. Letts, et al., IEEE Trans. Nucl. Sci. 48, 567 (2001).
- Rahkila (2008) P. Rahkila, Nucl. Instrum. Methods Phys. Res. A 595, 637 (2008).
- Pakarinen et al. (2014) J. Pakarinen, P. Papadakis, J. Sorri, R. D. Herzberg, P. T. Greenlees, P. A. Butler, P. J. Coleman-Smith, D. M. Cox, J. R. Cresswell, P. Jones, et al., Eur. Phys. J. A 50, 53 (2014).
- Eskola et al. (1972) P. Eskola, K. Eskola, M. Nurmia, and A. Ghiorso, “Two new isotopes of einsteinium, and ,” LBL-2315 Preprint (1972).
- Eskola et al. (1973) P. Eskola, K. Eskola, M. Nurmia, and A. Ghiorso, Physica Fennica 8, 357 (1973).
- Hatsukawa et al. (1989) Y. Hatsukawa, T. Ohtsuki, K. Sueki, H. Nakahara, I. Kohno, M. Magara, N. Shinohara, H. L. Hall, R. A. Henderson, C. M. Gannet, et al., Nucl. Phys. A 500, 90 (1989).
- Antalic et al. (2010) S. Antalic, F. P. Heßberger, S. Hofmann, D. Ackermann, S. Heinz, B. Kindler, I. Kojouharov, P. Kuusiniemi, M. Leino, B. Lommel, R. Mann, and Š. Šáro, Eur. Phys. J. A 43, 35 (2010).
- Gäggeler et al. (1989) H. W. Gäggeler, D. T. Jost, A. Türler, P. Armbruster, W. Brüchle, H. Folger, F. P. Heß berger, S. Hofmann, G. Münzenberg, V. Ninov, et al., Nucl. Phys. A 502, 561 (1989).
- Leino et al. (1981) M. E. Leino, S. Yashita, and A. Ghiorso, Phys. Rev. C 24, 2370 (1981).
- K. H. Schmidt (2000) K. H. Schmidt, Eur. Phys. J. A 8, 141 (2000).
- Eskola (1973) P. Eskola, Phys. Rev. C 7, 280 (1973).
- Heßberger et al. (1985) F. P. Heßberger, G. Münzenberg, S. Hofmann, Y. K. Agarwal, K. Poppensieker, W. Reisdorf, K. H. Schmidt, J. R. H. Schneider, W. F. W. Schneider, H. J. Schött, et al., Z. Phys. A 322, 557 (1985).
- Gates et al. (2008) J. M. Gates, S. L. Nelson, K. E. Gregorich, I. Dragojević, C. E. Düllmann, P. A. Ellison, C. M. Folden III, M. A. Garcia, L. Stavsetra, R. Sudowe, D. C. Hoffman, and H. Nitsche, Phys. Rev. C 78, 034604 (2008).
- Heßberger et al. (2001) F. P. Heßberger, S. Hofmann, D. Ackermann, V. Ninov, M. Leino, G. Münzenberg, S. Saro, A. Lavrentev, A. G. Popeko, A. V. Yeremin, et al., Eur. Phys. J. A 12, 57 (2001).
- Heßberger et al. (2009) F. Heßberger, S. Hofmann, B. Streicher, B. Sulignano, S. Antalic, D. Ackermann, S. Heinz, B. Kindler, I. Kojouharov, P. Kuusiniemi, et al., Eur. Phys. J. A 41, 145 (2009).
- Streicher (2006) B. Streicher, Synthesis and spectroscopic properties of Synthesis and spectroscopic properties of transfermium isotopes with Z = 105, 106 and 107, Ph.D. thesis, Faculty of mathematics, physics and informatics. Cornelius University. Bratislava (2006).
- W. Brüchle (2003) W. Brüchle, Radiochim. Acta 91, 71 (2003).
- Abusaleem (2011) K. Abusaleem, Nucl. Data Sheets 112, 2129 (2011).
- Heßberger et al. (2012) F. P. Heßberger, S. Antalic, D. Ackermann, Z. Kalaninová, S. Heinz, S. Hofmann, B. Streicher, B. Kindler, I. Kojouharov, P. Kuusiniemi, et al., Eur. Phys. J. A 48, 75 (2012).
- Audi et al. (2017) G. Audi, F. G. Kondev, M. Wang, W. Huang, and S. Naimi, Chinese Physics C 41, 030001 (2017).
- Heßberger et al. (2004) F. P. Heßberger, S. Hofmann, D. Ackermann, P. Cagarda, R.-D. Herzberg, I. Kojouharov, P. Kuusiniemi, M. Leino, and R. Mann, Eur. Phys. J. A 22, 417 (2004).
- Khuyagbaatar et al. (2010) J. Khuyagbaatar, F. P. Heßberger, S. Hofmann, D. Ackermann, V. S. Comas, S. Heinz, J. A. Heredia, B. Kindler, I. Kojouharov, B. Lommel, et al., Eur. Phys. J. A 46, 59 (2010).
- Konki et al. (2018) J. Konki, B. Sulignano, P. T. Greenlees, C. Theisen, K. Auranen, H. Badran, R. Briselet, D. M. Cox, F. Defranchi Bisso, J. Dobaczewski, et al., Phys. Rev. C 97, 024306 (2018).
- Gäggeler et al. (1984) H. Gäggeler, T. Sikkeland, G. Wirth, W. Brüchle, W. Bögl, G. Franz, G. Herrmann, J. V. Kratz, M. Schädel, K. Sümmerer, and W. Weber, Z. Phys. A 316, 291 (1984).
- Bastin et al. (2006) J. E. Bastin, R.-D. Herzberg, P. A. Butler, G. D. Jones, R. D. Page, D. G. Jenkins, N. Amzal, P. M. T. Brew, N. J. Hammond, R. D. Humphreys, et al., Phys. Rev. C 73, 024308 (2006).
- Chatillon et al. (2007) A. Chatillon, C. Theisen, E. Bouchez, P. A. Butler, E. Clément, O. Dorvaux, S. Eeckhaudt, B. J. P. Gall, A. Görgen, T. Grahn, et al., Phys. Rev. Lett. 98, 132503 (2007).
- Peterson et al. (2006) D. Peterson, B. B. Back, R. V. F. Janssens, T. L. Khoo, C. J. Lister, D. Seweryniak, I. Ahmad, M. P. Carpenter, C. N. Davids, A. A. Hecht, et al., Phys. Rev. C 74, 014316 (2006).
- Oganessian et al. (2001) Y. T. Oganessian, V. K. Utyonkov, Y. V. Lobanov, F. S. Abdullin, A. N. Polyakov, I. V. Shirokovsky, Y. S. Tsyganov, A. N. Mezentsev, S. Iliev, V. G. Subbotin, et al., Phys. Rev. C 64, 054606 (2001).
- Dragojević et al. (2008) I. Dragojević, K. E. Gregorich, C. E. Düllmann, M. A. Garcia, J. M. Gates, S. L. Nelson, L. Stavsetra, R. Sudowe, and H. Nitsche, Phys. Rev. C 78, 024605 (2008).
- Münzenberg et al. (1985) G. Münzenberg, S. Hofmann, H. Folger, F. P. Heßberger, J. Keller, K. Poppensieker, B. Quint, W. Reisdorf, K. H. Schmidt, H. J. Schött, et al., Z. Phys. A 322, 227 (1985).
- Münzenberg et al. (1989) G. Münzenberg, P. Armbruster, S. Hofmann, F. P. Heßberger, H. Folger, J. G. Keller, V. Ninov, K. Poppensieker, A. B. Quint, W. Reisdorf, et al., Z. Phys. A 333, 163 (1989).
- Sato et al. (2011) N. Sato, H. Haba, T. Ichikawa, D. Kaji, Y. Kudou, K. Morimoto, K. Morita, K. Ozeki, T. Sumita, A. Yoneda, et al., J. Phys. Soc. Jpn. 80, 094201 (2011).
- Myers (1999) W. D. Myers and W. J. Świa¸tecki, Phys. Rev. C 60, 014606 (1999).
- Möller et al. (1995) P. Möller, J. R. Nix, W. D. Myers, and W. J. Swiatecki, At. Data Nucl. Data Tables 59, 185 (1995).
- Weisskopf (1937) V. Weisskopf, Phys. Rev. 52, 295 (1937).
- Bohr (1939) N. Bohr and J. A. Wheeler, Phys. Rev. 56, 426 (1939).
- Lü et al. (2016) H. Lü, D. Boilley, Y. Abe, and C. Shen, Phys. Rev. C 94, 034616 (2016).
- Pacheco et al. (1992) A. J. Pacheco, J. O. Fernández Niello, D. E. DiGregorio, M. di Tada, J. E. Testoni, Y. Chan, E. Chávez, S. Gazes, E. Plagnol, and R. G. Stokstad, Phys. Rev. C 45, 2861 (1992).
- Heßberger (2017) F. P. Heßberger, Eur. Phys. J. A 53, 75 (2017).
- Capote et al. (2009) R. Capote, M. Herman, P. Obložinský, P. G. Young, S. Goriely, T. Belgya, A. V. Ignatyuk, A. J. Koning, S. Hilaire, V. A. Plujko, et al., Nucl. Data Sheets 110, 3107 (2009).
- Kowal et al. (2010) M. Kowal, P. Jachimowicz, and A. Sobiczewski, Phys. Rev. C 82, 014303 (2010).
- Baran et al. (2015) A. Baran, M. Kowal, P.-G. Reinhard, L. Robledo, A. Staszczak, and M. Warda, Nucl. Phys. A 944, 442 (2015), special Issue on Superheavy Elements.
- Lü (2013) H. Lü and D. Boilley, EPJ Web of Conferences 62, 03002 (2013).