Improved Search for Heavy Neutrinos and a Test of Lepton Universality in the Decay
Two results from the PIENU Experiment are presented reporting a test of lepton universality in pion decay and improved limits on heavy neutrinos coupling to positrons. The status of the full analysis for the branching ratio measurement is summarized.
PRESENTED AT
Thirteenth Conference on the Intersections of Particle and Nuclear Physics (CIPANP2018)
Palm Springs CA, U.S.A, May 29 - June 3, 2018
1 Introduction
The PIENU experiment employs stopped pions to make a precise measurement of the branching ratio for the rare decay . Recently published results based on a subset of the data gave new limits on the hypothesis of lepton universality [1]. The experiment is also sensitive to the presence of admixtures of massive neutrinos emitted in the decay for and has set improved limits on the coupling of a to the positron () [2]. The status of the full analysis for the branching-ratio measurement is also discussed.
2 Experiment
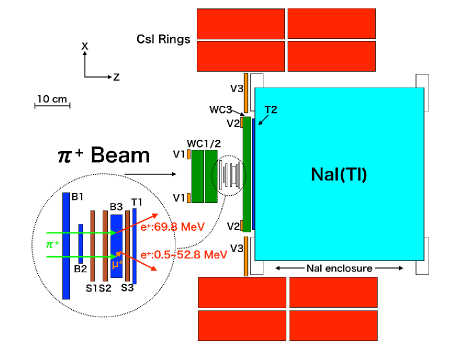
The PIENU experiment at TRIUMF used a 75 MeV/c pion beam operating with an intensity of 60 kHz and containing 14% muons and 1% positrons. The detector [3] is shown in Fig. 1. Incident pions passed through two wire chambers (WC1/2), two scintillators (B1 and B2), and two silicon strip detectors (S1 and S2) before stopping in an active target (B3). The trigger required detection of an incident pion and an outgoing positron detected by scintillators T1 and T2. Positrons came directly from decay or from the dominant pion decay mode followed by , which is referred to here as . (The muons were confined to the target where they also decayed.)
The direction of positrons from decay and from the chain was measured by S3 and WC3, and positron energies were measured in a calorimeter (NaI(Tl) plus CsI), which had 2.2% FWHM energy resolution at 70 MeV. The detector was located in an enclosure used for temperature stabilization. Data taking started in 2009 and was completed in 2012.
3 Heavy Neutrino Search
Many extensions of the Standard Model include additional massive neutrinos. The MSM includes three sterile neutrinos, two of which may have masses in the range probed by meson decays [4]. Other models (such as dark matter or thermalization) also have neutrino masses in the range [5].
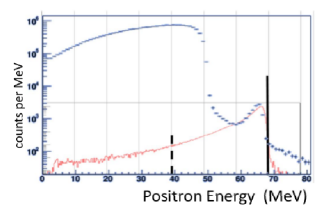
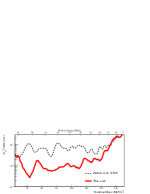
The PIENU technique to search for evidence of a heavy neutrino is illustrated in Fig. 2. The usual decay yields a monoenergetic positron with an energy of 69.8 MeV, while the analagous decay into a heavy neutrino yields a positron with reduced energy. For example, the positron has an energy of approximately 40 MeV if . In the region of positron energies below 50 MeV, the observed spectrum of positrons including detector response is dominated by positrons from the decay chain , which complicates the search.
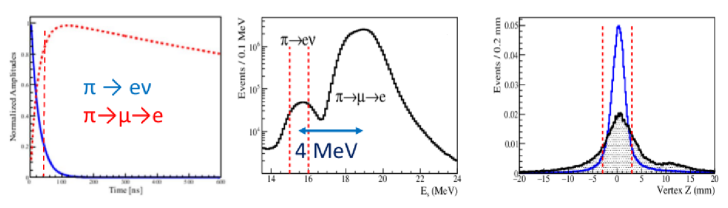
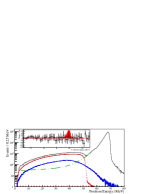
To improve the sensitivity for finding a monoenergetic positron under the background, several cuts are applied to suppress the background. As shown in Fig. 3, these cuts involve timing, target energy, and Z vertex (decay vertex position along the beam direction obtained from pion and positron tracks) measurements. The resulting spectrum is shown in the left panel of Fig. 4 as the black histogram. This suppressed spectrum is fit with known shapes to describe its components. These are also shown in Fig. 4 and include the extrapolated tail of the peak, the shape taken from late decays, and the muon decay-in-flight shape from Monte Carlo (MC) simulations. The insert shows the residuals of the fit, and an example of a heavy neutrino shape at 40 MeV for .
4 Branching Ratio
The theoretical prediction for the branching ratio, assuming lepton universality and including radiative and structure corrections [7], is
| (1) |
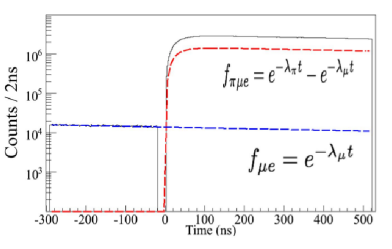
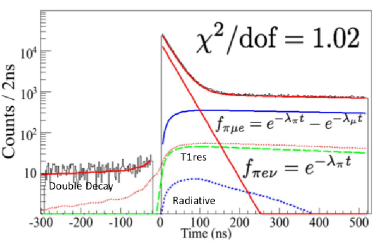
To compare with this prediction, and to test lepton universality or other deviations from the Standard Model, the observed energy spectrum of positrons (see Fig. 2) was divided into low- and high-energy portions with a cut at 52 MeV. The time spectrum of events thus separated is shown in Fig. 5. These spectra are simultaneously fitted to known component shapes to extract the branching ratio.
The fit yielded the raw branching ratio. Some corrections must be included. The dominant correction was for the events from decay with energies below the cut value. This low-energy tail was evaluated from special data taken with a monoenergetic positron beam. The result for the branching ratio, based on 12% of the data, is presented in Table 1.
| Values | Uncertainties | ||
| 1.1972 | 0.0022 | 0.0005 | |
| , lifetimes | 0.0001 | ||
| Other parameters | 0.0003 | ||
| Excluded components | 0.0005 | ||
| Corrections | |||
| Acceptance | 0.9991 | 0.0003 | |
| Low-energy tail | 1.0316 | 0.0012 | |
| Other | 1.0004 | 0.0008 | |
| 1.2344 | 0.0023 | 0.0019 | |
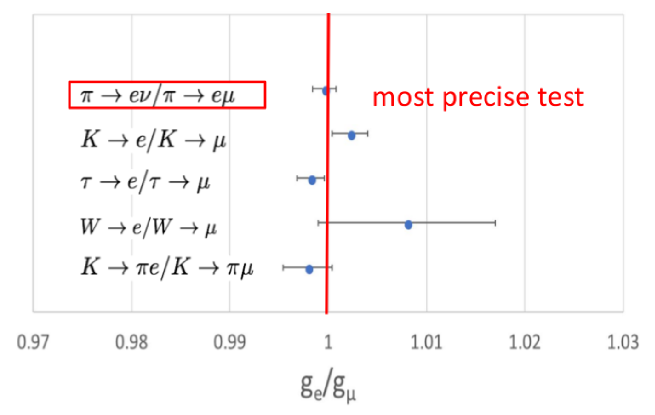
The ratio between the experimental and theoretical branching ratios provides a test of lepton universality:
| (2) |
where and are possibly distinct weak interaction coupling factors for e and .
This result, together with similar tests of lepton universality, is shown in Fig. 6. These tests are complementary to tests with decay and with heavy quarks, where the ensemble of B decay results suggest possible violations of lepton universality [8].
The analysis of the full dataset for PIENU is in the final stages. The dataset processed is about 8 times larger than for the 2015 result with about events. The value of the branching ratio will remain blinded until all cuts and systematic uncertainties have been finalized. The expected statistical uncertainty will be close to the design value of 0.1% for the branching ratio. It is dependent on the choice of cut for the solid angle, which will be an acceptance of about 20%, chosen to minimize the total uncertainty.
ACKNOWLEDGEMENTS
This work was supported by the Natural Sciences and Engineering Research Council of Canada and TRIUMF through a contribution from the National Research Council of Canada, and by Research Fund for Doctoral Program of Higher Education of China, and partially supported by KAKENHI (18540274, 21340059) in Japan. One of the authors (M.B.) was supported by US National Science Foundation Grant Phy-0553611. We are indebted to Brookhaven National Laboratory for the loan of the crystals. We would like to thank the TRIUMF detector, electronics and DAQ groups for the extensive support.
References
- [1] A. Aguilar-Arevalo , Phys. Rev. Lett. , 071801 (2015).
- [2] A. Aguilar-Arevalo , Phys. Rev. D , 072012 (2018).
- [3] A. Aguilar-Arevalo , Nucl. Instrum. Methods Phys. Res. A , 38 (2015).
- [4] A. Boyarsky, O. Ruchayskiy, and M. Shaposhnikov, Annu. Rev. Nucl. Part. Sci. , 191 (2009).
- [5] B. Bertoni, S. Ipek, D. McKeen, and A. Nelson, JHEP , 170 (2015); B. Batell, T. Han, D. McKeen, and B. Haghi, Phys. Rev. D , 075016 (2018); T. Appelquist, M. Piai, and R. Shrock, Phys. Rev. D , 015002 (2004).
- [6] D.I. Britton , Phys. Rev. D , R885 (1992).
- [7] S. Berman, Phys. Rev. Lett. , 468 (1958); T. Kinoshita, Phys. Rev. Lett. , 477 (1959); T. Goldman and W.Wilson, Phys. Rev. D , 2428 (1976); W. Marciano and A. Sirlin, Phys. Rev. Lett. , 1425 (1976); M. Terent’ev, Yad. Fiz. , 870 (1973); V.Cirigliano and I.Rosell, Phys. Rev. Lett. , 231801 (2007); D. Bryman Annu. Rev. Nucl. Part. Sci. , 331 (2011), .
- [8] See the recent summary in CERN Courier, , No. 3, 23 (2018).