marginparsep has been altered.
topmargin has been altered.
marginparwidth has been altered.
marginparpush has been altered.
The page layout violates the ICML style.
Please do not change the page layout, or include packages like geometry,
savetrees, or fullpage, which change it for you.
We’re not able to reliably undo arbitrary changes to the style. Please remove
the offending package(s), or layout-changing commands and try again.
Addressing Training Bias via Automated Image Annotation
Anonymous Authors1
Abstract
Build accurate DNN models requires training on large labeled, context specific datasets, especially those matching the target scenario. We believe advances in wireless localization, working in unison with cameras, can produce automated annotation of targets on images and videos captured in the wild. Using pedestrian and vehicle detection as examples, we demonstrate the feasibility, benefits, and challenges of an automatic image annotation system. Our work calls for new technical development on passive localization, mobile data analytics, and error-resilient ML models, as well as design issues in user privacy policies.
1 Introduction
Modern computer vision, in the forms of deep neural networks (DNNs), has promised to revolutionize many intelligent applications, from image and face recognition, to self-driving cars. With dramatically increased expressiveness, DNNs can be tailored to produce inference results of unprecedented accuracy, when they are trained on sufficient dataset.
However, there is a roadblock to the success of DNNs in real applications: building accurate DNN models requires training on large labeled, context-specific datasets Kang et al. (2017); Andriluka et al. (2018); Wang et al. (2018). DNNs trained on insufficiently labeled data have been reported to perform poorly in multiple applications Zhu et al. (2012), from sign language recognition Kim et al. (2017), facial recognition Kemelmacher-Shlizerman et al. (2016), to urban vision applications for smart-cities Mallapuram et al. (2017).
Building these training datasets, at least for urban vision tasks, is often challenging for two reasons. First, it requires manually labeling images and videos, an extremely labor-intensive task. While some have proposed using generative models to produce training data for text-based applications Ratner et al. (2017), annotation of images and videos still relies on manual annotation by humans Papadopoulos et al. (2017). The human cost is high. For example, 2.3 hours of urban video footage took 400 man-hours to label. Second and more importantly, most existing datasets, labeled or unlabeled, come from curated sources. They have inherent biases that can produce recognition failures when applied to raw data in the wild Torralba & Efros (2011). For example, labeled images often come from edited photo streams like Flickr, which introduce biases in lighting conditions, camera angle and placement, or specific subjects. In contrast, models trained on labeled training data from the same domain as classification inputs show significantly higher accuracy and/or run-time efficiency over those trained on curated datasets Gebru et al. (2017); Kang et al. (2017).
Prior work on transfer learning addresses the first problem of data scarcity, where a “teacher model” trained by a trusted party with access to large-scale data can be shared with many general users, who then use smaller local, targeted training data to incrementally train the final layers of the model, producing a “student model.” Today, transfer learning is recommended by most of the major deep learning frameworks, including Google Cloud ML, Microsoft Cognitive Toolkit, and PyTorch from Facebook.
However, this does little to address the problem of training set bias. For example, a company can customize a large pretrained facial recognition model with images of its employees, but this student model will produce significant recognition errors if it is trained with well-lit, perfectly framed headshots against a white background. This issue of domain bias is a known problem, and there are efforts in the ML community to address it using domain adaptation Gebru et al. (2017); Luo et al. (2017) and few shot learning Vinyals et al. (2016); Ravi & Larochelle (2017).
Automated Annotation during Image Capture. We believe that in many applications, e.g. pedestrian and vehicle detection, models can be extremely sensitive to domain bias, and training on labeled data from the same precise physical context as future inputs can greatly improve classification accuracy. This is a level of sensitivity that exceeds the goals of existing domain transfer techniques Gebru et al. (2017); Luo et al. (2017). This motivates us to explore a different approach, where we automatically generate annotated images using a coordinated infrastructure of wireless receivers and image capture devices (digital cameras).
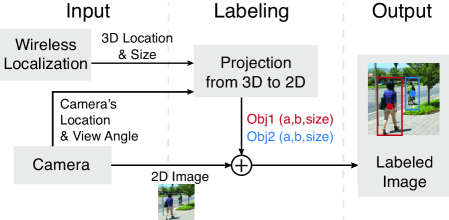
We believe advances in wireless localization have made it possible for (existing) wireless infrastructure to precisely compute the 3D location of a passive wireless device in both indoor and outdoor areas. Combined with an image capture system, this enables the automated annotation and labeling of images and videos as they are captured by cameras (see Figure 1).
We propose Atia, a system that automatically annotates images as they are being captured by a camera. Our insight is that locations of targets (e.g. pedestrians, cars, buses, drones) on a 2D captured image can be computed from their physical 3D locations relative to the camera. New wireless chipsets enable a feature called fine timing measurement (FTM) Banin et al. (2016)111FTM is supported by Intel 8260 WiFi chip and Android P OS., allowing a wireless transmitter colocated with (or even inside) the camera to send out probes that trigger responses from nearby WiFi devices at the hardware level. Any users or vehicles with an FTM-enabled 802.11mc device can be accurately localized, and its position on a newly captured image can be computed using a 3D to 2D projection.
Benefits. Wireless device localization has a number of distinct advantages over alternatives. First, this approach requires no active participation from the participant, compared to systems where participants don wearable RFIDs. Second, it has significantly longer range compared to RFIDs and similar devices. Third, wireless devices responding to FTM probes will return a device identifier, which can be used to correlate the same device or user across different images, e.g., temporal correlation of moving users across images in a sequence, or geographic correlation of the same user from images taken from different perspectives. Finally, device identifiers can be used to support “user-driven” privacy policies, including the ability to “opt-out” of image annotation for privacy reasons.
Unlike prior works that transfer labels from other domains Gebru et al. (2017); Luo et al. (2017), our goal is to automatically generate labeled “ground truth” images in the same domain and setting as future inputs. This minimizes any bias between training data and test data, that If successful, this would provide a low-cost mechanism for generating large volumes of labeled data for tasks such as pedestrian and vehicle detection, object recognition (of connected vehicles), and facial recognition (of wireless users).
Our work makes four key contributions.
-
•
We propose the use of 802.11mc FTM-enabled wireless devices, in coordination with digital cameras, to capture and automatically annotate users and vehicles with wireless devices. This system allows recognition systems to be trained or customized using domain-specific images with minimal bias.
-
•
Using pedestrian and vehicle detection as a case study, we identify practical problems in deploying automated image annotation. We identify four types of mismatch errors between human-labeled image data and automated annotations, and discuss potential efforts to address each.
-
•
Our empirical measurements show that pedestrian detection requires high quality labels beyond the precision of default 802.11 FTM hardware settings. But we show via emulation that the quality of labels improves significantly with tuned hardware settings, indicating the feasiblity of our approach in the near future.
-
•
We recognize the seriousness of issues of participant privacy and consent in automated image annotation, and present some initial discussion in §7.
2 Motivation and Related Work
In this section, we perform experiments on real datasets to evaluate the impact of physical context on image recognition accuracy. We then discuss and differentiate our proposal from related work in the space.
2.1 Background: Pedestrian and Vehicle Detection
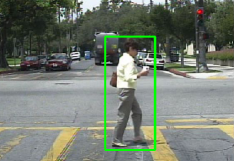
Our experiments focus on two popular computer vision tasks: pedestrian detection and vehicle detection. Here we briefly introduce them and the corresponding datasets used for ML model training and testing. Both tasks are critical components for modern applications like self-driving vehicles and urban traffic management in smart cities. For both tasks, object annotation is an effort-intensive human task, where training data is created by annotators who mark the boundary of each pedestrian in images using a bounding box (Figure 2).
Key Datasets. Table 1 lists the details of the above datasets. For pedestrian detection, the most popular and annotated dataset is the Caltech Pedestrian Dataset Dollar et al. (2012). It contains 2.3 hours of urban video footage collected by a single car in a day, and took 400 man-hours to label. Another well-known dataset is the Daimler dataset, which is collected by a car camera contributed by Daimler Chrysler Enzweiler & Gavrila (2008). For car detection, there are two popular annotated datasets for self-driving car applications: BDD100K Yu et al. (2018) and Udacity self-driving-car uda (2016), both are collected by a single car moving around its local area. In addition, the Sherbrooke dataset targets smart-city surveillance, and uses a static camera (mounted on a street light) to capture video data.
| Dataset | # of images | Collected by |
| Caltech | 46,806 | A moving vehicle through regular urban traffic. |
| Dailmer | 2,179 | A moving vehicle through regular urban traffic. |
| BDD100K | 14,218 | Crowdsourced video clips (driving). |
| Udacity | 5,998 | A moving vehicle during daylight conditions. |
| Sherbrooke | 900 | One fixed camera mounted meters above the ground. |
Performance Metrics. Our experiment will use two common performance metrics. The first is the average precision (defined as the mean precision at a set of eleven equally spaced recall levels), which is widely used for object detection tasks. Here a higher value means more accurate detection. The second metric is the log-average miss rate on False Positive Per Image (FPPI) in Dollar et al. (2012), where the lower the value, the better the model performance.
| Dataset | Metric | Teacher | Non-local training | Local refinement |
| Daimler | Log avg miss rate | 37.9% | 10.7% | 4.71% |
| Dataset | Metric | Teacher | Non-local training | Local refinement |
| Udacity (moving camera) | Log avg miss rate | 79.6% | 49.9% | 29.1% |
| Avg precision | 31.0% | 63.4% | 83.9% | |
| Sherbrooke (fixed camera) | Log avg miss rate | 60.8% | 88.6% | 12.4% |
| Avg precision | 32.3% | 40.5% | 94.5% |
2.2 Impact of Physical Context on Training
Using transfer learning, we perform experiments to quantify the benefits of training using “local” data, i.e. labeled training data with the same physical context as classification inputs. We compare its performance against an uncustomized “teacher” model, as well as a “student” model trained with “non-local” data, i.e. data from a different physical context.
Pedestrian Detection. The best performing pedestrian detection system today is the Regional Proposal Network (RPN) Zhang et al. (2016), a model built on Faster R-CNN Ren et al. (2015) for generic object detection. For our evaluation, the RPN model trained on the generic object dataset (PASCAL VOC Everingham et al. (2010)) serves as the Teacher model. Next, we use a sampled portion of the Caltech dataset (40K images) to train a student model. Since our final testing dataset is Daimler, this student model is an example of student models trained using task-specific but non-local data. In the third step, we use a portion of the Daimler dataset (800 images) to further refine the previous model. We refer to this step as the “local refinement.” Finally, we test the above three models: teacher, non-local training, local refinement on the images in the Daimer dataset that were not used during local refinement.
Table 2 shows the pedestrian detection performance (log-avg miss rate). When the student model is trained using task-specific but non-local data, detection performance improves compared to the generic teacher model. More importantly, the biggest performance improvement comes from model refinement by training using the local dataset.
Vehicle Detection. We perform a similar process on a vehicle detection task. Here we use both Udacity and Sherbrooke datasets as test datasets. Our teacher model is the Faster R-CNN trained on the PASCAL VOC dataset. We then apply transfer learning on the teacher model, and use the BDD100K dataset to create a student model (trained on task-specific but non-local data). Finally, we use a small portion of the Udacity dataset to refine the above student model (local refinement), and repeat the same for Sherbrooke.
Table 3 lists the average precision and log-avg miss rate values. We observe the same trend as the pedestrian detection example in Table 2. Here the improvement is particularly visible for Sherbrooke, where the precision improves from 40.5% to 94.5%.
Again, the improvements from using “local” training data are extremely large, and underscore the importance of training/customizing models using data with the same physical context as input data.
| Local refinement | None | using model-generated labels | using RF labels | using accurate labels |
| Udacity | 63.4% | 53.2% | 82.6% | 83.99% |
2.3 Related Work
Our work differs from existing ML directions to reduce reliance on labeled training data, which we summarize below.
Automatic Annotation. Some prior works annotate objects or gestures by physically tagging them with RFIDs Kim & Chang (2010) or magnetic sensors Garcia-Hernando et al. (2018). These require active participation by the target and significantly limit scalability and applicable uses.
In contrast, our goal is to scalably produce labeled images of passive targets (e.g., people, pets with collars, vehicles that already carry WiFi devices). Our work also differs from automatic image annotation that uses visual features (e.g., color, texture, shape) to generate image labels. It requires complex generative models that are hard to build Zhang et al. (2012).
Atia uses target positions reported by wireless localization to annotate them. This differs from existing works Kang et al. (2017); Zeng et al. (2014) that run a generic detector (e.g. the teacher model) on the local (unlabeled) data to produce its annotations. We compare Atia to the model-generated annotation approach using the Udacity dataset. For latter, we use the teacher model (Faster RCNN with ResNet) to produce model-generated annotations.
Table 4 lists the average precision of vehicle detection using the Udacity dataset. Interestingly, using model-generated annotations to refine the student model actually leads to degraded performance compared to the teacher model. This result demonstrates the importance of using real, accurate annotations.
New Model Architecture.
Transfer learning and semi-supervised learning use local labeled data to adapt well-trained generic models to new scenarios. Self-taught learning and unsupervised feature learning learn features from unlabeled data, but still require a sizable amount of labeled data to train the classifier.
Finally, weakly supervised learning Zhou (2017) reduces labeling complexity by using coarse-grained labels (e.g., image-level labels without object bounding box), but has limited applicability. Our work differs by taking a different (and complementary) perspective, i.e. removing labeling overhead via automation.
3 Atia: AuTomated Image Annotation
To enable efficient model training, Atia integrates operations of a camera and a wireless networking infrastructure to automate the process of annotating targets on images captured by the camera. Specifically, Atia reuses (existing) wireless networking infrastructures, e.g. city-wide WiFi networks, to perform passive localization on targets that carry wireless devices, and translates the localization results into annotations on the image captured in cohort.
In this section, we discuss Atia’s basic concept and deployment cost. We also present its benefits over human-based image annotation, its implications on ML application development, and its deployment requirements and limitations.
3.1 Overview
Atia leverages the fact that locations of targets (e.g., pedestrians, cars, buses, bicycles, drones) on a 2D image can be derived from their physical 3D locations w.r.t. the camera. While human locates targets on 2D images, RF localization can directly estimate each target’s 3D physical location, and then label the target on the image by projecting its 3D location to the 2D image. If the target’s physical size is known or can be estimated, we can use the same projection to build its bounding box on the image.
Figure 1 illustrates the process of Atia in the context of pedestrian detection. It is very simple: the system takes as input the 3D location of each pedestrian ( derived by wireless localization) and the camera image captured at the same time. Using information of the camera (location, view angle) and the environment (road elevation, etc.), the system first projects each 3D location to a 2D point on the image as the target center. It then crafts a 3D body box based on the average human height and body aspect ratio, and projects it to a 2D bounding box based on the target’s 3D location (depth).
We note that Atia is not yet a universal solution for annotating the entire image content. It can only label targets identifiable by wireless localization, e.g., a person carrying a smartphone, but not an animal (unless the animal wears a collar that contains a WiFi chip). Since many users do carry smartphones and many vehicles are becoming connected, Atia is particularly applicable to vision tasks like self-driving cars and smart-city video survelliance.
Atia also differs from sensor fusion, e.g. the previously proposed RGB-W feature Alahi et al. (2015) that combines smartphone’s wireless signal strength data with camera images to improve detection accuracy. Sensor fusion does not address the fundamental problem of image annotation but leverages additional feature input to improve detection accuracy.
Finally, as we mentioned in §1, Atia does not imply that wireless localization will replace camera for certain vision tasks like pedestrian and vehicle detection. This is because wireless localization is not ubiquitous among all the objects, while camera is ubiquitous and will remain as the prevalent technology for many applications.
3.2 Practicality and Cost
Atia requires tight coordination between the camera and the localization system. Thus one might question its practicality and deployment cost due to the extra localization system. We show that such overhead can be minimized or even completely removed by reusing wireless networking infrastructures or camera’s on-board wireless radios.
“Zero-cost” Localization by Reusing Networking Infrastructure. Advances in mobile computing have made precise localization of wireless devices feasible by reusing existing infrastructure developed for networking, e.g. city-wide WiFi networks. With the recent firmware update goo , Google Android devices (with Android P) already support a WiFi localization protocol (802.11mc) that achieves meter-level accuracy in both indoor and outdoor environments. In the near future, cellular providers will deploy 5G networks with mmWave radios, enabling localization at a cm-level accuracy. Therefore, by leveraging existing and upcoming wireless networking infrastructure, the cost of localization in Atia could reduce to zero.
Direct Deployment on Camera’s On-board Radios. Cameras for self-driving cars and smart-city applications are now equipped with GPUs and wireless networking systems (WiFi and Cellular). This means that Atia can be implemented directly on cameras without requiring external infrastructure.
3.3 Benefits
By combining image capture and annotation, Atia offers five unique advantages over human annotation.
Volume. As data labeling is fully automated, the size, number and diversity of training data will no longer be constrained by human labor and can become arbitrarily large.
Real-time annotation while collecting data. In Atia annotation works in unison with image capturing and thus the two tasks run simultaneously. Thus the annotated images can be immediately fedback to the machine learning model for online refinement.
Adding location/depth to Images. Each annotation produced by Atia includes the 3D physical location of the target, thus adding depth to 2D images (using normal cameras). Human annotation cannot do so.
Temporal Tracking. With consent, Atia can track each identified target over time, producing fine-grained, context-rich labels on the target. For example, one can infer the moving speed and context of a target from its sequence of location data (e.g., standing, walking, running, biking), and use them to produce fine-grained annotations on the target.
Cross-perspective Correlation. Atia can extract hidden identity of the targets that are hard to identify from the camera data. For example, it can use captured WiFi MAC addresses as identity trackers (assume no MAC randomization). After recognizing the same identity across camera and time, one can correlate these images together to build a comprehensive view of the target.
3.4 Implications on ML Applications
Aside from boosting the number and size of labeled training data, Atia can also facilitate development of highly complex ML applications. Below are some examples.
3D Face Models. Computer vision tasks like person re-identification and multi-view face detection and recognition face significant challenges since they require training data on each target’s identity with images across frames, cameras, and locations. The labeling task is extremely difficult for human annotators since viewpoint, background, lighting and illumination can change significantly across images. With Atia, we can track targets by their device identities, and automatically build a comprehensive view of the target across many images. This helps to create a large database of 3D, multi-view facial data for individual users.
Human Action Recognition. A conventional method for building training data for human activity recognition is to ask volunteers to perform predefined actions in front of cameras Schuldt et al. (2004), which clearly does not scale. Atia can automatically identify and label activities based on each target’s location data over time. For example, our initial experiments find it can separate bikers and runners from stationary users and walkers based on their moving speeds. It can also use target location (e.g., bike lane vs. side walk) to separate bikers and runners who move at similar speeds.
Abnormal Event Detection in Video Surveillance. The physical location and trajectory can also be used to identify and label abnormal events for video surveillance. For example, one can create detailed labels when users stand or run in the middle of the street, or follow an unusual route.
Scene Recognition. Atia can label physical objects, from vehicles (cars, buses and trucks), robots and drones that are equipped with RF devices, to doors with WiFi smart video doorbells. The same benefits of adding depth, temporal tracking and across-camera integration can be utilized to recognize and label scenes on images.
3.5 Requirements and Limitations
Deploying Atia in practice imposes three key requirements on the underlying localization system. First, to achieve sufficient coverage, the localization system should be passive, not requiring targets to actively communicate or synchronize with the system. Second, it also needs to support a range similar to that of camera ( 60m for outdoor clear view Dollar et al. (2012)). It needs to be time-synchronized with the camera (at the level of camera frame rate). Third, it needs to offer high precision.
Atia also faces two key limitations when compared to human annotation of images. The first is inherent, and the second depends on the performance of the underlying target localization technology.
-
•
Atia cannot annotate existing camera datasets (that do not contain localization data);
-
•
Atia cannot recognize and label targets that do not have wireless devices, and errors in localization results will translate into erroreous data labels. We further discuss and address this limitation in the following sections.
4 The Problem of Label Mismatch
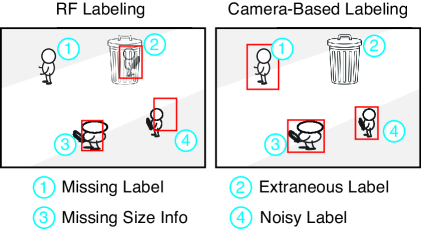
The key performance challenge facing Atia is the potential mismatch between targets captured by camera and that detected by Atia’s wireless localization. We categorize such mismatch into four types (illustrated in Figure 3).
Type \raisebox{-.9pt} {1}⃝: Missing Labels due to Partial Wireless Coverage. As mentioned earlier, not every target can be detected and localized by wireless localization, e.g., outdoor localization systems can only localize targets who carry the required RF device and are in range. Therefore, Atia could miss some targets.
We expect that these missing labels will have minimal impact on the ML model performance because they can be compensated by annotating more images (easy to achieve by Atia). Of course, this assumes Atia’s wireless localization system either does not impose any bias on targets, or any such bias can be addressed by the DNN model itself, and that training cost does not grow drastically with the number of images.
Using the pedestrian and vehicle detection examples in §2, we study the impact of missing labels and test our hypothesis. For each dataset, given a wireless coverage ratio of (%), we create Atia annotations by randomly sampling the “ground truth” annotations in the dataset.
| Dataset | Coverage | |
|---|---|---|
| 30% | 100% | |
| Caltech | 22.2% | 17.3% |
| Dailmer | 8.60% | 4.71% |
| Udacity | 31.9% | 29.1% |
Table 5 lists the detection performance (log avg miss rate) for different values. For each dataset, we keep the number of training images constant. We see that the impact of missing labels is small for Udacity, but more visible for Daimler and Caltech.
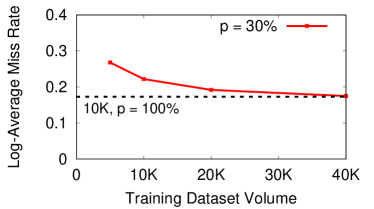
Next, for the Caltech dataset, we study the miss rate of =30% but vary the number of training images. Figure 4 reconfirms that for a given number of training images, e.g. 10k, lower leads to less accurate pedestrian detection. But such degradation can be compensated by adding more annotated images: with 10k more training images (5 minutes of video data), the miss rate reduces to 18%.
We also study the impact of potential bias imposed by Atia. For pedestrian detection, Atia cannot label children since they do not normally carry wireless devices. We verified that today’s pedestrian detection model Zhang et al. (2016) can detect children accurately even when all labeled pedestrians are adults. This is because the DNN model treats children as a scaled down version of adults.
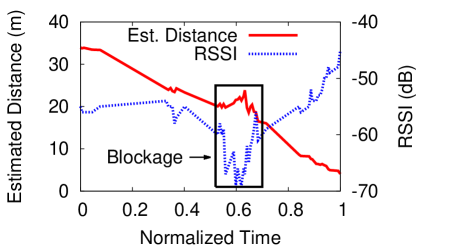
Type \raisebox{-.9pt} {2}⃝: Extraneous Labels due to Camera Occlusion. Since wireless signals often can penetrate or go “around” obstacles, Atia may locate and label targets behind obstacles. Yet cameras can only capture the obstacles or parts of the target, i.e., camera occlusion. Since both full and partial occlusions should not be used during model training Dollar et al. (2012), Atia’s annotation of occluded targets need to be identified and removed.
To detect camera occlusion, one potential direction is to analyze captured wireless signals and localization results over time. Intuitively, obstacle blockage leads to large degradation in signal strength, and the use of NLoS paths will produce much longer range estimation. Figure 5 shows an example where a pedestrian was blocked by an obstacle for a period of time. These artifacts will appear as “anomalies” in the time sequence of signal measurements and localization results, which can be used to detect occlusion.
Type \raisebox{-.9pt} {3}⃝: Missing Size Information. While a human annotator will draw a bounding box around each detected target, Atia’s wireless localization does not offer such information. For pedestrian detection, this can be overcome by first establishing an estimate of the target size (e.g., the average human height 1.76m Fryar et al. (2016) and the average aspect ratio 0.41 Dollar et al. (2012)), and then projecting the physical bounding box to the camera bounding box based on the target’s relative location to the camera. This is a reasonable estimate, because today’s pedestrian detection models Zhang et al. (2016) also resize the bounding boxes based on the same average aspect ratio (0.41).
A related challenge is how to distinguish between targets that carry the same type of wireless devices, e.g., human with WiFi vs. machines/vehicles with WiFi. One can analyze the MAC address222Existing works have shown that one can infer the device type from the Organizational Unique Identifier (OUI) field of the MAC address Sanchez et al. (2014). or the physical location and trajectory data obtained via localization. For example, human users will most likely travel on sidewalks while vehicles stay in their lanes. The two will also have different movement patterns.
Type \raisebox{-.9pt} {4}⃝: Noisy Labels due to Localization Errors. In this case, a target is captured by both Atia’s wireless localization system and the camera. But its annotation derived by Atia deviates from the ground truth label333Here we assume that human labeling is always accurate, which is in general not true in reality. due to localization errors (and bounding box estimation errors). In this case, localization errors include both angular and depth errors. The angular error “shifts” the location of the annotation on the image, while the depth error “modifies” the bounding box size.
5 Empirical Analysis of Noisy Labels
While the first three types of mismatch discussed in §4 are results of inherent difference between camera and wireless localization, the noisy labels are caused by localization errors of Atia’s underlying wireless localization system. In this section, we empirically analyze the impact of noisy labels using a specific wireless localization system.
| # of TXs | sample rate | localization error (cm) | ||
| median | 95% | |||
| S0 | 2 | 256 | 132.0 | 462.8 |
| S1 | 4 | 2048 | 31.8 | 93.8 |
| S2 | 6 | 2048 | 24.6 | 63.8 |
| S3 | 6 | 5012 | 16.2 | 42.0 |
5.1 Passive Localization via WiFi FTM
Atia employs a recent development of passive WiFi localization: IEEE 802.11mc with fine timing measurements (FTM) 802 (2016); Banin et al. (2016), or 802.11 FTM in short. 802.11 FTM uses time-of-flight (ToF) for ranging and trilateration for localization. Each camera (or a co-located 802.11 FTM access point) will broadcast FTM beacons continuously. A target that supports FTM, when in range, will automatically respond to these beacons. The camera then estimates the distance to the target by measuring the round-trip time (RTT). Differed from existing works on ToF (e.g., Adib et al. (2015); Ma et al. (2017); Vasisht et al. (2016); Xiong et al. (2015)), 802.11 FTM operates on simple sine waves. Thus its accuracy depends on the precision of hardware timing and RTT estimation.
It should be noted that 802.11 FTM is a hardware feature and does not require the target to set up network-level connectivity or synchronization444It estimates RTT locally in an asynchronous manner. with the camera (or access point). This feature enables physical layer timing with a picosecond-level accuracy, and thus offers sub-meter-level ranging accouracy. Another important factor is that its ranging/localization accuracy is location-independent, as long as the signal can reach the target. Finally, 802.11 FTM is already supported by off-the-shelf WiFi chipsets, e.g. Intel 8260 and Google Android P goo . Today, the Intel 8260 chipset costs less than $20, and supports a range of at least Au (2016).
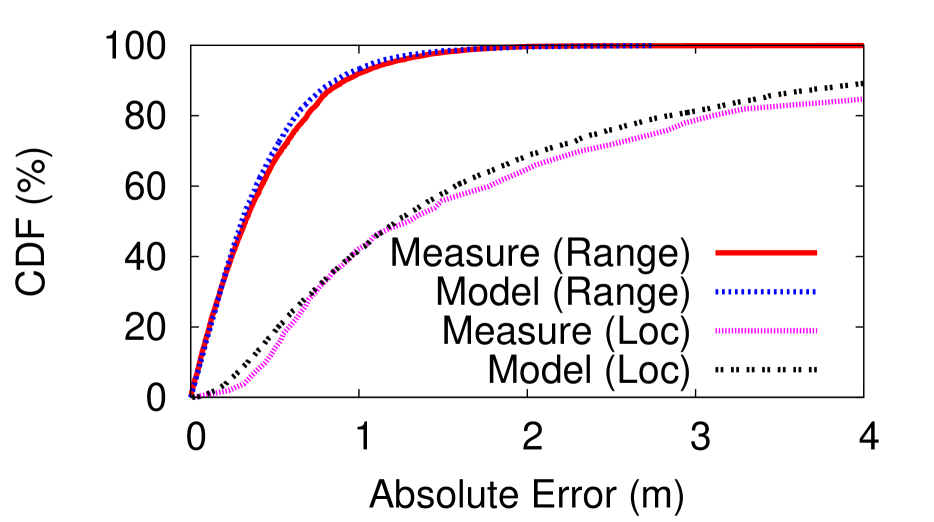
Modeling 802.11 FTM Localization Errors. Using detailed testbed measurements, we build an empirical model on the localization error of 802.11 FTM. Our measurements used three Dell XPS 13 laptops with the Intel 8260 chipset (2 as transmitters and 1 as target) placed on typical streets of approximately m2 in size. After analyzing 10,000 testbed measurements with varying target locations, we found that the ranging error follows the (folded) t location-scale distribution tlo with zero mean and standard deviation, and the localization error follows the gamma distribution. Both distributions remain invariant (with 91% confidence) despite changes in weather, target orientation and location, distance to transmitters, and hardware. We also confirmed that the error models match the testbed data in Figure 8.
The above model assumes 2 transmitters, a sampling rate of 256 beacons per localization instance (a hardcoded limit for our testbed hardware). We also simulated more sophisticated hardware configurations by increasing the number of transmitters and the sampling rate and found that they do not change the model distributions, only the model parameters. Table 8 summarizes the model parameters for four different configurations: S0 is our current testbed, S1-S3 are projected values of more sophisticated hardware configurations. For the S3 configuration, the median localization error reduces to .
5.2 Impact of Noisy Labels
Given the above localization error model, we can now evaluate Atia using existing pedestrian detection datasets like Caltech, producing noisy labels of pedestrians on the images. To do so, we first estimate the 3D physical location of each “ground-truth” label in the Caltech dataset (we approximate this value using the pinhole camera model Hartley & Zisserman (2004) assuming a pedestrian height of 1.76m Fryar et al. (2016), and then add 10% random variation). We then inject our model-generated localization error on each instance and project it back to the same 2D image to create noisy labels produced by Atia.
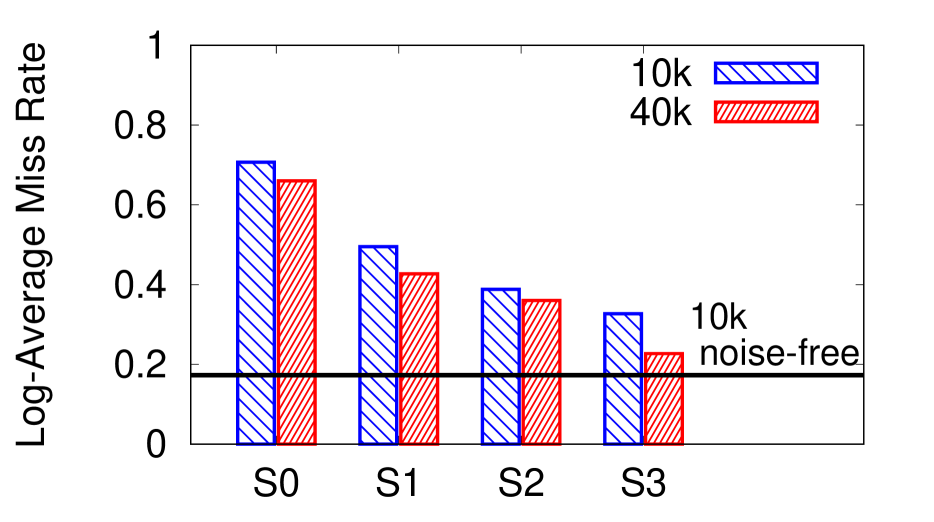
We use these noisy labels to train a pedestrian detection model, and test on other segments of the Caltech dataset. Figure 8 compares the log-average miss rate of the pedestrian detection model trained with 5 minutes and 20 minutes of video images, for different Atia localization configurations (S0-S3). Our baseline is the model trained with 5 minutes of video images with error-free annotations.
We make two key observations. First, for pedestrian detection, the current DNN model is sensitive to noisy labels produced by wireless localization. Under our basic FTM configuration (S0, 1.32m median localization error), the miss rate rises to more than 70% compared to 17.3% under noise-free labels. It drops back to 20% after improving hardware and infrastructure density (S3, 16.2cm median error) and adding more labeled data. This result confirms the initial feasibility of Atia on practical ML tasks.
Second, we found that angular error is the dominant factor for performance degradation (compared to depth error). That is, placing a bounding box at the wrong 2D location on the image leads to much higher damage than wrongly sizing the bounding box. This observation could be further utilized to reduce the impact of noisy labels.
Experimenting with Other Datasets. We focus our evaluation on the Caltech dataset because it includes the detailed information about the camera angle and position so we can accurately inject localization errors into the dataset. The other datasets like Daimler for pedestrian detection and Udacity/BDD100K for car detection do not contain such camera information and thus cannot be used in our current evaluation. As ongoing work, we are working on locating these configurations and identifying other feasible datasets, and use them to perform a more comprehensive set of evaluation.
6 Discussion
6.1 Reducing the Impact of Noisy Labels
Our results show that the most immediate challenge facing Atia is noisy labels. We now discuss three orthogonal and complementary directions to address this problem. Further research efforts are needed in these areas.
Advancing Outdoor Localization. For pedestrian detection, Atia requires precise outdoor localization (tens of ) at a range. Today’s solutions were never designed with this level of accuracy in mind. The straightforward solution to advancing outdoor localization is to motivate industry to increase AP density and upgrade RF hardware, e.g., increasing 802.11 FTM beacon rate from 256 to 5012 per unit (S3 in Table 8), or switching to directional mmWave radios for localization. We can emulate some of these upgrades today, e.g. using multiple 802.11 FTM chipsets to emulate higher beacon rates; or adapt localization methods to focus on minimizing angular errors.
Filtering Out Noisy Labels. Our second approach is using data analysis to identify “bad” localization instances, and ignore the corresponding labels. As a result, each Atia annotated image will miss some labels, which can be compensated by labeling more images (see §4).
There are two potential methods for identifying bad localization instances, depending on the data used for analysis. The first directly identifies bad instances by looking at raw localization data. Recent work achieves this by applying unsupervised feature clustering on large-scale WiFi and cellular RSS localization datasets Li et al. (2017). The system can effectively identify and remove bad localization instances. It would be interesting to study whether the same approach can be used on FSM localization data.
The second and complementary approach is to cross-validate each RF label using its corresponding visual content, e.g., the image content inside the bounding box. Intuitively, an accurate label will create a bounding box around an object, which “stands out” from the surrounding background. In computer vision, this is captured by a metric called objectness score, which measures how likely a bounding box contains an object Alexe et al. (2010); Cheng et al. (2014); Ren et al. (2015); Zitnick & Dollar (2014). This method, however, cannot differentiate between types of objects (e.g. pedestrians vs. trash bins). One can partially compensate by considering a sequence of images and leveraging temporal correlation of pedestrian movement. For example, recent work has leveraged view synthesis Zhou et al. (2017) to estimate depth and motion of targets, which can be combined with localization results for cross-validation.
Error-Resilient DNN Models. Our third approach is to apply architectural modification to existing models so that they can tolerate noisy labels. This is a well-studied topic in the ML community, especially for classification tasks.
Atia brings new opportunities in this domain, since wireless localization can simultaneously provide multiple forms of labels of different accuracy levels, i.e. minimum number of pedestrians in the image (most accurate), depth of each pedestrian, and 3D physical location of each pedestrian (least accurate). Our RF data analysis can also offer confidence scores for each label Ratner et al. (2017). How to build robust models for these new scenarios is an interesting open research question.
6.2 Privacy Opt-out via Device-based Localization
For passive annotated imaging to move forward, participant consent and privacy is a critical issue that must be addressed comprehensively. We believe that Atia can utilize device-based localization to help address such privacy concerns. Since only targets carrying a specific wireless device will be recognized and labeled by the system, a user can specify her privacy constraints to the annotation system based on her device identity, e.g., the MAC address (using 802.11mc probing). In particular, a user can opt out completely or at specific locations and time periods (since Atia knows the exact user location and time). Such privacy protection cannot be implemented using manual labeling. Finally, while this new feature offers an initial start on user privacy protection, we still need significant research efforts to address the issue of participant privacy and consent.
7 Conclusion
We believe advances in localization will make it possible to precisely compute the location of a passive wireless device, thus enabling automated annotation of some targets on images (and other datasets). Using case studies on pedestrian and vehicle detection, we demonstrate the feasibility, benefits, and challenges of such concept. Our work calls for new technical developments on passive localization, mobile data analytics, and error-resilient ML models, as well as privacy protection during ML training. Compared with ongoing efforts in the ML community, this approach tackles the hard challenge of (training) data annotation from a different (and complementary) perspective, i.e. removing annotation overhead via automation.
References
- (1) Previewing android p. https://android-developers.googleblog.com/2018/03/previewing-android-p.html.
- (2) Statistics: t location-scale distribution. https://www.mathworks.com/help/stats/t-location-scale-distribution.html.
- 802 (2016) Part 11: Wireless lan medium access control (MAC) and physical layer (PHY) specifications. IEEE P802.11-REVmc, 2016.
- uda (2016) Udacity self-driving car dataset. https://github.com/udacity/self-driving-car, 2016.
- Adib et al. (2015) Adib, F., Kabelac, Z., and Katabi, D. Multi-person localization via RF body reflections. In Proc. of NSDI, 2015.
- Alahi et al. (2015) Alahi, A., Haque, A., and Fei-Fei, L. RGB-W: When vision meets wireless. In Proc. of ICCV, 2015.
- Alexe et al. (2010) Alexe, B., Deselaers, T., and Ferrari, V. What is an object? In Proc. of CVPR, 2010.
- Andriluka et al. (2018) Andriluka, M., Iqbal, U., Milan, A., Insafutdinov, E., Pishchulin, L., Gall, J., and Schiele, B. Posetrack: A benchmark for human pose estimation and tracking. In Proc. of CVPR, 2018.
- Au (2016) Au, E. The Latest Progress on IEEE 802.11mc and IEEE 802.11ai Standards. IEEE Vehicular Technology Magazine, 11(3), 2016.
- Banin et al. (2016) Banin, L., Schatzberg, U., and Amizur, Y. WiFi FTM and map information fusion for accurate positioning. In Proc. of IPIN, 2016.
- Cheng et al. (2014) Cheng, M., Zhang, Z., Lin, W., and Torr, P. Bing: Binarized normed gradients for objectness estimation at 300fps. In Proc. of CVPR, 2014.
- Dollar et al. (2012) Dollar, P., Wojek, C., Schiele, B., and Perona, P. Pedestrian detection: An evaluation of the state of the art. IEEE Transactions on Pattern Analysis and Machine Intelligence, 34(4), 2012.
- Enzweiler & Gavrila (2008) Enzweiler, M. and Gavrila, D. M. Monocular pedestrian detection: Survey and experiments. IEEE Transactions on Pattern Analysis & Machine Intelligence, 12, 2008.
- Everingham et al. (2010) Everingham, M., Van Gool, L., Williams, C. K., Winn, J., and Zisserman, A. The Pascal visual object classes (voc) challenge. International journal of computer vision, 88, 2010.
- Fryar et al. (2016) Fryar, C. D., Gu, Q., Ogden, C. L., and Flegal, K. M. Anthropometric reference data for children and adults: United states, 2011-2014. Vital and Health Statistics Series, 2016.
- Garcia-Hernando et al. (2018) Garcia-Hernando, G., Yuan, S., Baek, S., and Kim, T.-K. First-person hand action benchmark with RGB-D videos and 3D hand pose annotations. In Proc. of CVPR, 2018.
- Gebru et al. (2017) Gebru, T., Hoffman, J., and Fei-Fei, L. Fine-grained recognition in the wild: A multi-task domain adaptation approach. In Proc. of ICCV, 2017.
- Hartley & Zisserman (2004) Hartley, R. I. and Zisserman, A. Multiple View Geometry in Computer Vision. Cambridge University Press, 2004.
- Kang et al. (2017) Kang, D., Emmons, J., Abuzaid, F., Bailis, P., and Zaharia, M. Noscope: optimizing neural network queries over video at scale. Proceedings of the VLDB Endowment, 10, 2017.
- Kemelmacher-Shlizerman et al. (2016) Kemelmacher-Shlizerman, I., Seitz, S. M., Miller, D., and Brossard, E. The megaface benchmark: 1 million faces for recognition at scale. In Proc. of CVPR, 2016.
- Kim & Chang (2010) Kim, H. and Chang, S. RFID assisted image annotation system for a portable digital camera. In Proc. of ICCAS, 2010.
- Kim et al. (2017) Kim, T., Keane, J., Wang, W., Tang, H., Riggle, J., Shakhnarovich, G., Brentari, D., and Livescu, K. Lexicon-free fingerspelling recognition from video: Data, models, and signer adaptation. Computer Speech & Language, 46, 2017.
- Li et al. (2017) Li, Z., Nika, A., Zhang, X., Zhu, Y., Yao, Y., Zhao, B. Y., and Zheng, H. Identifying value in crowdsourced wireless signal measurements. In Proc. of WWW, 2017.
- Luo et al. (2017) Luo, Z., Zou, Y., Hoffman, J., and Fei-Fei, L. Label efficient learning of transferable representations across domains and tasks. In Proc. of NIPS, 2017.
- Ma et al. (2017) Ma, Y., Selby, N., and Adib, F. Minding the billions: Ultra-wideband localization for deployed RFID tags. In Proc. of MobiCom, 2017.
- Mallapuram et al. (2017) Mallapuram, S., Ngwum, N., Yuan, F., Lu, C., and Yu, W. Smart city: The state of the art, datasets, and evaluation platforms. In Proc. of ICIS, 2017.
- Papadopoulos et al. (2017) Papadopoulos, D. P., Uijlings, J. R., Keller, F., and Ferrari, V. Extreme clicking for efficient object annotation. In Proc. of ICCV, 2017.
- Ratner et al. (2017) Ratner, A., Bach, S. H., Ehrenberg, H. R., Fries, J. A., Wu, S., and Ré, C. Snorkel: Rapid training data creation with weak supervision. PVLDB, 11(3), 2017.
- Ravi & Larochelle (2017) Ravi, S. and Larochelle, H. Optimization as a model for few-shot learning. In Proc. of ICLR, Toulon, France, April 2017.
- Ren et al. (2015) Ren, S., He, K., Girshick, R., and Sun, J. Faster r-cnn: Towards real-time object detection with region proposal networks. In Proc. of NIPS, 2015.
- Sanchez et al. (2014) Sanchez, I., Satta, R., Fovino, I. N., Baldini, G., Steri, G., Shaw, D., and Ciardulli, A. Privacy leakages in smart home wireless technologies. In Proc. of ICCST, 2014.
- Schuldt et al. (2004) Schuldt, C., Laptev, I., and Caputo, B. Recognizing human actions: a local SVM approach. In Proc. of ICPR, 2004.
- Torralba & Efros (2011) Torralba, A. and Efros, A. A. Unbiased look at dataset bias. In Proc. of CVPR, 2011.
- Vasisht et al. (2016) Vasisht, D., Kumar, S., and Katabi, D. Decimeter-level localization with a single WiFi access point. In Proc. of NSDI, 2016.
- Vinyals et al. (2016) Vinyals, O., Blundell, C., Lillicrap, T., Kavukcuoglu, K., and Wierstra, D. Matching networks for one shot learning. In Proc. of NIPS, Barcelona, Spain, December 2016.
- Wang et al. (2018) Wang, W., Shen, J., Guo, F., Cheng, M.-M., and Borji, A. Revisiting video saliency: A large-scale benchmark and a new model. In Proc. of CVPR, 2018.
- Xiong et al. (2015) Xiong, J., Sundaresan, K., and Jamieson, K. Tonetrack: Leveraging frequency-agile radios for time-based indoor wireless localization. In Proc of MobiCom, 2015.
- Yu et al. (2018) Yu, F., Xian, W., Chen, Y., Liu, F., Liao, M., Madhavan, V., and Darrell, T. Bdd100k: A diverse driving video database with scalable annotation tooling. CoRR, abs/1805.04687, 2018.
- Zeng et al. (2014) Zeng, X., Ouyang, W., Wang, M., and Wang, X. Deep learning of scene-specific classifier for pedestrian detection. In Proc. of ECCV, 2014.
- Zhang et al. (2012) Zhang, D., Islam, M. M., and Lu, G. A review on automatic image annotation techniques. Pattern Recognition, 45, 2012.
- Zhang et al. (2016) Zhang, L., Lin, L., Liang, X., and He, K. Is faster R-CNN doing well for pedestrian detection? In Proc. of ECCV, 2016.
- Zhou et al. (2017) Zhou, T., Brown, M., Snavely, N., and Lowe, D. G. Unsupervised learning of depth and ego-motion from video. In Proc. of CVPR, 2017.
- Zhou (2017) Zhou, Z. A brief introduction to weakly supervised learning. National Science Review, 2017.
- Zhu et al. (2012) Zhu, X., Vondrick, C., Ramanan, D., and Fowlkes, C. C. Do we need more training data or better models for object detection? In Proc. of BMVC, 2012.
- Zitnick & Dollar (2014) Zitnick, L. and Dollar, P. Edge boxes: Locating object proposals from edges. In Proc. of ECCV, 2014.