Direct observation of ferroelectricity in Ca3Mn2O7 and its prominent light absorption
Abstract
Layered perovskites O7 are known to exhibit the so-called hybrid improper ferroelectricity. Despite experimentally confirmed cases (e.g. nonmagnetic =Ti and Sn), the ferroelectricity in magnetic Ca3Mn2O7 remains a puzzle. Here, the structural, ferroelectric, magnetoelectric, and optical properties of Ca3Mn2O7 are systematically investigated. Switchable polarization is directly measured, demonstrating its ferroelectricity. In addition, magnetoelectric response is also evidenced, implying the coupling between magnetism and ferroelectricity. Furthermore, strong visible light absorption is observed, which can be understood from its electronic structure. Its direct and appropriate band gap, as well as wide conducting bands, makes Ca3Mn2O7 a potential candidate for ferroelectric photoelectric applications.
The so-called -type Ruddlesden-Popper perovskites with generic chemical formula O7 (: rare earth or alkaline earth, : transition metal) have been attracting great research attentions since the prediction of hybrid improper ferroelectricity in 2011.Benedek and Fennie (2011) In these hybrid improper ferroelectrics, the ferroelectric polar mode couples with and is driven by other nonpolar modes of structural distortions.Benedek and Fennie (2011); Bousquet et al. (2008); Rondinelli and Fennie (2012); Benedek et al. (2012); Mulder et al. (2013); Benedek et al. (2015); Pitcher et al. (2015) Such hybrid improper ferroelectricity not only expands the scope of ferroelectric materials but also provides potential functions like electric-control of magnetization.
In this category, the first predicted two materials are Ca3Ti2O7 and Ca3Mn2O7.Benedek and Fennie (2011) Structurally, these two materials are very similar, as shown in Fig. S1 of supplementary material. The condensation of oxygen octahedral rotation and tilting modes leads to the space group as the ground state, whose polarization () points along the -axis. The predicted ’s were C/cm2 for Ca3Ti2O7 and C/cm2 for Ca3Mn2O7.Benedek and Fennie (2011) The intrinsic magnetoelectric coupling was also expected in Ca3Mn2O7.Benedek and Fennie (2011)
Soon after the theoretical prediction, Oh et al.’s experiment confirmed the ferroelectricity in Ca3Ti2O7, although the experimental measured C/cm2 is somewhat lower than the expected value.Oh et al. (2015) Similar ferroelectricity was also predicted and later observed in Sr3Sn2O7.Mulder et al. (2013); Wang et al. (2017) However, direct experimental measurement of ferroelectricity remains absent for Ca3Mn2O7. In fact, an experimental study on Mn substituted Ca3Ti2O7, i.e. Ca3Ti2-xMnxO7, found suppressed ferroelectricity, i.e. reduced and lowered transition temperature (), upon increasing concentration of Mn.Liu et al. (2015) The temperature ()-dependent structural evolution of Ca3Mn2O7 is more complex than that of Ca3Ti2O7. For example, a phase coexistence over large range and the “symmetry trapping” of a soft mode were observed.Lobanov et al. (2004); Senn et al. (2015)
In this work, the high quality polycrystalline samples of Ca3Mn2O7 were prepared by standard solid state reaction method, starting from the highly purified powders of CaCO3 and MnO2. The stoichiometric mixtures were ground and fired at ∘C for hours in air. Then the resultant powders were pelletized into a disk of cm in diameter under psi pressure, and sintered at ∘C for hours with intermittent grinding step.
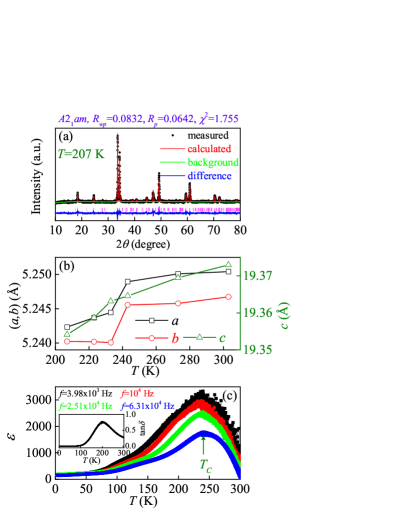
The crystal structure was characterized by X-ray diffraction (XRD) with Cu- radiation from K to K. Using the GSAS Rietveld program,Larson and Von Dreele (1994) the refined crystallographic information of Ca3Mn2O7 are summarized in Table 1. At high ’s (e.g. K), the structure can be described by the space group. In contrast, the space group can well describe the low (e.g. K) structure. Such a structural transition from nonpolar to polar agrees with previous reports.Lobanov et al. (2004); Senn et al. (2015) In the middle range (e.g. K), the mixture of multiple structures including , , as well as the intermediate , are evidenced, further confirming the complicated structural evolution from paraelectric to ferroelectric states.
In the following, the low polar structure is studied to verify its multiferroicity. The XRD pattern at K is shown in Fig. 1(a). The refined lattice constants (using the space group) as a function of below K are shown in Fig. 1(b). For lattice constants and , simultaneous sudden drops are evidenced around K.
| Group | |||||||
|---|---|---|---|---|---|---|---|
To measure the dielectric and ferroelectric properties, the sample was polished into thin plate with typical thickness of mm and area of mm2. The gold electrodes were deposited on the top/bottom surfaces. The dielectric constant under different frequencies are measured as a function of using HPA impedance analyzer, as shown in Fig. 1(c). The variable- environment is provided by Physical Property Measurement System (PPMS) of Quantum Design, which can cover K. A broad peak of is observed at K, coinciding with the sudden drops of in-plane lattice constants (Fig. 1(b)). The peak slightly shifts to the high direction with increasing frequency. These characteristics seem to suggest relaxor behavior, which is reasonable considering the large range of phase coexistence.Lobanov et al. (2004); Senn et al. (2015) The dielectric loss is very small at low , but becomes considerable large when K due to serious leakage. This may be the reason why previous experiments were failed to directly measure the ferroelectric at high . Such a large dielectric loss at K also bring somewhat uncertainness regarding , which needs further experimental verifications.
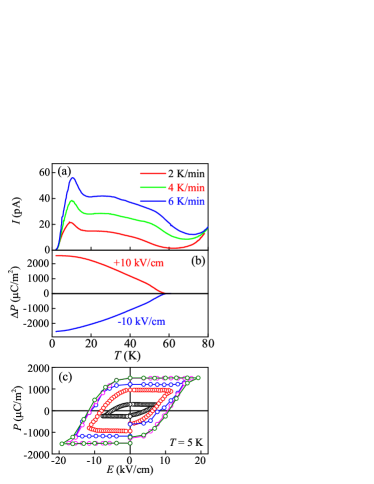
The -dependent ferroelectric was measured using the pyroelectric current method. In detail, the sample was first poled under a poling electric field from K to K. Then the electric field was set to zero, and the sample was electrically short-circuited for several hours at K in order to exclude possible extrinsic contributions (e.g. trapped charge during the poling process). Then the pyroelectric current () was collected by heating the sample at different rates of , and K/min, as shown in Fig. 2(a). All peaks of - curves are exactly at the same position without any shift. Since the current signal increases rapidly when is above K which may be contributed by the extrinsic thermal excitation, the reliable pyroelectric signal in our work is limited to the low ( K) region. Noting it does not mean that the ferroelectric is K.
Under the poling field kV/cm, the integrated pyroelectric is about C/m2 from K to K for the polycrystalline sample. And the integrated pyroelectric is also independent on the warming rates. The pyroelectric curves are also measured under the positive and negative poling electric fields. The antisymmetrical pyroelectric curves upon the positive/negative poling fields indicate the reversibility of , as shown in Fig. 2(b). All these characteristics imply that the measured signals indeed come from the intrinsic ferroelectricity, although some extrinsic factors may also co-exist and contribute to a portion of . It should be noted that such is only a part of total since the ferroelectric is much higher than K.
In addition to the pyroelectric measurement, the ferroelectric hysteresis loops have also been measured using the improved Positive-Up-Negative-Down (PUND) method, which can deduct the extrinsic contribution from leakage and capacitance to some extent. The PUND loop at K is shown in Fig. 2(c), which unambiguously demonstrates the ferroelectricity of Ca3Mn2O7. With increasing , the PUND loops gradually shrink and becomes unmeasurable due to serious leakage when K (Fig. S2 of supplementary material).
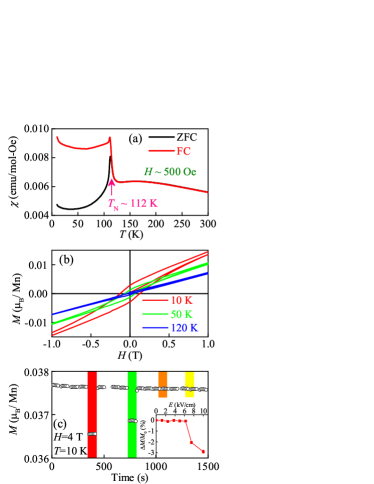
The magnetic susceptibilities (’s) as a function of under the zero-field cooling (ZFC) and field-cooling (FC) modes were measured under a small magnetic field Oe by the superconducting quantum interference device magnetometer (SQUID) (Quantum Design, Inc.), as shown in Fig. 3(a). The peaks of ’s appear at K, and the ZFC and FC curves diverge at this point, indicating an antiferromagnetic transition , in agreement with previous literature.Lobanov et al. (2004); Zhu et al. (2012) The specific heat measurement also exhibits a weak anomaly at this (Fig. S3 of supplementary material). According to the Curie-Weiss fitting above , the effective magnetic moment is /Mn, close to the expected value of spin-only magnetic moment ( /Mn) for the high-spin Mn4+ ().
Figure 3(b) shows the magnetic hysteresis loops measured at different ’s. Below , weak FM (wFM) type loops are observed, while a paramagnetic loop is evidenced above . According to the theoretical prediction, a net magnetization /Mn can be generated due to the spin canting of antiferromagnetic background.Benedek and Fennie (2011) Here the residual is about /Mn at K. The value of increases continuously with magnetic field, which is not saturated even under a high field up to T (Fig. S3 of supplementary material).
In the original theoretical work, the spin-lattice mediated magnetoelectric coupling was predicted, which might lead to electric-control of .Benedek and Fennie (2011) Here we have investigated the magnetic properties of Ca3Mn2O7 under electric field in the DC excitation mode in SQUID. After the FC (with T magnetic field and kV/cm electric field) from K to K, (under T) is monitored upon the application of electric field. As shown in Fig. 3(c), decreases suddenly when the electric field reaches up to a critical value kV/cm. Below this critical value, is quite robust. Although the Joule heat effect may also suppress , it can not explain the sudden change and critical field. Interestingly, the ferroelectric coercive field at K is kV/cm (Fig. S2 of supplementary material), very close to this , implying the switching of ferroelectric domains may affect the alignment of magnetic moments. If so, Fig. 3(c) can reflect the magnetoelectricity. Further deeper investigation of magnetoelectricity needs the single crystalline samples since the magnetoelectric response is orientation-dependent. Upon a kV/cm electric field, decreases for .
Recently, photovoltaic effects in ferroelectric (or polar) materials have attracted considerable attentions.Butler et al. (2015); Zhang et al. (2017); Nechache et al. (2015); Huang et al. (2015) The most attractive advantage of ferroelectric materials is that the internal electric field built by spontaneous can promote the separation of photo-generated electrons/holes.Yuan et al. (2011) However, for most ferroelectric materials, there are also some disadvantages, including: 1) too large band gaps or indirect band gaps, which prevent the efficient absorption of visible light; 2) low mobility of carriers and too large resistivity, which suppress the photo-generated current. These drawbacks obstruct the applications of ferroelectric materials in the photo-electric field.
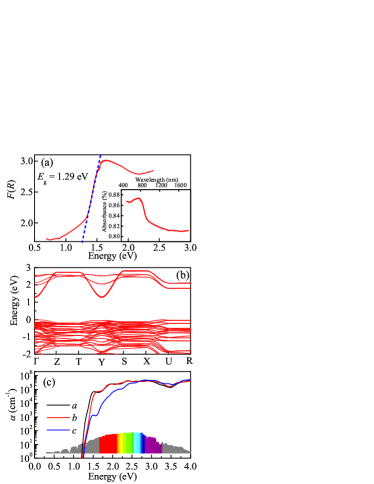
However, as stated before, Ca3Mn2O7 is not very insulating, which is disadvantage for ferroelectric measurement but may be advantage for photovoltaic current or other photo applications. To characterize the optical properties of Ca3Mn2O7, the UV-vis-NIR diffuse reflectance spectrum was measured at room with a Cary UV-vis-NIR spectrophotometer in the nm wavelength range. The reflectance spectrum was further converted to absorbance with the Kubelka-Munk function.Kubelka and Tech (1931) As shown in Fig. 4(a), the Kubelka-Munk function () shows the absorption edge eV (in the infrared light region). The optical band gap for Ca3Mn2O7 has not been reported before. The sample is black with very excellent absorbance of visible light.
To further understand the optical properties, a calculation based on density function theory (DFT) is performed. Although an early DFT calculation had been done for Ca3Mn2O7, they used the pure generalized gradient approximation (GGA) without , which leaded to an unrealistic too small band gap ( eV).Matar et al. (2007) Here our DFT calculations are performed using the projector augmented wave (PAW) pseudopotentials as implemented in Vienna ab initio Simulation Package (VASP) code.Kresse and Hafner (1993); Kresse and Furthmüller (1996); Kresse and Joubert (1999); Perdew et al. (1996) To acquire more accurate description of crystalline structure and electron correlation, the revised Perdew-Burke-Ernzerhof for solids (PBEsol) function and the GGA+ method are adopted.Perdew et al. (1996, 2008) According to literature,Benedek and Fennie (2011) the on-site Coulomb eV is applied to the orbital of Mn, using the Dudarev implemention.Dudarev et al. (1998) The cutoff of plane wave basis is fixed to eV. The Monkhorst-Pack -point mesh is .
The DFT band structure shown in Fig. 4(b) demonstrates a semiconducting properties with direct band gaps ( eV, close to the experimental value) at the and points. In addition to the appropriate value of band gaps, the conducting bands formed by the orbitals are relative wider (comparing with -TbMnO3 Huang et al. (2015) and CaOFeS Zhang et al. (2017)), implying a relative large mobility of electrons in the plane.
Then, the light absorption spectra are calculated from the imaginary part of the dielectric constant,Huang et al. (2015); Zhang et al. (2017) as shown in Fig. 4(c). The absorption is better for lights with in-plane electric field components. It is quite nature to understand the anisotropic absorption due to the crystal anisotropy. The in-plane hybrid improper ferroelectricity also leads to tiny anisotropy between the and axes for the in-plane electric field components. The first peak of absorption appears near eV. Strong absorption in the whole visible light range is found in our calculation. All these characteristics agree with aforementioned experimental results. Further photoelectric measurements on Ca3Mn2O7 are encouraged to check its potential applications as a ferroelectric photovoltaic material.
In summary, the physical properties of Ca3Mn2O7 have been investigated, including its structural property, magnetism, ferroelectricity, magnetoelectricity, and optical property. Measurements of dielectric constants and structure suggest possible ferroelectric around K, although the relaxor like behaviors are found in a quite wide temperature range. The ferroelectric polarization is measured at low temperature by the pyroelectric method as well as the PUND method, the later of which can give the hysteresis loops of electric-polarization. Furthermore, the net magnetization of weak ferromagnetism is evidenced, which can be modulated by electric field beyond the ferroelectric coercive field. Finally, the strong light absorption has been confirmed in both experiment and DFT calculation, implying potential ferroelectric photo-electric applications.
I Supplementary Material
See supplementary material for the structures and more experimental data of Ca3Mn2O7.
This work was supported by the National Key Research Projects of China (Grant No. 2016YFA0300101), the National Natural Science Foundation of China (Grant Nos. 11704109, 11674055, 51431006, 51332006, 51721001, 11504048, 51790491), Research Project of Hubei Provincial Department of Education (Grant No. Q20172501). Most calculations were supported by National Supercomputer Center in Guangzhou (Tianhe II).
References
- Benedek and Fennie (2011) N. A. Benedek and C. J. Fennie, Phys. Rev. Lett. 106, 107204 (2011).
- Bousquet et al. (2008) E. Bousquet, M. Dawber, N. Stucki, C. Lichtensteiger, P. Hermet, S. Gariglio, J.-M. Triscone, and P. Ghosez, Nature (London) 452, 732 (2008).
- Rondinelli and Fennie (2012) J. M. Rondinelli and C. J. Fennie, Adv. Mater. 24, 1961 (2012).
- Benedek et al. (2012) N. A. Benedek, A. T. Mulder, and C. J. Fennie, J. Solid State Chem. 195, 11 (2012).
- Mulder et al. (2013) A. T. Mulder, N. A. Benedek, J. M. Rondinelli, and C. J. Fennie, Adv. Funct. Mater. 23, 4810 (2013).
- Benedek et al. (2015) N. A. Benedek, J. M. Rondinelli, H. Djani, P. Ghosez, and P. Lightfoot, Dalton Trans. 44, 10543 (2015).
- Pitcher et al. (2015) M. J. Pitcher, P. Mandal, M. S. Dyer, J. Alaria, P. Borisov, H. J. Niu, J. B. Claridge, and M. J. Rosseinsky, Science 347, 420 (2015).
- Oh et al. (2015) Y. S. Oh, X. Luo, F.-T. Huang, Y.-Z. Wang, and S.-W. Cheong, Nature Mater. 14, 407 (2015).
- Wang et al. (2017) Y. Wang, F.-T. Huang, X. Luo, B. Gao, and S.-W. Cheong, Adv. Mater. 29, 1601288 (2017).
- Liu et al. (2015) X. Q. Liu, J. W. Wu, X. X. Shi, H. J. Zhao, H. Y. Zhou, R. H. Qiu, W. Q. Zhang, and X. M. Chen, Appl. Phys. Lett. 106, 202903 (2015).
- Lobanov et al. (2004) M. V. Lobanov, M. Greenblatt, E. N. Caspi, J. D. Jorgensen, D. V. Sheptyakov, B. H. Toby, C. E. Botez, and P. W. Stephens, J. Phys.: Condens. Matter 16, 5339 (2004).
- Senn et al. (2015) M. S. Senn, A. Bombardi, C. A. Murray, C. Vecchini, A. Scherillo, X. Luo, and S.-W. Cheong, Phys. Rev. Lett. 114, 035701 (2015).
- Larson and Von Dreele (1994) A. C. Larson and R. B. Von Dreele, Los Alamos National Laboratory Report LAUR , 86 (1994).
- Zhu et al. (2012) W.-K. Zhu, L. Pi, Y.-J. Huang, S. Tan, and Y.-H. Zhang, Appl. Phys. Lett. 101, 192407 (2012).
- Am (1) http://rredc.nrel.gov/solar/spectra/am1.5/.
- Butler et al. (2015) K. T. Butler, J. M. Frosta, and A. Walsh, Energy Environ. Sci. 8, 838 (2015).
- Zhang et al. (2017) Y. Zhang, L.-F. Lin, J.-J. Zhang, X. Huang, M. An, and S. Dong, Phys. Rev. Mater. 1, 034406 (2017).
- Nechache et al. (2015) R. Nechache, C. Harnagea, S. Li, L. Cardenas, W. Huang, J. Chakrabartty, and F. Rosei, Nature Photon. 9, 61 (2015).
- Huang et al. (2015) X. Huang, T. R. Paudel, S. Dong, and E. Y. Tsymbal, Phys. Rev. B 92, 125201 (2015).
- Yuan et al. (2011) Y. Yuan, T. J. Reece, P. Sharma, S. Poddar, S. Ducharme, A.Gruverman, Y. Yang, and J. Huang, Nature Mater. 10, 296 (2011).
- Kubelka and Tech (1931) P. Kubelka and F. M.-Z. Tech, Physics 12, 593 (1931).
- Matar et al. (2007) S. F. Matar, V. Eyert, A. Villesuzanne, and M.-H. Whangbo, Phys. Rev. B 76, 054403 (2007).
- Kresse and Hafner (1993) G. Kresse and J. Hafner, Phys. Rev. B 47, 558 (1993).
- Kresse and Furthmüller (1996) G. Kresse and J. Furthmüller, Phys. Rev. B 54, 11169 (1996).
- Kresse and Joubert (1999) G. Kresse and D. Joubert, Phys. Rev. B 59, 1758 (1999).
- Perdew et al. (1996) J. P. Perdew, K. Burke, and M. Ernzerhof, Phys. Rev. Lett. 77, 3865 (1996).
- Perdew et al. (2008) J. P. Perdew, A. Ruzsinszky, G. I. Csonka, O. A. Vydrov, G. E. Scuseria, L. A. Constantin, X. Zhou, and K. Burke, Phys. Rev. Lett. 100, 136406 (2008).
- Dudarev et al. (1998) S. L. Dudarev, G. A. Botton, S. Y. Savrasov, C. J. Humphreys, and A. P. Sutton, Phys. Rev. B 57, 1505 (1998).