Galaxy mergers up to I : The star formation properties of merging galaxies at separations 3-15 kpc
Abstract
We present a study of the influence of galaxy mergers on star formation at . Major mergers are selected from the CANDELS/3D-HST catalog using a peak-finding algorithm. Mergers have projected galaxy nuclei separation of their members between 3-15 kpc. We compare the star formation activity in merging and non-merging galaxies and find no significant differences. We find that only 12% of the galaxies in major mergers (in which both galaxies have ) are star-bursting (i.e., with SFR above the main sequence of star-forming galaxies by 0.5 dex). Merging galaxies which include galaxies with lower masses show a higher fraction of star-bursting galaxies (20%). The low fraction of star-bursting merging galaxies in this sample suggests that at galaxy nuclei separations of 3-15 kpc merging galaxies are still in a early stage and are yet to reach the maximum level of star formation activity. Furthermore, the level of star formation enhancement and its duration could be arguably reduced compared to local mergers, as shown by simulations of high- mergers, and might also depend on the physical properties (such as stellar mass and gas fraction) of the merging galaxies. Finally, we compare the specific SFR between merging galaxies. Our results suggest that, as the mass of the merging galaxies increases, the star formation activity in the less massive member in the merger suffers a more dramatic impact than its companion galaxy.
1 Introduction
The complete path of how baryonic matter evolves to form the galaxies we see today is still unclear. In the CDM picture (Riess et al., 1998; Perlmutter et al., 1999; Parkinson et al., 2012), galaxies and their host dark matter halos grow via the merging of increasingly more massive dark matter halos (Cole et al., 2008; Neistein & Dekel, 2008). However, this hierarchical growth is not the only channel to build galaxies. Galaxies can also be fed by cold gas in filamentary streams (Dekel et al., 2009). In addition, observations show that low-mass galaxies formed most of their stars at later times than more massive systems (so called “down-sizing”, White & Frenk, 1991; Kauffmann & White, 1993; Kauffmann et al., 1999) contrary to the hierarchical assembly. Therefore, to understand the importance of the hierarchical growth, it is necessary to study the role of galaxy mergers in the formation and evolution of galaxies. Specifically, the effects of merging on the star formation activity and on the morphological transformation of the merging systems at different cosmic times are yet to be robustly assessed. Similarly, the role played by mergers in feeding and growing the central super-massive black holes is far from being understood, especially at early cosmic times. This is crucial as the energetic output from the active galactic nuclei (AGN) is thought to contribute to, if not dominate, the quenching of star formation in galaxies (AGN feedback) in massive halos.
Interactions of galaxies with similar mass (major mergers, mass ratio 1:4) have been studied in depth in the local Universe. Major mergers can enhance star formation in the system if the members have sufficient gas (Kartaltepe et al., 2012; Yuan et al., 2012; Hung et al., 2013; Patton et al., 2013; Lanz et al., 2013). The interaction can also morphologically transform galaxies and trigger AGN (Barnes & Hernquist, 1996; Mihos & Hernquist, 1996; Springel et al., 2005; Hopkins et al., 2006, 2008). Observations have shown that almost all local starbursts, which are galaxies that are located well above the main sequence, are produced by major mergers (Armus et al., 1987; Sanders & Mirabel, 1996; Kartaltepe et al., 2010; Ellison et al., 2013). However, starbursts may not necessarily be produced by mergers at high redshifts, because the physical conditions in the Universe were different, such as the availability of more gas to produce stars even if not in a merger (Daddi et al., 2010; Tacconi et al., 2010).
Observations of merging systems at high- have shown that major mergers are inefficient at driving star formation (Kaviraj et al., 2013, 2015; Lofthouse et al., 2017). However, these studies have not established how the process of driving star formation depends on the different merger stages. Hints of this process have been shown by simulations of galaxy mergers. These simulations assume that high- merging galaxies contain higher gas fractions than local mergers. The results show a weak increment in the intensity and duration of the star formation enhancement produced by the high- mergers (Perret et al., 2014; Scudder et al., 2015; Fensch et al., 2017). In the case of major mergers of two gas poor galaxies (dry mergers), there is little or no star formation enhancement in the system, although the interaction contributes to the build up of massive galaxies (Cattaneo et al., 2008). The dry merger scenario tends to be more common at low redshift (Khochfar & Burkert, 2003).
Observationally, several techniques have been used to select galaxy mergers to quantify the role played by mergers in galaxy formation and evolution. First, selecting pairs of galaxies with projected separations 100 kpc (e.g., Robaina et al., 2010; Williams et al., 2011; Tasca et al., 2014) is a common method of identifying candidate mergers before coalescence takes place. One issue with this method is that it includes contamination by chance superpositions if redshift information is not available. A second technique is based on the selection of morphologically disturbed galaxies with signatures such as asymmetric features, tidal tails, or outer shells that are sensitive to minor mergers and close passages (e.g., Bridge et al., 2010; Cisternas et al., 2011; Kartaltepe et al., 2015).
A third technique was introduced by Lackner et al. (2014). It selects merging galaxies at the interface between early-stage mergers selected in close galaxy pairs studies and post-merger galaxies based on disturbed morphologies. The technique uses a high-pass filter that selects bright peaks in a galaxy surface brightness map (i.e., double nuclei). Lackner et al. (2014) applied this method to the ACS I814-band images in the full COSMOS field. The I814-band limited the analysis to to probe the rest-frame optical redward of the Balmer 4000Å break. Lackner et al. (2014) selected galaxies with two intact nuclei separated by 2.2-8 kpc which are expected to merge within a few hundreds Myrs. This technique has two main advantages over past efforts. First, the method can be applied to photometric samples that lack spectroscopy due to the small separation of the nuclei thus the sample sizes are greatly increased. Second, the selection function can be quantified by constructing simulated mergers using isolated (real) galaxies and determining the success rate with respect to recovering the detection of both peaks in the light distribution. The latter is important when measuring the redshift dependence of the merger rate. Since Lackner et al. (2014) used only one HST band in their study, they could not distinguish the colors of the individual member galaxies in mergers. The lack of resolved information prevented the estimation of the stellar population properties of member galaxies, and their mass ratios were not measured to differentiate major from minor mergers.111They selected major from minor mergers from the flux ratios of the merger members. The fluxes were calculated from the brightest regions in the galaxies (the nuclei). They also could not distinguish between wet, mixed, and dry mergers based on the individual colors of the merging galaxies and their sample is potentially affected by chance superpositions (due to the lack of resolved redshifts) and clumpy galaxies.
To make further progress at using the Lackner et al. (2014) technique, it is necessary to apply it to NIR data to obtain a sample of mergers less contaminated by clumpy, star-forming galaxies (which are more likely to be falsely identified as merging systems in bluer bands). This technique was shown to be more sensitive to mergers between concentrated galaxies of early-type morphology and is therefore ideally suited to longer wavelength data in which galaxies appear more bulge-dominated and centrally concentrated.
In this work, we use the imaging and spectroscopic data of the CANDELS and 3D-HST datasets to study the resolved star-formation properties of merging galaxies with projected separation of 3-15 kpc, over the redshift range 0.32.5. With HST data from the optical to the NIR, we extract spatially resolved spectral energy distributions (SEDs), colors, and accurate redshifts up to =2.5. This resolved information is crucial for a detailed study of the properties of the merging galaxies. Mergers are selected using the technique introduced by Lackner et al. (2014) on the HST F160W (H160 hereafter) images. The multi-wavelength space-based imaging from CANDELS and the grism spectroscopic redshifts from 3D-HST are used to remove chance superposition of galaxies, clean the sample from clumpy galaxies, confirm interacting pairs, as well as to study the resolved star-formation properties of the merging galaxies.
In section §2 we present the data and describe the procedure to select mergers. In section §3 we present the star formation properties of merging galaxies and compare them with the properties of non-merging galaxies. In §4 and §5 we present the discussions and conclusions. In future papers, we will present the merger rate, structural properties of these merging galaxies, and the incidence of AGN. Throughout this paper, we adopt a cosmology with H0=70 km s-1 Mpc-1, =0.7, and =0.3. Magnitudes are in the AB system.
2 Data & Sample
2.1 3D-HST Photometric Catalog and Grism Redshifts
We use the 3D-HST (Skelton et al., 2014; Momcheva et al., 2016) catalogs and images to find galaxy pairs. The catalog covers all five CANDELS fields (COSMOS, AEGIS, GOODS-North, GOODS-South, and UDS). We make use of the derived data products produced by the 3D-HST collaboration in these fields, i.e. photometric redshift estimates, and stellar and structural parameters such as stellar masses, ages, star formation rates, extinction, and sizes. The catalogs contain total flux measurements and stellar population parameters for 207,967 objects over an effective area of 896.3 arcmin2. G141 grism redshifts for 22,548 galaxies are provided by Momcheva et al. (2016). We use the best redshift available for each galaxy (spectroscopic, grism, or photometric redshift). Stellar masses were calculated by fitting the galaxy SEDs using Bruzual & Charlot (2003) stellar population models using FAST (Kriek et al., 2009), with Chabrier (2003) initial mass function (IMF), an exponentially declining star formation history222We have tested the robustness of the stellar mass and SFR estimates by also adopting a delayed exponentially declining star formation history (which allows for initially SFR that increases with time). Stellar mass estimates are very robust, with no systematic difference and a negligible scatter of 0.05 dex. SFR are also quite robust, with a small systematic difference and a scatter of 0.2 dex., and a solar metallicity. The star formation rate was obtained from the combination of rest-frame UV emission and the mid-infrared photometry obtained from Spitzer/MIPS imaging following Whitaker et al. (2012). When MIPS 24 m data were not available or for detections with S/N3, the star formation rates were obtained from the modeling of the SEDs.
We create postage stamps for each galaxy from the near-infrared H160 images. The stamps have a size of 8″ 8″. The pixel size of these images is 006 and the point spread function has a FWHM of 019. We remove stars (star_flag1) and objects too close to bright stars (near_star=0) from the catalog. We select sources with enough exposure time in F125W and F160W bands (nexp_125W, nexp_160W2.0) and with signal to noise ratio in F160W S/N10.
2.2 Detection of Galaxy Pairs
We select galaxy pairs333Galaxy pairs: two galaxies at close projected nuclei separation that are not necessarily merging galaxies by applying the technique described in Lackner et al. (2014) to the H160 postage stamps. The method consists of selecting bright peaks in an image and then implementing restrictions on the properties of the peaks to select galaxy pairs. We apply the technique to 5717 galaxies in the 3D-HST catalog with , brighter than =24.5 in the H160 band, and 444 We use a minimum redshift of because at this redshift two galaxy pairs at a distance of 15 kpc are at a projected separation of 34, therefore both galaxies fall within the postage stamp. The maximum redshift of is used because the completeness in stellar mass at is above 90%. . The postage stamps are centered at the position of these galaxies and are convolved with a median ring filter that smooths the image. This erases structures on scales larger than the ring. The optimal ring size to select bright peaks in the H160 postage stamps has a diameter of 2FWHM (038). The size of the ring corresponds to 1.7 and 3.1 kpc at =0.3 and =2.5, respectively. We subtract the smoothed from the original image and from the resultant image, we select all the regions that contain at least 9 pixels with signal to noise ratio . These regions correspond to bright peaks in the image. The fluxes of these peaks are obtained by summing up the pixel values associated with the peak in the original image. To find galaxy pairs with similar projected separation at different redshifts, we choose peaks that have separation between 3 to 15 kpc555Assuming that the system is at the redshift of the central galaxy.. The minimum separation is set by the size of the median ring filter at =2.5, and the upper separation is to avoid line of sight contaminating galaxies. We are interested in finding galaxy pairs that potentially are major merging galaxies. Following Lackner et al. (2014), we select peaks that have at least 1:4 of the flux of the brightest peak. This restriction also helps to remove star-forming clumps that could contaminate the sample of selected galaxy pairs. To avoid edge on disk galaxies, in which 3 peaks are aligned, we set that the Pearson correlation coefficient between the peaks is less than 0.5. The number of galaxy pairs obtained with these restrictions is 678.
2.3 Blended Sources in the 3D-HST Catalog
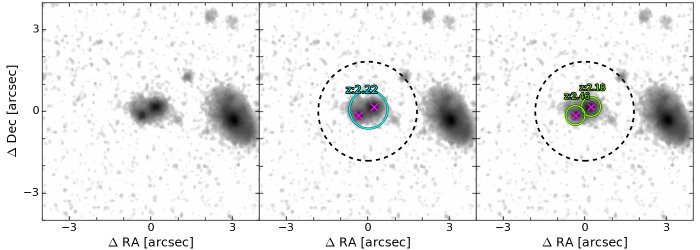
In the sample of 678 galaxy pairs found with the peak-finding code, 28% of the galaxies are blended (not resolved) in the 3D-HST catalog (Fig. 1). We extract de-blended HST photometry for the individual blended member galaxies using the same procedure performed to create the 3D-HST photometric catalogs, except that, for the not resolved sources, we use an aperture of 03 in diameter (instead of an aperture of 07 as used for the 3D-HST catalogs). The H160 stamps of the blended sources are modeled with GALFIT (Peng et al., 2002) to obtain the H160 total fluxes of the blended galaxies. The total H160 fluxes are used to scale the D=03 aperture photometry to the total by multiplying by the ratio in the H160 band. These SEDs are then modeled to derive photometric redshifts and rest-frame luminosities and colors with EAZY (Brammer et al., 2008) and stellar population properties with FAST (Kriek et al., 2009) using the same procedure and SED-modeling assumptions adopted for the 3D-HST catalogs. After this procedure, we select those pairs in which both galaxy members have 24.5. The peak-finding algorithm is applied to galaxies at the center of the postage stamps with masses . Since we apply a flux ratio cut to find galaxy pairs, the companion member of the central source in the pair could have a lower stellar mass than this limit. Moreover, for pairs that were originally blended in the 3D-HST catalog, it is possible that both components end up with stellar masses if the original blended object had .
2.4 Final Sample of Mergers
Using the redshift values (spectroscopic, grism, or photometric) of the individual member galaxies, we separate galaxy pairs into likely mergers and line of sight contaminants. We define mergers as galaxies that are consistent with being at the same redshift within a 3 uncertainty (when using either photometric or grism redshifts), or if the redshifts differ by less than 0.001 (if both have spectroscopic redshifts).
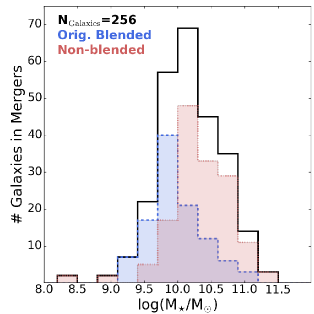
As indicated in §2.2, the code selects galaxy pairs with flux ratio1:4 to find major mergers. However, the fluxes measured by the code are only a lower limit of the flux of the merging galaxies, since this is measured from the brightest regions in the galaxy. Since we have the stellar masses of the merging galaxies obtained from the 3D-HST catalog (and from the de-blended photometry in originally blended sources), we can obtain a sample of major mergers using a cut in mass ratio 1:4 in addition to the original flux ratio cut666As presented in Appendix A, we do not see a significant difference in the analysis of the properties of mergers when different combination ratio cuts is applied.. The sample of major mergers at in the five CANDELS fields contains 256 merging galaxies in 130 merging systems of which 125 are mergers of two galaxies and the other 5 systems are mergers with more than two galaxies777For instance, in a merging system with three galaxies A,B, and C, the pairs with galaxies A-B and A-C but not necessarily B-C could be selected as a merging system (if they follow all the restrictions imposed to select mergers). In this case we count two merging systems.. The left panel of Figure 2 shows the distribution of masses for the galaxies in major mergers.
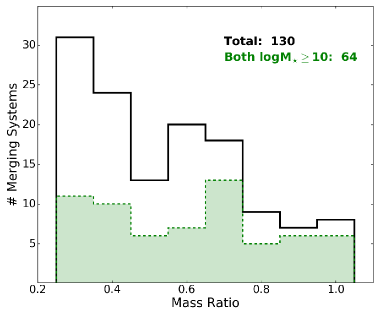
The original flux ratio cut helps to remove the selection of clumpy galaxies. However, star-forming clumps in galaxies usually have stellar masses (Guo et al., 2012) and it might be possible that the major merger sample could be contaminated by clumpy galaxies. Therefore, we will also analyze a more restrictive sample of major mergers, in which both merging galaxies have stellar masses . We will refer to this sample as the “high-mass” sample of mergers while for the original sample we will refer as the “primary” sample. The high-mass sample contains 128 galaxies in 64 merging systems (Table 1). We define as non-merging galaxies those galaxies that were not selected in the primary sample. The right panel in Figure 2 shows the distribution in mass ratio of major mergers, both the primary and the high-mass sample. The fraction of galaxies in the high-mass sample at is on average 2.7% with 1.7% of the mergers at and 2.4% at .
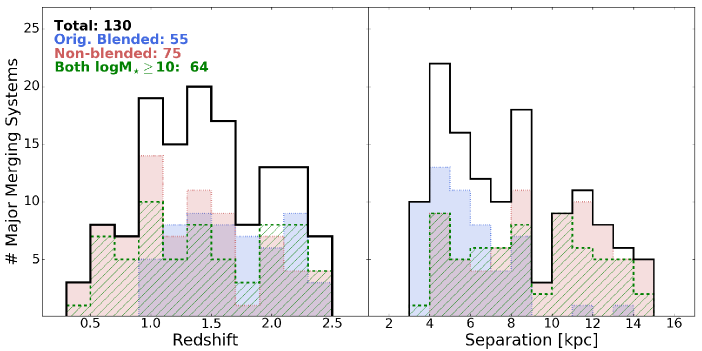
Figure 3 shows the distribution in redshift and nuclei separation of both major merger samples. For the primary sample, we show the distribution of the systems that were originally blended and those that were resolved in 3D-HST. The combination of the peak-finding algorithm and the de-blending analysis allowed us to increase the sample of major mergers by 73% compared to the sample of mergers that would have been constructed using the 3D-HST catalogs alone (26% for the high-mass sample). This increase is particularly substantial for systems with smaller projected separations (9 kpc) and higher redshifts (). For the following analysis in this paper, we will focus on the high-mass major merger sample unless explicitly stated otherwise.
| Field | Primarya | High-massb | Fractionc (%) |
|---|---|---|---|
| COSMOS | 24 | 14 | 2.5 |
| AEGIS | 27 | 14 | 2.5 |
| GOODS-N | 24 | 8 | 1.4 |
| GOODS-S | 33 | 17 | 2.9 |
| UDS | 22 | 11 | 1.7 |
| TOTAL | 130 | 64 | 2.7 |
3 Results
We use the rest-frame U-V and V-J colors to place the sample of merging galaxies in the U-V versus V-J color-color diagram (UVJ diagram, hereafter). In this way, we can separate merging galaxies into quiescent and star-forming by using the criteria defined in Whitaker et al. (2015). We also include the criteria presented in Martis et al. (2016) to separate star-forming galaxies into dusty and relatively unobscured star-forming galaxies. Star forming galaxies satisfy for and for , while dusty galaxies satisfy .
Figure 4 shows the position of the merging sources (including those of the primary sample) in the UVJ diagram in different redshift bins. We compare their positions with the positions of non-merging galaxies with masses . For the 128 galaxies in the high-mass major merger sample, we find that 35.95.3%, 21.93.4%, and 42.25.7% are quiescent, unobscured, and dusty star-forming galaxies, respectively. In the case of non-merging galaxies, these percentages are 30.50.7%, 28.80.7%, and 40.70.8%, respectively. This indicates that overall, the sample of major mergers contains a similar fraction of quiescent, unobscured, and dusty galaxies than non-mergers.
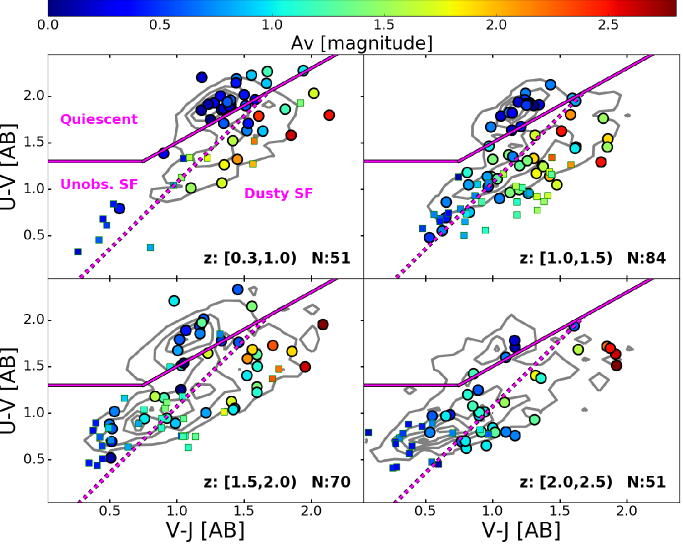
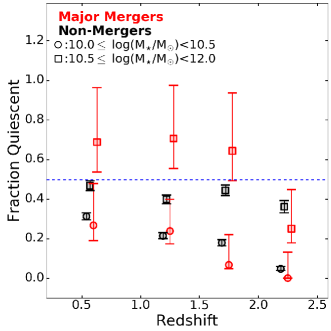
Figure 5 shows the fraction of quiescent galaxies in the high-mass major merger sample as a function of redshift in two bins of stellar mass. These fractions are compared with the fractions of quiescent galaxies in non-merging galaxies. The fraction of quiescent galaxies with 1010.5 in merging systems is similar to the quiescent fraction in non-merging galaxies, and it is found to increase with decreasing redshift. Similarly to non-merging galaxies (e.g. Martis et al., 2016), at 10.5 star-forming galaxies dominate the population of galaxies in mergers. Figure 5 also suggests that at and masses , there is a higher fraction of quiescent merging galaxies compared with the fraction of quiescent non-merging galaxies, although it is not significant given the large errors at all redshifts. At the fraction of quiescent galaxies in the two populations is similar within the uncertainties and shows a higher fraction of star-forming galaxies. The fractions in this mass range are dominated by galaxies with masses . The higher fractions of quiescent merging galaxies at high masses compared to non-merging galaxies could be a consequence of the adopted peak-finding code, which is more sensitive to the selection of bulge-dominated galaxies (more prominent at the high-mass end) and also to the mass ratio cut which tend to select more quiescent galaxies (see Appendix A)). There is no clear trend in the evolution of quiescent galaxies in both merging and non-merging galaxies as a function of redshift in this high-mass range.
Table 2 shows the percentages of quiescent, unobscured, and dusty star-forming galaxies in the high-mass major merger sample at different redshifts compared with the percentages for non-merging galaxies. The fraction of quiescent galaxies in mergers and non-mergers is similar in most redshift bins and decreases with redshift. The fraction of unobscured star-forming galaxies in mergers and non-mergers increases with redshift. The fractions for mergers and non-mergers at are consistent with the errors. At this fraction is higher in non-merging galaxies. In the case of dusty star-forming galaxies, the fraction in mergers is found to increase with increasing redshift, whereas this decreases in non-merging galaxies. This population is similar between merging and non-merging galaxies at , but at higher redshifts, dusty star-forming galaxies are more common among merging than non-merging galaxies.
| Quiescent | Unobscured SF | Dusty SF | ||||
|---|---|---|---|---|---|---|
| Merging | Non-merging | Merging | Non-merging | Merging | Non-merging | |
| 0.3-1.0 | 48.4 | 37.81.5 | 9.7 | 17.81.0 | 41.9 | 44.41.6 |
| 1.0-1.5 | 44.7 | 29.61.3 | 23.7 | 26.31.2 | 31.6 | 44.11.6 |
| 1.5-2.0 | 34.5 | 29.91.5 | 24.1 | 32.01.5 | 42.4 | 38.11.7 |
| 2.0-2.5 | 13.3 | 18.11.4 | 30.0 | 52.12.4 | 56.6 | 29.81.8 |
| Total | 35.95.3 | 30.50.7 | 21.9 | 28.80.7 | 42.2 | 40.70.8 |
3.1 Merger Types
Since we use the UVJ colors to separate galaxies into star-forming and quiescent, we can separate mergers into wet (both galaxies are star-forming, i.e. dusty or unobscured), mixed (one quiescent and one star-forming), and dry (both are quiescent). We find that 53.1%, 21.9%, and 25.0% of the major mergers correspond to wet, mixed, and dry mergers, respectively. For galaxies in the primary sample, the percentages of these types of mergers are 72.35.3%, 15.2%, and 12.5%, respectively.
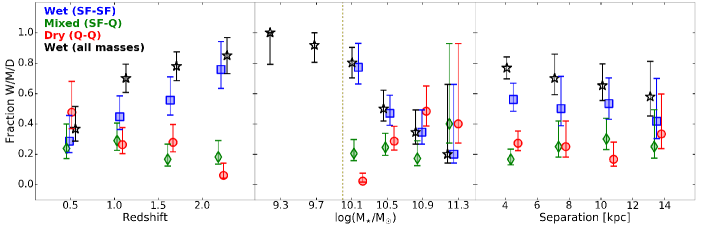
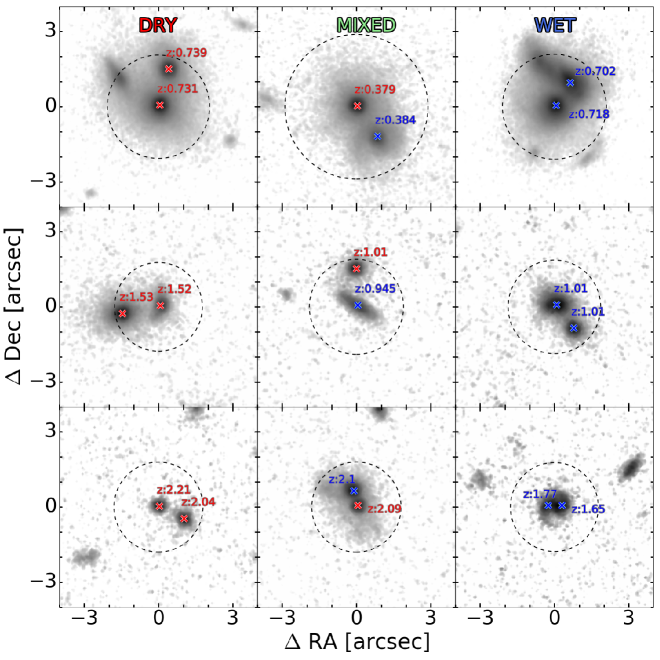
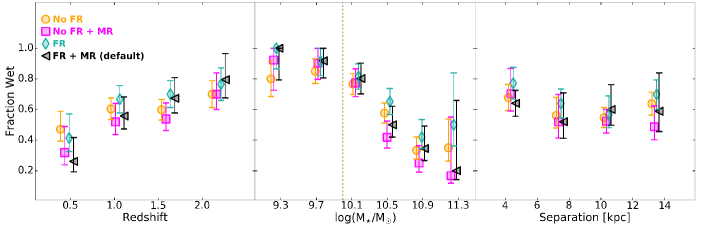
Figure 6 shows the fraction of the different types of mergers as a function of redshift, stellar mass, and projected separation between the galaxy nuclei. We also analyze the fraction of wet mergers of the primary sample (black stars). Wet mergers are dominant at higher redshifts (increment of 48% from to ) and lower masses (increment of 57% from the lowest to the highest mass bin). The fraction of wet mergers is found to be increasing marginally with decreasing projected separation between the galaxy nuclei (from 0.42 to 0.56 at separations of 12-15 kpc and 3-6 kpc, respectively). The same trends in the fraction of wet mergers are seen in the primary sample. The fractions of wet mergers for this sample as a function of the different parameters are slightly higher than in the high-mass sample, although not significant given the error bars. For wet mergers in the primary sample, the fraction as a function of stellar mass increases with decreasing stellar mass, with all mergers being wet at masses , suggesting that the population of low-mass galaxies in mergers is dominated by star-forming galaxies. In the case of mixed and dry mergers, their distributions are similar in most cases. They show an increment with decreasing redshift (for dry mergers it increases 42% from to ) and a constant fraction with nuclei separation (0.25). The fraction of dry mergers increases with mass (38% of increment from the lowest to the highest mass bin). Figure 7 shows examples of wet, mixed, and dry mergers.
3.2 Star-Formation Activity in Major Mergers
We compare the star formation activity in merging and non-merging galaxies to analyze if there is an enhancement in the level of star formation activity in mergers. The star formation rate in non-blended galaxies in 3D-HST comes from either the modeling of their SEDs or from the analysis combining the UV+IR emission. In originally blended galaxies, the star formation rate comes primarily from the modeling of their de-blended SEDs, except when the blended system has MIPS 24 m detection. In this case, we assigned a new de-blended IR emission to these galaxies in the following way. If the blended system is mixed (i.e., made of a quiescent and a star-forming galaxy), then the IR emission was assigned entirely to the star-forming component. If the blended system is wet (i.e., made of two star-forming galaxies), then both components were assigned a fraction of the total derived IR emission based on the ratio of their SFRs as derived from the modeling of the SEDs.
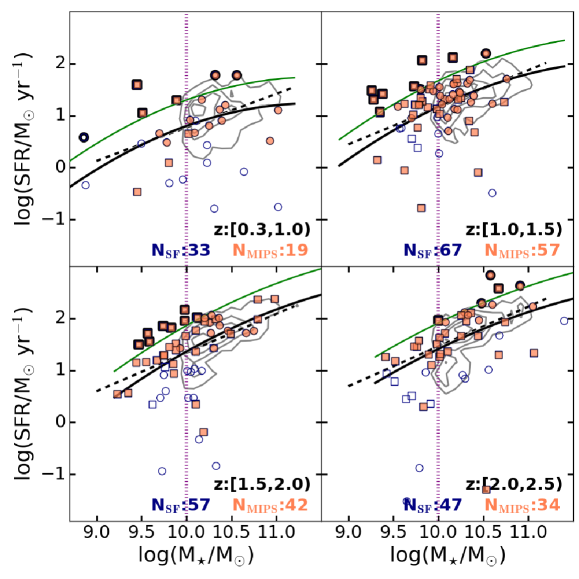
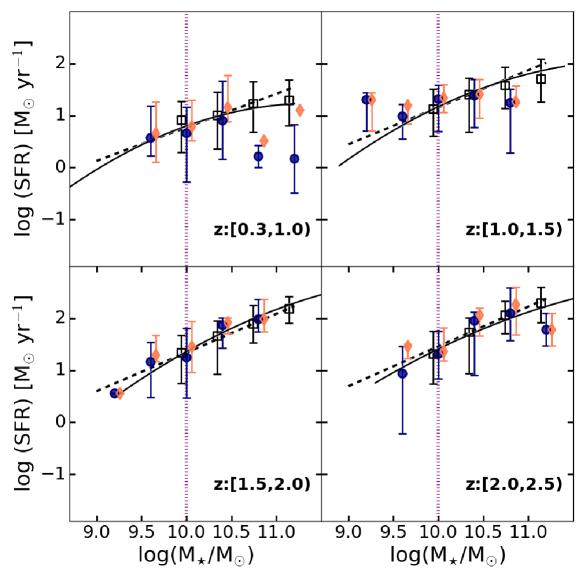
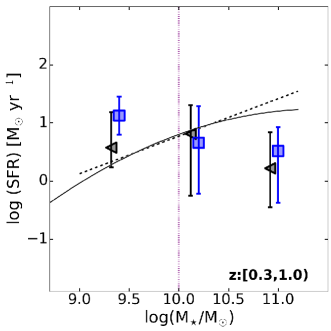
Figure 8 shows the position of individual merging galaxies in the star formation rate vs stellar mass diagram including those of the primary sample of major mergers. We compare the position of the star-forming galaxies with the main sequence fits obtained from Speagle et al. (2014) and Whitaker et al. (2014) in different redshift bins. We also indicate those galaxies that have MIPS detection because the main sequence fit of Whitaker et al. (2014) was obtained from MIPS detected star-forming galaxies in the 3D-HST catalog. Figure 9 compares the median SFRs of merging and non-merging galaxies in different stellar mass bins.
We performed a two-dimensional Kolmogorov Smirnov (K-S) test between the merging and non-merging samples in the SFR vs M⋆ diagram, to quantify whether the two samples are consistent with coming from the same parent population. The resultant P-values (probability of the plausibility of the null hypothesis) are tabulated in Table 3. For galaxies with (in the high-mass sample), we found that the major merger and the non-merger populations are indistinguishable at any redshift. In the case of galaxies in major mergers with masses , we find that at the population of major mergers is significantly different to non-mergers in the same mass range888And in the same redshift range and with (P-values0.003). The finding that the population of merging galaxies with is different from the population of non-mergers, can be also visualized in Figure 8. This figure shows that low-mass merging galaxies have enhanced star formation compared to star-forming galaxies on the main sequence. In Figure 8, we highlight star-bursting merging galaxies, which are those that have SFR larger by more than 0.5 dex with respect to the main sequence fit of Whitaker et al. (2014).
In the high-mass sample of mergers, ten galaxies (12% of the major mergers) are star-bursting galaxies. All of these starbursts are in wet mergers, are dusty star-forming galaxies, and have MIPS detections. They are in mergers with projected nuclei separation between 4.0 and 11.5 kpc. Four of these galaxies were originally blended in 3D-HST. Eight of these star-bursting galaxies have a dusty star-forming galaxy as a companion. In the case of major mergers with , the fraction of star-bursting galaxies increases to 20%, suggesting a higher enhancement in the star formation activity in low-mass merging galaxies.
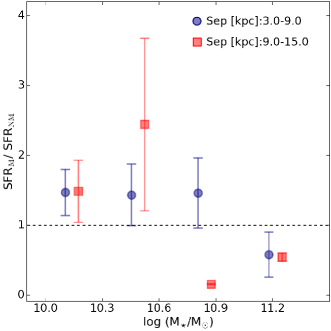
To analyze if there is an increment in the star formation rate in mergers with decreasing projected separation, we measure the ratio of the means of the SFR in star-forming galaxies in major mergers and non-mergers as a function of stellar mass (Fig. 10). We compare these ratios at nuclei separations of 3-9 kpc and 9-15 kpc. Although we do not find an increment in the star formation activity with nuclei separation, we see an increment of this ratio of the means in galaxies with lower masses, supporting the idea that lower-mass merging galaxies might suffer a higher impact in the star formation activity.
| High-massb | Low-massc | |
|---|---|---|
| 0.3-1.0 | 0.313 | 0.006 |
| 1.0-1.5 | 0.201 | 9.991 |
| 1.5-2.0 | 0.340 | 1.750 |
| 2.0-2.5 | 0.050 | 0.190 |
3.3 Potential systematics in the selection of the merger sample
We select major mergers using a peak-finding algorithm that select galaxy nuclei in an image. We impose restrictions such as differences in redshift and separation between the identified galaxy nuclei in order to select mergers. In addition, we use a flux and a mass ratio cut 1:4 to select major mergers. However, as indicated in Man et al. (2016), selecting galaxy mergers based on stellar mass or flux ratio can give different results on measured properties of mergers. We repeat the selection of mergers applying different combinations of flux and mass ratio cuts. In Figures 13, 14, and 15 in Appendix A, we repeat the measurement of the fraction of quiescent galaxies as a function of redshift (Fig. 5), the fraction of wet mergers as a function of redshift, stellar mass, and separation (Fig. 6), and the median of the SFR of merging galaxies in the SFR vs M⋆ plot (Fig. 9) using the different samples of mergers. We find no significant difference between the results using the different combinations of ratio cuts. The sample of Man et al. (2016), contains merging galaxies at separations 10-30 kpc and our sample of mergers is close to coalescence, with galaxy nuclei separations 15 kpc. It is possible that Man et al. (2016) find different results when using flux and mass ratio in their sample selection due to the larger separation of the merging galaxies compared to ours.
Cibinel et al. (2015) indicate that samples of merging galaxies identified from H160 images alone are not ideal because they can have a contamination from clumpy galaxies up to 50%. They find that using stellar mass maps produces a cleaner selection of mergers with a contamination in the number of clumpy galaxies 20%. Wuyts et al. (2012), also using stellar mass maps, find that the contribution of the mass of clumps to the total stellar mass in galaxies is less than 7%. It is difficult to quantify the possible contamination of clumpy galaxies in our sample of major mergers, since our sample consists of merging galaxies close to coalescence, thus making it potentially more difficult to distinguish between a star-forming galaxy and a massive clump. However, with the mass ratio cut used to select our sample of mergers, we avoid the selection of systems with typical masses of clumps, since we select mergers in which the lowest mass member has at least 25% of the mass of the main galaxy999For instance, if we select a galaxy pair in which one galaxy has a mass of 1010M⊙, a star-forming clump should have a mass 7M⊙, thus a mass ratio of 0.07 which is 0.25 mass ratio cut we use to select mergers.. In addition, most of the analysis shown in this paper is based on merging galaxies in which both components have masses , higher than what is expected for star-forming clumps (masses
Since we are using only the H160-band images to select mergers over the redshift range , we are selecting merging galaxies from a wide range of rest-frame wavelengths (from rest-frame 1.18m at , to rest-frame 0.44 m at ). We investigate if the use of a single band selection makes an impact in the trends such as those found in Figures 5 and 6. We apply the peak-finding algorithm to I814-band stamps of galaxies in the 3D-HST catalog at , because we want to sample rest-frame wavelengths longer than the break. The rest-frame of the I814 images at corresponds to the rest-frame of the H160-band at . In Appendix B, we present the comparison in the fraction of quiescent galaxies as a function of redshift (Fig. 16), the fraction of wet mergers as a function of redshift (Fig. 17, left), and the mean in the SFR as a function of M⋆ diagram (Fig. 17, right). We find no significant differences in the trends reported in this paper when using the I814 and the H160 band images for the selection of mergers. We therefore conclude that our results are robust.
4 Discussion
4.1 Evolution in the Fraction of Wet, Mixed, and Dry Mergers
In Figure 6, we compare the fraction of wet, mixed, and dry mergers as a function of redshift, stellar mass, and projected separation for the sample of high-mass major mergers (in which both merging galaxies have masses 10). We find that the majority of the major mergers are wet (53%) and this fraction is higher (72%) for the the primary sample of mergers, which include galaxies with . We found that the fraction of wet major mergers increases with redshift. This increase is due to the higher fractions of star-forming galaxies at high-.
While wet mergers dominate merging events at , the relative importance of dry mergers increases over time, in agreement with previous results101010This trend was not observed by Lackner et al. (2014) although we used the same method to select mergers (see also §4.4). This is because they could not resolve the individual colors of merging galaxies. They could separate mergers only into wet and dry (not mixed) based on the color of the merging system. (Khochfar & Burkert, 2003; Lin et al., 2008). This is driven by the increase in the fraction of early-type galaxies at later cosmic times. We also found an increase of the dry merger fraction with increasing stellar masses, in agreement with the increase of the fraction of quiescent galaxies at the high-mass end. On the contrary, wet mergers are dominant at low masses (), with all merging events being wet at masses . A possible explanation for the lack of dry mergers at low stellar masses could be that most low-mass galaxies are star-forming or that low-mass quiescent galaxies are too small to be selected using the peak-finding algorithm. Since the code selects a minimum number of pixels above 5 from the smoothed image (Section §2.2), it is possible that small galaxies do not survive the high-pass filtering and therefore are not selected.
The fraction of mixed mergers as a function of redshift, stellar mass, and projected nuclei separation follows a similar trend to the fraction found in dry mergers, i.e., increasing with decreasing redshift and increasing stellar masses, and its evolution is roughly flat with separation. Studying a sample of close pairs in the DEEP2 Galaxy redshift Survey at , Lin et al. (2010) found that mixed and dry mergers reside in similar environments. These environments are denser than the environments where wet mergers reside. Although the study of the environments of our merging systems is beyond the scope of this paper, the similar environments of mixed and dry mergers could be the reason why their fractions follow similar trends.
According to the semi-analytical models of Khochfar & Burkert (2003) and the observations of Lin et al. (2008), dry mergers are the dominant mechanism responsible for the assembly of the most massive present-day elliptical galaxies, while wet and mixed mergers will produce red galaxies of intermediate mass. This is in agreement with the finding that wet mergers tend to have lower stellar masses, while dry mergers tend to be more common among the more massive galaxies in our sample. Mixed mergers might have a combination of a low-mass star-forming galaxy with a massive quiescent galaxy.
We found marginal evidence for an increase of the incidence of wet mergers with decreasing projected galaxy separation, while the fraction of dry and mixed mergers is found to remain flat as a function of separation. The small increase in the fraction of wet mergers with decreasing galaxy separation could be potentially caused by the mis-identification of an HII region or a star-forming clump within a star-forming galaxy. However, in the peak-finding algorithm, we avoid the selection of edge on disk galaxies and remove peaks that are too faint compared to the brightest peaks to avoid star-forming clumps. In addition, we avoid the potential selection of clumpy galaxies by imposing the restriction that both merging galaxies have , since typical clumps masses are lower than this limit (Guo et al., 2012). Therefore, contamination by star-forming clumps should not be the main reason for the increment. Another reason for the tentative increase in the fraction of wet mergers with decreasing galaxy separation could be that as merging galaxies approach, there is an increment in the level of activity of star formation. Hydrodynamical simulations of merging galaxies (e.g., Barnes & Hernquist, 1996; Di Matteo et al., 2007; Cox et al., 2008) have shown that torques exerted on the gas in the galaxies as a product of merger events result in a loss of angular momentum in the gas, which then falls towards the galaxy nucleus and leads to significant enhancement of star formation.
4.2 Lack of Starburst Galaxies at this Merger Stage
Galaxies that lie well above the main sequence of star-forming galaxies (4 or 5 above) are often interpreted as starbursts triggered by mergers (Rodighiero et al., 2011; Silverman et al., 2015). This is expected to occur especially in major mergers since they apparently trigger the strongest star formation rate enhancements (Ellison et al., 2008; Woods et al., 2010). On the contrary, galaxies that lie on the main sequence are thought to form stars in a quasi-steady process (Scoville et al., 2014, 2016; Béthermin et al., 2015) rather than through merger events. Surprisingly, we find that most of the merging galaxies selected in our work lie on the main sequence of star-forming galaxies rather than being star-bursting galaxies. While this result is, at face value, in disagreement with the aforementioned interpretation that starbursts are triggered by major mergers, it can be reconciled using the latest results from simulations of galaxy formation, recent ALMA observations, and some investigations of local mergers.
First, Fensch et al. (2017), using hydrodynamical numerical simulations, compared the star-formation activity triggered by high- and low- mergers, assuming they have gas fractions typical of (fgas=0.6) and (fgas=0.1) galaxies, respectively. These simulations showed that the star-formation rate enhancement induced by the high- mergers and its duration are 10 times lower than in low- mergers and the burst of star-formation activity in high- mergers occurs only at coalescence.
Second, Puech et al. (2014) classified 27 star-forming merging galaxies from IMAGES-CFS into three different merger stages: A pre-fusion phase in which the two progenitor galaxies can still be identified as distinct components; a fusion phase during which the merging galaxies are at the coalescence and reach the peak in star formation; and a relaxation phase during which the merger remnant reaches a relaxed dynamical state. They studied how galaxies in mergers are distributed across the main sequence as a function of their merger stage. They found that galaxies that lie 1 (0.3 dex) above the main sequence were galaxies in the fusion phase, while the main sequence was populated by merging galaxies in all three merger phases. They claimed that the SFR in each merger phase can be triggered by processes such as internal instabilities, minor mergers, or gas accretion. However, in the fusion phase, the SFR triggered by tidal torques during the merger is most important. It drives a fraction of the gas inward, resulting in a central starburst.
The nuclei of our merging galaxies have projected separation between 3-15 kpc, therefore they are still in a pre-coalescence/pre-fusion111111It is possible that they are in a stage after the first pericenter passage. With our current data we cannot distinguish between merging galaxies before or after this stage because we need to make a detailed study of the gas and the metallicity in the merging systems. However, according to the simulations of Fensch et al. (2017), the SFR in high- mergers does not increase significantly at the first pericenter passage, it is only enhanced at coalescence. Therefore, it is correct to assume that the mergers are in a pre-coalescence stage, since they show two distinct nuclei. stage and may be yet to reach the maximum level of star formation activity, in agreement with the simulations of Fensch et al. (2017) and the observational results of Puech et al. (2014). However, we found that ten of our pre-fusion phase mergers with are star-bursting since they have star-formation rates 0.5 dex larger than the star-formation rates of main sequence galaxies. Therefore, an additional ingredient may need to be taken into account for the increment of the SFR in merging galaxies.
Scoville et al. (2016) estimated the gas mass in galaxies in the COSMOS field by using dust continuum observations with ALMA. They suggested that high- starburst galaxies are the result of their larger gas masses (compared to main-sequence star-forming galaxies at the same redshift) rather than having an increasing efficiency in converting gas to stars as a result of merging events. The ten starbursts with found in this work are all dusty star-forming galaxies in wet mergers and eight of them have a dusty star-forming galaxy as a companion. Studies have shown that there is a correlation between the gas and dust mass in galaxies (which also depends on the metallicity and stellar mass of the galaxy, e.g. Magdis et al., 2011). If the dust content is a proxy of the gas mass in galaxies, it is possible that our sample of star-bursting merging galaxies has higher gas fractions (due to the higher dust content in the merging system) than the merging galaxies that lie on the main sequence. With higher gas fractions, galaxies in mergers could deviate above the main sequence even at early stages. Although our sample of starbursts is small, our results suggest that the enhancement of star formation activity depends on both the merger phase as indicated by Fensch et al. (2017) and Puech et al. (2014) and the gas content in the merging system as indicated by Scoville et al. (2016). Galaxy mergers containing higher gas (dust) fractions will reach the starburst phase earlier than at coalescence, although the level of star formation enhancement and its duration could arguably be reduced compared to local mergers. It is possible that the majority of the observed starbursts at high- are produced by (non-merging) galaxies with high gas fractions as indicated by Scoville et al. (2016) and only a small fraction of starbursts are triggered by major mergers. The starburst phase produced by mergers might be of short duration (as indicated by simulations) and may also depend on the gas fraction of the merging galaxies, making it more difficult to identify starbursts produced by a merging process.
4.3 Impact on the star formation activity in member galaxies
We note from Figure 8, that at masses there is a significantly larger incidence of starbursts than at larger stellar masses (20% and 12% of the major merging galaxies are starbursts in the low- and high-mass range, respectively). It might indicate at first glance, that the star formation activity in merging galaxies with the lower mass are more affected by the interaction than their higher mass companions. To know which of the merging galaxy in our sample are affected the most, we compare the specific star formation rate (sSFR=SFR/M⋆) of the lower and higher mass member galaxy in wet mergers. When both merging galaxies have masses , we find that 31% of the lower mass merging members have higher sSFR than their higher mass companions. When at least one galaxy in the merger has a mass , this fraction increases to 37%. These results indicate that the most massive merging galaxy is more affected by the interaction, in agreement with the findings of Davies et al. (2015). In their work, they investigated the link between dynamical phase and star formation in galaxy pairs at . They found that star formation is enhanced in the higher mass companion in the pair and suppressed in the lower mass galaxy. They suggest that the suppression in star formation in the low-mass galaxy is due to gas heating or stripping, while the enhancement in the high-mass galaxy is produced by tidal gas turbulence and shocks. In contrast, we find that the fraction of mergers in which the lower mass member has higher sSFR than its higher mass companion is 56% when at least one member has a mass , in agreement with Li et al. (2008). They studied the interaction-induced star formation in a sample of 105 star-forming galaxies at . They measured the enhancement in star formation as a function of projected separation between two galaxies and found that the star formation in low-mass galaxies (=9.72) is more strongly enhanced than in the most massive galaxies (=10.6). Our findings suggest that as the mass of both merging galaxies increases, the star formation activity in the less massive member is more affected by the interaction.
4.4 Comparison with previous works
In our work, we adopt the method presented in Lackner et al. (2014) to find merging galaxies. Lackner et al. (2014) select galaxy pairs with projected separations 2.2-8.0 kpc from a mass-complete sample (merging systems with total mass ) in the redshift range . They apply the peak-finding algorithm to ACS I-band images for galaxies in the COSMOS field. In Table 4, we compare the fraction of merging galaxies found in Lackner et al. (2014) and in our work using the H160 images in the CANDELS fields (we compare with the primary, the high-mass sample, and with merging galaxies in which both components have masses ). Since Lackner et al. (2014) did not resolve the properties of individual galaxies in pairs, they correct the fraction of mergers for chance superpositions, incompleteness, and contamination from minor mergers and clumpy galaxies using simulations. In our approach, instead, we model the de-blended SEDs of the individual merging galaxies, deriving new photometric redshifts and stellar population properties. Moreover, our high-mass sample is complete at for the individual galaxies in the merging systems, whereas the sample of Lackner et al. (2014) is complete for merging systems with total mass . In addition, the sample of mergers in Lackner et al. (2014) has merging galaxies with nuclei separations from 2.2 to 8 kpc and in our work from 3 to 15 kpc. As shown in Table 4, we find a lower fraction of mergers compared to Lackner et al. (2014) in the redshift range in which the samples overlap. Given the mentioned differences in the two samples, it is difficult to pin down where these differences arises from.
| Lackner et al. (2014) | High-mass sample | Primary sample | |||||||
|---|---|---|---|---|---|---|---|---|---|
| Ngal | Nmgr | (correcteda) | N | Nmgr | N | Nmgr | |||
| 867 | 15 | 1.70.6 (1.90.5) | 128 | 0 | 0 (0)∗ | 1039 | 2 | 0.20.3 | |
| 1644 | 39 | 2.40.4 (4.20.8) | 597 | 8 | 1.30.7 (1.61.3)∗ | 3168 | 10 | 0.30.1 | |
| 3383 | 82 | 2.40.3 (6.60.8) | 1066 | 8 | 0.70.4 (1.10.9)∗ | 4317 | 15 | 0.30.1 | |
| – | – | – | 1785 | 19 | 1.10.3 | 4952 | 42 | 0.80.1 | |
| – | – | – | 1374 | 14 | 1.00.4 | 3094 | 35 | 1.10.2 | |
| – | – | – | 895 | 15 | 1.70.6 | 1753 | 26 | 1.50.4 | |
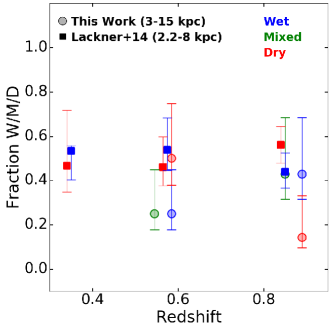
Lackner et al. (2014) separate their sample into quiescent and star-forming based on the rest-frame near-UV (NUV) and colors, where the NUV corresponds to the GALEX filter at 0.23 m and refers to the Subaru -band. They classify mergers as wet/dry if the total merging system is star-forming/quiescent, respectively. In contrast, we could resolve the colors of individual galaxies in mergers and separate mergers into wet, mixed, and dry as presented in §3.1. Figure 11 shows the fraction of wet and dry mergers as a function of redshift found by Lackner et al. (2014) compared to the fraction of wet, mixed, and dry mergers found in our work. Lackner et al. (2014) find an almost constant fraction of wet and dry merger with redshift. In contrast, we find an increment in the fraction of dry mergers with decreasing redshift, in agreement with previous results (see §4.1). We stress however that our results and those from Lackner et al. (2014) cannot be directly compared, because our colors are resolved for the merging galaxies, whereas those from Lackner et al. (2014) are integrated over the whole merging system (in addition to the differences in stellar mass of the studied samples). Because we define wet/mixed/dry mergers based on resolved colors, our analysis and findings are arguably more robust
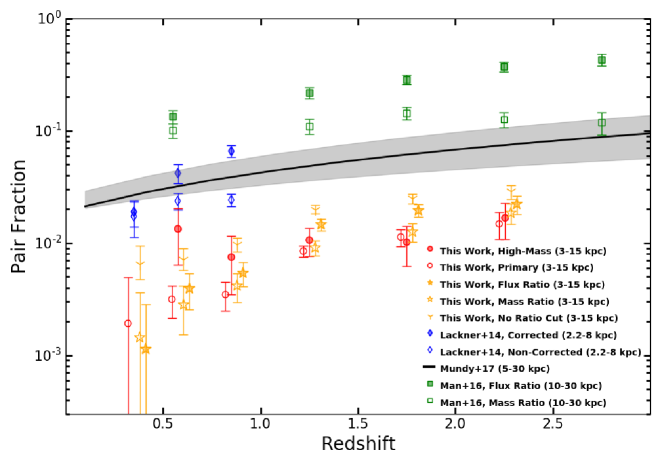
Although the measurement of the merger rate will be addressed in future publications, Figure 12 presents a simple comparison with previous works of the pair fraction (value that is necessary to calculate the merger rate) as a function of redshift. The pair fraction is defined as the number of pairs (merging systems) divided by the total number of galaxies found in a given redshift bin (in our case , Table 4). The filled and empty red circles are the fraction of mergers found for the high-mass and the primary sample, respectively. We remind the reader that the high-mass sample includes merging systems in which all the individual galaxies have , whereas for the primary sample the lowest mass galaxy has . The fraction of mergers obtained when we apply only a flux and a mass ratio cut, and when we apply no ratio cut (Appendix A) is shown with the orange symbols. The open and filled diamonds show the pair fraction obtained by Lackner et al. (2014) for their corrected and non-corrected values, respectively. The open and filled squares show the pair fraction found by Man et al. (2016)121212We plot from the values tabulated in Tables 1 and 2 for their sample of mergers obtained from the 3D-HST catalog. . They present a photometrically selected sample of mergers at 0.33 and using the ULTRAVISTA and the 3D-HST catalogs. They select mergers with projected separations between 10 to 30 kpc using the H160-band flux and stellar mass ratios. The solid curve in Figure 12 is the best fit in the pair fraction for galaxies found by Mundy et al. (2017) (). This fit is for merging galaxies with stellar masses M⊙ and nuclei separations between 5 to 30 kpc. They obtain the fit from studying a sample of mergers at 0.05 from the UKIDSS UDS, VIDEO/CFHT-LS, UltraVISTA/COSMOS and GAMA survey regions. Direct comparisons of the pair fractions plotted in Figure 12 is difficult given the different stellar mass ranges probed by the different works and the different separations of the merging galaxies. For example, in addition to the different stellar mass range ( vs ), our work and that from Man et al. (2016) probe almost complementary regimes in nuclei separation, with d=3-15 kpc and d=10-30 kpc, respectively. However, it appears that the pair fraction decreases drastically as the separation of the nuclei decreases. Finding pairs separated only by a few kpc is observationally challenging, especially at high redshift, and methods like the one developed by Lackner et al. (2014), which we adopted, are necessary to probe this small separation regime. Our work contributes to extend to high redshift (2.5) the investigation of merging galaxies separated by 3-15 kpc and close to coalescence.
5 Summary and Conclusions
We studied the star formation properties of a sample of merging systems at and having a projected separation of 3-15 kpc between the individual nuclei. We selected galaxy pairs by applying a peak-finding algorithm to the HST F160W images of sources identified in the CANDELS/3D-HST catalog which covers the COSMOS, AEGIS, GOODS-N, GOODS-S, and UDS fields. We find that 28% of these galaxy pairs are blended (not resolved) in 3D-HST and obtained the de-blended properties of their members. Using a flux and mass ratio cut 1:4, and the redshifts and projected separations of the galaxies in pairs, we found 130 major merging systems. With the combination of the peak-finding code and the de-blended analysis, we increased the sample of major mergers by 73% compared to what would have been obtained using the 3D-HST catalog only. This increment is substantial for systems with galaxies with stellar masses , nuclei projected separations 9 kpc, and redshifts . Since the sample of major mergers could be contaminated by star-forming clumps, we select those major mergers in which both merging galaxies have (64 systems). Wet, mixed, and dry mergers were classified according to the colors of the individual components in the mergers. Our findings can be summarized as follow:
-
•
The majority of the major mergers are wet and their fraction increases with redshift and decreasing stellar mass. The fraction of dry mergers increases over time due to increase of the fraction of early-type galaxies at later cosmic times.
-
•
We compare the star formation activity in merging and non-merging galaxies and found no significant difference between them. We found that only 12% of the major merging galaxies with are star-bursting, with star-formation rates larger than the main sequence by 0.5 dex or more. These galaxies are dusty star-forming galaxies and are in wet mergers. On the contrary, merging galaxies with lower masses showed a higher fraction of star-bursting galaxies (20%).
-
•
We find that as the mass of the merging galaxies increases, the star formation activity in the less massive member in the merger suffers a more dramatic impact than its companion galaxy.
-
•
Simulations of high- mergers suggest that the maximum level of star formation activity in merging systems will occur at coalescence and the intensity and duration of this activity will be lower than in local mergers. Since our sample of mergers have galaxy nuclei separations between 3-15 kpc, they are still in an pre-coalescence stage and are yet to reach their maximum level of star formation activity.
-
•
Our results suggest that the enhancement in the star formation activity in mergers might also depend on the physical properties of the merging galaxies, such as the gas (dust) content and stellar mass. Mergers with higher gas fractions and those with lower stellar masses will increase their star formation activity even before coalescence.
-
•
Our work contributes to extend to 2.5 the investigation of merging galaxies close to coalescence.
We thank the anonymous referee for useful comments which helped to improve this paper.
Appendix A Comparison of the merger properties selected using different mass and flux ratios
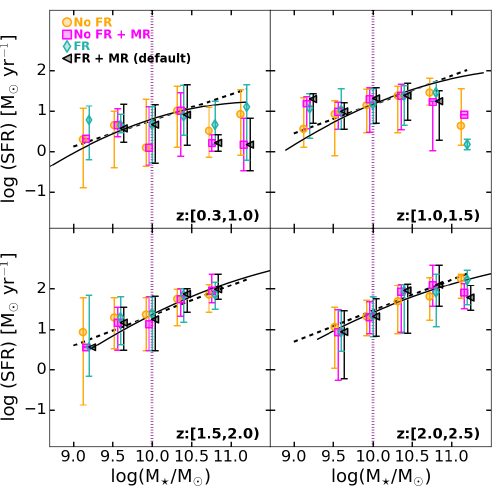
We compare the properties of merging galaxies selected using different combinations of flux and mass ratio cuts. We repeat relevant figures such as Figures 5, 6, and 9 applying different restrictions in the selection of mergers: no restriction in mass and flux ratio (No FR), only mass ratio cut (No FR+MR), only flux ratio cut (FR), and both flux and mass ratio cut (FR+MR; as adopted for the ”primary” sample ). In addition to these cuts, we also apply the restrictions indicated in section 2.2 (such as restrictions in redshift values and minimum and maximum separation between the nuclei) to select merging galaxies.
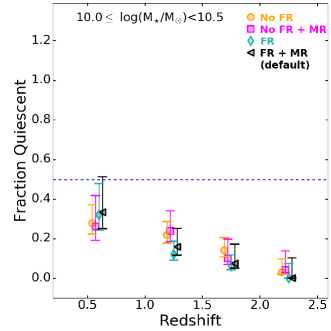
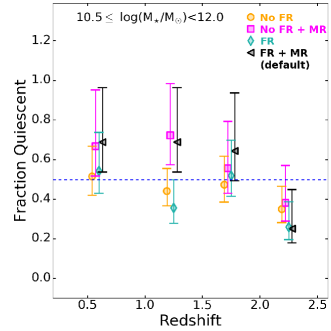
Figure 13 shows the fraction of quiescent galaxies as a function of redshift for two mass bins as in Figure 5. In the mass range , the maximum difference between the less restrictive cuts (FR, no FR+MR, FR) with respect to the cut that includes both flux and mass ratio (FR+MR) is smaller than the uncertainties in the measurements (differences are 47% to 97% of the values of typical uncertainties). In this mass range, we see an increment in the fraction of quiescent galaxies with decreasing redshift using any flux or mass ratio cut. In the mass range , the differences in the fractions are smaller than the typical uncertainties except in the redshift range , where the mass ratio restriction is the major factor that makes the difference. In this mass range, we do not see a clear trend in the fraction of quiescent galaxies as a function of redshift for any mass or flux ratio cut. At the fraction of quiescent galaxies is smaller than the fraction of star-forming galaxies. In most cases, the fraction of quiescent galaxies tend to be higher when the mass ratio cut is applied. Comparing both mass ranges, the fraction of quiescent galaxies is always lower in the low-mass than in the high-mass range, independent of the adopted ratio restriction.
Figure 14 shows the comparison for the fraction of wet mergers as a function of redshift, stellar mass, and separation for the different ratio cuts. In all these plots the fraction of galaxies in wet mergers are within the uncertainties of the different results when different ratio cuts are applied. For the different selection, the trends are all consistent.
Finally, Figure 15 also shows consistent results between the different selection restrictions, indicating that overall the mass and flux ratio cuts only affect quantitatively the number of selected mergers, but their overall properties remain the same.
Appendix B Impact of using a single band to select mergers
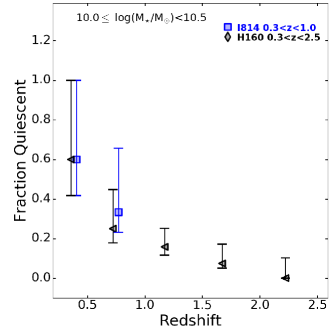
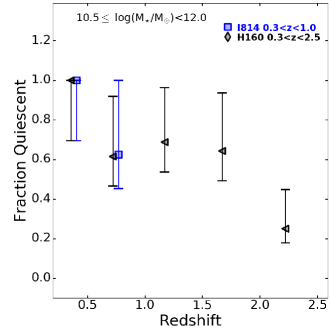
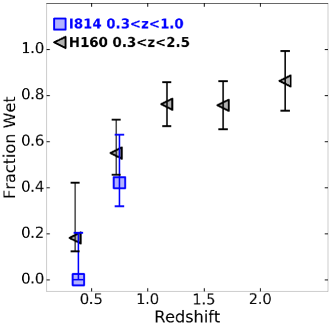
We run the peak-finding algorithm on I814 stamps for galaxies at in the CANDELS fields, with the exception of the GOODS-North field, where we have only the I850-band available. Because we want to select merging galaxies redward of the 4000 break, the I814 band is limited to . We want to probe that the selection of merging galaxies using the I814 and the H160 independently do not affect the results shown in this paper. In this selection we keep galaxies with .
Figure 16 shows the fraction of quiescent galaxies as a function of redshift in two bins of mass, while Figure 17 presents the fraction of wet mergers as a function of redshift, and the median of the star formation rate as a function of stellar mass for galaxies selected using the I814 and the H160 band. In all these figures we find no significant difference between the results.
References
- Armus et al. (1987) Armus, L., Heckman, T., & Miley, G. 1987, AJ, 94, 831
- Barnes & Hernquist (1996) Barnes, J. E., & Hernquist, L. 1996, ApJ, 471, 115
- Béthermin et al. (2015) Béthermin, M., Daddi, E., Magdis, G., et al. 2015, A&A, 573, A113
- Brammer et al. (2008) Brammer, G. B., van Dokkum, P. G., & Coppi, P. 2008, ApJ, 686, 1503-1513
- Bridge et al. (2010) Bridge, C. R., Carlberg, R. G., & Sullivan, M. 2010, ApJ, 709, 1067
- Bruzual & Charlot (2003) Bruzual, G., & Charlot, S. 2003, MNRAS, 344, 1000
- Cattaneo et al. (2008) Cattaneo, A., Dekel, A., Faber, S. M., & Guiderdoni, B. 2008, MNRAS, 389, 567
- Chabrier (2003) Chabrier, G. 2003, PASP, 115, 763
- Cibinel et al. (2015) Cibinel, A., Le Floc’h, E., Perret, V., et al. 2015, ApJ, 805, 181
- Cisternas et al. (2011) Cisternas, M., Jahnke, K., Inskip, K. J., et al. 2011, ApJ, 726, 57
- Cole et al. (2008) Cole, S., Helly, J., Frenk, C. S., & Parkinson, H. 2008, MNRAS, 383, 546
- Cox et al. (2008) Cox, T. J., Jonsson, P., Somerville, R. S., Primack, J. R., & Dekel, A. 2008, MNRAS, 384, 386
- Daddi et al. (2010) Daddi, E., Bournaud, F., Walter, F., et al. 2010, ApJ, 713, 686
- Davies et al. (2015) Davies, L. J. M., Robotham, A. S. G., Driver, S. P., et al. 2015, MNRAS, 452, 616
- Dekel et al. (2009) Dekel, A., Birnboim, Y., Engel, G., et al. 2009, Nature, 457, 451
- Di Matteo et al. (2007) Di Matteo, P., Combes, F., Melchior, A.-L., & Semelin, B. 2007, A&A, 468, 61
- Ellison et al. (2008) Ellison, S. L., Patton, D. R., Simard, L., & McConnachie, A. W. 2008, AJ, 135, 1877
- Ellison et al. (2013) Ellison, S. L., Mendel, J. T., Scudder, J. M., Patton, D. R., & Palmer, M. J. D. 2013, MNRAS, 430, 3128
- Fensch et al. (2017) Fensch, J., Renaud, F., Bournaud, F., et al. 2017, MNRAS, 465, 1934
- Gehrels (1986) Gehrels, N. 1986, ApJ, 303, 336
- Guo et al. (2012) Guo, Y., Giavalisco, M., Ferguson, H. C., Cassata, P., & Koekemoer, A. M. 2012, ApJ, 757, 120
- Hopkins et al. (2006) Hopkins, P. F., Hernquist, L., Cox, T. J., et al. 2006, ApJS, 163, 1
- Hopkins et al. (2008) Hopkins, P. F., Hernquist, L., Cox, T. J., & Kereš, D. 2008, ApJS, 175, 356-389
- Hung et al. (2013) Hung, C.-L., Sanders, D. B., Casey, C. M., et al. 2013, ApJ, 778, 129
- Kartaltepe et al. (2010) Kartaltepe, J. S., Sanders, D. B., Le Floc’h, E., et al. 2010, ApJ, 721, 98
- Kartaltepe et al. (2012) Kartaltepe, J. S., Dickinson, M., Alexander, D. M., et al. 2012, ApJ, 757, 23
- Kartaltepe et al. (2015) Kartaltepe, J. S., Mozena, M., Kocevski, D., et al. 2015, ApJS, 221, 11
- Kauffmann & White (1993) Kauffmann, G., & White, S. D. M. 1993, MNRAS, 261
- Kauffmann et al. (1999) Kauffmann, G., Colberg, J. M., Diaferio, A., & White, S. D. M. 1999, MNRAS, 303, 188
- Kaviraj et al. (2013) Kaviraj, S., Cohen, S., Windhorst, R. A., et al. 2013, MNRAS, 429, L40
- Kaviraj et al. (2015) Kaviraj, S., Devriendt, J., Dubois, Y., et al. 2015, MNRAS, 452, 2845
- Khochfar & Burkert (2003) Khochfar, S., & Burkert, A. 2003, ApJ, 597, L117
- Kriek et al. (2009) Kriek, M., van Dokkum, P. G., Labbé, I., et al. 2009, ApJ, 700, 221
- Lackner et al. (2014) Lackner, C. N., Silverman, J. D., Salvato, M., et al. 2014, AJ, 148, 137
- Lanz et al. (2013) Lanz, L., Zezas, A., Brassington, N., et al. 2013, ApJ, 768, 90
- Li et al. (2008) Li, C., Kauffmann, G., Heckman, T. M., Jing, Y. P., & White, S. D. M. 2008, MNRAS, 385, 1903
- Lin et al. (2008) Lin, L., Patton, D. R., Koo, D. C., et al. 2008, ApJ, 681, 232-243
- Lin et al. (2010) Lin, L., Cooper, M. C., Jian, H.-Y., et al. 2010, ApJ, 718, 1158
- Lofthouse et al. (2017) Lofthouse, E. K., Kaviraj, S., Conselice, C. J., Mortlock, A., & Hartley, W. 2017, MNRAS, 465, 2895
- Magdis et al. (2011) Magdis, G. E., Daddi, E., Elbaz, D., et al. 2011, ApJ, 740, L15
- Man et al. (2016) Man, A. W. S., Zirm, A. W., & Toft, S. 2016, ApJ, 830, 89
- Martis et al. (2016) Martis, N. S., Marchesini, D., Brammer, G. B., et al. 2016, ApJ, 827, L25
- Mihos & Hernquist (1996) Mihos, J. C., & Hernquist, L. 1996, ApJ, 464, 641
- Momcheva et al. (2016) Momcheva, I. G., Brammer, G. B., van Dokkum, P. G., et al. 2016, ApJS, 225, 27
- Mundy et al. (2017) Mundy, C. J., Conselice, C. J., Duncan, K. J., et al. 2017, MNRAS, 470, 3507
- Neistein & Dekel (2008) Neistein, E., & Dekel, A. 2008, MNRAS, 388, 1792
- Parkinson et al. (2012) Parkinson, D., Riemer-Sørensen, S., Blake, C., et al. 2012, Phys. Rev. D, 86, 103518
- Patton et al. (2013) Patton, D. R., Torrey, P., Ellison, S. L., Mendel, J. T., & Scudder, J. M. 2013, MNRAS, 433, L59
- Peng et al. (2002) Peng, C. Y., Ho, L. C., Impey, C. D., & Rix, H.-W. 2002, AJ, 124, 266
- Perlmutter et al. (1999) Perlmutter, S., Aldering, G., Goldhaber, G., et al. 1999, ApJ, 517, 565
- Perret et al. (2014) Perret, V., Renaud, F., Epinat, B., et al. 2014, A&A, 562, A1
- Puech et al. (2014) Puech, M., Hammer, F., Rodrigues, M., et al. 2014, MNRAS, 443, L49
- Riess et al. (1998) Riess, A. G., Filippenko, A. V., Challis, P., et al. 1998, AJ, 116, 1009
- Robaina et al. (2010) Robaina, A. R., Bell, E. F., van der Wel, A., et al. 2010, ApJ, 719, 844
- Rodighiero et al. (2011) Rodighiero, G., Daddi, E., Baronchelli, I., et al. 2011, ApJ, 739, L40
- Sanders & Mirabel (1996) Sanders, D. B., & Mirabel, I. F. 1996, ARA&A, 34, 749
- Scoville et al. (2014) Scoville, N., Aussel, H., Sheth, K., et al. 2014, ApJ, 783, 84
- Scoville et al. (2016) Scoville, N., Sheth, K., Aussel, H., et al. 2016, ApJ, 820, 83
- Scudder et al. (2015) Scudder, J. M., Ellison, S. L., Momjian, E., et al. 2015, MNRAS, 449, 3719
- Silverman et al. (2015) Silverman, J. D., Daddi, E., Rodighiero, G., et al. 2015, ApJ, 812, L23
- Skelton et al. (2014) Skelton, R. E., Whitaker, K. E., Momcheva, I. G., et al. 2014, ApJS, 214, 24
- Speagle et al. (2014) Speagle, J. S., Steinhardt, C. L., Capak, P. L., & Silverman, J. D. 2014, ApJS, 214, 15 ons, B. D., Urry, C. M., Schawinski, K., Cardamone, C., & Glikman, E. 2012, ApJ, 761, 75
- Springel et al. (2005) Springel, V., Di Matteo, T., & Hernquist, L. 2005, ApJ, 620, L79
- Tacconi et al. (2010) Tacconi, L. J., Genzel, R., Neri, R., et al. 2010, Nature, 463, 781
- Tasca et al. (2014) Tasca, L. A. M., Le Fèvre, O., López-Sanjuan, C., et al. 2014, A&A, 565, A10
- Whitaker et al. (2012) Whitaker, K. E., van Dokkum, P. G., Brammer, G., & Franx, M. 2012, ApJ, 754, L29
- Whitaker et al. (2014) Whitaker, K. E., Franx, M., Leja, J., et al. 2014, ApJ, 795, 104
- Whitaker et al. (2015) Whitaker, K. E., Franx, M., Bezanson, R., et al. 2015, ApJ, 811, L12
- White & Frenk (1991) White, S. D. M., & Frenk, C. S. 1991, ApJ, 379, 52
- Williams et al. (2011) Williams, R. J., Quadri, R. F., & Franx, M. 2011, ApJ, 738, L25
- Woods et al. (2010) Woods, D. F., Geller, M. J., Kurtz, M. J., et al. 2010, AJ, 139, 1857
- Wuyts et al. (2012) Wuyts, S., Förster Schreiber, N. M., Genzel, R., et al. 2012, ApJ, 753, 114
- Yuan et al. (2012) Yuan, F.-T., Takeuchi, T. T., Matsuoka, Y., et al. 2012, A&A, 548, A117