Extreme circumgalactic H i and C iii absorption around the most massive, quenched galaxies
Abstract
Luminous red galaxies (LRGs) are the most massive galaxies at and, by selection, have negligible star formation. These objects have halo masses between those of galaxies, whose circumgalactic media (CGM) are observed to have large masses of cold gas, and clusters of galaxies, which primarily contain hot gas. Here we report detections of strong and extended metal (C III 977) and H I lines in the CGM of two LRGs. The C III lines have equivalent widths of Å and Å, and velocity spreads of and , exceeding all such measurements from local galaxies (maximal C III equivalent widths Å). The data demonstrate that a subset of halos hosting very massive, quenched galaxies contain significant complexes of cold gas. Possible scenarios to explain our observations include that the LRGs’ CGM originate from past activity (e.g., star formation or active galactic nuclei driven outflows) or from the CGM of galaxies in overlapping subhalos. We favor the latter scenario, in which the properties of the CGM are more tightly linked to the underlying dark matter halo than properties of the targeted galaxies (e.g., star formation).
1 Introduction
A series of absorption-line surveys piercing the halos of individual galaxies have established the near-ubiquitous presence of a large reservoir of cool and enriched gas in the circumgalactic environment. This cool circumgalactic medium (CGM) is manifest in galaxies with a wide range of luminosity and across most of cosmic time (e.g., Tumlinson et al., 2017; Chen, 2017). In the ‘normal’ population of field galaxies, one now recognizes the cool CGM as a fundamental baryonic component of galaxies and, therefore, a main cog in the machinery of galaxy formation.
From this ensemble of observational CGM studies, several key trends and puzzles emerge. Of particular interest to this work is the apparent correlation between the absorption strength of the cool CGM and galaxy mass (Chen et al., 2010; Prochaska et al., 2011, 2014). Most recently, Bordoloi et al. (2017) has emphasized a strong correlation between the Ly equivalent width (EW) and the galaxy stellar mass in present-day, galaxies. These authors interpret the increase in EW with stellar mass as a fundamental relation between the CGM dynamics and the underlying dark matter halo mass. Another, more puzzling, result that has materialized is the preponderance of this cool CGM even around quiescent galaxies (Thom et al., 2012; Zhu et al., 2014; Huang et al., 2016; Zahedy et al., 2016; Tumlinson et al., 2017; Chen, 2017), but see also Lan et al. (2014). Despite an interstellar medium in many cases nearly devoid of cool gas and minimal active star-formation (e.g., Young et al., 2014), these galaxies exhibit CGM with HI and low-ionization metal content comparable to the star-forming population. Extrapolating these two results to higher mass halos, where red and dead galaxies proliferate, one might conclude that galaxy clusters may harbor the largest mass of cool halo gas in the universe.
This assertion, however, runs contrary to observations of the hot intracluster medium in galaxy clusters (Mitchell et al., 1976) and theoretical work which predicts a predominantly virialized gas (Voit, 2005; Dekel & Birnboim, 2006; Kravtsov & Borgani, 2012). And, indeed, the few studies that have examined the cool CGM of galaxy clusters support a suppressed incidence of such gas both within the halo and within the halos of the cluster members (Burchett et al., 2018; Yoon & Putman, 2017), but see also Lopez et al. (2008). These results, while still sparse, suggest a rapid decline in the cool CGM in the most massive halos.
Another opportunity to extend CGM studies into the high halo-mass regime is afforded by the set of over 1 million luminous red galaxies (LRGs) discovered in the Sloan Digital Sky Survey (Dawson et al., 2013). These galaxies have inferred halo masses (White et al., 2011) and, by selection, have negligible on-going star formation. Focusing on the Mg II doublet (the best cool CGM diagnostic available at optical wavelengths for intermediate redshifts), CGM surveys of LRGs have demonstrated a lower incidence of such gas than around galaxies, with covering fraction of % (e.g., Huang et al., 2016). Nevertheless, the full statistical power of the BOSS experiment has revealed a strong excess in the cross-correlation between Mg II and the LRG within the virial radius (Zhu et al., 2014, and references therein) Furthermore, the relation of estimated mean EW with impact parameter approaches that of galaxies (Prochaska et al., 2014, fig. 10).
Inspired by the Zhu et al. (2014) survey, we pursued far-UV observations for a modest sample (15) of QSO sightlines probing the LRG-CGM. Our data access the strong H I Lyman series and metal-line transitions that trace intermediate (e.g. C III) and highly ionized gas (O VI) at the LRG redshifts, which ground-based surveys did not. In this Letter, we report on the surprising detection of two LRGs whose cool CGM absorption exceeds that of all previous measurements of galaxies. This manuscript is organized as follows: In Section 2, we briefly describe the data and spectral line measurements. Section 3 puts these two LRGs in the broader context of CGM observations and discusses the origin of our extreme CGM cases.
2 Data, sample and measurements
The two LRG-QSO pairs analyzed here are taken from a larger survey studying the CGM of LRGs, which we describe here briefly. The SDSS-III/Baryon Oscillation Spectroscopic Survey (BOSS; Dawson et al., 2013) contains over spectra of LRGs at redshifts . We matched LRGs from the BOSS survey and QSOs from the SDSS DR12 survey (Pâris et al., 2017), such that the projected distance between the QSO and the LRG (impact parameter) is less than kpc, and the LRG has a redshift . From this sample we selected 15 pairs where the quasars have bright GALEX magnitudes and where approximately half were previously known to exhibit Mgii absorption in the LRG-CGM (Zhu et al., 2014). A complete survey description is forthcoming by Smailagić et al. (2018, in preparation).
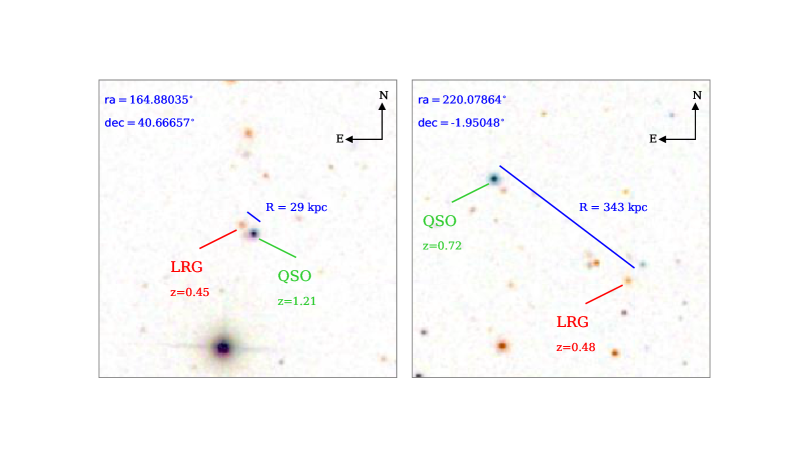
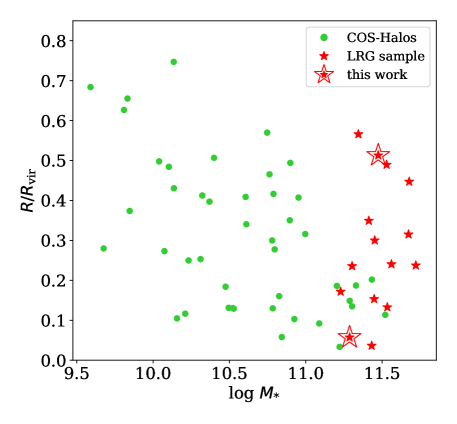
Images from the Sloan Digital Sky Survey (SDSS) of LRG_1059+4039 and LRG_1440-0156 are shown in Figure 1. Both LRGs are located at and have impact parameters of kpc and kpc, typical of the full sample. The bottom panel in Figure 1 shows the impact parameter (scaled to the virial radius111 We estimate halo masses from stellar masses and Moster et al. (2010) relation between stellar and dark matter halo mass. Stellar masses are used from the Wisconsin group, wisconsin_pca_m11-DR12-boss.fits.gz http://www.sdss.org/dr14/spectro/galaxy_wisconsin/ ) Virial radius is calculated as for COS-Halos in Tumlinson et al. (2013). ) versus the stellar mass for our full sample of 15 LRGs; galaxies from the COS-Halos survey (Werk et al., 2012) are also plotted for reference.
We obtained HST COS spectra of the 15 QSOs in Cycle 23 (GO-14171 ; PI Guangtun Zhu). We used the G140L grating with resolving power for the wavelengths of interest (spectral resolution km s-1). Wavelength coverage for the segment A is Å, and signal-to-noise ratio per pixel is . Data were reduced using the CALCOS v2.21 software package and our own custom Python codes222https://github.com/PYPIT/COS_REDUX. Our modifications to the CALCOS software follow those described by Worseck et al. (2016), and include a modified estimate of the dark current and modified co-addition of sub-exposures. In the reduced spectra, the quasar continuum was estimated by generating a cubic spline ‘anchor’ points set by eye using the lt_continuumfit GUI of the linetools package333https://github.com/linetools/linetools. Absorption lines were identified with the igmguesses tool from the PYIGM package444https://github.com/pyigm/pyigm. EWs were calculated from box-car integration across the absorption complex. Line detections are considered reliable if their EWs exceed three times their estimated uncertainties.
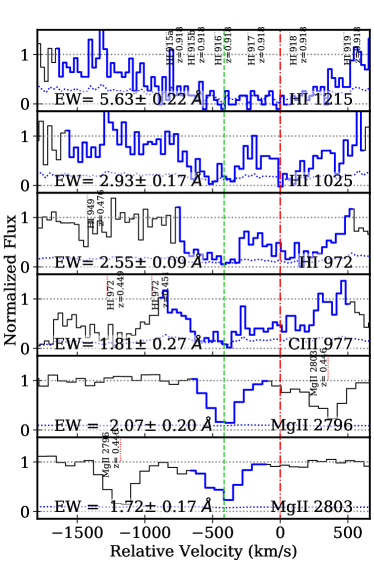
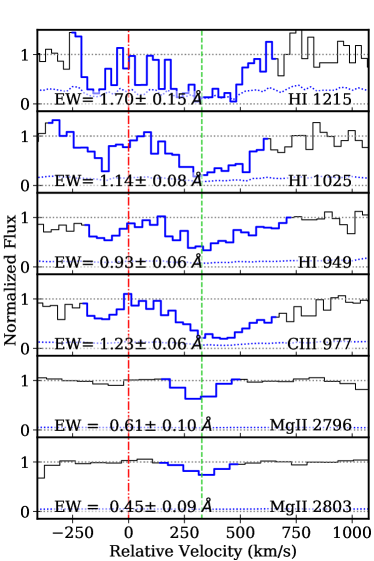
Regarding line-identification, which is non-trivial for sightlines to quasars, we first identified strong lines in the Milky Way and those associated with the QSO. We then searched for lines near the LRG redshift, beginning with the H I Lyman series and proceeding to metal-line transitions. We also searched for unrelated, strong absorption systems along the sightline that could present interloping absorption with the LRG-CGM lines. A subset of the transitions identified with the LRG-CGM is shown in Figures 2 and 3. It is evident that these galaxies exhibit very strong low, intermediate, and even high-ion absorption. One also notes that the strongest low and intermediate-ion absorption is coincident with the largest optical depth of Mg II from the SDSS QSO spectra.
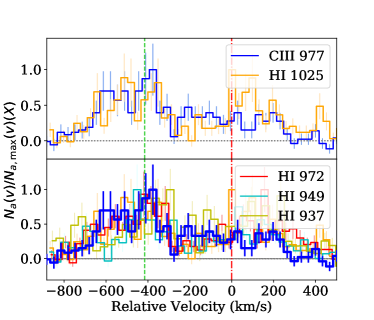
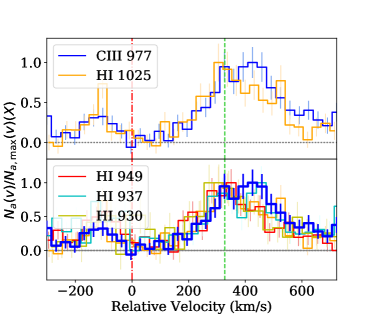
To further confirm the line identifications, Figures 2 and 3 also compare scaled apparent column densities of C iii 977 and H i transitions. For example, from Figure 3 we see that the scaled apparent column density profiles for C iii 977 and H i 1025 are consistent in the velocity range from -300 to 400 km s-1. At velocities km s-1, the C III line is possibly blended, or the physical conditions of the gas may differ, changing the C III/H I ratio as well. This close alignment between the absorption from these two species over such a large velocity range corroborates the identification of this system while revealing an extraordinary complex of metal-enriched gas in the CGM of the LRG. We find similar results for LRG_1059+4039 and for the other H i transitions.
Next, we measure the velocity spread for C III 977, which is defined as the velocity interval containing 90% of the total optical depth (Prochaska & Wolfe, 1997). Pixels where flux is below noise level were replaced with the noise. The two LRGs have and km s-1, respectively. These values will decrease by if consider the COS spectrograph resolution. We also caution that the C III 977 lines are saturated. The Ly lines are also saturated, but we obtain = 1497 and 640 if we measure them in the same manner.
3 Results and Discussion
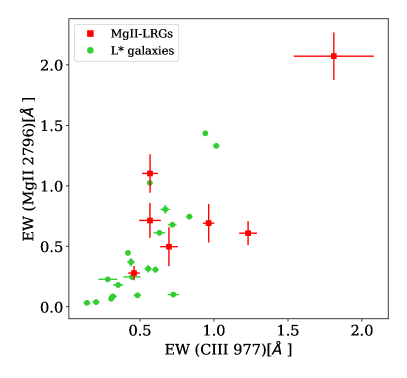
The spectra shown in Figures 2 and 3 demonstrate the presence of extremely strong, cool CGM absorption-profiles surrounding LRG_1059+4039 and LRG_1440-0156. To provide context, we compare the measured C III 977 EWs against the data for low- galaxies from the COS-Halos survey (Figure 4; Werk et al., 2013). The C iii EWs of the two LRG CGM ( Å and Å ) clearly exceed the entire galaxy distribution. In fact, the LRG_1059+4039 C III absorption is nearly twice as strong as the CGM maximum. To date, the only other population of galaxies known to exhibit such strong and extended absorption lines are QSO host galaxies at (Prochaska et al., 2013; Lau et al., 2016) and ultra-strong Mg II absorbers (e.g., Nestor et al., 2011). We note that a few other individual examples of large low-ion EWs associated with the CGM of luminous red or massive elliptical galaxies (Gauthier, 2013; Zahedy et al., 2016) have been reported. However, none of these studies found metal UV transitions exceeding those of galaxies. Figure 4 also shows that our two LRGs and some of the galaxies exceed other known LRGs CGM with available C III measurements (recently studied by Chen et al., 2018). We note that certain galaxies are associated with ultra-strong Mg II absorbers (e.g., Nestor et al., 2011); however, these associations are rare and are possibly (post-)starbursts. Nevertheless, C III measurements are not available for these strong absorbers. Using the combined sample of COS-Halos (Werk et al., 2013) and our sample of LRGs, a Spearman correlation test shows a -sigma correlation between EW(C III) and EW(Mg II), see Figure 5. This indicates that C III and Mg II might track one another. However, the scatter in this relation is Å, and if we fit a linear relation between EW(C III) and EW(Mg II), then for 3 of 7 LRGs, the difference between the measured and predicted EW(C III) will be greater than 0.4 Å (for all COS-Halos systems, the differences are Å). For example, one of the large-EW(C III) LRGs featured in this work shows an EW(Mg II) that lies Å below this would-be relation and in fact has a smaller EW(Mg II) than several of the EW(C III) Å COS-Halos and LRG systems. In addition, the same correlation for absorbers with EW(C III) Å (LRGs from our full sample, COS-Halos, Chen et al. (2018) galaxies) is significant to only 1.1 . Given this and the large scatter in a such a correlation, we contend that Mg II and C III offer independent information on the CGM of LRGs. Certainly, the presence of Mg II absorption does not ensure such strong and widely extended C III as we report here (cf. the Mg II and C III profiles in Figs. 2 and 3)
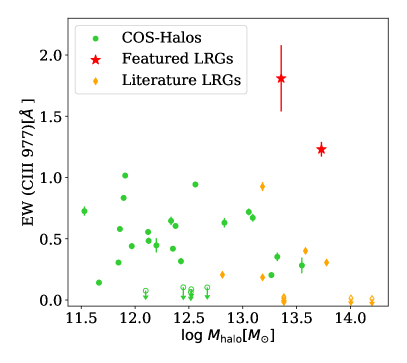
a We found that in Chen et al. (2018) LRGs are defined differently than as originally defined in BOSS survey (see e.g. LRGs coordinates list in http://www.sdss.org/dr14/spectro/galaxy_wisconsin/), and we display only their LRGs that were initially defined as such.
Similar to the EW measurements, the C iii are also much larger for these LRGs. COS-Halos have values up to km s-1 and average line widths of km s-1 (when smoothed to the same resolution as our QSO-LRGs spectra), which are two to a few times smaller than the LRGs presented here. As with C iii, the two LRGs also exhibit very strong H I absorption (with H I 1215 Å and Å, and column densities from the Lyman-limit flux decrement cm-2 and cm-2), and the LRG_1059+4039 H i EW exceeds that of all COS-Halos systems. These two LRGs represent extrema of the CGM.
We turn now to discuss the origin of this extreme CGM. Previous studies examining systems with large EWs and/or large velocity widths have frequently invoked non-gravitational motions associated with feedback processes that have ejected significant mass from the central galaxy. This includes winds driven from bursts of star-formation (e.g., Rubin et al., 2014; Heckman et al., 2017) and outflows driven by AGN activity (e.g., Tripp et al., 2011). In our experiment, the targeted galaxies are ‘red and dead’ with negligible current star-formation (SF) and no signature of SF activity over at least the past Gyr. Therefore, we rule out feedback from recent star-formation from LRGs as a viable origin for the observed CGM.
We have also searched for any signatures of AGN activity from our targeted LRGs or any neighboring galaxies. Within 2 arcmin of each LRG, there are no sources detected in the Faint Images of the Radio Sky at Twenty-Centimeters (FIRST) survey (Becker et al., 1995). From the Wide-field Infrared Survey Explorer (WISE; Wright et al., 2010), there are several sources in the LRG fields but all of these have color (most have ), indicating that the emission is of stellar origin (Stern et al., 2012). Together the FIRST non-detections and the WISE colors indicate the absence of any active AGN for galaxies near the quasar sightlines.
In addition to outflows from forming stars and AGN, gas may be pulled from galaxies through gravitational interactions (i.e., tidal stripping). However, the observed velocity range in tidal streams of local interacting galaxies is typically km s-1 (Hibbard & van Gorkom, 1996) with a few cases exceeding 100 km s-1 (Weilbacher et al., 2003). Given the observed km s-1 velocity spread in the LRG-CGM, we consider tidal interactions to be a sub-dominant contribution.
Inflows of cold gas from the intergalactic medium are also disfavored because they are predicted to have low metallicity and correspondingly much lower EWs than what we have observed (Fumagalli et al., 2011). Furthermore, the predicted kinematics for this infalling gas imply modest velocities (, Nelson et al., 2016) and these cold flows are not expected to frequent massive halos (Dekel & Birnboim, 2006; Kereš et al., 2009).
Absent an active source to produce the extreme CGM signatures of our target LRGs, we must consider alternate origins. One possibility is that this gas is a relic of previous activity within the LRG (the most luminous galaxy in the halo). For example, cold CGM clouds could have formed at higher redshifts, when LRGs were intensely forming stars or contained an AGN. This could provide an intragroup medium with significant cool gas absorption (Gauthier, 2013). Indeed, the CGM of QSO host galaxies contains large amounts of cold gas and has comparably extended and strong H I and metal lines (e.g., Prochaska et al., 2013; Lau et al., 2016). Furthermore, the dark matter halos hosting quasars have estimated masses (White et al., 2012) and one predicts that a non-negligible fraction will evolve into the halos hosting LRGs. The obvious challenge to this scenario, however, is that the cool gas must survive for several Gyr while not accreting onto a galaxy or being heated as the halo virializes.
On the point of cloud survival, idealized hydrodynamic studies of cool gas clouds moving through a hot and more diffuse halo indicate that the largest sized clumps ( pc) may survive for hundreds of Myr (Armillotta et al., 2017). Even a population of such very large clouds, however, are predicted to shed the majority of their mass after several Gyr (extrapolating from the published mass loss rates). Over time, less massive clouds would be destroyed, possibly explaining why the covering fraction of LRGs is low but certain sightlines have large amounts of cold gas detected.
The scenario we favor is that our LRG-CGM absorbers originate from gas in overlapping projected subhalos throughout the larger dark matter halo. In contrast to galaxies, where low-mass satellites are unlikely to contribute significantly to the observed cool CGM (Tumlinson et al., 2013), the halos hosting LRGs may contain many luminous () satellite galaxies. To explore this hypothesis, we have searched for galaxies in the SDSS imaging catalog whose photometric redshifts are consistent with the LRG redshift (i.e., ), hereafter, neighboring galaxies (NGs). Placing these sources at the LRG redshifts, we identify 3 galaxies within kpc of each of the QSO_1059+4039 and QSO_1440-0156 sightlines and several additional galaxies with kpc. All NGs around LRG_1059+4039 have red colors with , except one (4 red, 1 blue), while only one of the 4 galaxies around LRG_1440-0156 has a red color. Not including LRGs, and assuming that at absolute magnitude corresponds to galaxies (Skibba et al., 2013, and references therein), the -band luminosities of the nearby galaxies are .
We offer a few additional comments on several specific galaxies. One of the 3 galaxies around QSO_1059+4039 is located very close to the QSO sightline (), and is not cataloged by the SDSS survey but is detected in the Panoramic Survey Telescope and Rapid Response System (Pan-STARRS) images. In addition, another LRG with somewhat higher stellar mass lies kpc away from the QSO_1059+4039 sightline and is offset by only km s-1 from the target LRG. Lastly, we comment that the redMaPPer survey (Rykoff et al., 2014) identifies a cluster of galaxies near LRG_1059+4039 (at distance 1.68’ and with a consistent redshift) and no clusters within of LRG_1440-0156. In addition, these two LRGs occupy of the most densely populated environments in our full sample (Smailagić et al. 2018, in preparation).
We now explore whether the overlapping CGM of luminous galaxies within 200 kpc of the sightline is sufficient to reproduce the observed EW and values. The estimated line-of-sight velocity dispersion for galaxies in a dark matter halo of is . If we randomly sample a Gaussian distribution with , the average velocity spread for 5 galaxies is , and 2 range is . If each of theses galaxies exhibits a CGM comparable to present-day galaxies ( for COS-Halos), we recover a velocity width that is comparable to the observed velocity spreads.
Next, consider the observed EWs. For every NG within 200 kpc of the QSO sightline, we estimate the stellar mass using rest-frame absolute magnitudes from SDSS and the correlation between stellar mass and absolute red magnitude from Liang & Chen (2014): . Following Bordoloi et al. (2017), we estimate the Ly EWs from these NGs as , where is the impact parameter between galaxies and QSO. For the targeted LRGs only, we obtain EW 3.1Å and 0.5Å, which are smaller than observed. If we strictly add the Ly EWs from the galaxies within 200 kpc, we obtain 6.9Å and 5.1Å. When we take into account that the covering fraction for red galaxies in COS-Halos is % (Tumlinson et al., 2013), the calculated EWs are and 3.8 Å, larger than the observed EWs. However, the total predicted EWs would decrease if we allow for overlapping absorption if the sum is a saturated line. Furthermore, one may expect the galaxies in dense environments to have smaller EWs (see, e.g., Burchett et al., 2018), or several of the galaxies may be at unrelated redshifts.
The overlapping subhalos CGM scenario is consistent with the multiple line components observed in our LRGs’ CGM and their large velocity spread. For example, the cold CGM could originate from outflows from blue NGs, or survive (e.g., Armillotta et al., 2017) or reform (e.g., Thompson et al., 2016) from earlier times.
In turn, our results support scenarios where the properties of the CGM are more tightly linked to the underlying dark matter halo than properties of the targeted galaxies (e.g., star-formation), (e.g., Zhu et al., 2014). This scenario could also be tested by obtaining spectra of the putative satellite galaxies of these two LRGs to confirm their membership and assess their properties. The results presented here reveal that when cool CGM are present in massive halos, the associated absorption may greatly exceed that in lower mass systems.
References
- Armillotta et al. (2017) Armillotta, L., Fraternali, F., Werk, J. K., Prochaska, J. X., & Marinacci, F. 2017, MNRAS, 470, 114
- Becker et al. (1995) Becker, R. H., White, R. L., & Helfand, D. J. 1995, ApJ, 450, 559
- Blanton et al. (2003) Blanton, M. R., Hogg, D. W., Bahcall, N. A., et al. 2003, ApJ, 592, 819
- Bordoloi et al. (2017) Bordoloi, R., Prochaska, J. X., Tumlinson, J., et al. 2017, arXiv:1712.02348
- Burchett et al. (2018) Burchett, J. N., Tripp, T. M., Wang, Q. D., et al. 2018, MNRAS, 475, 2067
- Chen et al. (2010) Chen, H.-W., Wild, V., Tinker, J. L., et al. 2010, ApJ, 724, L176
- Chen (2017) Chen, H.-W. 2017, Gas Accretion onto Galaxies, 430, 167
- Chen et al. (2018) Chen, H.-W., Zahedy, F. S., Johnson, S. D., et al. 2018, MNRAS, 479, 2547
- Dawson et al. (2013) Dawson, K. S., Schlegel, D. J., Ahn, C. P., et al. 2013, AJ, 145, 10
- Dekel & Birnboim (2006) Dekel, A., & Birnboim, Y. 2006, MNRAS, 368, 2
- Fumagalli et al. (2011) Fumagalli, M., Prochaska, J. X., Kasen, D., et al. 2011, MNRAS, 418, 1796
- Gauthier (2013) Gauthier, J.-R. 2013, MNRAS, 432, 1444
- Heckman et al. (2017) Heckman, T., Borthakur, S., Wild, V., Schiminovich, D., & Bordoloi, R. 2017, ApJ, 846, 151
- Hibbard & van Gorkom (1996) Hibbard, J. E., & van Gorkom, J. H. 1996, AJ, 111, 655
- Huang et al. (2016) Huang, Y.-H., Chen, H.-W., Johnson, S. D., & Weiner, B. J. 2016, MNRAS, 455, 1713
- Kereš et al. (2009) Kereš, D., Katz, N., Fardal, M., Davé, R., & Weinberg, D. H. 2009, MNRAS, 395, 160
- Kravtsov & Borgani (2012) Kravtsov, A. V., & Borgani, S. 2012, ARA&A, 50, 353
- Lan et al. (2014) Lan, T.-W., Ménard, B., & Zhu, G. 2014, ApJ, 795, 31
- Lau et al. (2016) Lau, M. W., Prochaska, J. X., & Hennawi, J. F. 2016, ApJS, 226, 25
- Liang & Chen (2014) Liang, C. J., & Chen, H.-W. 2014, MNRAS, 445, 2061
- Lopez et al. (2008) Lopez, S., Barrientos, L. F., Lira, P., et al. 2008, ApJ, 679, 1144
- Mitchell et al. (1976) Mitchell, R. J., Culhane, J. L., Davison, P. J. N., & Ives, J. C. 1976, MNRAS, 175, 29P
- Moster et al. (2010) Moster, B. P., Somerville, R. S., Maulbetsch, C., et al. 2010, ApJ, 710, 903
- Nelson et al. (2016) Nelson, D., Genel, S., Pillepich, A., et al. 2016, MNRAS, 460, 2881
- Nestor et al. (2011) Nestor, D. B., Johnson, B. D., Wild, V., et al. 2011, MNRAS, 412, 1559
- Pâris et al. (2017) Pâris, I., Petitjean, P., Ross, N. P., et al. 2017, A&A, 597, A79
- Prochaska & Wolfe (1997) Prochaska, J. X., & Wolfe, A. M. 1997, ApJ, 487, 73
- Prochaska et al. (2011) Prochaska, J. X., Weiner, B., Chen, H.-W., Mulchaey, J., & Cooksey, K. 2011, ApJ, 740, 91
- Prochaska et al. (2013) Prochaska, J. X., Hennawi, J. F., & Simcoe, R. A. 2013, ApJ, 762, L19
- Prochaska et al. (2014) Prochaska, J. X., Lau, M. W., & Hennawi, J. F. 2014, ApJ, 796, 140
- Rubin et al. (2014) Rubin, K. H. R., Prochaska, J. X., Koo, D. C., et al. 2014, ApJ, 794, 156
- Rykoff et al. (2014) Rykoff, E. S., Rozo, E., Busha, M. T., et al. 2014, ApJ, 785, 104
- Skibba et al. (2013) Skibba, R. A., Sheth, R. K., Croton, D. J., et al. 2013, MNRAS, 429, 458
- Stern et al. (2012) Stern, D., Assef, R. J., Benford, D. J., et al. 2012, ApJ, 753, 30
- Thom et al. (2012) Thom, C., Tumlinson, J., Werk, J. K., et al. 2012, ApJ, 758, L41
- Thompson et al. (2016) Thompson, T. A., Quataert, E., Zhang, D., & Weinberg, D. H. 2016, MNRAS, 455, 1830
- Tripp et al. (2011) Tripp, T. M., Meiring, J. D., Prochaska, J. X., et al. 2011, Science, 334, 952
- Tumlinson et al. (2013) Tumlinson, J., Thom, C., Werk, J. K., et al. 2013, ApJ, 777, 59
- Tumlinson et al. (2017) Tumlinson, J., Peeples, M. S., & Werk, J. K. 2017, ARA&A, 55, 389
- Voit (2005) Voit, G. M. 2005, Reviews of Modern Physics, 77, 207
- Weilbacher et al. (2003) Weilbacher, P. M., Duc, P.-A., & Fritze-v. Alvensleben, U. 2003, A&A, 397, 545
- Werk et al. (2012) Werk, J. K., Prochaska, J. X., Thom, C., et al. 2012, ApJS, 198, 3
- Werk et al. (2013) Werk, J. K., Prochaska, J. X., Thom, C., et al. 2013, ApJS, 204, 17
- White et al. (2011) White, M., Blanton, M., Bolton, A., et al. 2011, ApJ, 728, 126
- White et al. (2012) White, M., Myers, A. D., Ross, N. P., et al. 2012, MNRAS, 424, 933
- Worseck et al. (2016) Worseck, G., Prochaska, J. X., Hennawi, J. F., & McQuinn, M. 2016, ApJ, 825, 144
- Wright et al. (2010) Wright, E. L., Eisenhardt, P. R. M., Mainzer, A. K., et al. 2010, AJ, 140, 1868
- Yoon & Putman (2017) Yoon, J. H., & Putman, M. E. 2017, ApJ, 839, 117
- Young et al. (2014) Young, L. M., Scott, N., Serra, P., et al. 2014, MNRAS, 444, 3408
- Zahedy et al. (2016) Zahedy, F. S., Chen, H.-W., Rauch, M., Wilson, M. L., & Zabludoff, A. 2016, MNRAS, 458, 2423
- Zhu et al. (2014) Zhu, G., Ménard, B., Bizyaev, D., et al. 2014, MNRAS, 439, 3139