A transitional disk around an intermediate mass star in the sparse population of the Orion OB1 association
Abstract
We present a detailed study of the disk around the intermediate mass star SO 411, aiming to explain the spectral energy distribution of this star. We show that this is a transitional disk truncated at 11 au, with 0.03 lunar masses of optically thin dust inside the cavity. Gas also flows through the cavity, since we find that the disk is still accreting mass onto the star, at a rate of . Until now, SO 411 has been thought to belong to the 3 Myr old Orionis cluster. However, we analyzed the second Gaia Data Release in combination with kinematic data previously reported, and found that SO 411 can be associated with an sparse stellar population located in front of the Orionis cluster. If this is the case, then SO 411 is older and even more peculiar, since primordial disks in this stellar mass range are scarce for ages 5 Myr. Analysis of the silicate 10µm feature of SO 411 indicates that the observed feature arises at the edge of the outer disk, and displays a very high crystallinity ratio of 0.5, with forsterite the most abundant silicate crystal. The high forsterite abundance points to crystal formation in non-equilibrium conditions. The PAH spectrum of SO 411 is consistent with this intermediate state between the hot and luminous Herbig Ae and the less massive and cooler T Tauri stars. Analysis of the 7.7µm PAH feature indicates that small PAHs still remain in the SO 411 disk.
1 Introduction
Circumstellar disks, a natural byproduct of the star forming process, exhibit a variety of characteristics that have been attributed to the disks being in different evolutionary phases. They start being gas-rich, which we call “primordial”, and optically thick, and evolve into dusty debris disks. Planetary systems may form in the disk along this evolution. (e.g. Calvet & D’Alessio, 2011; Williams & Cieza, 2011; Testi et al., 2014; Alexander et al., 2014).
Ground based and specially Spitzer observations revealed crucial evolutionary phases in disk evolution. These phases were represented by the transitional disks (TD; Strom et al., 1989; Calvet et al., 2005) and the pre-transitional disks (PTD; Espaillat et al., 2007a, b). TDs were characterized observationally as having small or no flux excess above the photosphere in the near infrared (NIR; 10) and excesses consistent with primordial, optically thick disks at longer wavelengths (D’Alessio, 2009; Espaillat et al., 2014). PTDs had spectral energy distributions (SEDs) similar to those of TDs, except for a flux excess consistent with optically thick material at the shorter NIR wavelengths. Large holes (in TDs) or wide gaps (in PTDs) in the inner dust distribution of protoplanetary disks could explain the deficit of NIR excesses in the SED, and this was consistent with the cavities observed by millimeter interferometric observations (Andrews et al., 2011; Casassus, 2016). The much higher spatial resolution observations provided by the Atacama Large Millimeter and Submillimeter Array (ALMA) have revealed that disks are highly structured, with multiple gaps, arms, and other structures, that may or may not be apparent in the SED (ALMA Partnership et al., 2015; Andrews et al., 2016).
Dynamical clearing by planets (Zhu et al., 2011, 2012; Espaillat et al., 2014; Owen, 2016; Ruíz-Rodríguez et al., 2016), photoevaporation, dust grain growth, differential dust drift, dead zones, condensations fronts, have been invoked to explain the dust structures seen in protoplanetary disks (e.g. Alexander et al., 2014; Chiang & Murray-Clay, 2007; Dullemond & Dominik, 2005; Birnstiel et al., 2012; Pinilla et al., 2016; Zhang et al., 2015). Nonetheless, the large, tens of au, cavities in small and large grains present in TDs and PTDs make them stand out as clear cases of disks that have undergone significant structural changes since they formed.
The TD/PTD phase in the low mass, Classical T Tauri stars (CTTS) represents one of the evolutionary pathways from primordial to second generation disks (e.g. Currie et al., 2009; Hernández et al., 2010; Cieza et al., 2013). An alternative evolutionary pathway is represented by the evolved disks (Hernández et al., 2010; Muzerolle et al., 2010; Ercolano & Pascucci, 2017), which exhibit weaker infrared excesses than the median SED of Taurus at all wavelengths (Furlan et al., 2006). The evolved disks are also named "anemic disks", "homologously depleted disks", "weak-excess disks" or "dust depleted disks" (Lada et al., 2006; Currie et al., 2009; Muzerolle et al., 2010; Sicilia-Aguilar et al., 2013).
It is not clear if there are comparable evolutionary paths for the higher mass Herbig Ae/Be stars (HAeBe). Meeus et al. (2001) classified the SEDs of HAeBe into group I and group II, with group I showing stronger mid and far infrared excesses than group II. In principle, these two classes could be identified with the two evolutionary pathways in CTTS. However, Dullemond & Dominik (2004) suggested an evolutionary scheme from group I (flared disks) to group II (flat disks), which is supported by the higher amount of small dust grains in group I found by Herschel/PACS photometry (Pascual et al., 2016). An argument against this evolutionary interpretation was the discovery using mid-IR imaging that group I objects had cavities, while they were not found in group II (Maaskant et al., 2013). On the other hand, the recent discovery of cavities in large grains in the disks of group II sources (Zhang et al., 2016; Rubinstein et al., 2018) adds another uncertainty to these alternatives. Therefore, additional studies are necessary to reveal whether group I and group II form an evolutionary sequence or if these two groups follow different evolutionary pathways as those suggested for the CTTS mass range.
Intermediate Mass T Tauri Stars (IMTTS; Calvet et al., 2004), showing emission lines and spectral types ranging from late F to early K, represent the link between the HAeBe (with spectral types B, A or early F) and the CTTS (with spectral types K or M). Since IMTTS evolve along radiative tracks, they will eventually become HAeBe stars, Vega type stars, or hybrid disks around A type stars such as those reported by Péricaud et al. (2017). This last class of objects, which have gas to dust ratio enhanced by two or three orders of magnitudes compared to primordial disks, could represent the last stage between the final phases of the primordial component in the disks and the beginning of the debris disk phase (Péricaud et al., 2017; Espaillat et al., 2017).
Detailed studies of significant samples of IMTSS in different phases of evolution could improve our understanding of the evolutionary process connecting the two ranges of stellar masses represented by the CTTS and the HAeBe stars. However, collecting these samples is difficult. The number ratio of transitional disks to primordial disks around CTTS suggests a timescale of transitional disks clearing of 10%-20% of the lifetime of primordial disks (Muzerolle et al., 2010; Luhman et al., 2010). Since the disk dispersal mechanisms are more efficient at higher stellar masses (Hernández et al., 2007, 2009; Lada et al., 2006; Sung et al., 2009; Ribas et al., 2015), it is not surprising that less than 10% of the known TD/PTD are in the IMTTS regime and only 2% are associated to late F type stars (Espaillat et al., 2014; van der Marel et al., 2016). In this paper we present a detailed study of one of the few transitional disks known to be associated with a 5 to 10 Myr F type star.
SO 411 (also named HD 294268, BD-02 1321, PDS 119) is a F type IMTTS believed until now to belong to the Orionis cluster (Torres et al., 1995; Caballero, 2008; Hernández et al., 2014). However, the general region of the Orionis cluster can include stars from a foreground pre-main sequence stellar population kinematically separated by 7 kms-1 in radial velocity (Jeffries et al., 2006; Maxted et al., 2008; Hernández et al., 2014). This foreground stellar population could have a median age and distance similar to older stellar groups associated with the sparser Orion OB1a subassociation (Briceño et al., 2007, 2018). Here, we present a spatial and kinematical analysis based on Gaia data that indicates that SO 411 most likely belongs to this foreground population.
The SED constructed from Spitzer photometry (IRAC and MIPS) indicates that SO 411 is surrounded by a TD/PTD disk (Hernández et al., 2007). A width of H at 10% of the line peak of 294 km/s, measured from high-resolution spectra (R34000; Hernández et al., 2014), indicates that the SO 411 disk is accreting mass onto the star (White & Basri, 2003). Finally, its location in the region of PAH emission-dominated sources in IRAC color-color diagrams (Hernández et al., 2007; Gutermuth et al., 2009) suggests that SO 411 has PAH emission features. Visual inspection of the Spitzer IRS spectrum confirms the presence of PAH emission features and also shows silicate emission at 10µm indicating the presence of sub-µm grains close to the star (Sargent et al., 2009b). Thus, SO 411 represents an unique opportunity to study in detail an accreting TD/PTD around an IMTTS that shows evidence of small dust close to the star.
We present a detailed modeling effort of SO 411 using irradiated disks models (D’Alessio et al., 1998, 1999, 2001, 2006; Espaillat et al., 2010), which allows us to study the dust structure and mineralogy of its disk. This paper is organized as follows: Section §2 describes the observational data. Based on the second release of Gaia’s data (GAIA-DR2; Gaia Collaboration et al., 2018), we present the astrometric and kinematic properties of SO 411 and the Orionis cluster in §3.2. Additional properties of the target are analyzed in§3.3, a near infrared excess study in §3.5, and the disk modeling in §3.6. We then discuss the implications of the dust composition in §4.1 and the presence of PAH features in §4.2. Finally, in Section §5 we present our summary and conclusions.
2 Observations
2.1 Photometric data
We obtained optical photometry of SO 411 on February 2016 using the Large Monolithic Imager on the 4.3 meter Discovery Channel Telescope (DCT) at the Lowell Observatory (Arizona - USA). The images were reduced following the standard IRAF procedure to perform bias subtraction and sky-flat field correction. The photometry was obtained and calibrated following the procedure in Massey & Davis (1992) using the Landolt standard field SA 98 (Landolt, 2009) observed at the same airmass as the target field (1.35). Table 1 shows the optical photometric data of SO 411 in the Johnson-Cousin system. The photometric uncertainties are below 0.02 magnitudes.
| Object | U | B | V | ||
|---|---|---|---|---|---|
| mag | mag | mag | mag | mag | |
| SO 411 | 11.07 | 10.96 | 10.50 | 10.08 | 9.84 |
2.2 IRS Spectra
SO 411 was observed with the Infrared Spectrograph (IRS) on board the Spitzer Space Telescope (Houck et al., 2004) on 2007 October 11 as part of the program P30381 (Oliveira et al., 2006). Observations were obtained in staring mode using the short-low (SL) resolution module which spans wavelengths from 5 to 14 µm and the high resolution modules (SH and LH) which span wavelengths from 10 to 37 µm. The SL spectrum was obtained from the Cornell Atlas of Spitzer/IRS Sources (CASSIS; Lebouteiller et al., 2011). The reduction and extraction of the LH & SH data was performed with optimal point source extraction option in the Spectral Modeling, Analysis and Reduction Tool (SMART; Higdon et al., 2004), which is an IDL-based processing and analysis tool for the IRS instrument.
2.3 SpeX Spectra
We obtained NIR spectra of SO 411 on 2015, February 6 using the micron medium-resolution spectrograph SpeX on the 3 meter NASA Infrared Telescope Facility (IRTF) at Mauna Kea Observatory. The spectra were obtained using the LXD long mode with a slit and a wavelength coverage of 1.9-4.6, giving a spectral resolution of R1500, and using the lower resolution prism mode with a slit with wavelength coverage of 0.8-2.5, with R75. The spectra were collected using the AB dither mode, in which the source is offset between two locations on the slit between the A and B exposure in order to subtract out sky emission and dark current for each AB spectra pair.
We reduced the observation using the 2014 version of the SpexTool, an IDL-based reduction package built specifically for the cross-dispersed spectra produced by SpeX (Cushing et al., 2004). The reduction process consisted of flat-fielding, sky corrections and wavelength calibration using calibration frames taken during observations. Each order for every observation was extracted, stacked, corrected for telluric absorption features using the measured spectra of a standard A0V star and then stitched together to form a complete spectrum. Regions of low signal-to-noise were removed from the final spectra. A more complete description of the Spextool reduction process is described in Cushing et al. (2004). HD 34317 was the telluric A0V star used for the reduction of the SpeX spectra.
3 Analysis
3.1 Spectral Type
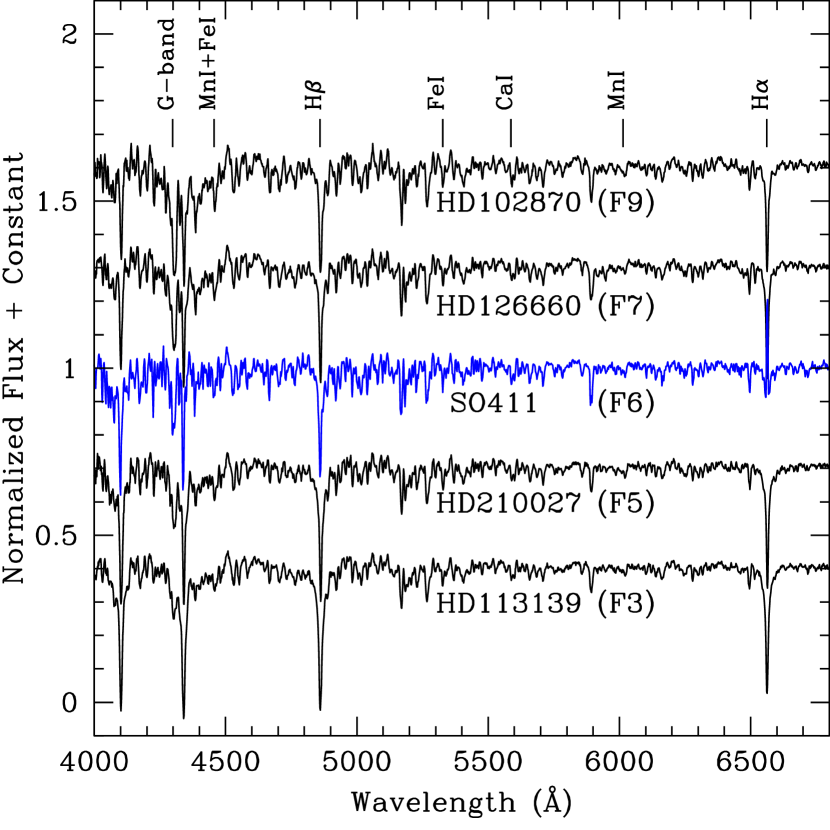
Here we revisited the optical spectrum from Hernández et al. (2014) to improve the spectral type of SO 411 obtained using the SPTCLASS tool, an IRAF/IDL code based on the methods described by Hernández et al. (2004). The low resolution optical spectrum was obtained with the Boller & Chivens spectrograph mounted on the 2.1 meter telescope at the San Pedro Martir Observatory. We used a 400 lines mm1 dispersion grating along with a 2″ slit width, giving a spectral resolution of 6Å centered at 5500Å (for additional details, see Hernández et al., 2014).
Figure 1 shows a comparison between the SO 411 spectrum and a group of standard spectra with similar resolution and spectral coverage obtained with the FAST spectrograph (Fabricant et al., 1998) mounted on the 1.5 meter telescope of the Fred Lawrence Whipple Observatory and used to calibrate the SPTCLASS tool. In a previous effort we had estimated the spectral type of SO 411 as F7.52.5 (Hernández et al., 2014). In order to reduce the uncertainty, we estimate a new spectral type using only the strongest spectral features that appear in IMTTS, such as the G-band( 4300Å), Mn I+Fe I( 4458Å), Fe I( 5329Å), Ca I( 5589Å), and Mn I( 6015Å). The improved spectral type of F61 is in agreement with the previous estimate within the uncertainties.
3.2 Space-velocity analysis of SO 411
Here we study the astrometric and kinematic properties of SO 411 and the Orionis cluster. For a sample of known young stars defined in Hernández et al. (2014), we combined the parallaxes and proper motions from the GAIA-DR2 (Gaia Collaboration et al., 2018) with radial velocities (RVs) from Maxted et al. (2008), Sacco et al. (2008) and Hernández et al. (2014). For those stars with more than one measurements of RVs, we used a weighted mean to estimate the combined RV of the star. We selected stars with uncertainties in parallaxes below 20%. Thus, distances can be calculated as the inverse of the parallaxes. For stars with uncertainties larger than this value, we cannot apply the inverse relation between parallaxes and distances and the estimation of distances becomes an inference problem in which the use of prior assumptions is necessary (Bailer-Jones, 2015). Additionally, we selected stars with distances between 300 pc and 500 pc from the radial velocity sample. About 96% (162/169) of the sample of known young stars with radial velocity measurements fulfill this criterion.
Following Jeffries et al. (2006), we split the sample into two groups. One group (hereafter the Orionis population) has radial velocities between 27 km/s and 35 km/s and is consistent with the radial velocity of the central system (29.5 km/s; Kharchenko et al., 2007). The other group (hereafter the sparse population) has radial velocities between 20 km/s and 27 km/s and could be older and closer than the first population (Jeffries et al., 2006; Maxted et al., 2008; Hernández et al., 2014)
Figure 2 shows distances versus radial velocities (RVs) for the Orionis cluster and the sparse populations in the direction of the cluster. Using weighted means, distances and RVs were estimated for each population. The Orionis population has a distance of 401 pc and a RV of 31.11.3 km/s. The sparse population has a distance of 382 pc and a RV of 23.61.4 km/s. For SO411, there are several measurements of RVs: 22.21.1 km/s (Hernández et al., 2014), 21.71.5 km/s (Gaia Collaboration et al., 2018) and 22.90.5 km/s and 22.90.4 km/s (Kounkel et al., 2018). Since, all these values are in agreement within the errors, it is unlikely that the smaller RVs of SO411 in comparison with the Orionis population are due to the object being a spectroscopic binary. The weighted mean of RVs (22.81.2 km/s) is more than six below the RVs expected for the Orionis population. Thus, it is apparent that the RVs of SO411 are in better agreement with the sparse population. On the other hand, the distance of SO 411 (3747 pc) is about one below the distance estimated for the Orionis population and in better agreement with the sparse population. The difference in the distance distributions between the Orionis population and the sparse population is confirmed by a Kolmogorov-Smirnov (K-S) test, showing a significance level of only 0.3%.
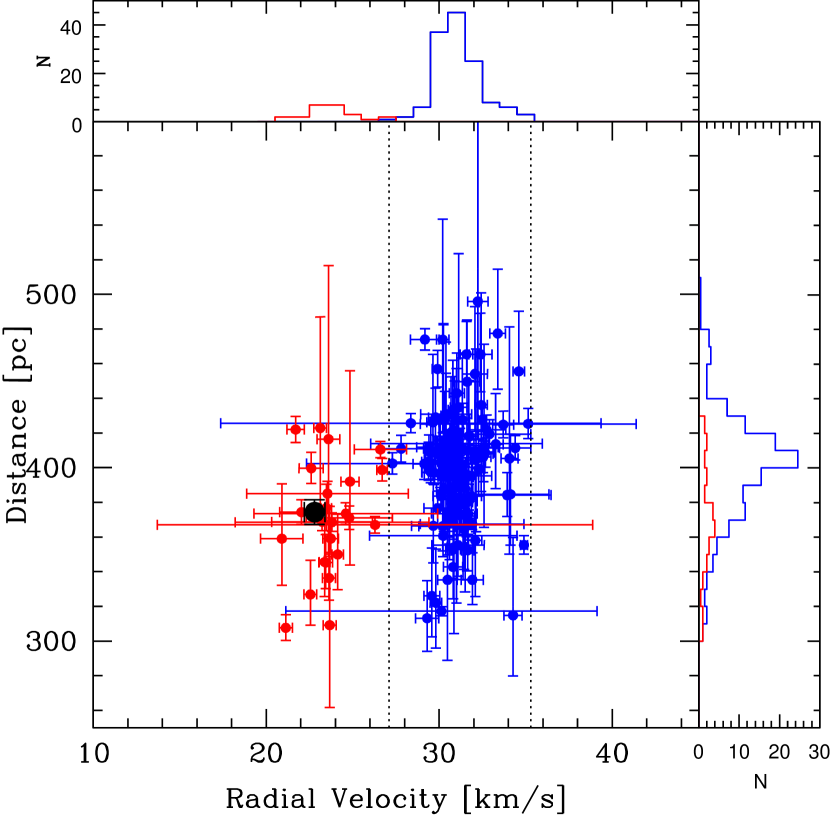
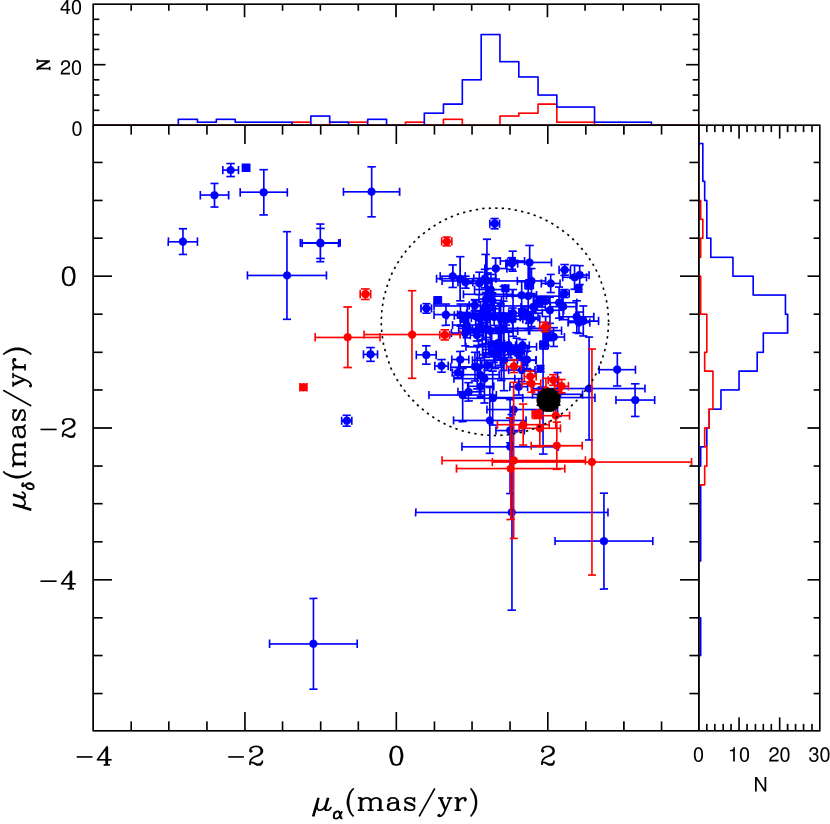
Figure 3 shows the vector point diagram and the proper motions distributions for the Orionis and the sparse populations. Using weighted mean after applying 3- clipping, we estimate the proper motions for the Orionis population to be = 1.50.5 and = -0.60.5 and for the sparse population to be = 0.91.3 and = -1.10.7. The proper motions of SO 411 (= 2.00.1 and = -1.60.1) locate this object at 2.5 from the mean proper motions of the Orionis population.The difference between the Orionis population and the sparse population is confirmed by a K-S test, showing a significance level of 3% and 0.008% for the proper motion distributions of and , respectively.
Finally, Caballero (2008) analyzed the spatial distribution of possible members of the Orionis cluster and suggests that this cluster has two components: a dense core that extends from the center to a radius of 20′, in which most members are located, and a rarefied halo at larger separations. SO 411 is located at 21.4′ from the center, slightly beyond the dense core limit.
In brief, the kinematic properties of SO 411 suggest that this star does not belong to the Orionis cluster and it is most likely associated with an older and sparser population. Distributions in distance also suggest that the sparse population is located in front of the cluster. A larger scale study in the Ori OB1 region, which includes the Orionis cluster also indicates the presence of two populations of young stars, located at two different distances; specifically, the Ori OB1a subassociation is closer than Ori OB1b, but they spatially overlap on the plane of the sky (Briceño et al., 2018)
3.3 Stellar properties and mass accretion rate
The effective temperature (), intrinsic colors and the bolometric correction of SO 411 were obtained by interpolating its spectral type in the table of Pecaut & Mamajek (2013) for pre-main sequence stars. Following the method described in Hernández et al. (2014) and using the colors V- and V-J, we calculated an extinction of 0.2 magnitudes in the visual band. Using this value and the reddening law from Mathis (1990, =3.1), the observational data described in §2 were corrected for extinction.
Assuming a distance of 3747 pc (Gaia Collaboration et al., 2018), we found a stellar luminosity (L∗) of 9.10.5. The uncertainty in L∗ is calculated only from the visual photometric error. The stellar mass (M∗) and stellar radius (R∗) were estimated by interpolating the and the L∗ in the evolutionary tracks from Siess et al. (2000).
We estimated the accretion luminosity (Lacc) from several indicators. Table 2 shows the different values of we obtained. One indicator is the U-band excess, which measures the emission shock at the stellar surface. We used the correlation of this excess with Lacc from Gullbring et al. (1998), and obtained the mass accretion rate () using the stellar mass and radius.
The luminosity of the H line (LHα) can also be used as an accretion proxy (e.g. Fang et al., 2009; Ingleby et al., 2013; Alcalá et al., 2014; Fairlamb et al., 2017). We estimated this luminosity from the H equivalent width (EW[H]), which is obtained by measuring the flux of the spectral feature normalized to the continuum level that is expected when interpolating between two adjacent continuum bands (Hernández et al., 2004). The intrinsic value for SO 411 (EW[H]std) is obtained by interpolating its spectral type in the values of EW[H] obtained for the standard sequence in Figure 1. Assuming no veiling at the continuum of H, the corrected value of SO 411 is obtained by EW[H]cor=EW[H]-EW[H]std. The flux of H is calculated by FHα= EW[H]cor Fcont, where Fcont is the continuum flux at 6563Å obtained by interpolating between the fluxes measured in the filters and . The luminosity of H follows from the assumed distance. Several correlations between Lacc and LHα have been presented in the literature. The correlations by Ingleby et al. (2013) and Alcalá et al. (2014) were based on samples of CTTS, while the correlation by Fairlamb et al. (2017) were based on a sample of HAeBe stars. On the other hand, the correlation presented by Fang et al. (2009) is based on a sample that includes CTTS and few HAeBe stars. The values of obtained with the different correlations are shown in Table 2. The HAeBe correlation results in a higher estimate of than the CTTS correlations, a fact already noted by Fairlamb et al. (2017). The luminosity of H in SO 411 is , which puts the object in between the lower LHα values of the CTTS and the higher values of the HAeBe, so it is not clear which of the two correlations between Lacc and LHα is appropriate for SO 411. Given this uncertainty, we adopted as the mass accretion rate of SO411 the weighted mean of the values obtained from the correlations between Lacc and LHα in Table 2 (log([yr-1])=-8.3+-0.3). This value is consistent with the mass accretion rates found in other transitional disks (Espaillat et al., 2014).
| Parameter | Value | Comments |
|---|---|---|
| Spectral Type | F6.0 1.0 | |
| 0.2 0.1 | ||
| T∗ (K) | 6250 | using Pecaut & Mamajek (2013) |
| L∗ () | 9.10.5 | |
| M∗ () | 1.6 | using Siess et al. (2000) |
| R∗ () | 2.0 | using Siess et al. (2000) |
| log( [yr-1]) | -8.9 | from U-band excess (Gullbring et al., 1998) aaThe uncertainties only reflect the propagation of the fitting parameter errors in the correlation between Lacc and LHα |
| log( [yr-1]) | -8.50.3 | from H and the relation of Fang et al. (2009)aaThe uncertainties only reflect the propagation of the fitting parameter errors in the correlation between Lacc and LHα |
| log( [yr-1]) | -8.90.3 | from H and the relation of Alcalá et al. (2014)aaThe uncertainties only reflect the propagation of the fitting parameter errors in the correlation between Lacc and LHα |
| log( [yr-1]) | -8.80.9 | from H and the relation of Ingleby et al. (2013) aaThe uncertainties only reflect the propagation of the fitting parameter errors in the correlation between Lacc and LHα |
| log( [yr-1]) | -8.00.1 | from H and the relation of Fairlamb et al. (2017)aaThe uncertainties only reflect the propagation of the fitting parameter errors in the correlation between Lacc and LHα |
3.4 Spectral Energy Distribution
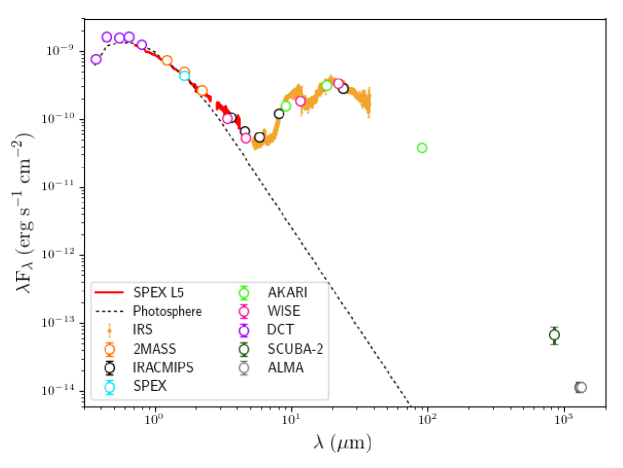
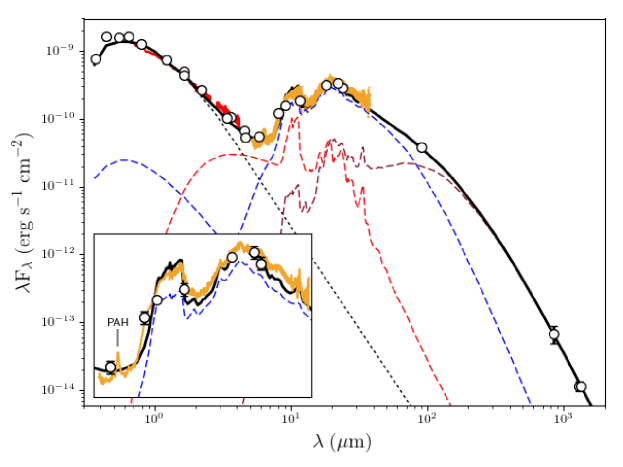
We constructed the spectral energy distribution of SO 411, shown in Figure 4. We used the data described in §2, and magnitudes and fluxes collected from the literature: 2MASS photometry from Cutri et al. (J, H and K bands; 2003), IRAC (3.6, 4.5, 5.8 and 8.0µm) and MIPS(24µm) Spitzer’s photometry from Hernández et al. (2007), WISE photometry (3.4, 4.6, 12 and 22µm) from Cutri et al. (2013), AKARI’s fluxes at 9 and 18µm from Ishihara et al. (2010) and AKARI’s flux at 90µm from Yamamura et al. (2010). To cover the millimeter range, we included fluxes at 850µm and 1300µm obtained with the Submillimeter Common User Bolometer Array (SCUBA-2) camera on the 15-m James Clerk Maxwell Telescope (Williams et al., 2013) and the 1330µm continuum flux with the Atacama Large Millimeter-sub-millimeter Array (ALMA; Ansdell et al., 2017). Given the spatial resolution of the collected data, all these measurements include the integrated emission from the star-disk system. For comparison, Figure 4 also shows the stellar photosphere, calculated using the intrinsic colors for a F6 main sequence star from Kenyon & Hartmann (1995), normalized to the dereddened J band flux. Since Pecaut & Mamajek (2013) only include 3 optical magnitudes (B, V and ) we used the intrinsic colors from Kenyon & Hartmann (1995) which include more optical magnitudes (U, B, V, and ) to represent the stellar photosphere. The differences between these two standard values are less than 4% in the optical bands.
The SED of SO 411 in Figure 4 shows little excess over the photosphere in the near-IR bands, but large excess in the mid-IR and longer wavelengths. This indicates that the disk of SO 411 can be classified as a transitional disk, in agreement with the classification of TD/PTD based on photometry (Hernández et al., 2014). The outer optically thick disk is therefore truncated at some distance from the star (Espaillat et al., 2011). There still is some small flux excess over the photosphere in the near-IR, which could come from either optically thin dust in the inner cavity or from an optically thick inner disk remaining close to the star. In the last case, the disk would be a pre-transitional disk (Espaillat et al., 2007a, 2011).
3.5 Veiling and NIR excess continuum
To elucidate the nature of the material remaining inside the cavity in the disk of SO 411, we use the SpeX data to extract the spectrum of the material emitting in the near-IR. Following the methods in Muzerolle et al. (2003) and Espaillat et al. (2010), we extracted the NIR excess continuum over the photosphere in the SpeX spectrum.
We estimated the NIR excess continuum subtracting the spectroscopic template HD11443 from the SPEX spectrum of SO 411. The spectrum of HD11443 (F6IV) taken from the IRTF Spectral Library111http://irtfweb.ifa.hawaii.edu/s̃pex/IRTF_Spectral_Library/(Cushing et al., 2005; Rayner et al., 2009) was used as template. Before the subtraction, the target was corrected by veiling and both the target and the template spectra were normalized to the K band. A veiling of r0.1 was estimated comparing the equivalent width of Br measured for SO 411 with that of the template. Since Br could have a non resolved emission contribution from the accretion shocks, the estimated veiling should be considered as an upper limit. Unfortunately, the SpeX spectrum was too noisy to estimate veiling from other spectroscopic lines not affected by accretion.
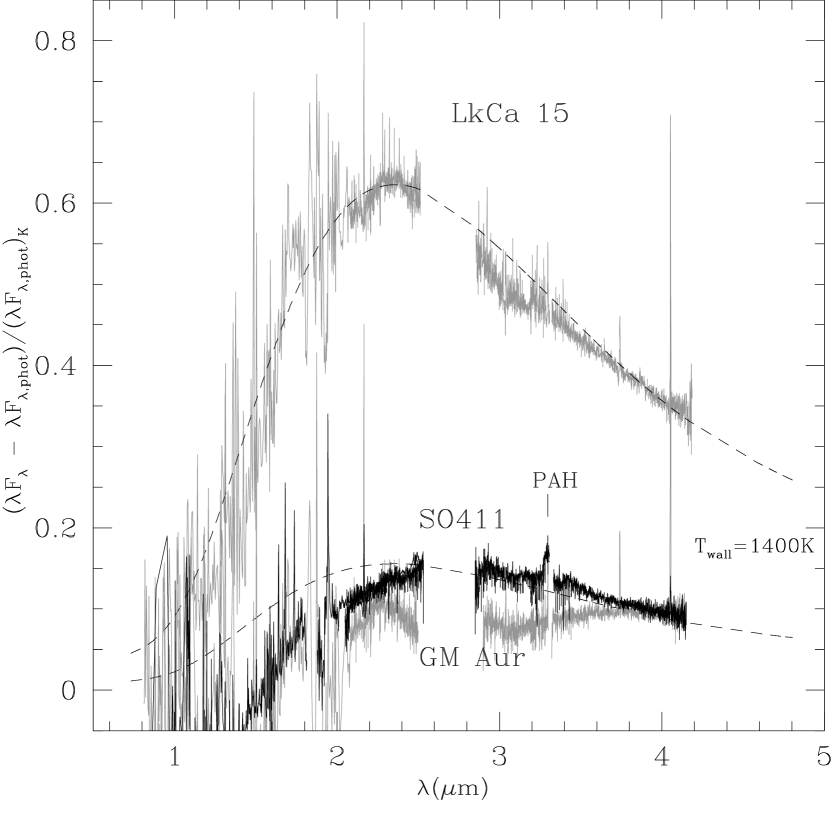
Figure 5 shows the NIR excess continuum for SO 411; for comparison, we also show the spectra of the pre-transitional disk LkCa 15 and of the transitional disk GM Aur (Espaillat et al., 2010). Similarly to GM Aur, the NIR excess continuum of SO 411 is small and it is too broad to be fitted by a single blackbody, unlike the spectrum of LkCa 15. This evidence suggests that the near-IR in SO 411 does not arise in optically thick emission near the star but most likely in optically thin dust inside the cavity, indicating that SO 411 is not a pre-transitional disk. Figure 5 also shows the presence of the PAH feature at 3.3µm. Unfortunately this feature falls between two orders of the Spex spectrum (§4.2).
3.6 Disk Model
We calculated the structure and emission of the disk surrounding SO 411 using the D’Alessio Irradiated Accretion Disks model (DIAD; D’Alessio et al., 1998, 1999, 2001, 2005, 2006), following the methods described in Espaillat et al. (2010), that apply the DIAD model to stars surrounded by TD or PTD. Based on the analysis in §3.5 we modeled the disk around SO 411 as a TD, that is, a truncated optically thick disk, allowing for optically thin dust inside the cavity. The input parameters that we held constant for the DIAD model were the accretion rate () and the stellar properties (Table 2). Other parameters related to the disk structure and to the dust mixtures in the different parts of the disk were varied to achieve the best fit model to the observed SED. We assumed a value of 60∘ as the inclination of the system.
We assumed that the dust is thermally coupled to the gas and the dust size distributions are proportional to , where is the radius of spherical grains, between (fixed at 0.005µm) and (Mathis et al., 1977). In the optically thick disk the dust consists of silicates with mass fraction relative to gas of =0.004 and graphite with mass fraction of =0.0025 (=0.0065; McClure et al., 2013). The silicate grains are composed of amorphous silicates (pyroxene stoichiometry and olivine stoichiometry) and crystalline silicates (fosterite, and enstatite). The opacities for the amorphous silicates and graphite were computed using MIE theory with optical constants from Dorschner et al. (1995) and Draine & Lee (1984), respectively. The opacities for the crystalline silicates were taken from Sargent et al. (2009b), we used the Continuous Distribution of Ellipsoids (CDE) approximation to calculate the opacities. We did not include water ice.
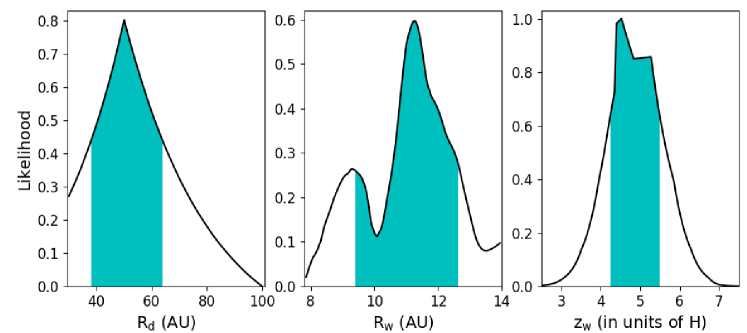
The parameters of each disk component were adjusted simultaneously to fit the observed SED. The components of the disk model that contribute to the synthetic SED include the optically thick disk, the inner edge of this disk (“the wall”, located at ), and the optically thin region between the star and the wall. We ran a grid of more than 3000 models, varying the input parameters in the ranges shown in Table 3, and calculated the comparing the synthetic SED with the observations. The theoretical SED that best fitted the observations is shown in Figure 6. The parameters of the model are shown in Table 4. Additionally, we estimated confidence intervals for the abundance of the different silicates species, for the location and height of the disk inner edge and for the size of the outer disk. To set these intervals, we followed the procedure in Maucó et al. (2016, 2018) to calculate the likelihood function, , of each parameter. The confidence intervals are given as those extreme limits at which the area below the likelihood curve maximum is 63% (1) of its total area (Sivia & Skilling, 2012). For those cases where the best value falls on one of the edges of the range of values used in the models, we have considered these as upper or lower limits, and they are indicated by parenthesis instead of square brackets in Table 4. Figure 7 shows the intervals for the size of the outer disk as well as for the location and height of the disk inner edge (light-blue shaded regions). Details for each disk component are given below.
Outer disk edge: We represent the inner edge of the optically thick disk by an optically thick “wall”, assumed to be vertical with evenly distributed dust. We calculated the structure and emission of this wall following D’Alessio et al. (2004). The dust mixture, the temperature of the wall, , the radius of wall, , and the height of the wall, , in units of the gas scale height () are varied to obtain the best model.
The best fit parameters are given in Table 4, including the relative abundances of the silicate mixture and their uncertainties. We found that the emission from the wall atmosphere is the main contributor to the silicate bands observed in the IRS spectra (cf. Figure 6).
Optically thick outer disk: The emission of the optically thick disk was calculated using the prescription in D’Alessio et al. (2006). The disk is heated by stellar irradiation and viscous dissipation and the disk structure and temperature distribution are calculated self-consistently for each radii. To simulate grain growth and settling, we assume that the disk is composed of two grain size distributions. In the upper disk layers, the grains have small sizes (with < 5µm) and in the disk midplane the maximum grain size is given by , which we adopt as a parameter. The viscosity is written in terms of the parameter (Shakura & Sunyaev, 1973; D’Alessio et al., 1998, 1999). Dust settling is parametrized with the quantity =, where is the dust-to-gas mass ratio of the small grain population and represents the sum of the mass fraction of the different dust components relative to gas. We assume that the dust composition in the outer disk is the same as that of its edge. The radius of the disk, , , and are varied to achieve the best fit to the observed SED. The best fit parameters are given in Table 4.
The mass of the disk, , is calculated by integrating the surface density up to the disk radius; it is also given in Table 4. Our , which is calculated based on dust emission and assuming a dust-to-gas mass ratio of 0.0065, is greater (by a factor of 10) than the upper limit reported by Ansdell et al. (2017) from CO observations. They stated, however, that their gas mass estimate has several caveats since it depends on the uncertain [CO]/[] and [CO]/[] ratios assumed in their models. If we, on the other hand, compare their dust mass estimate (from continuum observations at 1.33 mm) with ours, we found that our dust mass is only 3.5 greater than theirs. This difference is expected since they used the simplified approach of a single grain opacity in an isothermal disk, which tends to overestimate the grain opacity and hence, underestimates the mass. With our dust grain opacity, however, we can reproduce not only the flux at 1.33 mm but the entire SED.
Optically thin inner region: The emission from dust inside the cavity was calculated by integrating the specific intensity emerging from optically thin annuli, in which all of the dust grains are heated by stellar radiation (Calvet et al., 2002; Espaillat et al., 2010). The maximum grain size (), the mass of the optically thin dust (), the size of the region (,) and the fractional abundances of the silicates in the dust mixtures are varied to obtain the best model. The optically thin dust is composed by 0.03 lunar masses distributed between 0.3 AU and 9.0 AU with a maximum grain size of 5µm. Following Calvet et al. (2005); Espaillat et al. (2007a, b) we add organic (=0.001), troilite (=0.000768) and amorphous carbon (=0.001) to the dust mixture for comparison with other works in the literature. The opacities for organics, amorphous carbon and troilite are adopted from Pollack et al. (1994) and Begemann et al. (1994). For the silicates we used =0.004. The parameters of the best fit model are shown in Table 4. We stress that this is a proxy of the composition and spatial distribution of the optically thin dust since we need high resolution, near infrared interferometry to trace this component in detail.
| Parameter | Values |
|---|---|
| Optically Thick Disk | |
| from 1 to 1e-5, step log()=1 | |
| from 1 to 1e-4, step log()=1 aaWe refine our best fit exploration including of 0.003, 0.0006 and 0.0008 | |
| () | from 0.1 to 1e4, step log()=1 eeWe refine our best fit exploration including values of 0.25, 0.5, 0.75, 1.5, 2, 3, 4 and 5 µm |
| Rdisk (AU) | from 50 to 300, step=50 bbWe refine our best fit exploration including steps of 10 AU. |
| Optically Thick Wall | |
| Twall (K) | from 100 to 1400, step=100 ccWe refine our best fit exploration including steps of 10 K. |
| zwall (AU) | from 1.0 to 5.5, step=0.1 |
| () | from 0.1 to 1e4, step log()=1 eeWe refine our best fit exploration including values of 0.25, 0.5, 0.75, 1.5, 2, 3, 4 and 5 µm |
4 Discussion
4.1 Implications of dust mineralogy on disk evolution
Mid-infrared spectra of young stars can be well reproduced by a mixture of five main dust species: amorphous silicates with olivine and pyroxene stoichiometry, and crystalline forsterite, enstatite and silica. Since the interstellar medium (ISM) is characterized by amorphous silicates, the crystalline grains found in HAeBe and TTS systems must have been produced in the disk. Crystalline silicates such as forsterite and enstatite require formation temperatures above 1100 K (e.g., Fabian et al., 2000). These temperatures are naturally reached near the central star, where one expects a large fraction of crystalline silicates. This has been confirm by interferometric observations of HAeBe disks showing highly crystalline inner disks (van Boekel et al., 2004). However, Spitzer IRS spectra also indicate the presence of large amounts of warm 400-500 K crystalline silicates (enstatite or forsterite) at temperatures lower than the glass temperature of silicates in the disks around a number of young sources (Sargent et al., 2009a). This can be explained through transport of grains and radial mixing of material from hotter inner disk regions toward the cooler outer regions at larger radii from the central star (e.g., Gail, 2001). However, Bouwman et al. (2008) showed that the chemical gradients observed in circumstellar disks are difficult to explain in this scenario. Fast outward radial transport of crystals during the outburst of EX Lup was found by Juhász et al. (2012), but it is not clear if this mechanism would reach beyond a few AU. Therefore, silicate crystals in SO 411 most likely have formed locally in the disk, i.e. where they are presently observed.
In the case of SO 411, sharp bands of crystalline silicates can be observed in its IRS spectra. Modeling shows that the inner edge of the truncated disk dominates the IRS emission (see Figure 6), which indicates that thermal processing of dust has already taken place in this region. The inset of Figure 6 shows the IRS spectral range of SO 411 with the best fit model (solid line). As shown in Table 4, half the silicates of SO 411 are not amorphous, indicating a significant level of dust processing in its disk.
Enstatite and forsterite crystals have quite distinct spectral features that allow identification and quantification of their abundance. In particular, in the 10m region, enstatite has a conspicuous feature at 9.3 m, while forsterite strongest feature is at 10.8 m (Watson et al., 2009, Figure 1). The enstatite 9.3 m feature in the spectrum of SO 411 is very weak compared to forsterite (cf. Figure 8), indicating that forsterite is the most abundant silicate crystal (see Table 3), with a forsterite-to-enstatite ratio of 4. Similarly, olivine (amorphous precursor of forsterite) is slightly more abundant than pyroxene (amorphous precursor of enstatite). Infrared observations of the upper layers of protoplanetary disks around HAeBe and TTS show a different trend, i.e., enstatite is seen to be more concentrated towards the inner disk ( 10 m, T 500 K), while forsterite is more abundant in the outer disk ( 30 m, T 120 K) regions (Kessler-Silacci et al., 2006; Bouwman et al., 2008; Meeus et al., 2009; Juhász et al., 2010). According to Juhász et al. (2010), under chemical equilibrium the crystal population is dominated by enstatite, assuming solar abundances. Our finding contradicts this prediction, suggesting that the crystals we see in the spectra of SO 411 were formed under non-equilibrium conditions.
In order to produce in situ formation of crystalline silicates at a few AU from the star, one needs to consider an alternative heating mechanism beside irradiation; since at these distances the stellar radiation field cannot heat the dust at high enough temperatures for crystallization to occur. Given the TD morphology of SO 411, models of local heating of dust and gas by shock waves driven by tidal interactions of a giant planet with the disk has been proposed (Desch et al., 2005; Bouwman et al., 2010; Juhász et al., 2010; Mulders et al., 2011). A remarkable case is the HAeBe star HD 100546. This star also possesses a TD with forsterite grains in a disk wall located at 13 AU (Mulders et al., 2011), and exhibits complex radial structures with appearance of spiral arms as well as detections of multiple companions in IR and sub(-mm) observations (e.g., Boccaletti et al., 2013; Mulders et al., 2013; Currie et al., 2014, 2015; Walsh et al., 2014; Quanz et al., 2015; Pinilla et al., 2015; Wright et al., 2015; Garufi et al., 2016; Follette et al., 2017). Another forsterite source is RECX 5, a M4 TTS also surrounded by a TD in the Cha cluster (Bouwman et al., 2010).
As stated in Juhász et al. (2010), if the crystals are formed by shock heating in the outer disk, amorphous dust grains are then heated above the annealing temperature for a very short time, favoring crystallization (Harker & Desch, 2002). Over such a short timescale chemical equilibrium cannot be achieved and the resulting crystal product will be forsterite, independently of the starting stoichiometry of the amorphous particles. This can explain the observed dominance of forsterite in the outer disk of SO 411. Therefore, we conclude, as in Mulders et al. (2011), that the high forsterite abundance in the disk wall of SO 411 is somewhat connected to the presence of a hole, and hence, to giant planet formation. Additionally, studies on annealing of amorphous grains found that amorphous enstatite is converted to crystalline forsterite at T 1000 K (Fabian et al., 2000; Roskosz et al., 2011). These studies concluded that the mineralogy of silicate dust of solar composition should naturally be dominated by olivine for T 1000 K, while above this temperature pyroxenes should dominate. Our result then suggests an upper limit for the annealing temperature of silicate crystals of 1000 K in the disk around SO 411.
The forsterite features of SO 411 are strikingly similar to those observed in the ISO spectrum of Comet Hale-Bopp (Crovisier et al., 2000) (see Figure 8). Since comets can retain in their composition signatures the chemical and physical conditions under which they formed (e.g., Willacy et al., 2015), this provides a natural link to the composition of the solar nebula indicating that by 10 Myr (the age of OB1a, Briceño et al., 2007), the local dust composition of the proto-solar nebula must have already resembled that of SO 411. It also raises the possibility that the disk around SO 411 contains a significant amount of comets, something already proposed for HD 100546 (Malfait et al., 1998). This locates the formation of Hale-Bopp-like objects near the outer giant planets in protoplanetary disks, as in the case of HD 100546.
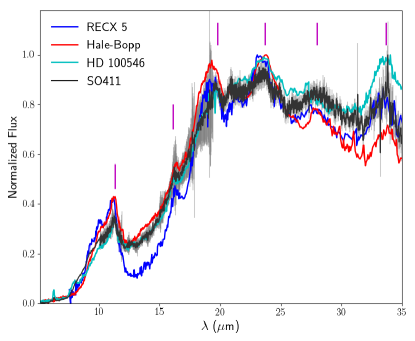
In contrast with HD 100546 and RECX 5 (also shown in Figure 8, note the similarity of SO 411 with HD 100546), SO 411 also exhibits significant amounts of silica in its dust mixture. Laboratory annealing experiments of amorphous silicates also show that during the formation of forsterite, silica can be produced (e.g., Fabian et al., 2000). In fact, silica has been found in the spectrum of young stars both in amorphous and in crystalline form (e.g., Bouwman et al., 2001; van Boekel et al., 2005; Sargent et al., 2009a). As noted in Bouwman et al. (2008), the crystalization of forsterite from an amorphous enstatite precursor leads to a silica by-product. Therefore, the amount of silica should then be commensurate with the amount of forsterite produced from the enstatite component. This is exactly what we observe in SO 411. The reason why SO 411 does show silica content while others forsterite sources, such as HD 100546 and RECX 5 (and similarly, comet Hale-Bopp) do not, is unknown and a matter for future discussion.
| Parameter | Best | Confidence |
|---|---|---|
| value | interval | |
| Optically Thick Outer Disk | ||
| (yr-1)…….. | 5 | – |
| …………………….. | 0.003 | – |
| …………………… | 0.1 | – |
| (au) ……………… | 50 | [38 - 64] |
| (m) ………… | 0.25 | – |
| (m) ……….. | 1000 | – |
| (%)…………… | 30 | [23 - 30) |
| (%)…………….. | 20 | [9.5 - 29] |
| (%)………….. | 20 | [18 - 20) |
| (%)…………… | 5 | (5 - 5.5] |
| (%) ………… | 25 | (25 -35] |
| ()……. | 0.039 | – |
| Optically Thick Outer Wall (*) | ||
| (m) ……….. | 1.0 | – |
| (K) ………………. | 260 | – |
| (au) ……………… | 11 | [9 - 13] |
| (in units of ) ….. | 4.4 | [4.2,5.5] |
| Optically Thin Region | ||
| (au) ………… | 0.3 | – |
| (au) …………. | 9.0 | – |
| (m) …….. | 5.0 | – |
| (%) ………….. | 99 | [94.6 - 99.6] |
| (%)……………. | 0.2 | [0.02 - 2] |
| (%)…………… | 0.8 | [0.34 - 3.4] |
| (lunar masses).. | 0.03 | – |
* The optically thick outer disk and the optically thick outer wall have the same dust composition footnotetext: - The confident intervals represent the 63% ( 1 ) of the area below the likelihood curve maximum. footnotetext: - The parenthesis represent those cases where the best value falls on one of the edges of the range of values used in the models.
4.2 PAH features
The detection of PAH emission is an indicator that carbonaceous material subsists in protoplanetary disks (Henning & Meeus, 2011). More than half of the HAeBe stars exhibit PAH features at 3.3, 6.2, 7.7, 8.6, 11.3 and 12.7 µm (Acke et al., 2010; Henning & Meeus, 2011; Seok & Li, 2017). On the other hand, PAH detections around T Tauri stars are more scarce; as far as we know, there are only three stars with spectral type K5 or later with reliable detection of PAH features: T54 (K5; Espaillat et al., 2017), EC 82 (K7) and IC348 LRL110 (M0; Seok & Li, 2017)222the stars IC348 LRL190( M3) and J1829070+003838(K7) listed in (Seok & Li, 2017) have marginal detections. This suggests that a stellar UV radiation field is necessary to excite the PAH molecules (Geers et al., 2006; Acke et al., 2010). However, the few PAH detections in T Tauri stars suggest that visible and NIR radiation may be capable of exciting PAH molecules (Li & Draine, 2002; Mattioda et al., 2005). If UV radiation is not necessary to excite PAH molecules, the lack of PAH detection could be explained if the continuum and the 10µm silicate emission feature hide the PAH features (Espaillat et al., 2017).
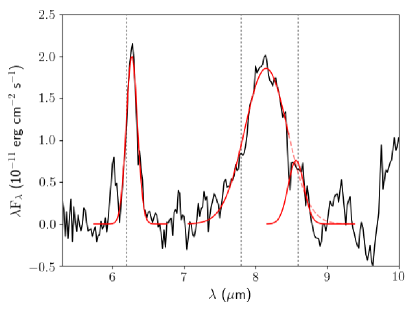
PAH features are seen in the IRS spectrum of SO 411 (Figure 6). The 3.3µm PAH feature is also hinted in the SpeX spectra (Figure 5), but unfortunately part of the feature fell between two SpeX orders so we will not discuss it further. Although a feature at 6.2 µm is clearly seen in the IRS spectrum, the features at longer wavelength need to be extracted from the strong silicate features (Figure 6). The strong contribution of crystalline silicates makes this task even more difficult, specially at wavelengths longer than 10 µm, so we confine our analysis to the features at 6.2 and 7.7 µm, due to the CC stretch modes, and the 8.6 µm feature arising in the CH bending mode. We extracted the features following the procedure of Seok & Li (2017); namely, we fitted the “continuum” with a cubic spline going through the same anchor points as in that paper, and then subtracted this continuum from the observed spectrum. The resultant “normalized” spectrum is shown in Figure 9. We decided to follow this procedure, instead of subtracting the model spectrum, because we wanted to compare properties of the extracted PAH spectra of SO 411 to those of the extended set of Herbig Ae/Be and T Tauri stars in Sloan et al. (2005), Acke et al. (2010) and Seok & Li (2017), extracted with the same procedure.
In the selected wavelength range, besides the 6.2 µm feature, we detect a wide feature around 8.3 µm, which we identify with the 7.7 and 8.6 µm features (Figure 9). Red-shifted 6.2 and 7.7µm PAH features have been observed in young stellar objects and the shifts give clues about the properties of the PAH emitters (e.g., Sloan et al., 2005; Acke et al., 2010; Seok & Li, 2017). To estimate the location of the peaks, we fitted the features with Gaussian profiles, as shown in Figure 9. We found that the 6.2 µm feature is shifted to = 6.27 µm and the 7.7 µm feature to = 8.14 µm. These shifts are consistent with the trend observed for the set of 53 Herbig Ae stars in Acke et al. (2010), who find that the 6.2 µm feature can be shifted to a maximum value of 6.275 µm; for this maximum value, the corresponding shift in the 7.7 µm feature ranges between 7.82 to 8.1 µm, in agreement with the shifts observed in SO 411. The shift of the 7.7 µm peak is consistent with the trend of position versus effective temperature found by Acke et al. (2010) for a sample of Herbig Ae and T Tauri stars; they find that the position of the peak is 8.1 µm for Herbig Ae, while it is 8.21 µm for TTS, so the observed shift of 8.14 µm in SO 411 is completely consistent with its intermediate nature between these two sets of stars.
Seok & Li (2017) explain the decrease of between TTS and Herbig Ae as the result of a decrease of the size of the PAHs as the effective temperature and luminosity of the star increase. In turn, the loss of small grains in the Herbig Ae could be explained in terms of a higher photodissociation rate for small PAH when the number of energetic UV photons increases as the star gets hotter and more luminous (Seok & Li, 2017). To estimate the PAH size in SO 411 we follow Seok & Li (2017), who characterize the grain size by the parameter ap, which is the size that corresponds to the maximum of the log size distribution weighted by mass. Using the fits to the observed correlations of a with effective temperature and luminosity to mass ratio, we get a = 5.1 and 4.6 Å for the values of Teff and L∗/M∗ of SO 411 (Table 2), respectively. Moreover, the value of a predicted from the location of the 7.7 µm is 4.3 Å (Seok & Li, 2017). Given the large scatter in the calibrations and the uncertainties in the location of the continuum, we consider that these values are consistent with each other. A value of a between 4.5 and 5 Å is smaller than in the ISM but in the upper end of the TTS distribution in the sample analyzed in Seok & Li (2017), and indicates that small PAHs still remain in the disk of SO 411. Therefore, the PAH spectrum of SO 411 is consistent with its intermediate state between the hot and luminous Herbig Ae and the less massive and cooler T Tauri stars.
Acke et al. (2010) find that the mass fraction of small silica grains in cold dust decreases as the FWHM of the 6.2 µm feature increases in their sample of Herbig Ae. Our measurement for the FWHM of this feature is 0.182 Å, which would imply a negligible silica mass fraction, according to this correlation. In contrast, we find a silica fraction of 25% of all silicates (§4.1). Herbig Ae stars do not seem to have abundances of silica as high as that found in SO 411, but they do occur in T Tauri stars (Sargent et al., 2009b). As Acke et al. (2010) state, the correlation between the FWHM of the 6.2 µm and the silica abundance is unexpected. Our finding that the correlation does not hold for less energetic environments may give an additional clue to its origin.
5 Summary and conclusions
We present a detailed irradiated disk model for the intermediate mass T Tauri star SO 411 (1.6 , spectral type F6). Our findings are as follows:
-
1.
Combining data from the GAIA-DR2 and available radial velocities, we find that SO 411 is not associated with the Orionis cluster, but it is more likely related to an older and sparser population located in front of the cluster.
-
2.
The star is surrounded by a primordial disk with mass 0.039 , with a gap extending to 11 AU from the star. Except at the midplane and at the wall, the disk is populated by ISM grains with a depletion of only 10% relative to the standard dust-to-gas mass ratio.
-
3.
We find evidence that the star is still accreting, with a mass accretion rate of yr-1. Given the disk mass and mass accretion rate, the most likely cause for the inner disk clearing is the interaction with a forming planet (cf. Espaillat et al., 2014).
-
4.
The SED shows a small near-IR excess arising from optically thin emission over a range of temperatures. With this, we show that SO 411 is not surrounded by a pre-transitional disk. The optically thin emission comes from a small amount of micron size grains of 0.03 lunar masses located between 0.3 and 9 AU from the star.
-
5.
Analysis of the 10m silicate feature profile indicates an approximately equal amount of crystalline and amorphous material, with forsterite as the most abundant silicate crystal. The crystalline material is found on the wall of the outer disk, which is the main contributor to the silicate features. Shock waves induced by giant planets can locally heat the material in the wall of the disk to produce crystals. The forsterite abundance found in SO 411 points to crystal formation in non-equilibrium conditions.
-
6.
PAH features are detected in the IRS spectrum of SO 411. Analysis of the 6.2 and 7.7 µm features indicates that small PAHs remain in the disk of SO 411. The PAH spectrum of SO 411 is consistent with its intermediate state between the hot and luminous Herbig Ae and the less massive and cooler T Tauri stars.
Acknowledgments. We are grateful to Jacques Crovisier for sending spectra of comet Hale-Bopp. The authors acknowledge support from programs UNAM-DGAPA-PAPIIT IN103017 and IN110816, Mexico. This paper utilizes the D’Alessio et al. (1998, 1999, 2001, 2005, 2006) Irradiated Accretion Disk code. We wish to recognize the work of Paola D’Alessio, who passed away in 2013. Her legacy and pioneering works live on through her substantial contributions to the field. An anonymous referee provided many insightful comments that improved the content and presentation of this work. We thank the institutions and personnel that support data acquisition at the Observatorio Astronómico Nacional at San Pedro Martir, the Lowell Observatory and the Mauna Kea Observatory. This work is based on observations made with the Spitzer Space Telescope, which is operated by the Jet Propulsion Laboratory, under a contract with NASA. We used the Infrared Telescope Facility, which is operated by the University of Hawaii under contract NNH14CK55B with the NASA. These results made use of the Discovery Channel Telescope at Lowell Observatory, supported by Discovery Communications, Inc., Boston University, the University of Maryland, the University of Toledo and Northern Arizona University. This publication makes use of data products from the Two Micron All Sky Survey, which is a joint project of the University of Massachusetts and the Infrared Processing and Analysis Center/California Institute of Technology, funded by the National Aeronautics and Space Administration and the National Science Foundation. We also make use of data products from the Wide-field Infrared Survey Explorer, which is a joint project of the University of California, Los Angeles, and the Jet Propulsion Laboratory/California Institute of Technology, funded by the National Aeronautics and Space Administration. This work is based on observations with AKARI, a JAXA project with the participation of ESA. The grid of accretion disk models used in the present work has been calculated using the supercomputer Mouruka, at IRyA, provided by CONACyT grant number INFR-2015-01-252629.
References
- Acke & van den Ancker (2004) Acke, B., & van den Ancker, M. E. 2004, A&A, 426, 151
- Acke et al. (2010) Acke, B., Bouwman, J., Juhász, A., et al. 2010, ApJ, 718, 558
- Alcalá et al. (2014) Alcalá, J. M., Natta, A., Manara, C. F., et al. 2014, A&A, 561, A2
- Alexander et al. (2014) Alexander, R., Pascucci, I., Andrews, S., Armitage, P., & Cieza, L. 2014, Protostars and Planets VI, 475
- ALMA Partnership et al. (2015) ALMA Partnership, Brogan, C. L., Pérez, L. M., et al. 2015, ApJ, 808, L3
- Andrews et al. (2016) Andrews, S. M., Wilner, D. J., Zhu, Z., et al. 2016, ApJ, 820, L40
- Ansdell et al. (2017) Ansdell, M., Williams, J. P., Manara, C. F., et al. 2017, AJ, 153, 240
- Andrews et al. (2011) Andrews, S. M., Wilner, D. J., Espaillat, C., et al. 2011, ApJ, 732, 42
- Astropy Collaboration et al. (2013) Astropy Collaboration, Robitaille, T. P., Tollerud, E. J., et al. 2013, A&A, 558, A33
- Bailer-Jones (2015) Bailer-Jones, C. A. L. 2015, PASP, 127, 994
- Begemann et al. (1994) Begemann, B., Dorschner, J., Henning, T., Mutschke, H., & Thamm, E. 1994, ApJ, 423, L71
- Birnstiel et al. (2012) Birnstiel, T., Andrews, S. M., & Ercolano, B. 2012, A&A, 544, A79
- Boccaletti et al. (2013) Boccaletti, A., Pantin, E., Lagrange, A.-M., et al. 2013, A&A, 560, A20
- Bouwman et al. (2010) Bouwman, J., Lawson, W. A., Juhász, A., et al. 2010, ApJ, 723, L243
- Bouwman et al. (2008) Bouwman, J., Henning, T., Hillenbrand, L. A., et al. 2008, ApJ, 683, 479-498
- Bouwman et al. (2001) Bouwman, J., Meeus, G., de Koter, A., et al. 2001, A&A, 375, 950
- Brown et al. (2007) Brown, J. M., Blake, G. A., Dullemond, C. P., et al. 2007, ApJ, 664, L107
- Briceño et al. (2007) Briceño, C., Hartmann, L., Hernández, J., et al. 2007, ApJ, 661, 1119
- Briceño et al. (2018) Briceno, C., Calvet, N., Hernandez, J., et al. 2018, arXiv:1805.01008
- Caballero (2008) Caballero, J. A. 2008, A&A, 478, 667
- Caballero (2008) Caballero, J. A. 2008b, MNRAS, 383, 375
- Calvet et al. (2002) Calvet, N., D’Alessio, P., Hartmann, L., et al. 2002, ApJ, 568, 1008
- Calvet et al. (2004) Calvet, N., Muzerolle, J., Briceño, C., et al. 2004, AJ, 128, 1294
- Calvet et al. (2005) Calvet, N., D’Alessio, P., Watson, D. M., et al. 2005, ApJ, 630, L185
- Calvet & D’Alessio (2011) Calvet, N., & D’Alessio, P. 2011, Physical Processes in Circumstellar Disks around Young Stars, 14
- Casassus (2016) Casassus, S. 2016, PASA, 33, e013
- Chiang & Murray-Clay (2007) Chiang, E., & Murray-Clay, R. 2007, Nature Physics, 3, 604
- Cieza et al. (2013) Cieza, L. A., Olofsson, J., Harvey, P. M., et al. 2013, ApJ, 762, 100
- Crovisier et al. (2000) Crovisier, J., Brooke, T. Y., Leech, K., et al. 2000, Thermal Emission Spectroscopy and Analysis of Dust, Disks, and Regoliths, 196, 109
- Currie et al. (2015) Currie, T., Cloutier, R., Brittain, S., et al. 2015, ApJ, 814, L27
- Currie et al. (2014) Currie, T., Muto, T., Kudo, T., et al. 2014, ApJ, 796, L30
- Cushing et al. (2004) Cushing, M. C., Vacca, W. D., & Rayner, J. T. 2004, PASP, 116, 362
- Cushing et al. (2005) Cushing, M. C., Rayner, J. T., & Vacca, W. D. 2005, ApJ, 623, 1115
- Cutri et al. (2003) Cutri, R. M., Skrutskie, M. F., van Dyk, S., et al. 2003, VizieR Online Data Catalog, 2246
- Cutri et al. (2013) Cutri, R. M., et al. 2013, VizieR Online Data Catalog, 2328,
- Currie et al. (2009) Currie, T., Lada, C. J., Plavchan, P., et al. 2009, ApJ, 698, 1
- D’Alessio et al. (1998) D’Alessio, P., Cantö, J., Calvet, N., & Lizano, S. 1998, ApJ, 500, 411
- D’Alessio et al. (1999) D’Alessio, P., Calvet, N., Hartmann, L., Lizano, S., & Cantó, J. 1999, ApJ, 527, 893
- D’Alessio et al. (2001) D’Alessio, P., Calvet, N., & Hartmann, L. 2001, ApJ, 553, 321
- D’Alessio et al. (2004) D’Alessio, P., Calvet, N., Hartmann, L., Muzerolle, J., & Sitko, M. 2004, Star Formation at High Angular Resolution, 221, 403
- D’Alessio et al. (2005) D’Alessio, P., Hartmann, L., Calvet, N., et al. 2005, ApJ, 621, 461
- D’Alessio et al. (2006) D’Alessio, P., Calvet, N., Hartmann, L., Franco-Hernández, R., & Servín, H. 2006, ApJ, 638, 314
- D’Alessio (2009) D’Alessio, P. 2009, Revista Mexicana de Astronomia y Astrofisica Conference Series, 35, 33
- Desch et al. (2005) Desch, S. J., Ciesla, F. J., Hood, L. L., & Nakamoto, T. 2005, Chondrites and the Protoplanetary Disk, 341, 849
- Dong & Fung (2017) Dong, R., & Fung, J. 2017, ApJ, 835, 146
- Dorschner et al. (1995) Dorschner, J., Begemann, B., Henning, T., Jaeger, C., & Mutschke, H. 1995, A&A, 300, 503
- Draine & Lee (1984) Draine, B. T., & Lee, H. M. 1984, ApJ, 285, 89
- Dullemond & Dominik (2004) Dullemond, C. P., & Dominik, C. 2004, A&A, 421, 1075
- Dullemond & Dominik (2005) Dullemond, C. P., & Dominik, C. 2005, A&A, 434, 971
- Espaillat et al. (2007a) Espaillat, C., Calvet, N., D’Alessio, P., et al. 2007, ApJ, 664, L111
- Espaillat et al. (2007b) Espaillat, C., Calvet, N., D’Alessio, P., et al. 2007, ApJ, 670, L135
- Espaillat et al. (2010) Espaillat, C., D’Alessio, P., Hernández, J., et al. 2010, ApJ, 717, 441
- Espaillat et al. (2014) Espaillat, C., Muzerolle, J., Najita, J., et al. 2014, Protostars and Planets VI, 497
- Espaillat et al. (2017) Espaillat, C. C., Ribas, Á., McClure, M. K., et al. 2017, ApJ, 844, 60
- Espaillat et al. (2008) Espaillat, C., Muzerolle, J., Hernández, J., et al. 2008, ApJ, 689, L145
- Espaillat et al. (2011) Espaillat, C., Furlan, E., D’Alessio, P., et al. 2011, ApJ, 728, 49
- Espaillat et al. (2012) Espaillat, C., Ingleby, L., Hernández, J., et al. 2012, ApJ, 747, 103
- Ercolano & Pascucci (2017) Ercolano, B., & Pascucci, I. 2017, Royal Society Open Science, 4, 170114
- Fabian et al. (2000) Fabian, D., Jäger, C., Henning, T., Dorschner, J., & Mutschke, H. 2000, A&A, 364, 282
- Fabricant et al. (1998) Fabricant, D., Cheimets, P., Caldwell, N., & Geary, J. 1998, PASP, 110, 79
- Fairlamb et al. (2017) Fairlamb, J. R., Oudmaijer, R. D., Mendigutia, I., Ilee, J. D., & van den Ancker, M. E. 2017, MNRAS, 464, 4721
- Fang et al. (2009) Fang, M., van Boekel, R., Wang, W., et al. 2009, A&A, 504, 461
- Follette et al. (2017) Follette, K. B., Rameau, J., Dong, R., et al. 2017, AJ, 153, 264
- Furlan et al. (2006) Furlan, E., Hartmann, L., Calvet, N., et al. 2006, ApJS, 165, 568
- Furlan et al. (2011) Furlan, E., Luhman, K. L., Espaillat, C., et al. 2011, ApJS, 195, 3
- Gaia Collaboration et al. (2018) Gaia Collaboration, Brown, A. G. A., Vallenari, A., et al. 2018, arXiv:1804.09365
- Gail (2001) Gail, H.-P. 2001, A&A, 378, 192
- Garrison (1967) Garrison, R. F. 1967, PASP, 79, 433
- Garufi et al. (2016) Garufi, A., Quanz, S. P., Schmid, H. M., et al. 2016, A&A, 588, A8
- Geers et al. (2006) Geers, V. C., Augereau, J.-C., Pontoppidan, K. M., et al. 2006, A&A, 459, 545
- Gullbring et al. (1998) Gullbring, E., Hartmann, L., Briceño, C., & Calvet, N. 1998, ApJ, 492, 323
- Gutermuth et al. (2009) Gutermuth, R. A., Megeath, S. T., Myers, P. C., et al. 2009, ApJS, 184, 18
- Habart et al. (2004) Habart, E., Natta, A., & Krügel, E. 2004, A&A, 427, 179
- Harker & Desch (2002) Harker, D. E., & Desch, S. J. 2002, ApJ, 565, L109
- Henning & Meeus (2011) Henning, T., & Meeus, G. 2011, Physical Processes in Circumstellar Disks around Young Stars, 114
- Hernández et al. (2004) Hernández, J., Calvet, N., Briceño, C., Hartmann, L., & Berlind, P. 2004, AJ, 127, 1682
- Hernández et al. (2007) Hernández, J., Hartmann, L., Megeath, T., et al. 2007, ApJ, 662, 1067
- Hernández et al. (2009) Hernández, J., Calvet, N., Hartmann, L., et al. 2009, ApJ, 707, 705
- Hernández et al. (2010) Hernández, J., Morales-Calderon, M., Calvet, N., et al. 2010, ApJ, 722, 1226
- Hernández et al. (2014) Hernández, J., Calvet, N., Perez, A., et al. 2014, ApJ, 794, 36
- Higdon et al. (2004) Higdon, S. J. U., Devost, D., Higdon, J. L., et al. 2004, PASP, 116, 975
- Houck et al. (2004) Houck, J. R., Roellig, T. L., van Cleve, J., et al. 2004, ApJS, 154, 18
- Ingleby et al. (2013) Ingleby, L., Calvet, N., Herczeg, G., et al. 2013, ApJ, 767, 112
- Davis (1999) Davis, L. E. 1999, Precision CCD Photometry, 189, 35
- Ishihara et al. (2010) Ishihara, D., Onaka, T., Kataza, H., et al. 2010, A&A, 514, A1
- Jeffries et al. (2006) Jeffries, R. D., Maxted, P. F. L., Oliveira, J. M., & Naylor, T. 2006, MNRAS, 371, L6
- Juhász et al. (2012) Juhász, A., Dullemond, C. P., van Boekel, R., et al. 2012, ApJ, 744, 118
- Juhász et al. (2010) Juhász, A., Bouwman, J., Henning, T., et al. 2010, ApJ, 721, 431
- Kamp (2011) Kamp, I. 2011, EAS Publications Series, 46, 271
- Keller et al. (2008) Keller, L. D., Sloan, G. C., Forrest, W. J., et al. 2008, ApJ, 684, 411-429
- Kenyon & Hartmann (1995) Kenyon, S. J., & Hartmann, L. 1995, ApJS, 101, 117
- Kessler-Silacci et al. (2006) Kessler-Silacci, J., Augereau, J.-C., Dullemond, C. P., et al. 2006, ApJ, 639, 275
- Kharchenko et al. (2007) Kharchenko, N. V., Scholz, R.-D., Piskunov, A. E., Röser, S., & Schilbach, E. 2007, Astronomische Nachrichten, 328, 889
- Kounkel et al. (2018) Kounkel, M., Covey, K., Suárez, G., et al. 2018, arXiv:1805.04649.
- Lada et al. (2006) Lada, C. J., Muench, A. A., Luhman, K. L., et al. 2006, AJ, 131, 1574
- Landolt (2009) Landolt, A. U. 2009, AJ, 137, 4186
- Lebouteiller et al. (2010) Lebouteiller, V., Bernard-Salas, J., Sloan, G. C., & Barry, D. J. 2010, PASP, 122, 231
- Lebouteiller et al. (2011) Lebouteiller, V., Barry, D. J., Spoon, H. W. W., et al. 2011, ApJS, 196, 8
- Li & Draine (2002) Li, A., & Draine, B. T. 2002, ApJ, 572, 232
- Luhman et al. (2010) Luhman, K. L., Allen, P. R., Espaillat, C., Hartmann, L., & Calvet, N. 2010, ApJS, 186, 111
- Maaskant et al. (2013) Maaskant, K. M., Honda, M., Waters, L. B. F. M., et al. 2013, A&A, 555, A64
- Malfait et al. (1998) Malfait, K., Waelkens, C., Waters, L. B. F. M., et al. 1998, A&A, 332, L25
- Massey & Davis (1992) Massey, P., & Davis, L. E. 1992, A user’s guide to stellar CCD photometry with IRAF, NOAO
- Mathis et al. (1977) Mathis, J. S., Rumpl, W., & Nordsieck, K. H. 1977, ApJ, 217, 425
- Mathis (1990) Mathis, J. S. 1990, ARA&A, 28, 37
- Barrett et al. (2005) Barrett, P., Hunter, J., Miller, J. T., Hsu, J.-C., & Greenfield, P. 2005, Astronomical Data Analysis Software and Systems XIV, 347, 91
- Mattioda et al. (2005) Mattioda, A. L., Allamandola, L. J., & Hudgins, D. M. 2005, ApJ, 629, 1183
- Maucó et al. (2018) Maucó, K., Briceño, C., Calvet, N., et al. 2018, ApJ, 859, 1
- Maucó et al. (2016) Maucó, K., Hernández, J., Calvet, N., et al. 2016, ApJ, 829, 38
- Maxted et al. (2008) Maxted, P. F. L., Jeffries, R. D., Oliveira, J. M., Naylor, T., & Jackson, R. J. 2008, MNRAS, 385, 2210
- McClure et al. (2013) McClure, M. K., D’Alessio, P., Calvet, N., et al. 2013, ApJ, 775, 114
- McClure et al. (2010) McClure, M. K., Furlan, E., Manoj, P., et al. 2010, ApJS, 188, 75
- McClure et al. (2012) McClure, M. K., Manoj, P., Calvet, N., et al. 2012, ApJ, 759, L10
- Meeus et al. (2009) Meeus, G., Juhász, A., Henning, T., et al. 2009, A&A, 497, 379
- Meeus et al. (2001) Meeus, G., Waters, L. B. F. M., Bouwman, J., et al. 2001, A&A, 365, 476
- Mulders et al. (2013) Mulders, G. D., Paardekooper, S.-J., Panić, O., et al. 2013, A&A, 557, A68
- Mulders et al. (2011) Mulders, G. D., Waters, L. B. F. M., Dominik, C., et al. 2011, A&A, 531, A93
- Muzerolle et al. (2003) Muzerolle, J., Calvet, N., Hartmann, L., & D’Alessio, P. 2003, ApJ, 597, L149
- Muzerolle et al. (2010) Muzerolle, J., Allen, L. E., Megeath, S. T., Hernández, J., & Gutermuth, R. A. 2010, ApJ, 708, 1107
- Oliveira et al. (2006) Oliveira, J., Bouwman, J., Jeffries, R., van Loon, J., & van den Ancker, M. 2006, Spitzer Proposal, 30381
- Olofsson et al. (2009) Olofsson, J., Augereau, J.-C., van Dishoeck, E. F., et al. 2009, A&A, 507, 327
- Owen (2016) Owen, J. E. 2016, PASA, 33, e005
- Pascual et al. (2016) Pascual, N., Montesinos, B., Meeus, G., et al. 2016, A&A, 586, A6
- Pecaut & Mamajek (2013) Pecaut, M. J., & Mamajek, E. E. 2013, ApJS, 208, 9
- Péricaud et al. (2017) Péricaud, J., Di Folco, E., Dutrey, A., Guilloteau, S., & Piétu, V. 2017, A&A, 600, A62
- Pinilla et al. (2016) Pinilla, P., Flock, M., Ovelar, M. d. J., & Birnstiel, T. 2016, A&A, 596, A81
- Pinilla et al. (2015) Pinilla, P., Birnstiel, T., & Walsh, C. 2015, A&A, 580, A105
- Pollack et al. (1994) Pollack, J. B., Hollenbach, D., Beckwith, S., et al. 1994, ApJ, 421, 615
- Quanz et al. (2015) Quanz, S. P., Amara, A., Meyer, M. R., et al. 2015, ApJ, 807, 64
- Rayner et al. (2009) Rayner, J. T., Cushing, M. C., & Vacca, W. D. 2009, ApJS, 185, 289
- Ribas et al. (2015) Ribas, Á., Bouy, H., & Merín, B. 2015, A&A, 576, A52
- Roskosz et al. (2011) Roskosz, M., Gillot, J., Capet, F., Roussel, P., & Leroux, H. 2011, A&A, 529, A111
- Rubinstein et al. (2018) Rubinstein, A. E., Macias, E., Espaillat, C. C., et al. 2018, arXiv:1804.07343
- Ruíz-Rodríguez et al. (2016) Ruíz-Rodríguez, D., Ireland, M., Cieza, L., & Kraus, A. 2016, MNRAS, 463, 3829
- Sacco et al. (2008) Sacco, G. G., Franciosini, E., Randich, S., & Pallavicini, R. 2008, A&A, 488, 167
- Sargent et al. (2009a) Sargent, B. A., Forrest, W. J., Tayrien, C., et al. 2009, ApJ, 690, 1193
- Sargent et al. (2009b) Sargent, B. A., Forrest, W. J., Tayrien, C., et al. 2009, ApJS, 182, 477
- Sartori et al. (2010) Sartori, M. J., Gregorio-Hetem, J., Rodrigues, C. V., Hetem, A., Jr., & Batalha, C. 2010, AJ, 139, 27-38
- Schaefer (2013) Schaefer, G. H. 2013, EAS Publications Series, 64, 181
- Seok & Li (2017) Seok, J. Y., & Li, A. 2017, ApJ, 835, 291
- Shakura & Sunyaev (1973) Shakura, N. I., & Sunyaev, R. A. 1973, X- and Gamma-Ray Astronomy, 55, 155
- Sicilia-Aguilar et al. (2013) Sicilia-Aguilar, A., Kim, J. S., Sobolev, A., et al. 2013, A&A, 559, A3
- Siess et al. (2000) Siess, L., Dufour, E., & Forestini, M. 2000, A&A, 358, 593
- Sivia & Skilling (2012) Sivia, D., & Skilling, 2012, Data Analysis: a Bayesian tutorial, 246
- Simón-Díaz et al. (2015) Simón-Díaz, S., Caballero, J. A., Lorenzo, J., et al. 2015, ApJ, 799, 169
- Sloan et al. (2005) Sloan, G. C., Keller, L. D., Forrest, W. J., et al. 2005, ApJ, 632, 956
- Strom et al. (1989) Strom, K. M., Strom, S. E., Edwards, S., Cabrit, S., & Skrutskie, M. F. 1989, AJ, 97, 1451
- Sung et al. (2009) Sung, H., Stauffer, J. R., & Bessell, M. S. 2009, AJ, 138, 1116
- Testi et al. (2014) Testi, L., Birnstiel, T., Ricci, L., et al. 2014, Protostars and Planets VI, 339
- Torres et al. (1995) Torres, C. A. O., Quast, G., de La Reza, R., Gregorio-Hetem, J., & Lepine, J. R. D. 1995, AJ, 109, 2146
- van Boekel et al. (2005) van Boekel, R., Min, M., Waters, L. B. F. M., et al. 2005, A&A, 437, 189
- van Boekel et al. (2004) van Boekel, R., Waters, L. B. F. M., Dominik, C., et al. 2004, A&A, 418, 177
- van der Marel et al. (2016) van der Marel, N., Verhaar, B. W., van Terwisga, S., et al. 2016, A&A, 592, A126
- Visser et al. (2007) Visser, R., Geers, V. C., Dullemond, C. P., et al. 2007, A&A, 466, 229
- Walsh et al. (2014) Walsh, C., Juhász, A., Pinilla, P., et al. 2014, ApJ, 791, L6
- Watson et al. (2009) Watson, D. M., Leisenring, J. M., Furlan, E., et al. 2009, ApJS, 180, 84
- White & Basri (2003) White, R. J., & Basri, G. 2003, ApJ, 582, 1109
- Willacy et al. (2015) Willacy, K., Alexander, C., Ali-Dib, M., et al. 2015, Space Sci. Rev., 197, 151
- Williams & Cieza (2011) Williams, J.P., & Cieza, L. A. 2011, ARA&A, 49, 67
- Williams et al. (2013) Williams, J. P., Cieza, L. A., Andrews, S. M., et al. 2013, MNRAS, 435, 1671
- Wright et al. (2015) Wright, C. M., Maddison, S. T., Wilner, D. J., et al. 2015, MNRAS, 453, 414
- Yamamura et al. (2010) Yamamura, I., Makiuti, S., Ikeda, N., et al. 2010, VizieR Online Data Catalog, 2298
- Zhang et al. (2015) Zhang, K., Blake, G. A., & Bergin, E. A. 2015, ApJ, 806, L7
- Zhang et al. (2016) Zhang, K., Bergin, E. A., Blake, G. A., et al. 2016, ApJ, 818, L16
- Zhu et al. (2011) Zhu, Z., Nelson, R. P., Hartmann, L., Espaillat, C., & Calvet, N. 2011, ApJ, 729, 47
- Zhu et al. (2012) Zhu, Z., Nelson, R. P., Dong, R., Espaillat, C., & Hartmann, L. 2012, ApJ, 755, 6