Direct Evidence of the Benzylium and Tropylium Cations as the two long-lived Isomers of \CsHs
Abstract
Disentangling the isomeric structure of \ceC7H7+ is a longstanding experimental issue. We report here the full mid-infrared vibrational spectrum of \ceC7H7+ tagged with Ne obtained with infrared-predissociation spectroscopy at . Saturation depletion measurements were used to assign the contribution of benzylium and tropylium isomers and demonstrate that no other isomer is involved. Recorded spectral features compare well with density functional theory calculations. This opens perspectives for a better understanding and control of the formation paths leading to either tropylium or benzylium ions.
Direct Evidence of the Benzylium and Tropylium Cations as the two long-lived Isomers of \CsHs
Pavol Jusko,[a] Aude Simon,[b] Shreyak Banhatti,[c] Sandra Brünken,[d] Christine Joblin[a],∗
Submitted version. Final version in Chem. Phys. Chem.; http://dx.doi.org/10.1002/cphc.201800744
Benzylium (\ceBz+) and tropylium (\ceTr+) ions are key isomers of \CsHs commonly produced from energized toluene (\ceC7H8) 1, 2, 3. Whereas \ceBz+consists of a benzene ring substituted with a methylene group, the \ceTr+ isomer is a fully aromatic ion made of a 7-membered CH ring. The possibility that similar structures can be involved in the fragmentation of methyl-substitued polycyclic aromatic hydrocarbon ions has been recently discussed 4, 5. Still, one of the major issues in these studies is the limited understanding of the formation paths of these species, that would allow us to predict and therefore control the production of one or the other isomer. On the one hand, it was shown that the choice of the precursor is important, e. g., the use of halogen-substitued toluene is expected to optimise the production of \ceBz+6. But on the other hand, the \ceBz+/\ceTr+ ratio depends strongly on the various experimental conditions 7, 8. Another point, in photoionization experiments of toluene, is that it is not possible to produce solely \ceTr+ at appearance threshold 9, despite calculations show \ceTr+ being energetically more favorable than \ceBz+ (by ; cf. Tab S3 in the SI). The latter results were interpreted as due both to the presence of a barrier in the dissociation path from toluene towards \ceTr+, and to the role of autoionizing states in promoting a nonstatistical formation of \ceBz+ over \ceTr+ 9. In contrast to \ceTr+, theoretical studies show that paths towards \ceBz+ lack high barriers, and no barrier is found in the path from benzyl chloride ionization towards \ceBz+ formation 10.
It is known since earlier studies on \CsHs that a convenient way to identify \ceBz+ is through ion-molecule reaction with toluene, leading to efficient formation of \ceC8H9+11, 1. The non-reactive part of the ion population is then attributed to \ceTr+. In parallel, there have been many attempts to characterize the structure of \CsHs directly, i. e., via spectroscopy. Electronic absorption features have been studied in both Ne matrix 12 and in gas-phase by photodissociation 13, 14. For \ceBz+, the vibronic structure was resolved for the S1S0 transition but much broader features were observed for the higher excited states. Absorption features of \ceTr+ are expected in the UV range 12, but the data obtained in Ne matrices could not be confirmed in the gas-phase 13. On the opposite, infrared and Raman spectra of \ceTr+could be obtained in solutions or in solid phase using salts 15, 16, 17. In gas-phase, one can think of infrared multiple photon dissociation (IRMPD) vibrational spectroscopy as the technique of choice when characterizing the structure of ions in mass spectrometry experiments 18. Information on the \ceBz+/ \ceTr+ dichotomy 19 could be obtained from the IRMPD spectra of derivative ions with lower dissociation thresholds compared to \CsHs20, 21, 19, 22. The spectroscopy of polycyclic hydrocarbon cations containing \ceBz+ and \ceTr+ structure was also investigated 8, 5. However, the IRMPD spectra of pure \ceBz+ and \ceTr+ are still lacking, despite the efforts 20. This could be due to the exceptional stability of these ions, or possible isomerisation issues, as found in the case of \ceC17H11+ 5.
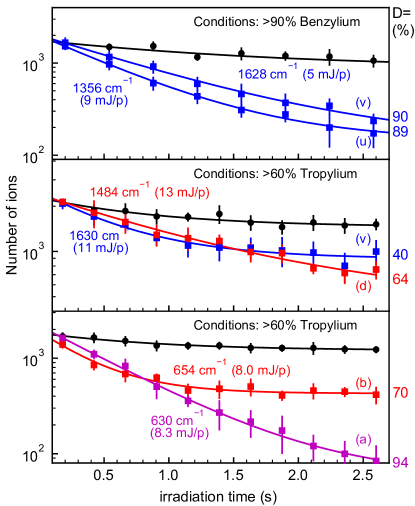
An alternative approach to IRMPD not owning the disadvantages of the multi-photon process, is infrared pre-dissociation (IR-PD) spectroscopy of a weakly bound complex of the ion with a rare gas atom. Thanks to this technique, we were able to obtain the first complete mid-IR-PD spectra of \ceNe tagged \CsHs recorded in gas-phase and at low temperature. We used the cryogenic 22 pole ion trap 23, which is coupled to the free electron laser FELIX, as described in the experimental section below. We introduced different precursors and varied the ionization conditions (cf. Tab. S1 in the SI). Figure 1 gathers the recorded experimental spectra, which appear to agree well with the calculated spectra of \ceBz+ and \ceTr+ using density functional theory (DFT) at the B3LYP/6-31G(d,p) level of theory as implemented in Gaussian09 suite of programs 24. In addition, the contribution of \ceBz+ and \ceTr+ in each mixture could be determined directly during the spectroscopic experiment by using saturation depletion measurements. To achieve the latter, the laser is tuned in resonance with a vibrational band of interest. By applying a large number of photon pulses, the optically active isomer-Ne complex can be dissociated completely leaving only the optically inactive isomer-Ne complex in the trap. Recording the ion-Ne () number as a function of time reveals the relative abundance of active to inactive isomers. Depletion tests for selected bands of both isomers and under varying ion source conditions are shown in Fig. 2. They show that one condition leads to 90% \ceBz+ population and another to 60-70% of \ceTr+ with 40-30% of \ceBz+. These measurements provide the first complete demonstration that \ceBz+ and \ceTr+ are the only long-lived isomers of \CsHs. In a preparatory study, we also recorded the chemical reactivity with toluene and found a good agreement with the above measurements, although only \ceBz+ can be directly monitored (cf. Fig. S2 in the SI).
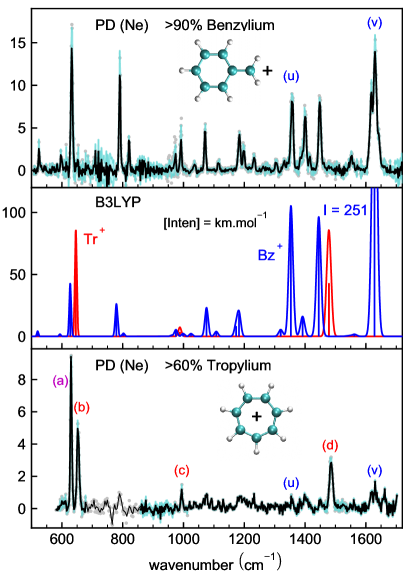
Assignment of the experimental bands of \ceBz+ and \ceTr+ is made in Tables 1 and 2. Additional levels of theory were carried out for benchmarking (cf. Section 2 in the SI). For each level, the calculated band positions are linearly scaled with a scaling factor S, in order to match with the strongest \ceBz+ band. From calculations on \ceNe tagged ions, we found that the top (T) and molecular plane (P) isomers are quasi degenerate (cf. Tab. S3 in the SI) and that the Ne tag is not expected to induce band shifts (cf. Figs. S12 and S13, Table S4 in the SI), nor splitting of the bands due to the degeneracy lifting in the \ceTr+ case, that would be observable in our experiments (cf. Fig. S12 in the SI, degenerate bands always split by less than ). Overall, we found a good agreement between the measured and calculated band positions. However, in the case of \ceTr+, one major difference exists. The harmonic calculations provide only three infrared active bands, which can be rationalized by the high symmetry of \ceTr+ which pertains to the point group symmetry (cf. Tab. S2 in the SI for descent in symmetry from to C2v, in which calculations are performed). In the experimental spectrum, we found four bands, two bands including the additional one falling at low frequency. We note that two close-by bands in this range are also observed in some experiments in condensed phase 15, 16, 17.
| Mode | Exp. | Calc. | ||
|---|---|---|---|---|
| Inten. | Sym. | |||
| 524 | 521 | 4.3 | A1 | |
| 596 | 594 | 1.8 | B2 | |
| 632 | 628 | 42.8 | B1 | |
| 790 | 780 | 26.3 | B1 | |
| 820 | 803 | 2.6 | A1 | |
| 962 | 0.9 | B2 | ||
| 974 | 976 | 5.4 | A1 | |
| 992 | 1000 | 2.4 | A1 | |
| 1036 | 1026 | 2.3 | B1 | |
| 1070 | 1077 | 23.2 | B1 | |
| 1114 | 1109 | 4.0 | B2 | |
| 1184 | 1174 | 8.4 | B2 | |
| 1198 | 1184 | 18.5 | A1 | |
| 1232 | ||||
| 1302 | ||||
| 1332 | 1321 | 5.6 | B2 | |
| 1356 | 1355 | 105.5 | A1 | |
| 1400 | 1393 | 16.1 | B2 | |
| 1448 | 1446 | 96.4 | B2 | |
| 1467 | 0.2 | A1 | ||
| 1541 | 0.6 | B2 | ||
| 1554 | 1564 | 1.8 | A1 | |
| 1630 | 1630 | 250.9 | A1 | |
Note: All frequencies in , intensities in . * – mode used to determine the scaling factor 0.974. Cf. Fig. S15. in the SI for the visualisation of modes.
| Mode | Exp. | Ref. | Calc. | |
|---|---|---|---|---|
| (Inten.) | Sym. | |||
| 630 | 63315, 63416, 65517 | |||
| 652 | 65815, 66016, 68517 | 646(85.8) | A”2 | |
| 994 | 99215, 99216 | 989(3.7) | E’1 | |
| 1486 | 147715, 147716 | 1480(42.9) | E’1 | |
Note: All frequencies in , intensities in . Scaling factor 0.974. is a combination band of the two lowest lying fundamental bands of \ceTr+. Cf. Fig. S16 – S18. in the SI for the visualisation of modes.
Saturation depletion measurements established that bands (b) – (d) in the experimental spectrum (Fig. 1), belong solely to \ceTr+, and that both \ceBz+ and \ceTr+ are active at the band (a). Bands (c) and (d) can be assigned to the doubly degenerate in plane CH bending mode and in plane CC stretching mode of \ceTr+, respectively. The third \ceTr+ band, the CH out-of-plane bending mode (not degenerate) should lay around (close to band (b), cf. Fig. S3). The performed saturation depletion measurements invalidate the hypothesis that both bands (a) and (b) are caused by distinct (T) and (P) isomers. We also excluded contribution from a triplet spin state, whose presence can lead to shifts in low energy modes for PAHs 25. In the case of \ceTr+, it was found distorted and above the ground state at the B3LYP/6-31G(d,p) level of theory (cf. Fig. S14 in the SI for its computed IR spectrum). The excited state can not survive many collisions with cold buffer gas and its spectrum does not contain features in the wavelength range of interest. The most likely scenario to account for bands (a) and (b), is that a combination band comes into close resonance with the fundamental CH out-of-plane bending mode, and borrows a significant part of its intensity. Our calculations show that the combination band involves the two lowest vibrational modes of \ceTr+ and that the combination band is red shifted relative to the fundamental band (Tab. 2 and Tab. S5 in the SI). In our experiment, we can assign band (b) as the fundamental mode (i. e. the strongest band) since the initial dissociation rate of this band is higher and its band width at saturation is larger as compared to band (a) (Fig. 2). Finally, our spectra do not include the CH stretch range. However, we learned while writing this manuscript that this range has recently been studied using a jet experiment and a table-top laser 26.
We recorded the mid-IR-PD spectra of \CsHs tagged with Ne at . The comparison of the experimental spectra with the harmonic calculated spectra show, that neither significant band shifts, nor band splitting are induced by the presence of the Ne tag, that can in particular induce a symmetry decrease in the case of \ceTr+. The \ceTr+ spectrum exhibits an interesting strong resonance at low frequency between a combination band and the fundamental CH out-of-plane bending mode. Anharmonic calculations would help in providing a detailed quantitative study of this resonance 27, 28.
We used saturation depletion measurements to confirm the existence of only two long-lived isomers of \CsHs, and the obtained spectra support their initial structural assumption as \ceBz+ and \ceTr+ 1, 9. The depletion technique in an ion trap has the advantage of being able to track the abundance of a well-defined isomer, contrary to the earlier reactivity method, which only has access to \ceBz+. This technique opens new perspectives for our understanding of the isomerisation paths of \CsHs.
Experimental Section
The ions are produced by electron bombardment in a storage type ion source 29 from benzyl chloride and toluene precursors. Ions of mass (\CsHs) are mass selected in a quadrupole mass filter prior to being injected into the cryogenic 22 pole rf ion trap (nominal temperature ), where they are cooled by a long 3:1 He:Ne gas pulse. The high number gas density achieved during this pulse () promotes ternary attachment of \ceNe to the bare ion producing and complexes. After the cooling and tagging sequence, the number density in the trap decreases quickly to a level where no further attachment takes place. The ion–Ne complex is then dissociated by infrared radiation provided by the FELIX FEL-2 free electron laser 30, operated in the range. The laser delivers up to in a single macropulse into the 22 pole trap with a repetition rate of and spectral bandwidth better than . After an irradiation time of typically the trap content is emptied through a mass filter onto a counting detector.
Acknowledgements
The research leading to this result is supported by the European Research Council under the European Union’s Seventh Framework Programme ERC-2013-SyG, Grant Agreement n. 610256 NANOCOSMOS. We acknowledge support from the project CALIPSOplus under the Grant Agreement 730872 from the EU Framework Programme for Research and Innovation HORIZON 2020. We greatly appreciate the experimental support provided by the FELIX team. We gratefully acknowledge the Nederlandse Organisatie voor Wetenschappelijk Onderzoek (NWO) for the support of the FELIX Laboratory. We thank the Cologne Laboratory Astrophysics group for providing the FELion ion trap instrument and the Cologne Center for Terahertz Spectroscopy (core facility, DFG grant SCHL 341/15-1) for supporting its operation. S.Ba. is supported by the H2020-MSCA-ITN-2016 Program (EUROPAH project, G. A. 722346). A. S. thanks the computing facility CALMIP for generous allocation of computer resources.
Keywords: benzylium; tropylium; structure elucidation; IR spectroscopy; cryogenic ion trap
References
- Dunbar [1975] R. C. Dunbar, Journal of the American Chemical Society 1975, 97, 1382–1384, DOI 10.1021/ja00839a016.
- Kuck [1990] D. Kuck, Mass Spectrometry Reviews 1990, 9, 583–630, DOI 10.1002/mas.1280090602.
- Lifshitz [1994] C. Lifshitz, Accounts of Chemical Research 1994, 27, 138–144, DOI 10.1021/ar00041a004.
- Rapacioli et al. [2015] M. Rapacioli, A. Simon, C. C. M. Marshall, J. Cuny, D. Kokkin, F. Spiegelman, C. Joblin, The Journal of Physical Chemistry A 2015, 119, 12845–12854, DOI 10.1021/acs.jpca.5b09494.
- Jusko et al. [2018] P. Jusko, A. Simon, G. Wenzel, S. Brünken, S. Schlemmer, C. Joblin, Chemical Physics Letters 2018, 698, 206 – 210, DOI 10.1016/j.cplett.2018.03.028.
- Jackson et al. [1977] J. A. A. Jackson, S. G. Lias, P. Ausloos, Journal of the American Chemical Society 1977, 99, 7515–7521, DOI 10.1021/ja00465a020.
- Fridgen et al. [2004] T. D. Fridgen, J. Troe, A. A. Viggiano, A. J. Midey, S. Williams, T. B. McMahon, The Journal of Physical Chemistry A 2004, 108, 5600–5609, DOI 10.1021/jp031328s.
- Morsa et al. [2014] D. Morsa, V. Gabelica, F. Rosu, J. Oomens, E. De Pauw, The Journal of Physical Chemistry Letters 2014, 5, 3787–3791, DOI 10.1021/jz501903b.
- Lifshitz et al. [1993] C. Lifshitz, Y. Gotkis, J. Laskin, A. Ioffe, S. Shaik, The Journal of Physical Chemistry 1993, 97, 12291–12295, DOI 10.1021/j100149a032.
- Choe [2008] J. C. Choe, The Journal of Physical Chemistry A 2008, 112, 6190–6197, DOI 10.1021/jp802641c.
- Shen et al. [1974] J. Shen, R. C. Dunbar, G. A. Olah, Journal of the American Chemical Society 1974, 96, 6227–6229, DOI 10.1021/ja00826a070.
- Nagy et al. [2011] A. Nagy, J. Fulara, I. Garkusha, J. P. Maier, Angewandte Chemie International Edition 2011, 50, 3022–3025, DOI 10.1002/anie.201008036.
- Dryza et al. [2012] V. Dryza, N. Chalyavi, J. A. Sanelli, E. J. Bieske, The Journal of Chemical Physics 2012, 137, 204304, DOI 10.1063/1.4767402.
- Féraud et al. [2014] G. Féraud, C. Dedonder-Lardeux, S. Soorkia, C. Jouvet, The Journal of Chemical Physics 2014, 140, 024302, DOI 10.1063/1.4858409.
- Fateley and Lippincott [1957] W. G. Fateley, E. R. Lippincott, The Journal of Chemical Physics 1957, 26, 1471–1481, DOI 10.1063/1.1743566.
- Sourisseau [1978] C. Sourisseau, Spectrochimica Acta Part A: Molecular Spectroscopy 1978, 34, 881 – 887, DOI 10.1016/0584-8539(78)80007-5.
- Howard and Graham [1985] J. Howard, D. Graham, Spectrochimica Acta Part A: Molecular Spectroscopy 1985, 41, 815 – 824, DOI 10.1016/0584-8539(85)80027-1.
- Oomens et al. [2006] J. Oomens, B. G. Sartakov, G. Meijer, G. von Helden, International Journal of Mass Spectrometry 2006, 254, 1–19, DOI 10.1016/j.ijms.2006.05.009.
- Chiavarino et al. [2012] B. Chiavarino, M. E. Crestoni, O. Dopfer, P. Maître, S. Fornarini, Angewandte Chemie International Edition 2012, 51, 4947–4949, DOI 10.1002/anie.201200558.
- Chiavarino et al. [2006] B. Chiavarino, M. E. Crestoni, S. Fornarini, O. Dopfer, J. Lemaire, P. Maître, The Journal of Physical Chemistry A 2006, 110, 9352–9360, DOI 10.1021/jp0628380.
- Schröder et al. [2006] D. Schröder, H. Schwarz, P. Milko, J. Roithová, The Journal of Physical Chemistry A 2006, 110, 8346–8353, DOI 10.1021/jp056962f.
- Zins et al. [2010] E.-L. Zins, C. Pepe, D. Schröder, Faraday Discuss. 2010, 145, 157–169, DOI 10.1039/B907236E.
- Asvany et al. [2010] O. Asvany, F. Bielau, D. Moratschke, J. Krause, S. Schlemmer, Review of Scientific Instruments 2010, 81, 076102, DOI 10.1063/1.3460265.
- [24] M. J. Frisch, G. W. Trucks, H. B. Schlegel, G. E. Scuseria, M. A. Robb, J. R. Cheeseman, G. Scalmani, V. Barone, B. Mennucci, G. A. Petersson, H. Nakatsuji, M. Caricato, X. Li, H. P. Hratchian, A. F. Izmaylov, J. Bloino, G. Zheng, J. L. Sonnenberg, M. Hada, M. Ehara, K. Toyota, R. Fukuda, J. Hasegawa, M. Ishida, T. Nakajima, Y. Honda, O. Kitao, H. Nakai, T. Vreven, J. A. Montgomery, Jr., J. E. Peralta, F. Ogliaro, M. Bearpark, J. J. Heyd, E. Brothers, K. N. Kudin, V. N. Staroverov, R. Kobayashi, J. Normand, K. Raghavachari, A. Rendell, J. C. Burant, S. S. Iyengar, J. Tomasi, M. Cossi, N. Rega, J. M. Millam, M. Klene, J. E. Knox, J. B. Cross, V. Bakken, C. Adamo, J. Jaramillo, R. Gomperts, R. E. Stratmann, O. Yazyev, A. J. Austin, R. Cammi, C. Pomelli, J. W. Ochterski, R. L. Martin, K. Morokuma, V. G. Zakrzewski, G. A. Voth, P. Salvador, J. J. Dannenberg, S. Dapprich, A. D. Daniels, Ö. Farkas, J. B. Foresman, J. V. Ortiz, J. Cioslowski, D. J. Fox, Gaussian 09, Revision D.01, Gaussian Inc., Wallingford CT, 2016.
- Falvo et al. [2012] C. Falvo, F. Calvo, P. Parneix, The Journal of Chemical Physics 2012, 137, 064303, DOI 10.1063/1.4739468.
- Wagner et al. [2018] J. P. Wagner, D. C. McDonald, M. A. Duncan, The Journal of Physical Chemistry Letters 2018, 9, 4591–4595, DOI 10.1021/acs.jpclett.8b02121.
- Mackie et al. [2015] C. J. Mackie, A. Candian, X. Huang, E. Maltseva, A. Petrignani, J. Oomens, W. J. Buma, T. J. Lee, A. G. G. M. Tielens, The Journal of Chemical Physics 2015, 143, 224314, DOI 10.1063/1.4936779.
- Mulas et al. [2018] G. Mulas, C. Falvo, P. Cassam-Chenaï, C. Joblin, accepted in J. Chem. Phys. 2018, DOI http://arxiv.org/abs/1809.05669.
- Gerlich [1992] D. Gerlich in Adv. Chem. Phys.: State-Selected and State-to-State Ion-Molecule Reaction Dynamics, Vol. LXXXII (Eds.: C.-Y. Ng, M. Baer), Wiley, New York, 1992, pp. 1–176, DOI 10.1002/9780470141397.ch1.
- Oepts et al. [1995] D. Oepts, A. F. G. van der Meer, P. W. van Amersfoort, Infrared Physics and Technology 1995, 36, 297–308, DOI 10.1016/1350-4495(94)00074-U.
Entry for the Table of Contents
![[Uncaptioned image]](/html/1809.09375/assets/x3.png)
isomers: by using infrared pre-dissociation spectroscopy and saturation depletion measurements of complexes, we demonstrate that benzylium and tropylium cations are the only two long-lived isomers of gas-phase \CsHs.
See pages - of si.pdf