A Gaia DR2 view of white dwarfs in the Hyades
Abstract
We have exploited the very precise parallaxes, proper motions and photometry of Gaia Data Release 2 to study white dwarf members of the Hyades star cluster. Gaia photometry and parallaxes for the eight DA white dwarfs confirmed members have been then used to compute absolute magnitudes and colours. These were compared to three independent sets of white dwarf evolutionary tracks, to derive cooling times and white dwarf (final) masses. All sets of models provide the same mass values, with only small differences in the cooling ages. The precision in the derived masses and cooling ages is typically 1-3%. Our derived masses are generally consistent with spectroscopic estimates from the literature, whilst cooling ages are generally larger. The recent estimate of the cluster age from the Gaia Data Release 2 main sequence turn off colour-magnitude-diagram (790 Myr) has been employed to derive progenitor (initial) masses. We find a slope of the initial-final mass relation for the Hyades white dwarfs (masses between 0.67 and ) steeper than that derived for the same mass range from global estimates –averaged over the whole spectrum of white dwarf masses– irrespectively of the cooling models adopted. However, when considering the error in this age estimate ( Myr), a definitive conclusion on this issue cannot be reached yet. The lower limit of 690 Myr (closer to the classical Hyades age of 600-650 Myr) would provide a slope of the initial-final mass relation closer to the global determinations. We also find hints of an intrinsic spread of the cluster initial-final mass relation for the cluster.
keywords:
open clusters and associations: individual (Hyades) – stars:evolution – stars: mass loss – white dwarfs1 Introduction
The recent Gaia Data Release 2 (DR2) has delivered high-precision astrometry and three-band photometry () of about 1.3 billion sources over the whole sky, with unprecedented accuracy and homogeneity, of both astrometry and photometry (Gaia Collaboration et al., 2018a). Indeed, Gaia colour-magnitude-diagrams (CMDs) of the closest open clusters (Gaia Collaboration et al., 2018b) display exquisitely defined sequences in the CMD. The distance modulus corrected CMD of the classical Hyades cluster, for example, has typical errors (including the parallax error contribution) of a few mmag in all three Gaia filters, also along the white dwarf (WD) sequence. Moreover, the distances and proper motions provided by DR2 allow accurate cluster membership analyses.
Here we focus on the WD sequence hosted by this cluster. Taking advantage of the high precision of DR2 parallaxes and photometry, WD masses and cooling times can be determined very precisely employing theoretical cooling models. Their initial-final mass relation (IFMR) can then be established from the knowledge of the cluster age.
The IFMR for low- and intermediate-mass stars is an essential input for a range of astrophysical problems. Given an initial stellar mass on the main sequence (MS), the IFMR provides the expected final WD mass, hence the total amount of mass lost during the star evolution. Not only the location and shape of cooling sequences and the shape of WD luminosity functions – employed to age date stellar populations– are affected by the IFMR, but also the chemical evolution histories of stellar populations, as well as their mass-to-light ratios (the ratio of the mass of evolving stars plus stellar remnants to the integrated luminosity of the population) and the modelling of stellar feedback in galaxy formation simulations (e.g. Agertz & Kravtsov, 2015). Type Ia supernova rate estimates are affected by the choice of the IFMR (e.g. Greggio, 2010) as well.
Theoretical determinations of the IFMR based on stellar evolution calculations that follow the evolution of stellar models from the pre-MS to the WD phase are still affected by sizable uncertainties. This is due to the poorly modelled efficiency of mass-loss for low- and intermediate-mass stars, and uncertainties in the predicted mass of CO cores during the asymptotic giant branch (AGB) evolution, resulting from outstanding uncertainties in the treatment of the thermal pulse phase, the associated third dredge-up, hot bottom burning and also the treatment of rotation (see, e.g. Iben & Renzini, 1983; Dominguez et al., 1996; Karakas & Lattanzio, 2014). Semi-empirical methods have been therefore devised to establish the IFMR independently of theoretical modelling of the AGB phase (see, e.g., Weidemann, 2000; Ferrario et al., 2005; Kalirai et al., 2009; Salaris et al., 2009; Williams et al., 2009; Cummings et al., 2015, for recent examples).
The ‘classical’ semi empirical technique to estimate the IFMR is based on WDs in star clusters, and works as follows. Spectroscopic analyses provide the WD surface gravity and , and for a given pair, grids of theoretical WD models provide the mass and cooling age of the WD. Theoretical isochrone fits to the MS turn-off luminosity in the cluster CMD provide the cluster age . Finally, the difference is equal to the lifetime of the WD progenitor from the MS until the start of the WD cooling. Making use of mass-lifetime relationships from theoretical stellar evolution models, the initial progenitor mass is immediately obtained from (the uncertain AGB and post-AGB lifetimes can be neglected, because they are negligible compared to the duration of the previous evolutionary phases).
Very recently, the Gaia DR2 CMD of 6400 bright WDs within a distance of 100 pc has been employed by El-Badry et al. (2018) to place strong constraints on the IFMR, especially for . These authors assumed an age distribution for the WDs, assessed the completeness of their sample, and determined the WD masses from fits of cooling tracks to the observed CMD position of each individual objects. Their derived IFMR is broadly consistent with current star cluster studies.
Here we focus on the Gaia DR2 CMD of the Hyades WDs. Previous analyses, in particular Cummings et al. (2015), have shown that studies of clusters in the age range of the Hyades provide an IFMR for between and , that displays a slope much steeper than what obtained fitting an average relationship over a much broader mass range. Also, there are hints of maybe an intrinsic dispersion of the IFMR in this range (e.g. Salaris et al., 2009). These are clearly important issues, that we are going to revisit taking advantage of the new Gaia data. DR2 provide very accurate photometry and parallaxes (fractional errors in the order of ) for the Hyades WDs, allowing us to determine the IFMR by deriving and from fits of theoretical cooling sequences to the WD Gaia CMD (as done by El-Badry et al., 2018, for field WDs).
Moreover, Gaia DR2 data will allow us to determine whether the sample of new Hyades WD candidates discussed in Tremblay et al. (2012) contains truly Hyades stars.
The plan of the paper is as follows. Section 2 describes the Hyades WD sample and the membership of Tremblay et al. (2012) candidates, whilst section 3 describes our derivation of the IFMR and associated errors. Section 4 compares our inferred IFMR with previous determinations, and conclusions follow in Sect. 5.
2 Data
The 518 members for the Hyades cluster adopted for this work, are those defined and released by Gaia Collaboration et al. (2018a, Table A.1).
For such a close-by cluster the projection effects of the cluster mean radial velocity on individual members can be as large as 41 mas/yr, due to the large spread over the sky (over 30 degrees) and in parallax space. The projection of the tangential motion is also sizable for the Hyades, amounting to about 5 mas/yr. There is also a scaling effect, do to the non-negligible difference in distance of the members (the cluster radius of 15 pc is comparable to its distance, 50 pc).
The method applied to determine the cluster membership is detailed in Gaia Collaboration et al. (2017), specifically for the Hyades cluster. In essence, in the ‘combined astrometric solution’ the observed parallaxes and proper motions are compared with predicted ones, calculated with the current assumed parallax and space motion of the cluster centre, and with position of the star relative to the projected cluster centre. The improved knowledge of the consistency of the motions of stars within the searching volume allows to better define the sample of members, and in turn, to improve the motion and parallax of the cluster centre, iteratively.
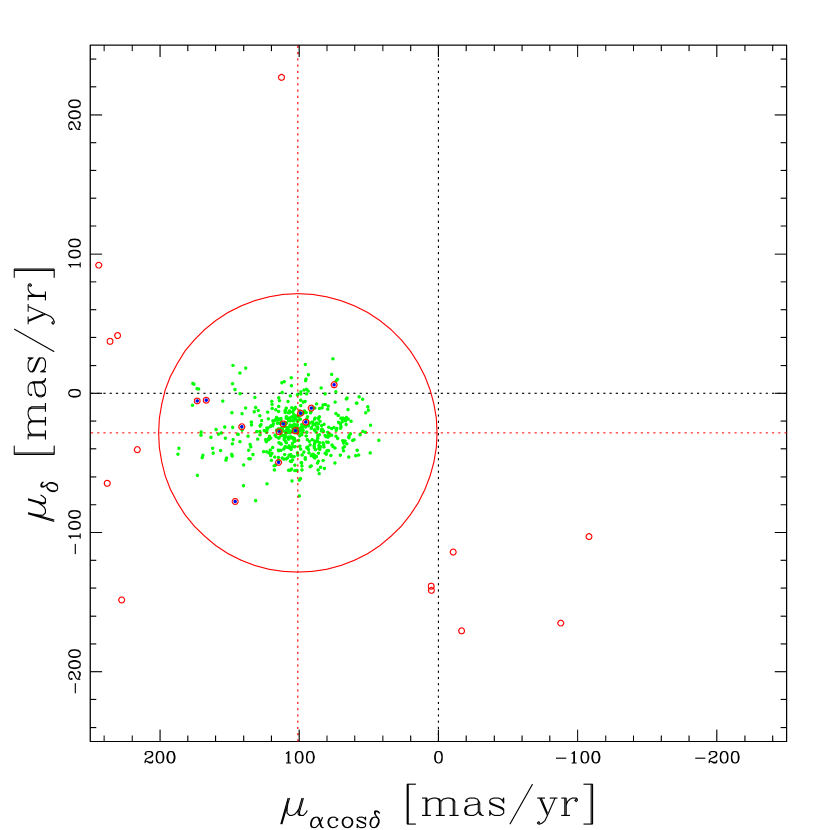
Figure 1 displays the proper-motion diagram for the Hyades members as defined by Gaia Collaboration et al. (2018b). In this diagram, we also show the Gaia DR2 proper motions for the 25 WD cluster member candidates defined in Table 2 of Tremblay et al. (2012); only 9 out of these 25 objects are defined as members by the Gaia team. Given the large motion of the cluster, and the fact that proper motions are better constrained than parallaxes, we relax the membership selections of Gaia Collaboration et al. (2018b) and arbitrarily use only proper motions as membership criterion for the 25 objects in Tremblay et al. (2012) Table 2. We set the proper motion threshold for membership as large as the largest motions in the Gaia member sample, approximated to the next round number. We generously set this limit to 100 mas yr-1 (red circle). Even with such a relaxed limit, based solely on proper motions, 13 objects are clearly excluded as members. Of the 12 WD member candidates that survive this mild proper motion selection, 9 were already in the Gaia selection, and only 3 are potential additional WDs candidates. Seven of the 9 WDs surviving the Gaia selection –also included in Tremblay et al. (2012) paper– are ‘classical’ Hyades WDs as defined by Tremblay et al. (2012) and previously used in IFMR determinations (see, e.g., Ferrario et al., 2005; Salaris et al., 2009). Two other objects (HG 7-85, and GD 52) belong to the ‘new candidates’ listed by Tremblay et al. (2012).
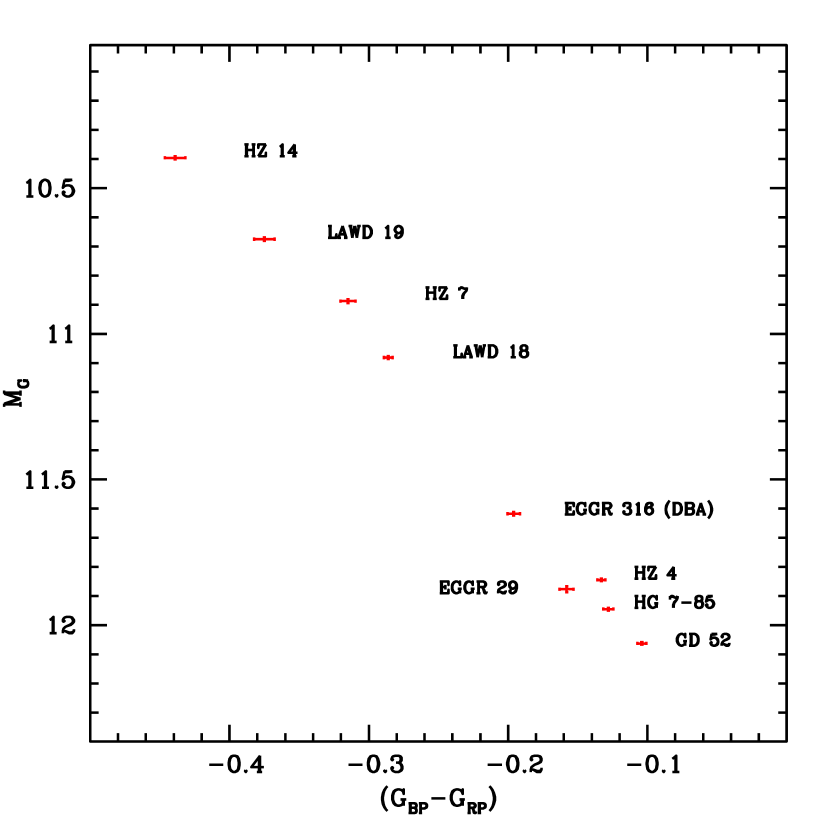
The Gaia CMD of these nine WDs is shown in Fig. 2. They are all DA objects as reported by the Montreal White Dwarf Database (Dufour et al., 2017), but for EGGR 316, that is a DBA WD with mixed H/He atmosphere (Bergeron et al., 2011). Due to the lack of extended grids of cooling models and bolometric corrections for DBA objects, we have not included this WD in our analysis. Individual parallaxes111We did not apply a correction for the 0.03 mas offset of DR2 parallaxes (Arenou et al., 2018), for its effect on the distance of the Hyades’ stars is absolutely negligible., their fractional errors, absolute magnitudes in the Gaia G filter, as well as the colours and associated errors (taking into account also the errors on the parallax) are reported in Table 1. The accuracy of photometry and parallax measurements provide absolute magnitudes and colour uncertainties well below 0.01 mag.
| Name | Identifier: Gaia DR2 | |||||||
|---|---|---|---|---|---|---|---|---|
| (1) | (2) | (3) | (4) | (5) | (6) | (7) | (8) | (9) |
| HZ 14 | 3294248609046258048 | 20.25 | 0.0025 | 10.400.005 | 0.4390.007 | 7.4300.010 | 7.3700.010 | 0.710.02 |
| LAWD 19 | 3313714023603261568 | 20.89 | 0.0027 | 10.680.006 | 0.3750.007 | 7.7300.010 | 7.7100.010 | 0.690.02 |
| HZ 7 | 3306722607119077120 | 21.14 | 0.0029 | 10.890.006 | 0.3150.005 | 7.9400.010 | 7.9400.010 | 0.670.02 |
| LAWD 18 | 3313606340183243136 | 22.23 | 0.0023 | 11.080.005 | 0.2860.003 | 8.0830.007 | 8.0830.007 | 0.690.01 |
| HZ 4 | 3302846072717868416 | 28.59 | 0.0019 | 11.840.004 | 0.1330.003 | 8.5430.006 | 8.5730.006 | 0.790.01 |
| EGGR 29 | 45980377978968064 | 19.94 | 0.0047 | 11.880.010 | 0.1580.005 | 8.5450.007 | 8.5750.007 | 0.830.01 |
| HG 7-85 | 3306722607119077120 | 24.05 | 0.0022 | 11.940.005 | 0.1280.004 | 8.5950.007 | 8.6250.007 | 0.820.01 |
| GD 52 | 218783542413339648 | 23.56 | 0.0019 | 12.060.004 | 0.1040.003 | 8.6700.007 | 8.7000.007 | 0.840.01 |
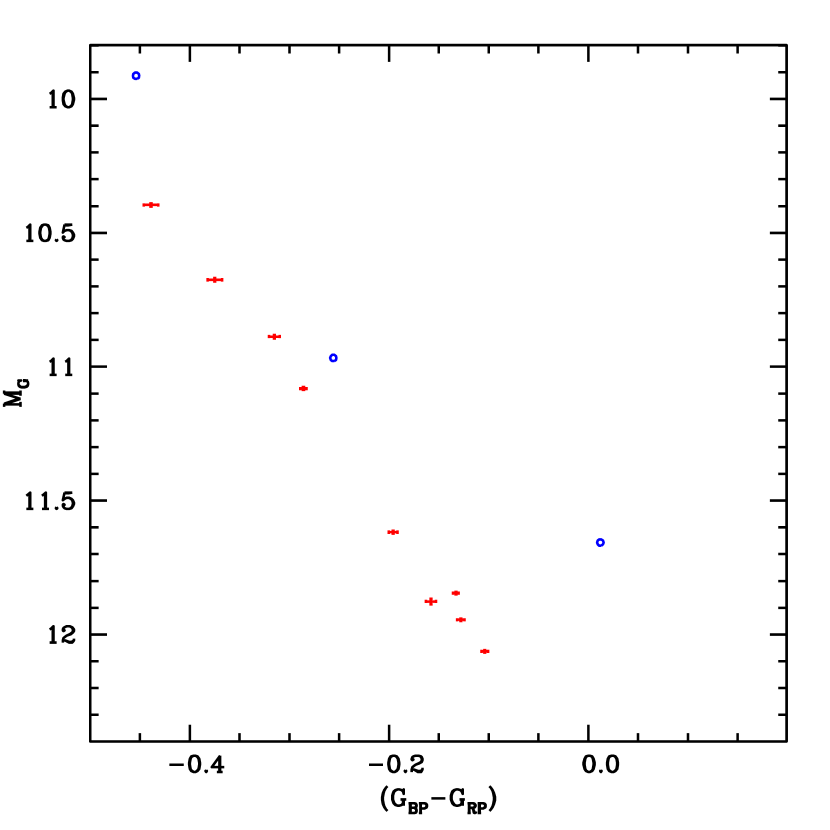
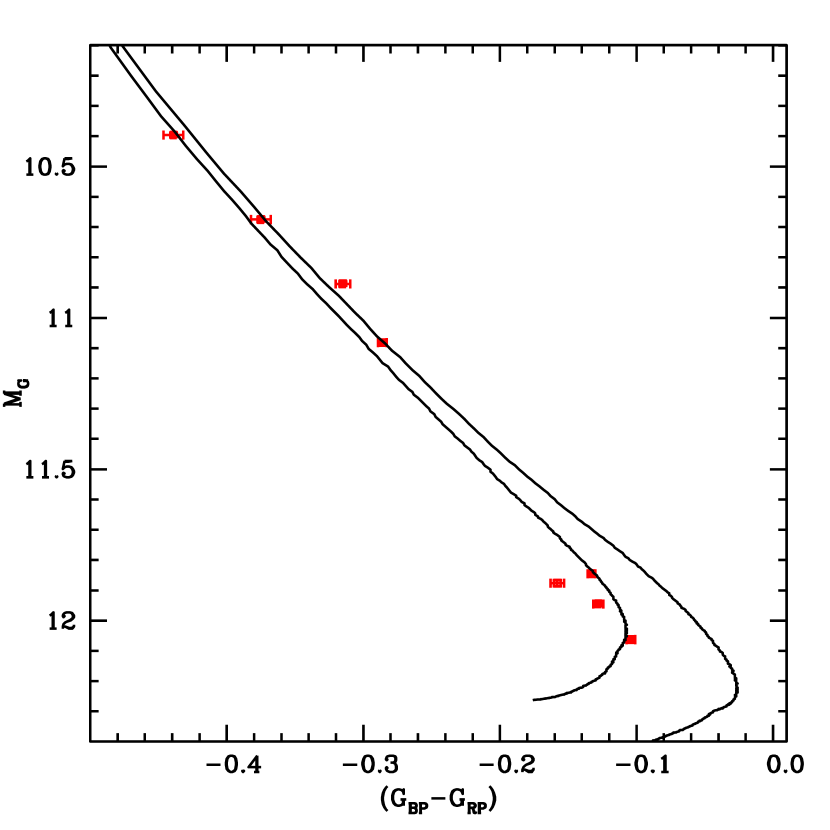
The remaining three WDs that survive our proper motion selection (GD 38, GD 43 and LP 475-249, all DA according to Dufour et al., 2017, database) have suspiciously low parallaxes, of the order of 7-10 mas, compared to 20-30 mas for the nine WDs of Fig. 2. Figure 3 shows the Gaia CMD of these three objects, together with the other WDs. They seem to occupy a redder sequence compared to the nine confirmed member WDs. Notice that Tremblay et al. (2012) at the end of their analysis considered these objects ‘non-members’.
The quality indicators available in Gaia DR2222https://gea.esac.esa.int/archive/documentation/GDR2/ have been inspected for these three WDs and the objects in Table 1. More specifically, we have considered: visibility_periods_used, astrometric_matched_observations, astrometric_gof_al, astrometric_excess_noise, astrometric_n_good_obs_al, astrometric_n_bad_obs_al. None of these quality indicators turned out to be significantly worse than for the 8 WDs in Table 1, suggesting that the smaller parallaxes for these three objects are equally reliable.
The parallax errors for the WDs in Table 1 span the range 0.052-0.062 mas (with the exception of EGGR 29, with a parallax error of 0.092 mas), whilst for these three objects the errors are typically larger, spanning the range 0.075-0.115 mas.
Concerning the photometry, the fluxes appear to have marginally larger errors, particularly in GRP, but there is no evidence of differences in the phot_bp_rp_excess_factor parameter, that remains within the values observed for the other WDs. Finally, we note that all the WDs in Table 1 and these three objects passed the tests for well-measured objects defined in Eqs. (C.1) and (C.2) of Lindegren et al. (2018).
One could then suspect that these three WDs might suffer from systematic errors in their parallax (and radial velocities) due for example to the presence of close binary companions. Future Gaia data releases will very likely clarify the situation regarding these objects. We will not include them in the analysis that follows.
3 Analysis
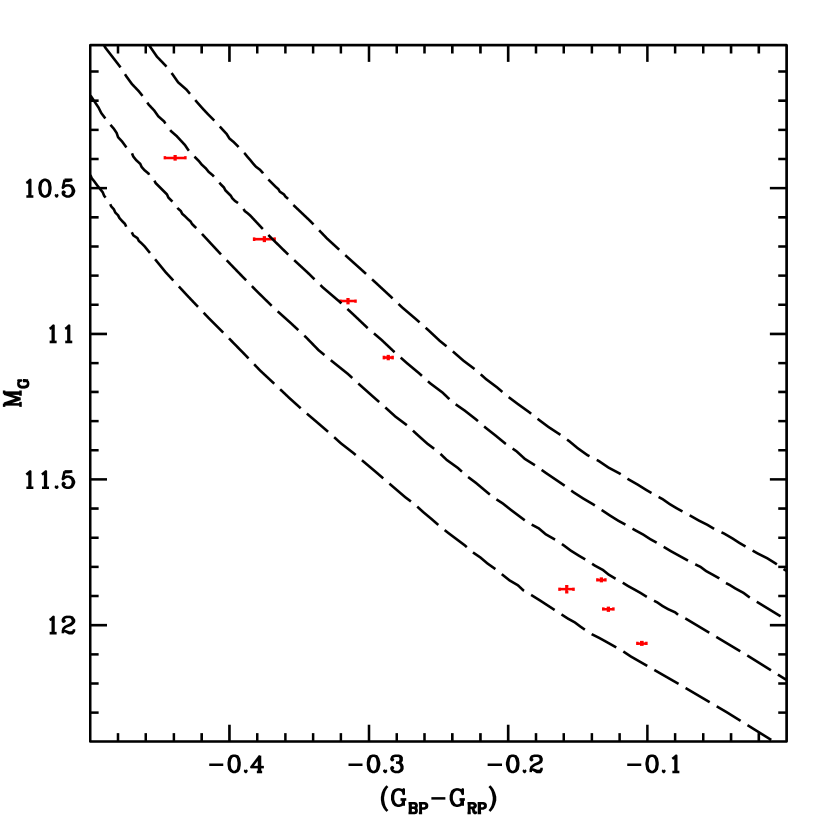
Figure 4 displays the CMD of our final sample of eight DA WDs together with our reference DA cooling tracks for masses equal to 0.61, 0.68, 0.77 and 0.87 , from Salaris et al. (2010). The cooling tracks are calculated for CO cores (see Salaris et al., 2010, for details about the CO stratification) and thick H layers (, on top of a He layer). Bolometric corrections to the Gaia DR2 system have been kindly provided by P. Bergeron (private communication, see Holberg & Bergeron, 2006; Tremblay et al., 2011).
Interpolation amongst the cooling tracks to match and of each individual WD (we assumed zero reddening for the cluster, see e.g. Taylor, 2006) provides straightforwardly mass and cooling age, also reported in Table 1. To estimate the associated errors, we have generated for each object one thousand synthetic and pairs, with Gaussian distributions (assumed to be independent) centred around the measured values, and 1 widths equal to the errors on these quantities reported in Table 1. Mass and cooling times for each synthetic sample were then determined from the WD tracks, and the 68% confidence limits calculated.
These formal errors –determined by the error bars on absolute magnitudes and colours– are small (smaller than in previous error estimates, see e.g., Tremblay et al., 2012), and equal to 0.01-0.02 in the derived masses, and 0.01 or less in log(). We notice that all WDs in this sample have evolved beyond the luminosity range where neutrino energy losses dominate (log above dex), but have not yet started crystallization, and none of them has a cooling age very close to the cluster age (see below).
Although formal errors are small, systematics due to uncertainties in WD modelling might add non-negligible systematic components. To estimate these effects, we have considered the independent DA WD calculations by Fontaine et al. (2001) and Renedo et al. (2010), that employ some different physics inputs compared to Salaris et al. (2010). We applied to these cooling tracks the same bolometric corrections as for our reference WD models. The models by Fontaine et al. (2001) that we employed are for CO cores (although with a different stratification compared to Salaris et al., 2010) and the same envelope composition and thickness of Salaris et al. (2010). We obtain for our sample indistinguishable values of both cooling ages and masses, compared to that reported in Table 1.
The calculations by Renedo et al. (2010) are fully evolutionary, in the sense that the WD tracks come from the complete evolution of a MS progenitor (hence with assumptions about the mass loss along the AGB phase) with a given initial metallicity. We used the models for initial metal mass fraction about half Solar, the highest value available in Renedo et al. (2010) calculations, but lower than the Hyades spectroscopic measurement of [Fe/H]0.10-0.15 (see e.g. Taylor & Joner, 2005; Dutra-Ferreira et al., 2016). We have however verified by comparing the half Solar cooling tracks with the ones at lower metallicity (a factor of ten lower) from the same Renedo et al. (2010) paper, that the cooling times and CMD location in the magnitude range relevant to our analysis, are practically identical. This suggests that, at least for the magnitude range of the Hyades WDs, the initial metallicity of these WD model progenitors does not affect the main properties of the cooling tracks. The Renedo et al. (2010) WD models have a CO stratification different from Salaris et al. (2010) and Fontaine et al. (2001), and also a mass thickness of of the H and He layers that varies with WD mass333In addition, the H and He profiles are not step function like in Salaris et al. (2010) and Fontaine et al. (2001) but have been shaped by atomic diffusion during the early WD phases. Values (decreasing with increasing WD mass in the range between 0.53 and 0.88 ) go from to for the H layers, and from to for the He layers, and are overall not too different from Salaris et al. (2010) and Fontaine et al. (2001) models.
| Name | ||||||
|---|---|---|---|---|---|---|
| HZ 14 | 2.53 | 0.16 | 0.12 | 2.52 | 0.16 | 0.12 |
| LAWD 19 | 2.55 | 0.16 | 0.12 | 2.55 | 0.16 | 0.12 |
| HZ 7 | 2.60 | 0.18 | 0.14 | 2.60 | 0.18 | 0.14 |
| LAWD 18 | 2.64 | 0.19 | 0.15 | 2.64 | 0.19 | 0.15 |
| HZ 4 | 3.05 | 0.34 | 0.29 | 3.11 | 0.36 | 0.31 |
| EGGR 29 | 3.05 | 0.34 | 0.29 | 3.11 | 0.36 | 0.31 |
| HG 7-85 | 3.16 | 0.39 | 0.34 | 3.25 | 0.42 | 0.38 |
| GD 52 | 3.41 | 0.50 | 0.47 | 3.55 | 0.57 | 0.56 |

With this additional grid of WD models we have redetermined the Hyades WD masses and cooling ages. Masses are unchanged compared to the results with Salaris et al. (2010) and Fontaine et al. (2001) models, whereas cooling ages are slightly different, i.e. longer at higher WD masses, and unchanged or slightly shorter at the lower masses. This second set of cooling ages is also reported in Table 1. Finally, we made use of the analysis by Salaris et al. (2009) to assess the effect of decreasing the mass thickness of the hydrogen layers of the models by two orders of magnitude, below the standard ‘thick’ layers value of . For the magnitude and colour range of our sample of Hyades WDs the effect on the derived masses and cooling times is smaller than the errors reported in Table 1.
Figure 5 compares our determination of WD masses and cooling times (we display only the result obtained with our reference models, the comparison is very similar when considering the cooling times obtained with Renedo et al., 2010, models) with the corresponding values listed by Tremblay et al. (2012). The values in Tremblay et al. (2012) are taken from the literature, whilst cooling times come from fits of the Fontaine et al. (2001) DA models to literature values of pairs for each object. The WD masses are pretty much in agreement within the errors – apart from HG 7-85, whose mass is equal 0.76 in Tremblay et al. (2012), whereas we find 0.82– and log( values are typically larger than Tremblay et al. (2012).
Having determined precise WD masses and cooling ages from the CMD, we need a cluster age from the MS turn off. Gaia Collaboration et al. (2018b) provide an age estimated from Gaia DR2 MS photometry and Bressan et al. (2012) isochrones for [Fe/H]=0.13, transformed to the Gaia DR2 photometric system. This is equal to log()=8.90 ( in years). Using this value (and error bar), we have determined for our WD sample considering the two sets of values reported in Table 1, and –consistently with the cluster age estimate– the initial mass-lifetime values from Bressan et al. (2012) evolutionary tracks.
The two sets of values we have obtained are shown in Table 2. The error on is largely dominated by the error bar on the cluster age, hence it is essentially a systematic error on the WD final mass, because increasing or decreasing the cluster age according to its error bar does systematically decrease or increase, respectively, the values of for all WDs of any .

4 Comparisons with previous results
Figure 6 shows the IFMRs from the data in Table 1 and 2. Errors in range between 0.15 and 0.6 , increasing with increasing 444 The essentially constant error on the progenitor ages –dominated by the error on the cluster age– causes a larger error on the initial mass for larger values, because of increasingly shorter lifetimes with increasing initial mass.. The effect on that arises from the variation of cooling times caused by different WD models is much smaller than the error bar due to the error on the cluster age.
The first interesting consideration is the hint of a small spread in at fixed , at least for the pair HZ 4 and EGGR 29. Their mass difference is much larger than the associated errors, whilst their is virtually the same.
Regarding the slope of the IFMR, Fig. 6 displays Ferrario et al. (2005) – both linear and polynomial IFMRs– Salaris et al. (2009)555We display their linear fit to the global IFMR. Their two-slope fit gives a very similar IFMR in the displayed mass range and El-Badry et al. (2018) global determinations of the IFMR, plus the Cummings et al. (2015) IFMR determined (from Praesepe, Hyades and NGC 2099) for the range between 2.5 and .
If at first we neglect the error bars on values, the slopes from the global determinations of the IFMR are clearly shallower than our Hyades one, confirming the results by Cummings et al. (2015). To give an idea of the differences, Ferrario et al. (2005) and Salaris et al. (2009) linear IFMRs both give slopes , to be compared to our slope (considering cooling times from our reference WD models).
The slope derived by Cummings et al. (2015) (apart from a vertical zero-point shift of their IFMR) is closer to our results, for they obtain . The polynomial IFMR by Ferrario et al. (2005) is steeper than the linear one in this mass range, but still shallower than Cummings et al. (2015). These conclusions hold in case of using both sets of WD cooling times in Table 1.
It is however important to consider the role of the uncertainty in the cluster age. The error bar on is essentially systematic, and determined by the large error on Gaia Collaboration et al. (2018b) Hyades age ( yr). Given that a fixed variation of causes larger changes of the initial mass with increasing , the slope of the IFMR will depend on the exact value of . If we consider the lower limit of Gaia Collaboration et al. (2018b) – hence all values at the upper limit of their individual error bars– the slope of the Hyades IFMR gets shallower, equal to , hence closer to the slope of the global estimates and marginally lower than Cummings et al. (2015) result. This lower age limit is actually more consistent with the classical Hyades age of 600-650 Myr (e.g. Perryman et al., 1998).
Figure 7 shows the impact of the IFMR on the WD isochrones for the Hyades. We have displayed isochrones for 800 Myr (the age derived from the Gaia DR2 data) and 600 Myr (the more classical Hyades age) respectively, computed using the Salaris et al. (2009) IFMR –as representative of the global relationships determined considering the full range of WD progenitor masses– the WD tracks by Salaris et al. (2010), and Bressan et al. (2012) progenitor lifetimes. For a cluster age of 800 Myr, the isochrone is clearly offset from the data at the fainter magnitudes. This is consistent with Fig. 6, whereby the Salaris et al. (2009) IFMR predicts WD masses roughly consistent with the Hyades ones for the lower mass (brighter) WDs, but predicts too low final masses for the more massive (fainter) cluster WDs. An age of 600 Myr gives indeed a better fit to the observed sequence because, as discussed above, for such an age we would derive a cluster IFMR in much better agreement with the global estimates.
Clearly, a reduction of the error on the Hyades age determined from the Gaia CMD is required, to reduce the uncertainty on the slope of the cluster IFMR. We just recall here that other recent estimates of the Hyades age –not based on DR2 data– have provided 65070 Myr from the lithium depletion boundary technique applied to cluster brown dwarfs (Martín et al., 2018), 750100 Myr from a Bayesian fit of rotating stellar models to the CMD of the cluster (Brandt & Huang, 2015), and 700100 Myr from non-rotating isochrone fitting to an optical CMD using the mean distance modulus from Gaia Data Release 1 (Hidalgo et al., 2018).
We close this section noticing that at the time of the submission of our work, Si et al. (2018) preprint has appeared. These authors have applied a sophisticated Bayesian technique to fit the whole CMD (their data are not from Gaia DR2) of a sample of clusters –including the Hyades– with theoretical isochrones and WD evolutionary tracks, to determine distances, ages, [Fe/H], WD masses, cooling ages and the IFMR. They also combined multiple star clusters into a hierarchical model to redetermine the IFMR, correcting the cluster-specific analysis by borrowing strength from other clusters. For the Hyades (in this case these authors employ distances from Hipparcos), cluster-specific and hierarchical estimates provide similar (within the associated error bars) IFMRs. Their Hyades WD sample comprises 6 DA objects, all included in our analysis (HZ 14, LAWD 19, HZ 7, LAWD 18, HZ 4, EGGR 29). Their estimates are systematically lower than ours, differences ranging from 0.02 to 0.08 , while initial masses are instead larger, by amounts between 0.2 and 0.7 . The best-fit age derived for the cluster is equal to 600 Myr, and this should explain at least qualitatively their larger values of compared to our analysis. The resulting slopes for the cluster IFMR are equal to 0.200.05 (cluster-specific) and 0.140.06 (hierarchical).
Application of their technique to Gaia DR2 data would be welcome, to investigate whether a more precise cluster age can be determined, its consistency with the determination by Gaia Collaboration et al. (2018b), and also to test the consistency with our WD masses and cooling times.
5 Conclusions
We employed the Gaia DR2 sample of bona-fide Hyades member stars, and selected among those WD stars. Seven out of a total of nine Gaia DR2 WD members are classical Hyades WDs, and two additional ones are listed by Tremblay et al. (2012) as new candidate members. Eight objects are of DA spectral type, for which we determined masses and cooling times.
Three more Hyades candidates in Tremblay et al. (2012) list do survive the proper motion membership analysis, but have systematically lower parallaxes compared to the other nine objects. We suspect that they might suffer from some undisclosed systematic error, such as the presence of binary companions that may affect their estimated parallaxes (and in turn their absolute magnitudes). We have discarded these three objects in our analysis, however, they might deserve follow-up investigations.
The accuracy of the Gaia parallaxes (errors of the order of 0.1%) and photometry (errors of the order order of mmag) allow to determine precise masses (errors of 1-3%) and cooling times (errors of 1-2%) for these 8 DA WDs, considering also the effect of varying the set of cooling models and the thickness of the atmospheric layers on the associated error bars. An IFMR for the Hyades WDs has been then determined by assuming the cluster MS turn off age (800 Myr) recently determined also from the Gaia DR2 cluster CMD (Gaia Collaboration et al., 2018b). Assuming this turn off age, we find that in the range between 2.5 and , the cluster IFMR is steeper than average global IFMRs independently estimated considering the full range of WD masses and progenitors. The error on this Gaia DR2 age estimate ( Myr, that translates into a systematic error on the IFMR) is however large enough to induce a non-negligible variation of the derived IFMR slope. A lower limit of 690 Myr for the cluster age (closer to the classical Hyades age of 600-650 Myr) would provide a slope in much closer agreement to global determinations. Recent independent determinations of the cluster age do not help narrowing down the turn off age estimate, that remains the dominant source of uncertainty in the determination of the cluster IFMR.
Acknowledgments
We warmly thank Antonella Vallenari and Diego Bossini for useful information concerning Gaia and the Gaia DR2 catalog of Hyades released in their Gaia Collaboration et al. (2018b) paper. We are deeply indebted to Pierre Bergeron who kindly provided us with bolometric corrections to the Gaia DR2 system for the WD cooling tracks. We are grateful to our referee, Nigel Hambly, for his careful reading and comments, that contributed to improve our manuscript. This work presents results from the European Space Agency (ESA) space mission Gaia. Gaia data are being processed by the Gaia Data Processing and Analysis Consortium (DPAC). Funding for the DPAC is provided by national institutions, in particular the institutions participating in the Gaia MultiLateral Agreement (MLA). The Gaia mission website is https://www.cosmos.esa.int/gaia. The Gaia archive website is https://archives.esac.esa.int/gaia.
References
- Agertz & Kravtsov (2015) Agertz O., Kravtsov A. V., 2015, ApJ, 804, 18
- Arenou et al. (2018) Arenou F., et al., 2018, preprint, (arXiv:1804.09375)
- Bergeron et al. (2011) Bergeron P., et al., 2011, ApJ, 737, 28
- Brandt & Huang (2015) Brandt T. D., Huang C. X., 2015, ApJ, 807, 58
- Bressan et al. (2012) Bressan A., Marigo P., Girardi L., Salasnich B., Dal Cero C., Rubele S., Nanni A., 2012, MNRAS, 427, 127
- Cummings et al. (2015) Cummings J. D., Kalirai J. S., Tremblay P.-E., Ramirez-Ruiz E., 2015, ApJ, 807, 90
- Dominguez et al. (1996) Dominguez I., Straniero O., Tornambe A., Isern J., 1996, ApJ, 472, 783
- Dufour et al. (2017) Dufour P., Blouin S., Coutu S., Fortin-Archambault M., Thibeault C., Bergeron P., Fontaine G., 2017, in Tremblay P.-E., Gaensicke B., Marsh T., eds, Astronomical Society of the Pacific Conference Series Vol. 509, 20th European White Dwarf Workshop. p. 3 (arXiv:1610.00986)
- Dutra-Ferreira et al. (2016) Dutra-Ferreira L., Pasquini L., Smiljanic R., Porto de Mello G. F., Steffen M., 2016, A&A, 585, A75
- El-Badry et al. (2018) El-Badry K., Rix H.-W., Weisz D. R., 2018, preprint, (arXiv:1805.05849)
- Ferrario et al. (2005) Ferrario L., Wickramasinghe D., Liebert J., Williams K. A., 2005, MNRAS, 361, 1131
- Fontaine et al. (2001) Fontaine G., Brassard P., Bergeron P., 2001, PASP, 113, 409
- Gaia Collaboration et al. (2017) Gaia Collaboration et al., 2017, A&A, 601, A19
- Gaia Collaboration et al. (2018b) Gaia Collaboration et al., 2018b, preprint, (arXiv:1804.09378)
- Gaia Collaboration et al. (2018a) Gaia Collaboration Brown A. G. A., Vallenari A., Prusti T., de Bruijne J. H. J., Babusiaux C., Bailer-Jones C. A. L., 2018a, preprint, (arXiv:1804.09365)
- Greggio (2010) Greggio L., 2010, MNRAS, 406, 22
- Hidalgo et al. (2018) Hidalgo S. L., et al., 2018, ApJ, 856, 125
- Holberg & Bergeron (2006) Holberg J. B., Bergeron P., 2006, AJ, 132, 1221
- Iben & Renzini (1983) Iben Jr. I., Renzini A., 1983, ARA&A, 21, 271
- Kalirai et al. (2009) Kalirai J. S., Saul Davis D., Richer H. B., Bergeron P., Catelan M., Hansen B. M. S., Rich R. M., 2009, ApJ, 705, 408
- Karakas & Lattanzio (2014) Karakas A. I., Lattanzio J. C., 2014, Publ. Astron. Soc. Australia, 31, e030
- Lindegren et al. (2018) Lindegren L., et al., 2018, preprint, (arXiv:1804.09366)
- Martín et al. (2018) Martín E. L., Lodieu N., Pavlenko Y., Béjar V. J. S., 2018, ApJ, 856, 40
- Perryman et al. (1998) Perryman M. A. C., et al., 1998, A&A, 331, 81
- Renedo et al. (2010) Renedo I., Althaus L. G., Miller Bertolami M. M., Romero A. D., Córsico A. H., Rohrmann R. D., García-Berro E., 2010, ApJ, 717, 183
- Salaris et al. (2009) Salaris M., Serenelli A., Weiss A., Miller Bertolami M., 2009, ApJ, 692, 1013
- Salaris et al. (2010) Salaris M., Cassisi S., Pietrinferni A., Kowalski P. M., Isern J., 2010, ApJ, 716, 1241
- Si et al. (2018) Si S., van Dyk D. A., von Hippel T., Robinson E., Jeffery E., Stenning D. C., 2018, preprint, (arXiv:1806.06733)
- Taylor (2006) Taylor B. J., 2006, AJ, 132, 2453
- Taylor & Joner (2005) Taylor B. J., Joner M. D., 2005, ApJS, 159, 100
- Tremblay et al. (2011) Tremblay P.-E., Bergeron P., Gianninas A., 2011, ApJ, 730, 128
- Tremblay et al. (2012) Tremblay P.-E., Schilbach E., Röser S., Jordan S., Ludwig H.-G., Goldman B., 2012, A&A, 547, A99
- Weidemann (2000) Weidemann V., 2000, A&A, 363, 647
- Williams et al. (2009) Williams K. A., Bolte M., Koester D., 2009, ApJ, 693, 355