Circumnuclear Multi-phase Gas in the Circinus Galaxy II:
The Molecular and Atomic Obscuring Structures Revealed with ALMA
Abstract
We used the Atacama Large Millimeter/Submillimeter Array (ALMA) to map the CO(3–2) and [C I](1–0) lines, as well as their underlying continuum emission, from the central pc region of the Circinus galaxy that hosts the nearest type 2 Seyfert-class active galactic nucleus (AGN), with a spatial resolution of pc. The lines and continuum-emitting regions consist of a circumnuclear disk (CND; 74 pc 34 pc) and spiral arms. The distribution of the continuum emission revealed a temperature-dependent dust geometry and possibly polar dust elongation in the torus region. The molecular mass of the CND is with a beam-averaged H2 column density of cm-2 toward the AGN position, which contributes significantly to the nuclear obscuration. The [C I](1–0)/CO(3–2) ratio at the AGN position is unusually high, suggesting an X-ray dominated region-type chemistry. We decomposed the observed velocity fields into rotational and dispersion components, and revealed multi-phase dynamic nature in the pc torus region, i.e., the diffuse atomic gas is more spatially extended along the vertical direction of the disk than the dense molecular gas. Through comparisons with our model predictions based on the radiation-driven fountain scheme, we indicate that atomic outflows are the driver of the geometrical thickness of the atomic disk. This supports the validity of the radiation-driven fountain scheme in the vicinity of this AGN, which would explain the long-lasting mystery, the physical origin of the AGN torus.
1 Introduction
The unified scheme of active galactic nuclei (AGNs) postulates that the observability of a broad line region (type 1 and 2) depends on the viewing angle of an optically and geometrically thick dusty/molecular torus that surrounds the central supermassive black hole (Antonucci, 1993; Urry & Padovani, 1995). Spatially resolved thermal dust emission at near- to mid-infrared (NIR to MIR) wavelengths in AGNs indeed support the existence of compact ( pc) obscuring structures (e.g., Jaffe et al., 2004; Burtscher et al, 2013; Asmus et al., 2014).
Since the advent of the unification scheme, the physical origin of the geometrical thickness has been debated. In early theories, the torus was simplified as a continuous structure composed of dust and supported by, e.g., infrared (IR) radiation pressure and turbulence (e.g., Pier & Krolik, 1992, 1993; Granato & Danese, 1994; Schartmann et al., 2005). The dust distribution was later revised to be clumpy in nature (e.g., Nenkova et al., 2002, 2008a, 2008b; Hönig et al., 2006; Schartmann et al., 2008; Stalevski et al., 2012), which successfully reproduced the characteristic features of the AGN spectral energy distribution (SED) including the 9.7 m silicate feature. Replacement of the torus by a magnetocentrifugally-driven disk wind containing dusty clumps was also proposed (e.g., Elitzur & Shlosman, 2006; Elitzur & Ho, 2009). Supported by the prevalence of circumnuclear starbursts around AGNs (e.g., Imanishi & Wada, 2004; Davies et al., 2007; Esquej et al., 2014), a supernova (SN)-driven turbulent torus model was also suggested (Wada & Norman, 2002; Wada et al., 2009), where the SNe puffs up the disk gas and dust to form a toroidal structure at parsec (pc) scales.
However, these models are now challenged by the existence of polar-elongation in MIR continuum emission distributions revealed by high-resolution observations in nearby Seyfert galaxies (e.g., Tristram et al., 2014; Asmus et al., 2016; López-Gonzaga et al., 2016), which seems to contradict the donut-like dust geometry in the equatorial plane postulated in the unified scheme. Recent detailed radiative transfer simulations have revealed that a dusty hollow cone illuminated by the central engine can explain the observed morphology (Stalevski et al., 2017). Therefore, it is noteworthy that the radiation-driven fountain model (Wada, 2012), in which the circulation of AGN-driven dusty outflows, failed-winds, and inflows jointly form a geometrically thick structure, can naturally reproduce such a dusty hollow cone and the polar elongation at MIR wavelengths (Schartmann et al., 2014).
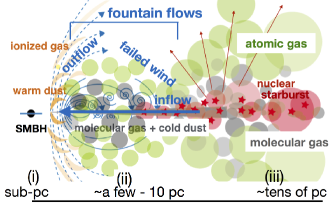
This fountain model, which was later complemented by the aforementioned SN feedback process and non-equilibrium X-ray dominated region (XDR, e.g., Maloney et al., 1996) chemistry (Wada et al., 2016), predicts that the gas and dust of a tens of pc scale circumnuclear disk (CND; Izumi et al., 2016) are highly dynamic and non-static, and consist of three main regions/structures that replace the classic torus: (i) low density hot (= H II) and dusty outflows that are launched due to X-ray heating and radiation pressure at a sub-pc region (the outflows irradiated by the central source form narrow line regions; K. Wada et al. in preparation), (ii) low density cold (= H I) dusty outflows and failed winds111A part of the outflow that falls back to the disk due to disk and SMBH gravities. at a region of a few pc to 10 pc that cause a mid-plane disk (= H I + H2) to become highly turbulent and then geometrically thick, and (iii) a geometrically thin disk (= H I + H2) located at a region of pc. SN-driven turbulence, if significant, can cause this latter region to become geometrically thick. This model is hereafter denoted as the multi-phase dynamic torus model (Figure 1). The inflow gas passes through the dense mid-plane of the disk. Thus, the circulation of the inflows, outflows, and failed winds jointly form the fountain. Components (ii) and (iii) are basically responsible for the nuclear obscuration, with significant substructures in the column density (Wada, 2015). In either region (ii) or (iii), diffuse atomic gas is spatially more extended along the vertical direction of the disk than dense molecular gas, due to complex interplay between the gas dynamics, AGN radiation, and local heating/cooling. For example, in region (ii), spatially extended outflows are preferentially observed in the atomic gas rather than molecular gas in this model. Thus, high-resolution observations of the multi-phase interstellar medium (ISM) around AGNs are essential to test this picture of the multi-phase gas circulation.
The Atacama Large Millimeter/submillimeter Array (ALMA) has the capability to perform such observations. Indeed, it has finally begun to detect cold molecular gas and dust emission from the central pc region of nearby AGNs including NGC 1068 (Imanishi et al., 2016, 2018; García-Burillo et al., 2016; Gallimore et al., 2016), NGC 1377 (Aalto et al., 2017), Centaurus A (Espada et al., 2017), NGC 1097 (Izumi et al., 2017), and NGC 5643 (Alonso-Herrero et al., 2018). However, as these studies observed dense molecular gas only, the physical and chemical nature of multi-phase gas remain unclear. This situation could be improved by using the atomic carbon line [C I](–) [C I](1–0) that is now observable with ALMA Band 8 for the case of nearby galaxies (Krips et al., 2016; Miyamoto et al., 2018). Contrary to the prediction of classic chemical models that C I is distributed in a thin layer between the ionized part and the shielded molecular part of a cloud (e.g., Hollenbach & Tielens, 1999), it is now well known that C I is actually concurrent through the cloud (e.g., Ojha et al., 2001; Ikeda et al., 2002; Shimajiri et al., 2013). This is likely due to the different formation timescale between C I and CO (Suzuki et al., 1992), and/or strong interstellar turbulence (Glover et al., 2015). It is noteworthy that in active environments with strong radiation fields, such as an XDR (e.g., Maloney et al., 1996), C-bearing species such as CO are dissociated and enhance the abundance of C I. Thus, C I lines will be excellent probes of AGN signatures.
In this work, we present our high-resolution () ALMA Cycle 4 observations of the CO(3–2) ( = 345.7960 GHz) and the [C I](1–0) ( = 492.1607 GHz), as well as the underlying continuum emission toward the central pc region of the Circinus galaxy (hereafter, denoted as Circinus). Our aim is to investigate the nature of the circumnuclear obscuring material, by focusing particularly on the differences in the dynamical or geometrical structures as a function of the phase of the gas (molecular vs. atomic). The observed properties will be compared to our multi-phase dynamic torus model, where key parameters (e.g., black hole mass, Eddington ratio, gas mass) were matched to those measured in Circinus, as well as post-processed non-local thermodynamic equilibrium (non-LTE) radiative transfer calculations were performed for multiple CO lines (our Paper-1, Wada et al., 2018) and C I lines (this work).
1.1 Our target: The Circinus galaxy
Circinus is a spiral galaxy (SAb; de Vaucouleurs et al., 1991) with a high inclination angle on the galactic scale (; Freeman et al., 1977), and hosts the nearest ( = 4.2 Mpc, 1 = 20.4 pc; Tully et al., 2009) type 2 Seyfert nucleus (Oliva et al., 1994; Moorwood et al., 1996). It shows a one-sided ionization cone and outflowing gas that extends up to kpc scales in H, [O III], and several other coronal emission lines (e.g., Marconi et al., 1994; Veilleux & Bland-Hawthorn, 1997; Müller Sánchez et al., 2006). The genuine existence of an obscured type 1 nucleus was confirmed by the spectropolarimetric detection of a broad H line ( km s-1; Oliva et al., 1998). Circinus is also undergoing a modest star-forming activity, as measured using far-infrared luminosity (star formation rate (SFR) a few yr-1; Moorwood & Glass, 1984; Elmouttie et al., 1998b) and several hydrogen recombination lines (e.g., Marconi et al., 1994; Wilson et al., 2000), while the pc scale SFR is admittedly low ( yr-1; Esquej et al., 2014): thus, significant SN feedback might not be expected there.
As is typical in the case of a late-type galaxy, a huge amount of molecular gas () was detected in Circinus through observations of multi- CO lines including isotopologues, as well as other dense gas tracers such as HCN and HCO+ (e.g., Aalto et al., 1991; Israel, 1992; Elmouttie et al., 1998b; Curran et al., 1998, 1999, 2001, 2008; Hitschfeld et al., 2008; Zhang et al., 2014; Israel et al., 2015). While the intense H I emission is distributed in a kpc-radius region dominated by large-scale spiral arms (Jones et al., 1999), molecular gas is concentrated in the inner kpc-radius region (Curran et al., 1998, 2008; Elmouttie et al., 1998b). An expected morphology for that molecular gas structure, with the H2 mass () 222The standard Galactic CO-to-H2 conversion factor of cm-2 (K km s-1)-1 is assumed for most of the previous measurement, although Zhang et al. (2014) suggested a factor of lower value in Circinus through the physical modeling of multi- CO emission lines. of ( pc; Elmouttie et al., 1998b), has been a ring/disk-like one plus widespread outflows perpendicular to the morphological major axis of this galaxy (Curran et al., 1998, 1999). However, recent resolution CO(1–0) mapping with ALMA imaged instead a more spiral arm-like gas distribution (Zschaechner et al., 2016), while revealing another molecular outflow at 35 northwest of the nucleus.
With regard to the nuclear scale, X-ray spectra below 10 keV exhibit flat continuum and prominent 6.4 keV Fe K line emission, indicative of strong Compton scattering (Matt et al., 1996). Subsequent harder X-ray observations at keV confirmed the existence of the Compton-thick nucleus (e.g., Matt et al., 1999; Guainazzi et al., 1999), with a line-of-sight obscuring column density of cm-2, and an absorption-corrected 2–10 keV intrinsic luminosity of erg s-1, respectively (Arévalo et al., 2014). Detections of H2O mega-masers at both mm and submm wavelengths at the heart of Circinus support the idea that a dense Keplerian disk is located there (Greenhill et al., 1997, 2003; Hagiwara et al., 2013), with the mass of the central supermassive black hole (SMBH) given as (Greenhill et al., 2003). With this , Tristram et al. (2007) estimated the Eddington ratio of the AGN as .
Our prime reason for studying Circinus is that it clearly exhibits pc-scale polar elongation at MIR continuum emission (Tristram et al., 2014), which makes it an ideal laboratory to test our multi-phase dynamic torus model. We describe the ALMA Cycle 4 observations in § 2. The continuum emission maps are shown in § 3, while line emission distributions and their ratio are reported in § 4. Details of the gas kinematics of both the CO(3–2) and the [C I](1–0) lines are presented in § 5. We compare the observed torus properties with the predictions of our multi-phase dynamic torus model in § 6. Finally, our conclusions are summarized in § 7.
2 Observations and Data Analysis
2.1 ALMA observations
We observed Circinus with ALMA Band 7 and 8 during 2016–2017 using 42–47 antennas, as a Cycle 4 program (ID = 2016.1.01613.S, PI = T. Izumi). Table 1 summarizes the log of our observations. Observations were conducted in a single pointing with fields of view of 18 (Band 7) and 13 (Band 8), which fully covered the central of the CND (see § 4). The expected maximum recoverable scales per pointing are (Band 7) and (Band 8). We set the phase tracking center to (, ) = (14h13m09s.950, 652021.0), which is one of the nuclear 22 GHz H2O maser spots of Circinus (Greenhill et al., 2003). The angular separations between this tracking center and the phase calibrators are . In both Band 7 and 8 observations, one of the four spectral windows (each with a width of 1.875 GHz) was used to fully cover the CO(3–2) or [C I](1–0) emission lines, both in the 2SB dual-polarization mode.
Data reduction, calibration, and analyses were performed with CASA version 4.7
(McMullin et al., 2007) in the usual way.
The line and underlying continuum emission were
reconstructed using the CLEAN task with Briggs weighting (robust = 0.5).
The velocity spacings of the original data were 3.4 km s-1 (Band 7)
and 2.4 km s-1 (Band 8) per channel,
but several channels were binned to improve the signal-to-noise ratio,
which resulted in a final and common velocity resolution of km s-1.
Note that velocities are expressed in the optical convention in this work
(local standard of rest [LSR] frame).
The achieved synthesized beams and rms sensitivities are listed in Table 2. The rms values in the line cubes were measured at channels free of line emission (i.e., thermal noise), whereas those of the continuum maps were measured in areas free of such emission. These continuum emission were subtracted in the plane before making the line cubes. Throughout this paper, the pixel scale of Band 7 maps is set to 0.03, whereas that of Band 8 maps is 0.1, and emission with are clipped to enhance the clarity of the images. The kinematic position angle (PA) of the major axis is defined to be on the receding half of the galaxy, taken anti-clockwise from the north direction on the sky. Given this definition, we added 180 to some morphological PAs reported in previous works to maintain consistency. The absolute flux uncertainty is according to the ALMA Cycle 4 Proposer’s Guide, but the displayed errors indicate only statistical ones unless otherwise mentioned. Some parts of our analyses were also performed with the MIRIAD package (Sault et al., 1995).
| Line | Date | Number of Antennae | Baseline | On-source time | Calibrator | |||
|---|---|---|---|---|---|---|---|---|
| (UT) | (m) | (min) | Band pass | Gain | Flux | (K) | ||
| CO(3–2) | 2016 Nov 24 | 42 | 15–704 | 42.5 | J1427-4206 | J1424-6807 | J1427-4206 | |
| 2016 Nov 26 | 42 | 17–704 | 42.5 | J1427-4206 | J1424-6807 | J1617-5848 | ||
| 2017 May 5 | 47 | 15–1124 | 42.5 | J1427-4206 | J1424-6807 | J1427-4206 | ||
| C I(1–0) | 2017 Mar 18 | 43 | 15–287 | 31.5 | J1427-4206 | J1424-6807 | J1427-4206 | |
| Emission | Beam | Beam | rms | Peak | |
|---|---|---|---|---|---|
| (GHz) | () () | (pc pc) | (mJy beam-1) | (mJy beam-1) | |
| CO(3–2) | 345.796 | 0.29 0.24 (153.6) | 5.9 4.9 | 0.37 | 301 |
| Band 7 continuum | 351 | 0.29 0.24 (156.0) | 5.9 4.9 | 0.08 | 22.4 |
| C I(1–0) | 492.161 | 0.71 0.66 (95.9) | 14.5 13.4 | 3.10 | 1435 |
| Band 8 continuum | 485 | 0.71 0.65 (94.2) | 14.5 13.2 | 0.80 | 87.8 |
2.2 Ancillary data
We retrieved the Hubble Space Telescope (HST) Planetary Camera images (PC-F656N, F606W, F814W) of Circinus from the Hubble Legacy Archive333https://hla.stsci.edu. The images were calibrated using the HST pipeline. Continuum emission was subtracted from the F656N image using the adjacent continuum following standard line extraction procedures to construct an image of the H emission line. The structures seen in the resultant image are consistent with those found in previous works (e.g., Marconi et al., 1994; Wilson et al., 2000). We also use the -band image obtained with the NaCo/VLT (Mezcua et al., 2016) to compare the spatial distributions of the continuum emission.
3 Continuum Emission
3.1 Spatial distributions
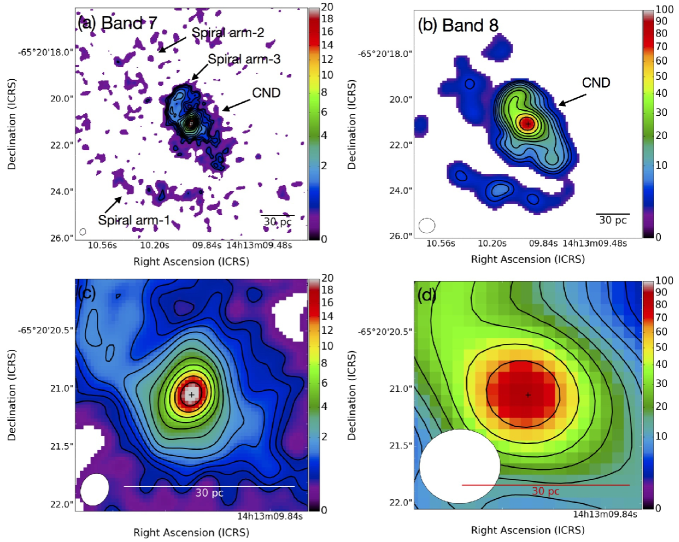
Figure 2 shows the spatial distributions of the ALMA Band 7 ( = 351 GHz or = 854 m) and 8 ( = 485 GHz or = 618 m) continuum emission at the central ( 200 pc 200 pc) and ( 40 pc 40 pc) regions of Circinus. The total fluxes are mJy (Band 7) and mJy (Band 8) within the 10 box. Each of the emission peaks at = 14h13m09s.948, and = 652021.05, which coincides with the AGN position identified by the very long baseline interferometry (VLBI) H2O maser observations ( = 14h13m09s.953, = 652021.187; Greenhill et al., 2003) within positional uncertainties. Hereafter, we define our continuum peak position as the AGN location. The peak flux densities are 22.4 mJy beam-1 (Band 7) and 87.8 mJy beam-1 (Band 8), respectively.
Although the achieved angular resolutions were admittedly different (Table 2), consistent spatial distributions can be identified between the Band 7 and 8 maps. The continuum-emitting regions appear to consist of (likely) three spiral arms which converge to the central bright CND or jointly constitute the CND: these structures are better echoed by the CO(3–2) and C I(1–0) spatial distribution maps (see also Figure 6 as a reference). Note that we were unable to find a clear indication of the nuclear gaseous bar postulated by Maiolino et al. (2000) southeast, nor an expected counter bar northwest, of the nucleus. This may imply that an aligned configuration of dense molecular clouds in the spiral arms (§ 4), viewed with a high inclination might have been mistaken as a bar.
3.2 Physical nature of the continuum emission
The nature of the observed submm continuum emission is of interest because the obscuring structure of this AGN would begin to be directly traced at the high resolutions obtained here. Although this galaxy possesses a radio jet (Harnett et al., 1990; Elmouttie et al., 1998a; Murphy et al., 2010), we first argue that contamination by such synchrotron emission is not significant at the ALMA Band 7 and 8 frequencies. For example, a Band 7 flux density at the central 1.4 region expected by extrapolating the cm emission (50 mJy) with a typical synchrotron spectral index444Flux (synchrotron) . of is only mJy, which is times smaller than the value measured at a much smaller beam () placed at the AGN position. Note that Elmouttie et al. (1998a) revealed a very flat radio spectral index at the nuclear region of Circinus at GHz primarily due to optically thick nature at that frequency range. However, it is more reasonable to adopt the above for higher frequencies, where synchrotron emission becomes optically thinner.
A Band 8 to 7 flux density ratio at the AGN position, after matching the Band 7 range and beam size to the Band 8 ones ( range 25–470 k; the resultant Band 7 flux density = 26.3 mJy beam-1), revealed a steep spectral index of 3.72, or dust emissivity index 555Flux (thermal dust) . of . This is consistent with a typical index observed in local star-forming galaxies (; Clemens et al., 2013). Thus, the nuclear submm SED of Circinus is dominated by thermal dust emission. We found that the Band 8 continuum flux density at the AGN position is almost consistent with the value expected by the K black body model in Tristram et al. (2014), which was introduced to describe the observed IR SED at the (circum)nuclear region. Meanwhile, the Band 7 flux density at the same position falls by a factor of a few below the model prediction, which seems to reflect the fact that the dust continuum emission tends to follow the modified black body spectrum more, rather than the black body model, at a longer wavelength.
3.3 Relative locations
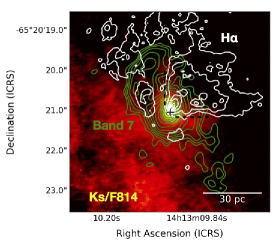
It is remarkable that the extended spiral arm-like or filamentary structure seen around the CND in our submm continuum maps traces the radially farther region from the center than the nuclear bright V-shaped structure seen in the /F814 flux ratio map (Figure 3: the latter seems to collimate the ionized cone seen in the H line emission distribution) that enhances the distribution of warm dust emission (Mezcua et al., 2016). This indicates the existence of temperature-dependent dusty structures around this AGN. This relative geometry, viewed with a high inclination angle (–, Freeman et al., 1977; Elmouttie et al., 1998b; Tristram et al., 2014), is also consistent with the prediction of our multi-phase dynamic torus model where the warm dust is embedded in outflows at the inner part of the disk, and the cold dust is located in the extended disk (Schartmann et al., 2014; Wada et al., 2016, see also Figure 1). Within the framework of our model, the nuclear warm dust seen in the /F814 ratio map is thus considered to be distributed in a geometrically thick volume, whereas the cold dust is in a thinner structure. This warm dust carries only of the obscuring matter required to make a type 1 Seyfert nucleus appear as an obscured type 2 nucleus such as Circinus (Mezcua et al., 2016). Thus, an additional absorber is required to completely obscure the nucleus: we suggest that the extended cold material in the CND studied here contributes to that obscuration (see also § 4) 666We do not estimate dust mass here based on our continuum measurements because the temperature of the extended cold dust component, which would be a spatially different structure from the warm dust component ( K black body), is unknown at present..
3.4 The polar elongation
To further investigate the detailed spatial distribution of the submm continuum emission,
we applied the UVMULTIFIT procedure (Martí-Vidal et al., 2014)
to the Band 7 continuum visibility data,
in which we have sampled long distance visibilities denser than the case of the Band 8 data.
This model fitting method to the direct interferometric observable (visibility)
is preferable to avoid systematic uncertainty in the image-plane fitting due to,
e.g., non-linear deconvolution algorithm, particularly when we fit beam-unresolved components.
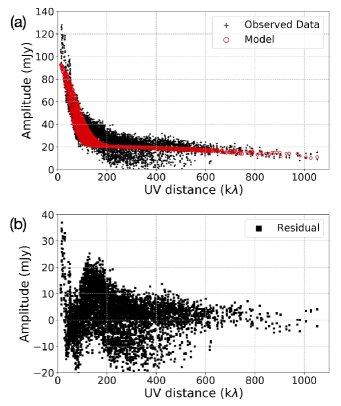
The achieved visibility data is shown in Figure 4a as a function of distance (UVD), after averaging the visibilities over the observation time and frequency (representative frequency = 350.2 GHz). The almost constant amplitude at the UVD k manifests the existence of a compact component, while the short UVD components reflect spatially extended structures. Here we performed a two-dimensional double Gaussian fit to this visibility data: the use of double components is motivated by the existence of a pc-scale MIR polar elongation (Tristram et al., 2007, 2014), in addition to the extended CND seen in Figure 2. The results of the fit are summarized in Table 3 and the corresponding model is displayed in Figure 4a as well. As expected in the above, our best fit indeed supports the existence of a compact component at the AGN position (Component-1 in Table 3) in addition to the apparently extended structure (Component-2). The latter would correspond to a bright part of the CND (see also Figure 2). The fact that Component-2 is brighter than Component-1 is consistent with the prediction of our multi-phase dynamic torus model that cold dust visible at longer FIR to submm wavelengths is predominantly located in an extended disk, while more centrally concentrated components including warm dusty outflows are prominent at shorter NIR to MIR wavelengths (Schartmann et al., 2014). Note that, however, we also found that the residual amplitude remains high at the short UVD ( k; Figure 4b). This is due to the fact that there are some other spatially extended circumnuclear dusty structures in Circinus (e.g., spiral arms; Figure 2). As we would like to focus on the very nuclear structures in this subsection, fitting all components is beyond our scope.
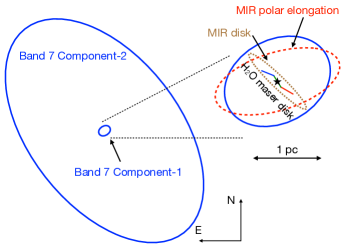
The spatial distributions of several (circum-)nuclear major components that we are interested in are illustrated in Figure 5. The axis ratio of this Component-2 suggests that this structure is moderately inclined if it is a circular disk (). This inclination angle is slightly smaller than the galactic-scale one () possibly because the spatially extended/elongated emission along the northeast-southwest direction, particularly at the southwestern side of the nucleus, is faint (see also Figure 2a). This will decrease the inclination angle with our simple method. Such an extended structure is clearly recognized in, e.g., CO(3–2) integrated intensity map (§ 4), which indeed yields a better agreement of an inclination angle with the above-mentioned galactic-scale one. Meanwhile, the Component-1 appears elongated along the polar direction of the H2O maser disk. This immediately brings to mind the pc-scale MIR polar elongation (Tristram et al., 2014). The derived source size ( pc pc) and PA () of Component-1 are roughly consistent with those of the MIR polar elongation ( pc and , respectively). Therefore, we suggest that Component-1 traces the same physical structure as the MIR polar elongation. Although we need higher resolution direct imaging to robustly reveal this compact structure, our finding here will support the actual existence of such elongated structures at the hearts of AGNs (e.g., López-Gonzaga et al., 2016), which created a new challenge to the classic torus paradigm.
| Component-1 | Component-2 | |
|---|---|---|
| Major axis (mas) | 80 13 | 1634 34 |
| Minor axis (mas) | 60 6 | 951 21 |
| Major axis (pc) | 1.6 0.3 | 33.3 0.7 |
| Minor axis (pc) | 1.2 0.1 | 19.4 0.4 |
| PA () | 298 21 | 218 1.4 |
| Integrated flux (mJy) | 20.7 1.3 | 73.5 1.6 |
4 Gas Distributions and Line Ratios
In this section, we analyze the unprecedented
high-resolution CO(3–2) and [C I](1–0)
emission line data of Circinus and then discuss their spatial distributions.
Our analysis reveals that the bulk of these emission
comes from the innermost 10 region,
although the missing flux is considerable.
Here, the CASA task IMMOMENTS was used to generate the 0th moment maps without any clipping:
the emission has been integrated over km s-1,
which is sufficient to cover their full velocity ranges (see also Figure 11).
4.1 CO(3–2) map
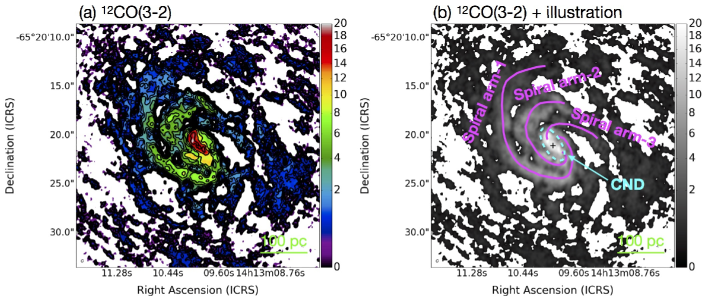
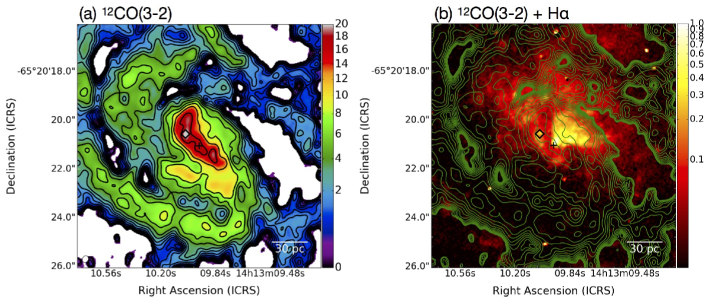
Figure 6a shows the CO(3–2) velocity-integrated intensity map of Circinus, over the central 25 (= 500 pc) region. The structures seen here are the counterparts to the postulated 300 pc-radius ring or disk in Elmouttie et al. (1998b). After convolving the map to an 18 aperture and correcting for the primary beam attenuation, we found that a roughly of the total CO(3–2) line flux has been resolved out compared to the APEX single dish data (Zhang et al., 2014). As for the dust continuum emission, we identify two main structures in this circumnuclear region through closer inspection of the map: these are illustrated in Figure 6b. A zoomed-in view (central 10 = 200 pc) is shown in Figure 7a. We describe each structure below.
4.1.1 Spiral arms
Three possible spiral arms (labeled 1, 2, and 3 in Figure 6b) are visible. These could be inner extensions of the arms seen in the larger scale CO(1–0) map (Zschaechner et al., 2016). In addition, inter-arm spur or feather structures also appear, as is the case in the nearby grand-design spiral galaxy M51 (e.g., Schinnerer et al., 2013). Meanwhile, the gaseous bar at the southeast of the nucleus (Maiolino et al., 2000) cannot be identified: the relatively straight-aligned CND and bright knots in the spiral arms 1 and 2 at the southeastern region of the nucleus (Figure 7a) could have been mistaken as a bar.
Given the high critical density of CO(3–2), cm-3 (for a temperature of 100 K, Kaufman et al., 1999), one would expect that several bright knots in the spiral arms (Figure 7a) are the sites of star formation: each knot typically has a size of a few pc to pc, and thus can be classified as a molecular cloud. Then, the spatial distributions of the CO(3–2) and the H (§ 2) are compared in Figure 7b. At spiral arm 2 and 3, where the H emission is weakly visible, there were no good spatial coincidences between the CO-bright knots/regions and the H-bright regions. Therefore, as is naively expected, this H emission only traces unobscured star formation. Another finding is that the spiral arm 1 clearly traces the H dark lane at the southeastern side (near side) of this galaxy (Wilson et al., 2000). If we suppose that typical CO(3–2) emission along the spiral arm 1 ( Jy beam-1 km s-1) is thermalized with that of CO(1–0), we would expect there to be visual extinction of mag, by applying the standard Galactic CO conversion factor and the extinction law 777 cm-2 (K km s-1)-1 from Bolatto et al. (2013) and mag cm2 from Draine (2011).. This is one order of magnitude higher than that estimated from the – and – color map analyses (Maiolino et al., 2000), and thus is sufficient to create the dark lane.
4.1.2 The CND
The spiral arms converge to, or jointly constitute,
a bright and compact gas concentration at the center, i.e., the CND,
which appears as an inclined disk.
A two-dimensional Gaussian fit to the central area
on the image plane (CASA task IMFIT)
estimates the beam-deconvolved distribution as
() ()
or (74 3) pc (34 1) pc with PA = .
The derived PA here (and that of the Component-2 found in the Band 7 continuum emission distribution)
is entirely consistent with those on the galactic kpc scale,
e.g., H I emission and CO(1–0) emission distributions (, e.g., Freeman et al., 1977; Curran et al., 1998),
as well as that of the nuclear H2O maser disk
(209 at pc and 236 at pc; Greenhill et al., 2003).
An inclination angle estimated from the above deconvolution,
by assuming that the molecular gas is distributed in a circular disk, is .
This angle is again fully consistent with that of the galactic scale H I gas distribution
but is smaller than that of the nuclear MIR disk (, Tristram et al., 2014).
The global inclination angle we obtained is also smaller than that ()
required in Wada et al. (2016) to reproduce the continuum SED
of Circinus with the multi-phase dynamic torus model.
One plausible and simple explanation is that the CND of Circinus is warped
from the center (i.e., the edge-on disk seen as the H2O maser disk, Greenhill et al., 2003) to the outward edge.
This is in agreement with the observation that the orientation of
a large-scale gas/stellar distribution is unrelated
to that of the radio jet, i.e., the polar direction of a presumed torus
(Clarke et al., 1998; Nagar & Wilson, 1999).
We found good spatial coincidence between the Band 7 continuum distribution and the CND. Thus the CND also delineates the outer boundary of the warm dust structure (Mezcua et al., 2016), which would collimate the H emission, as shown in § 3. Note that we suppose that the northwestern part of the spiral arm 2 (see also Figure 6b) is at the far side with respect to the H cone: otherwise the cone is obscured by the cold dusty gas. The apex of the H cone barely appears because this CND is inclined. Meanwhile, the other side (i.e., southeastern side) of the H cone is completely obscured by the CND, although that side is partially visible at longer wavelength emission lines such as Pa (Maiolino et al., 2000; Mezcua et al., 2016).
Owing to the much higher S/N (Table 2) than the Band 7 continuum map, our CO(3–2) integrated intensity map reveals a wealth of detail in this CND. The gas distribution there is not uniform with the off-centered peak position (20.8 Jy beam-1 km s-1; marked as the diamond in Figure 7) at northeast of the nucleus (18.0 Jy beam-1 km s-1). This offset would be unaffected by spatial filtering given the much larger maximum recoverable scale () of our observations (§ 2). The spatial offset of the CO peaks with respect to the exact AGN position is consistent with the highly inhomogeneous nature of CO brightness distributions simulated with our multi-phase dynamic torus model (Wada et al., 2018).
We estimate the molecular mass of the CND to be , as follows. Here, we define the extent of the CND as that of the above beam-deconvolved source size (, PA = 212.0). We assume that the CO(3–2) emission there (integrated intensity = 805 Jy km s-1) is thermalized with that of CO(1–0) and use the standard equation (Solomon & Vanden Bout, 2005) to calculate its line luminosity as K km s-1 pc2. Then, by applying the canonical CO conversion factor in active environments ( = 0.8 (K km s-1 pc2)-1, Downes & Solomon, 1998; Bolatto et al., 2013), the above is obtained. In the same manner, we also estimate the line-of-sight H2 column density toward the AGN position from the CO(3–2) integrated intensity (18.0 Jy beam-1 km s-1, or 2675 K km s-1) as cm-2. Note that we expect this to remain the lower limit of the true line-of-sight column density due to beam dilution. For example, given the K brightness temperature of the Band 7 continuum emission at the AGN position, we may expect a few to even larger if the true physical temperature of the cold dust is, e.g., K (with a modest opacity). Moreover, if is larger than the above canonical value by a factor of , as expected in recent radiative transfer simulations of multiple CO lines (Wada et al., 2018), we will also obtain a correspondingly larger and . Thus, this CND would provide a significant fraction of the Compton-thick material toward the Circinus AGN ( cm-2, Arévalo et al., 2014). This is consistent with the results of our multi-phase dynamic torus model applied to Circinus (Wada et al., 2016), which required additional nuclear obscuration by the CND-scale cold ISM to the obscuration by the central warm ISM, to fully reproduce the SED of this AGN. Hence, we suggest that the CND indeed operates as a significant part of the nuclear obscurer.
4.2 [C I](1–0) map
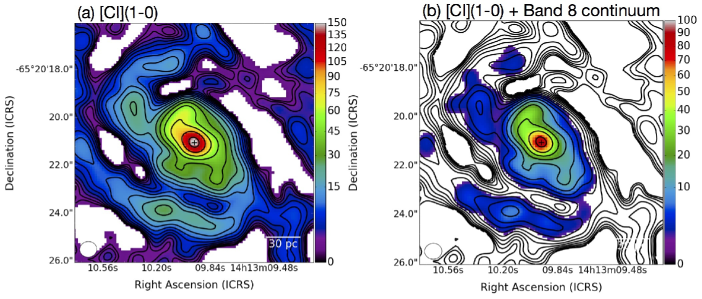
The [C I](1–0) line emission is successfully detected both at the spiral arms and the CND (Figure 8a), with a clear peak at the AGN position (154 Jy beam-1 km s-1). The [C I](1–0) distribution is consistent with that of the simultaneously obtained Band 8 continuum emission (Figure 8b). This [C I](1–0) map shows the global distribution of cold and low-density (critical density cm-3, Kaufman et al., 1999) gas in Circinus. It is difficult to estimate the missing flux for this [C I](1–0) observation as the field of view of ALMA Band 8 (12.8) is even smaller than the mapped area (18) with APEX reported in Zhang et al. (2014). However, we found that our observation recovered 45% of that single dish flux after correcting for the primary beam attenuation.
The overall resemblance of the [C I](1–0) distribution and the CO(3–2) distribution (Figure 9) supports the previous argument that [C I](1–0) essentially traces the same area as low- CO lines, which has previously been reported for Galactic molecular clouds (e.g., Ikeda et al., 1999; Plume et al., 2000; Oka et al., 2005) and extragalactic objects (Krips et al., 2016; Miyamoto et al., 2018), and has been found in numerical models (e.g., Glover et al., 2015). However, we also found slight spatial inconsistencies in the detailed gas distributions, both at the spiral arms and the CND (Figure 9). Therefore, the [C I](1–0) also traces different gas volume from that the CO(3–2) does.
With regard to the spiral arms, we suggest that the spatial offsets ( pc) of the [C I](1–0) peaks and the CO(3–2) peaks are due primarily to excitation conditions, as CO(3–2) requires denser gas than [C I](1–0) to be excited. Miyamoto et al. (2018) also reported spatial offsets between [C I](1–0)-bright knots and CO(3–2)-bright knots in the circumnuclear starburst ring of NGC 613. Meanwhile, our particular interest in this paper is centered on the [C I](1–0) to CO(3–2) spatial offset inside the CND. The [C I](1–0) peaks exactly at the AGN location, while the CO(3–2) peak is northeast of that position (Figure 9); this is discussed in more detail in § 4.3.
We also performed a first-order estimate of from the [C I](1–0) line luminosity () at the CND, defined by the beam-deconvolved source size () from the CO(3–2) analyses (§ 4.1). The obtained value there is 1.42 106 K km s-1 pc2. We first estimate the atomic carbon mass () by following Ikeda et al. (2002) and Weiß et al. (2005) as,
| (1) |
where is the C I partition function, K and K are the level energies above the ground state, and is the excitation temperature. This equation assumes optically thin line emission under the LTE condition.
Even under the LTE condition, we would need to correct for line opacity as there is no guarantee that the [C I](1–0) line emission in Circinus is optically thin. However, we expect that its line opacity is moderate () given its peak line intensity ( mJy beam-1 or K) at the AGN position and its likely high such as K (typical value observed in high-redshift quasars, Walter et al., 2011). If , then the correction factor for flux attenuation (/) is , i.e., the equation (1) gives a good estimate of . Then we achieve within the CND by assuming that K; this mass does not change significantly as long as K. If we adopt a relative C I abundance with respect to H2 as , which is also the typical value observed in high-redshift quasars (Walter et al., 2011), we obtain of in the CND. This is consistent with the CO(3–2)-based derived in § 4.1.2.
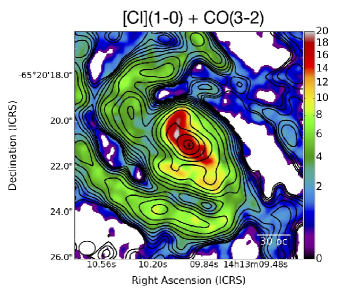
4.3 [C I](1–0)/CO(3–2) line ratio
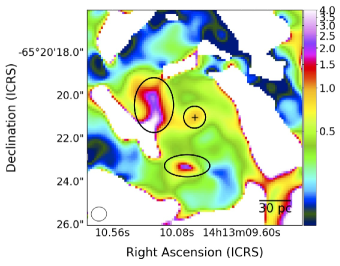
Here, we discuss the [C I](1–0)/CO(3–2) integrated intensity ratio (; brightness temperature scale) at both the CND and the spiral arms by comparing them with previous measurements in external galaxies and Galactic star-forming regions. We first adjust the range and the beam size of the CO(3–2) data to those of the [C I](1–0) data (25–470 k, with PA = 96). The resultant CO(3–2) cube has a 1 sensitivity of 0.54 mJy beam-1 at a velocity resolution of 10 km s-1.
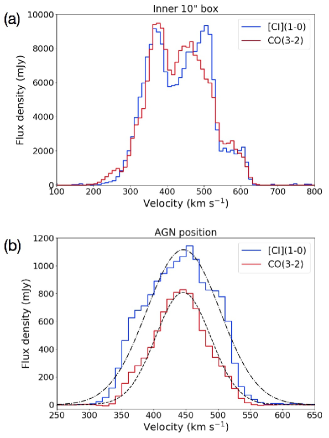
Figure 10 shows the in the central region of Circinus. The typical value of at the spiral arms is , although there are two spots with high ratios; we expect that the local gas densities there are too low to efficiently excite the CO(3–2) line. On the other hand, it is notable that the at the AGN position is times higher () than the spiral arms. Given the much higher of CO(3–2) than that of [C I](1–0), this ratio would be hard to explain by simple gas excitation as it would be naively expected that the gas density profile is centrally peaked. The same situation is also demonstrated in the line spectra (Figure 11): while the [C I](1–0) and the CO(3–2) show totally comparable line flux densities when measured at the central 10 box (i.e., CND + spiral arms), the [C I](1–0) emission clearly becomes brighter than the CO(3–2) emission at the AGN position. The relevant measured at several spatial scales are listed in Table 4; the high at the AGN position is uncommon in star-forming galaxies, which could be explained by an efficient CO dissociation due to hard X-ray irradiation from the AGN (XDR, Maloney et al., 1996; Meijerink & Spaans, 2005).
Indeed, based on the one-zone XDR model of Maloney et al. (1996), we can estimate the X-ray energy deposition rate per particle () with
| (2) |
where is the 1–100 keV X-ray luminosity in units of 1044 erg s-1, is the distance from the AGN to the point of interest in units of 100 pc, and is the X-ray attenuating column density in units of 1022 cm-2, respectively. Here, we adopted (with a photon index = 1.31 and cut-off energy = 160 keV) from Arévalo et al. (2014), as well as cm-3 as a typical value in the molecular part of CNDs of Seyfert galaxies (e.g., Izumi et al., 2013; Viti et al., 2014). Then, we estimated at pc from the center (i.e., the half-major axis of the [C I](1–0) synthesized beam) as . According to the models in Maloney et al. (1996), this is almost exactly the rate at which the fractional abundance of C I () becomes equal to that of CO (). At the regions where , we can expect . Thus, we suggest that the molecular dissociation due to X-ray irradiation is significant at the close vicinity of the Circinus AGN, which could cause the high there.
| AGN | CND | 10 box | |
|---|---|---|---|
| Jy km s-1 | 1.80 0.25 | 1.03 0.15 | 0.97 0.14 |
| K km s-1 | 0.89 0.13 | 0.51 0.07 | 0.48 0.07 |
| Peak | Centroid | FWHM | |
|---|---|---|---|
| (mJy beam-1) | (km s-1) | (km s-1) | |
| CO(3–2) | 807.9 0.9 | 445.8 0.1 | 100.3 0.1 |
| [C I](1–0) | 1115.1 4.6 | 446.1 0.1 | 134.3 0.2 |
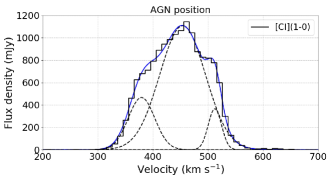
However, the actual three-dimensional (3D) geometrical structure of the XDR requires careful consideration: it does not necessarily form a simple one-zone structure. Indeed, single Gaussian fits to the observed CO(3–2) and [C I](1–0) spectra measured at the AGN position (Figure 11b and Table 5) revealed that the [C I](1–0) spectrum has a wider full width at half maximum (FWHM) than the CO(3–2) spectrum, as well as deviated components from the single Gaussian profile at about 70 km s-1 to the systemic velocity (446 km s-1). Both of these imply that the [C I](1–0) emission also traces a different gas volume than the CO(3–2) emission. This is consistent with the multi-phase dynamic torus model (§ 5 and 6), where the complex interplay of gas chemistry and dynamics indeed occurs. Furthermore, there could be several other possibilities that can cause high , including severe self-absorption in the CO(3–2) line and very peculiar gas excitation condition. Observations of multiple transition lines and multiple species including isotopologues are required to better understand the origin of this enhancement.
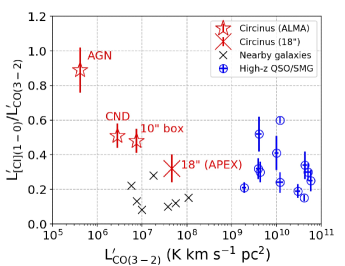
Finally, we compare the of Circinus measured with three apertures with those of other galaxies (compiled from Zhang et al., 2014) in Figure 12. The comparison data consist of high-z quasar-host galaxies and submm galaxies (Walter et al., 2011), as well as nearby galaxies including, NGC 6946 and M83 (Israel & Baas, 2001), IC 342 (Israel & Baas, 2003), Henize 2-10 and NGC 253 (Bayet et al., 2004), and M51 (Israel et al., 2006). As stated in Zhang et al. (2014), the of the nearby star-forming galaxies are to 0.2, while two AGN-host galaxies M51 and Circinus (18 aperture) show slightly higher values of , which already implies a sort of AGN influence on the line ratio. The averaged of the high-z objects is 0.32 0.13 (Walter et al., 2011). As these are essentially starburst galaxies (e.g., Casey et al., 2014), one plausible explanation for the higher compared to nearby galaxies is that their mean interstellar radiation field over the entire galaxy scale is as high as those of the central kpc of the nearby AGNs, which would also lead to efficient CO dissociation. Compared to those nearby and high-z samples, the increasing trend of toward the center of Circinus, which would imply the XDR chemistry, is remarkable.
5 Molecular and Atomic Gas Dynamics
In this Section, we model the dynamics of the cold and dense molecular gas probed by the CO(3–2) line and that of the more diffuse atomic gas probed by the [C I](1–0) line. Our aim is to investigate their difference, particularly at the CND scale or inside, which will be key to understanding the geometrical structure of the circumnuclear obscuring material around the AGN.
5.1 Global patterns
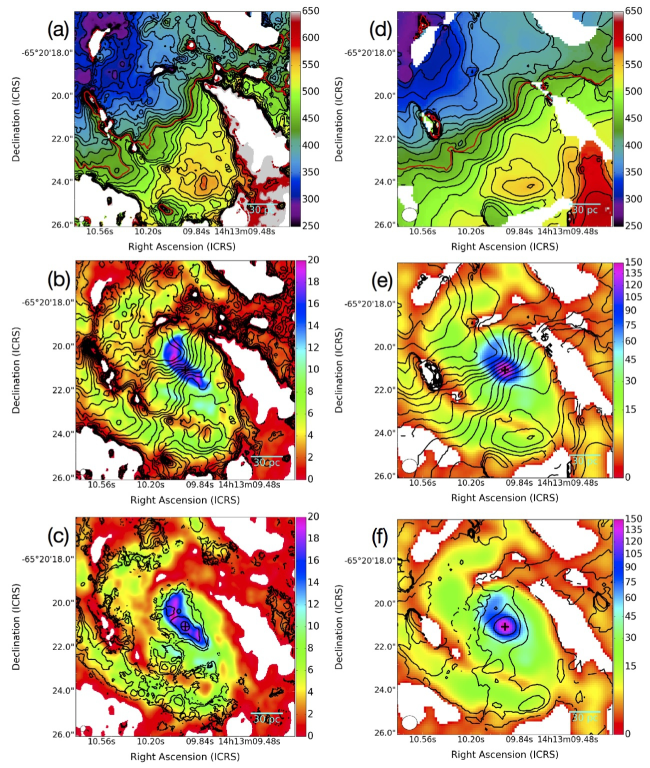
First, we show the global gas dynamics (intensity-weighted line-of-sight velocity and velocity dispersion)
probed by both the CO(3–2) and the [C I](1–0) emission lines in Figure 13.
These maps were made with the CASA task IMMOMENTS
with 10 clipping to avoid noisy pixels.
The patterns traced by the two lines are reasonably consistent with each other,
although we would need to beam-deconvolve them to achieve
the actual gas dynamics (i.e., intrinsic rotation and dispersion; § 5.2).
The gas motion is clearly dominated by the galactic rotation
with an overall northeast–southwest orientation (Figure 13a,d),
which is consistent with previous studies at larger spatial scales
(e.g., Curran et al., 2008; Zschaechner et al., 2016).
On the other hand, it is also evident in the spiral arms
that streaming motions are superposed on the rotation pattern (Figure 13b,e).
These streaming motions, as well as spatial structures in each velocity channel (see Appendix),
may help the reader to recognize the likely three spiral arms
that we have postulated and illustrated in Figure 6b.
5.2 Decomposition with tilted rings
To extract basic beam-deconvolved dynamical information, particularly rotational velocity () and dispersion (), we fitted concentric titled rings to the observed velocity structures with the 3DBarolo code (Di Teodoro & Fraternali, 2015). The main parameters were dynamical center, systemic velocity (), , , galactic inclination (), and PA, all of which can be varied in each ring. Here we fixed the dynamical center to the AGN position and the to 446 km s-1 based on the single Gaussian fits to the observed nuclear spectra (Table 5); , , , and PA were thus the major free parameters and were evaluated by minimizing modelobserved data. Given the significantly different spatial resolution between the CO(3–2) cube and the [C I](1–0) cube, we first present the results using the full-resolution CO(3–2) cube in § 5.2.1 to describe the details of the gas dynamics as much as possible, and then present those with the - and beam-matched CO(3–2) and [C I](1–0) cubes in § 5.2.2.
5.2.1 The CO(3–2) full-resolution data
The full-resolution CO(3–2) cube (, km s-1) was used. We modeled 50 concentric rings with a separation of , which is roughly half the size of the major axis of the synthesized beam. The modeled mean velocity field (moment 1) and the residual image after subtracting this model from the observed data are displayed in Figure 14a and 14b, respectively. The residuals at the spiral arms are 40 km s-1 at the arms 1 and 2, which are attributed to streaming motions. As the southeastern part is the near side of this galaxy (Wilson et al., 2000), these motions are likely inflows toward the vicinity of this AGN. Meanwhile, the residual is only a few km s-1 at the AGN position, which is consistent with our torus model tuned for Circinus (Wada et al., 2016), where the inflow velocity through the dense mid-plane of the CND is as slow as km s-1 (see also Figure 2 of Wada, 2012).
Figure 15a and 15b presents the modeled position-velocity diagrams (PVDs) along the global kinematic major and minor axes, respectively, overlaid on the observed PVDs. The overall structures are well reproduced by a combination of gas rotation and dispersion, although streaming motions are evident as well along the minor axis (offset and ), which positionally correspond to the spiral arms.
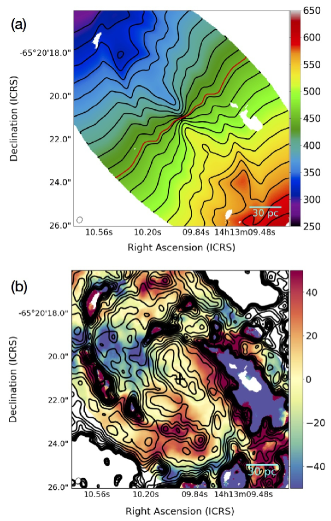
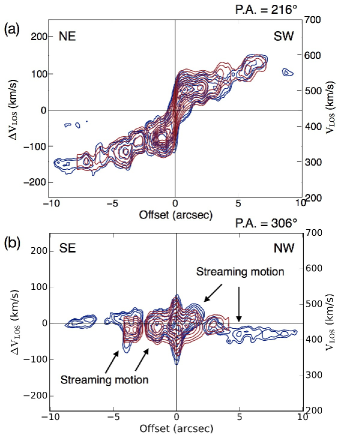
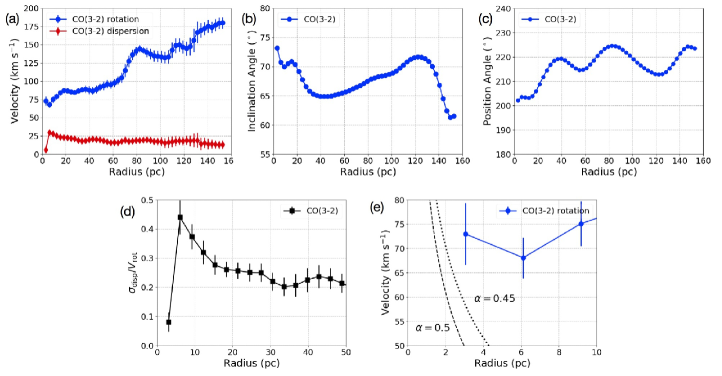
Figure 16a, b, and c shows the radial profiles of the decomposed and , , and PA of our model, respectively. We found that variation in the and the PA is small (within ) around and PA . These values are consistent with those on the galactic scale (e.g., Freeman et al., 1977; Elmouttie et al., 1998b). Nevertheless, we found a slight increasing trend in the toward the AGN position. The inferred at pc would be consistent with the estimated for the 1 pc scale nuclear MIR disk (Tristram et al., 2014), as well as with the required to reproduce the nuclear IR SED of this AGN based on our torus model (Wada et al., 2016). This increasing will eventually reach as Circinus hosts the 22 GHz H2O maser disk at the center (Greenhill et al., 2003).
The radial profile of the / ratio is shown in Figure 16d. This ratio can be considered as a scale height () to scale radius () ratio (, i.e., the aspect ratio of a disk), under the hydrostatic equilibrium condition. From this panel, one can see that the / at pc is , while the ratio at the central pc increases to (except for the innermost pc ring), i.e., the dense molecular disk becomes geometrically thicker. Within the qualitative framework of our model, this moderate thickness of the dense gas disk at the central 10 pc can be interpreted such that the dense gas and dust are puffed up due to the turbulence induced by the AGN-driven failed winds (Wada, 2012; Wada et al., 2016, see Figure 1).
It is particularly noteworthy that the innermost pc ring shows a very low , which is not observed at the other radii. The implied very thin disk geometry, as well as the high , would suggest that the geometrically thin Keplerian disk has finally started to be captured (i.e., the gas motion is governed by the gravity of the central SMBH) with this cold molecular emission line. Indeed, in the zoomed-in view of the radial profile of (Figure 16e), we found a turnover trend of at pc. Although the at that radius remains comparable to those at larger radii within uncertainties, it is close to the extension of the nuclear Keplerian rotation curve around the central SMBH (), traced by the VLBI 22 GHz H2O maser observations (Greenhill et al., 2003). Although it is difficult at this moment to achieve a firmer conclusion given the large errors associated with the inner rings, we can observe a clear difference in between e.g., pc and pc if the CO gas dynamics genuinely follow the Keplerian pattern. This can be tested with higher-resolution ALMA observations.
5.2.2 The uv- and beam-matched data
Next, we model the gas dynamics using the [C I](1–0) cube and the - and beam-matched CO(3–2) cube (1 = 0.54 mJy beam-1 at = 10 km s-1). With this treatment, we expect to reduce the potential systematic effects on the resultant dynamical properties stemming from the unmatched ranges and beam sizes of the input data. Given the larger angular resolution (), we modeled only 20 concentric rings with and repeated the procedure in § 5.2.1.
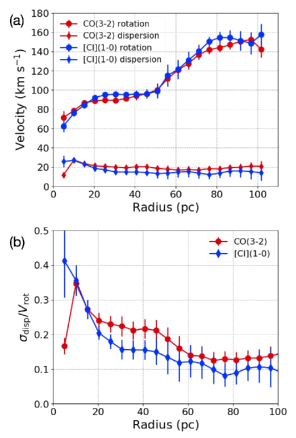
Figure 17a displays the resultant radial profiles of and traced by the CO(3–2) and the [C I](1–0) emission lines. We found that both the and the of the CO(3–2) derived here are consistent with those from the full resolution CO(3–2) cube in § 5.2.1. Thus, the profile of the CO(3–2) shown in Figure 17b is essentially the same as that in Figure 16d. Furthermore, the and the of the [C I](1–0) are consistent with those of the CO(3–2) derived here within uncertainties at most radii, except for the at the innermost one ( pc). Considering our model, the similarity in the ratios at pc between the two tracers (Figure 17b) in turn suggests that the turbulence induced by the failed winds, which can act both on the atomic and molecular gas, plays a major role in determining the disk geometry there, i.e., the contribution from the outflows preferentially seen at ionized/atomic gas (Wada et al., 2016) would not be very significant. The commonly geometrically thin nature at pc, where the radiation-driven fountain will not work well for the case of Circinus (Wada et al., 2016), is also reasonable because SN feedback (an efficient mechanism to puff up the disk) should be weak given the low SFR ( yr-1; Esquej et al., 2014).
Meanwhile, the discrepancy of the ratios at pc ( in the CO(3–2) and in the [C I](1–0)) is more evident, which indicates the existence of multi-phase dynamical structures around the AGN. Note that it is difficult to distinguish coherent outflow motion that can widen the line profile from isotropic turbulent motion due to failed winds, based simply on the observed that mixes these motions. However, as the outflows are preferentially observed at ionized and/or atomic gas at the very nuclear region in our model (Wada et al., 2016), we expect that such outflows are the prime source of the geometrically thicker nature of the C I disk than the CO disk at this very central region. Indeed, we found that adding two more components (i.e., triple Gaussians) can fit the observed nuclear [C I](1–0) spectrum more faithfully as shown in Figure 18 (see also Table 6). The central Gaussian component has almost the same centroid velocity and FWHM as the CO(3–2) spectrum (Table 5), suggesting that this traces the same region as the CO(3–2) line (the rotating disk mid-plane in our model). We also found that the blueshifted and redshifted components appear almost symmetrically with respect to the central component, with a velocity offset of km s-1 (blue) and km s-1 (red), respectively; this is suggestive of coherent atomic gas motion around the AGN. Therefore, these results support the view that the diffuse atomic gas is distributed in a geometrically thicker volume than the dense molecular gas around the AGN due to atomic outflows, as expected in our multi-phase dynamic torus model. As this argument is rather qualitative, however, we perform a more quantitative comparison between the observed [C I](1–0) and CO(3–2) line properties and our model predictions in the next section.
| Peak | Centroid | FWHM | |
|---|---|---|---|
| (mJy beam-1) | (km s-1) | (km s-1) | |
| Central | 1107.9 1.6 | 453.7 5.6 | 97.7 0.6 |
| Blueshifted | 466.4 5.6 | 379.1 0.2 | 56.7 0.5 |
| Redshifted | 365.9 4.4 | 512.3 0.1 | 28.3 0.4 |
6 Comparison with the Model
6.1 Line intensities in our modeled torus
To interpret the physical/dynamical nature of the circumnuclear obscuring structures from the observed line cubes, we used a snapshot of our multi-phase dynamic torus model tuned for Circinus (Wada et al., 2016), where non-equilibrium XDR chemistry (Meijerink & Spaans, 2005) was solved, to predict the emission line properties of multiple species.
The simulated CND has a circular gas distribution for simplicity with pc, with the total of (1283 grids; 0.25 pc resolution), which is roughly consistent with the observed in Circinus measured with a slightly larger aperture ( in the pc disk with (K km s-1 pc2)-1; § 4). The central AGN has the same and the Eddington ratio as those observed (§ 1). The ultraviolet radiation from the central thin accretion disk is angle-dependent, whereas we assumed spherically symmetric X-ray radiation from the AGN corona. Self-gravity of the gas is ignored as it is not essential for the dynamics in the fountain scheme (see also Wada, 2012). After the XDR chemistry (abundance) was solved, post-processed non-LTE radiative transfer calculations were performed. Once the radiation field and optical depth are determined in each grid, we can observe line emission from an arbitrary direction (for further details see Wada et al., 2018). For example, Wada et al. (2018) presented the resultant properties of multiple 12CO transition lines from to 15. Their procedure was fully applied to the case of the [C I](1–0) in this work.
6.2 Results of our simulation
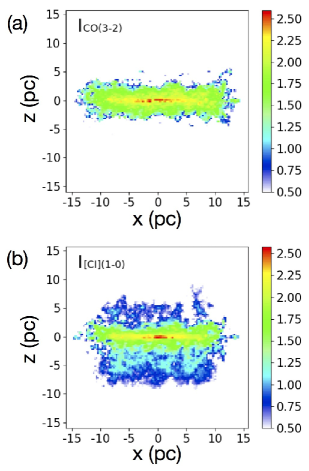
Figure 19 shows the edge-on distributions of the simulated integrated intensities of CO(3–2) and [C I](1–0) emission lines. This reinforces our argument that the diffuse atomic gas traced by the [C I](1–0) is more extended along the -direction of the disk than the dense molecular gas traced by the CO(3–2) at this spatial scale ( pc), which is due to the atomic outflows in our model. On the other hand, one can recognize that the most intense part of the [C I](1–0) distribution essentially traces the same region as the CO(3–2) distribution. Note that the hydrogen (H2 + H I) volume density in the disk mid-plane ( cm-3) is times higher than that of the spatially/vertically-extended region ( cm-3, Wada et al., 2016). Thus, the line-emitting region can be divided into the following two parts:
-
•
pc: atomic gas and molecular gas coexist. Turbulence due to the failed winds determines the geometrical thickness of this region. The observed CO(3–2) line profile, as well as the central Gaussian component of the [C I](1–0) line profile (Figure 18) reflect this component.
-
•
pc: preferentially seen in the [C I](1–0) emission, not in the CO(3–2) emission. The AGN-driven outflows, which are selectively seen in the ionized and atomic gas phase, are responsible for producing this geometrically thick structure in the [C I](1–0) distribution.
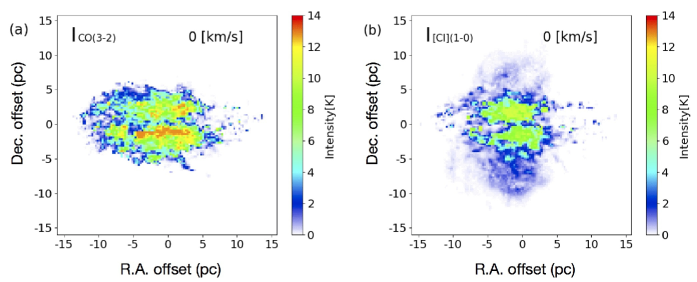
Figure 20 shows simulated channel maps of (a) CO(3–2) intensity and (b) [C I](1–0) intensity at the systemic velocity of this galaxy with (the best-fit value to reproduce the IR SED of Circinus with our model; Wada et al., 2016). For both the CO(3–2) and the [C I](1–0), the bulk of the emission comes from the region outlined by the CO(3–2) distribution. This region corresponds to the geometrically thin mid-plane of the CND, if viewed from the edge-on angle (Figure 19); therefore, we call this the inclined thin disk. Owing to the high inclination adopted here, we are still able to see the spatially extended (or vertically elongated along the -direction due to outflows) component besides the inclined thin disk in the [C I](1–0) map (Figure 20b). As the outflows would have coherent velocities, we expect that blueshifted and redshifted components with such velocities can be superposed on a simple Gaussian profile in the simulated [C I](1–0) line profile, which is confirmed in the analysis below.
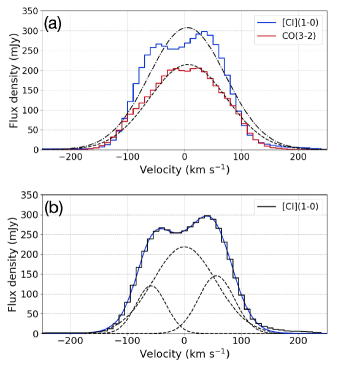
Figure 21a therefore exhibits how the [C I](1–0) and CO(3–2) line profiles appear when viewed with based on our model (see also Table 7 for the results of the Gaussian fits). The simulated CO(3–2) profile that basically reflects the rotating mid-plane component of the inclined thin disk can be explained by a single Gaussian, as expected, whereas deviation from a single Gaussian is evident in the case of the [C I](1–0) profile. The [C I](1–0) outflows are then clearly manifested in the three components Gaussian fit to the spectrum (Figure 21b). The blueshifted and redshifted features emerge at around the coherent outflow velocity of km s-1 in our model. Hence, we here suggest that (i) this qualitative difference between the CO(3–2) and the [C I](1–0) line profiles, i.e., the existence of the additional two components to the single Gaussian profile in the case of the [C I](1–0), as well as (ii) the centroid velocities of these outflow components, are consistent with the observed profiles (Figure 11b and 18). Note that the amplitudes of the model components are smaller than, and the relative strengths among the three [C I](1–0) components are somewhat different from, the observed ones (see Tables 6 and 7). These discrepancies can be reconciled by adjusting some input parameters of the model (e.g., AGN luminosity, ), which are generally associated with considerable uncertainties. Lastly, we found that the outflow velocities of the [C I](1–0) implied by our observations ( and km s-1; Figure 18) will not significantly exceed the escape velocity () from the vicinity of this AGN 888Even if we only consider the gravitational potential induced by the central SMBH, we will obtain high escape velocities of km s-1 at pc and 70 km s-1 at pc, for example. Moreover, if we indeed use the found at the innermost few pc region in this work ( km s-1; Figure 16), we will also obtain a rather high of km s-1.. Thus a significant fraction of the gas carried by those winds will eventually fall back to the disk as failed winds. Therefore, given these consistencies, we conclude that our results support the view that a radiation-driven fountain including outflows indeed functions in the central region of Circinus to form a geometrically thick structure, which would explain the physical origin of its torus.
| Peak | Centroid | FWHM | |
| (mJy beam-1) | (km s-1) | (km s-1) | |
| Single Gaussian | |||
| CO(3–2) | 214.7 4.1 | 6.5 1.0 | 158.6 2.3 |
| [C I](1–0) | 307.8 8.7 | 5.1 2.2 | 158.3 5.2 |
| Triple Gaussians to the [C I](1–0) line | |||
| Central | 218.4 0.4 | 0† | 130.7 0.1 |
| Blueshifted | 120.0 0.3 | -58.5 0.1 | 62.9 0.1 |
| Redshifted | 145.9 0.3 | 56.2 0.1 | 74.0 0.1 |
7 Summary
Our high-resolution ALMA observations of the CO(3–2) (5.9 pc 4.9 pc resolution) and the [C I](1–0) (14.5 pc 13.4 pc resolution) emission lines toward the CND of the Circinus galaxy revealed a wealth of detail about the atomic/molecular torus. In particular, we compared the observed results with predictions based on our multi-phase dynamic torus model, where the circulation of outflows, failed winds, and inflows of multi-phase gas jointly and virtually constitute a geometrically thick structure that can replace the classic torus. The main findings of this work are summarized as follows:
-
1.
Both Band 7 (351 GHz) and 8 (492 GHz) continuum emission was detected at the CND and spiral arms in the central 200 pc region of Circinus; these trace thermal dust emission. The CND appears as the inner extension of the larger scale spiral arms and traces the radially farther region than the warm dust distribution seen in the /F814 flux ratio map. This manifests the existence of a temperature-dependent circumnuclear dust structures.
-
2.
The double Gaussian fit to the Band 7 continuum visibility data suggested a compact polar elongation at this submm wavelength, in addition to a bright part of the extended CND. The size and orientation of the submm polar elongation are consistent with those seen at the MIR wavelength, which challenges the classic torus paradigm.
-
3.
The CND traced by both the CO(3–2) line (743 pc 341 pc, PA = 212) and the [C I](1–0) line emission carries a huge amount of H2 gas of , with a beam-averaged column density of cm-2. This would contribute significantly to the Compton thickness of this AGN once beam dilution is corrected for, i.e., the CND plays an important role as a part of a nuclear obscurer or a torus.
-
4.
We found an increasing trend of the [C I](1–0)/CO(3–2) line ratio in positions closer to the AGN. The ratio at the AGN position (brightness temperature scale; 14.5 pc 13.4 pc aperture) is , which is significantly higher than those observed in nearby starburst galaxies, for example. One possible explanation would be the XDR chemistry, where the AGN radiation efficiently dissociates CO molecules.
-
5.
We decomposed the velocity fields traced by the CO(3–2) and the [C I](1–0) emission lines into intrinsic rotational velocities () and dispersions () with tilted rings. The profile (an indicator of the disk aspect ratio) based on the full-resolution CO(3–2) cube suggests that the dense molecular gas disk is geometrically thin (ratio ) at pc, whereas the ratio increases to at pc. Within the qualitative framework of our model, the latter moderate thickness of the molecular disk at this spatial scale is consistent with a view that the material is puffed up due to the turbulence induced by the AGN-driven failed winds.
-
6.
We found a possible indication of nuclear Keplerian rotational motion in the full-resolution CO(3–2) data. As the associated uncertainties are large, however, higher-resolution observations are mandatory to make a firmer conclusion.
-
7.
The ratio of the [C I](1–0) velocity field at pc is significantly higher than that probed by the CO(3–2) line (the -range and the beam sizes are matched). This indicates that the diffuse atomic gas is extended in a geometrically thicker structure than the dense molecular gas, i.e., the torus has a multi-phase dynamic structure. According to our model, outflows preferentially seen at ionized and atomic gas are the prime driver of this geometrically thick atomic disk at the nuclear scale.
-
8.
We simulated detailed CO(3–2) and [C I](1–0) distributions and their line properties based on our multi-phase dynamic torus model. We showed that the [C I](1–0) emission is indeed spatially more extended along the vertical direction of the disk than the CO(3–2) emission. The simulated [C I](1–0) line shows a deviation from a single Gaussian profile due to nuclear outflows, which is indeed consistent with the observed [C I](1–0) spectrum. The modest outflow velocity indicates that a significant fraction of the wind mass will fall back to the disk, i.e., failed winds, as expected in our model to function the fountain process.
Given various consistencies between the observations and our model predictions, we support the validity of the radiation-driven fountain scheme at the central region of Circinus, which would explain the long-lasting mystery, the physical origin of the AGN torus.
References
- Aalto et al. (1991) Aalto, S., Johansson, L. E. B., Booth, R. S., & Black, J. H. 1991, A&A, 249, 323
- Aalto et al. (2017) Aalto, S., Muller, S., Costagliola, F., et al. 2017, A&A, 608, 22
- Alonso-Herrero et al. (2018) Alonso-Herrero, A., Pereira-Santaella, M., García-Burillo, S., et al. 2018, ApJ, 859, 144
- Antonucci (1993) Antonucci, R. 1993, ARA&A, 31, 473
- Arévalo et al. (2014) Arévalo, P., Bauer, F. E., Puccetti, S., et al. 2014, ApJ, 791, 81
- Asmus et al. (2014) Asmus, D., Hönig, S. F., Gandhi, P., et al. 2014, MNRAS, 439, 1648
- Asmus et al. (2016) Asmus, D., Hönig, S. F., Gandhi, P., et al. 2016, ApJ, 822, 109
- Bayet et al. (2004) Bayet, E., Gerin, M., Phillips, T. G., & Contursi, A. 2004, A&A, 427, 45
- Bolatto et al. (2013) Bolatto, A. D., Wolfire, M., & Leroy, A. K. 2013, ARA&A, 51, 207
- Buchner et al. (2015) Buchner, J., Georgakakis, A., & Nandra, K., et al. 2015, ApJ, 802, 89
- Burtscher et al (2013) Burtscher, L., Meisenheimer, K., Tristram, K. R. W., et al. 2013, A&A, 558, A149
- Casey et al. (2014) Casey, C. M., Narayanan, D., & Cooray, A. 2014, Phys. Rep., 541, 45
- Clarke et al. (1998) Clarke, C. J., Kinney, A. L., & Pringle, J. E. 1998, ApJ, 495, 189
- Clemens et al. (2013) Clemens, M. S., Negrello, M., De Zotti, G., et al. 2013, MNRAS, 433, 695
- Curran et al. (1998) Curran, S. J., Johansson, L. E. B., Rydbeck, G., & Booth, R. S. 1998, A&A, 338, 863
- Curran et al. (1999) Curran, S. J., Rydbeck, G., Johansson, L. E. B., & Booth, R. S. 1999, A&A, 344, 767
- Curran et al. (2001) Curran, S. J., Johansson, L. E. B., Bergman, P., et al. 2001, A&A, 367, 457
- Curran et al. (2008) Curran, S. J., Koribalski, B. S., & Bains, I. 2008, MNRAS, 389, 63
- Davies et al. (2007) Davies, R. I., Müller Sánchez, F., Genzel, R., et al. 2007, ApJ, 671, 1388
- de Vaucouleurs et al. (1991) de Vaucouleurs, G., de Vaucouleurs, A., Corwin, Jr., et al. 1991, Third Reference Catalogue of Bright Galaxies. Vol III: Data for galaxies between 12h and 24h (New York: Springer)
- Di Teodoro & Fraternali (2015) Di Teodoro, E. M., & Fraternali, F. 2015, MNRAS, 451, 3021
- Downes & Solomon (1998) Downes, D., & Solomon, P. M. 1998, ApJ, 507, 615
- Draine (2011) Draine, B. T. 2011, Physics of the Interstellar and Intergalactic Medium (Princeton, NJ: Princeton Univ. Press)
- Elitzur & Shlosman (2006) Elitzur, M., & Shlosman, I. 2006, ApJ, 648, L101
- Elitzur & Ho (2009) Elitzur, M., & Ho, L. C. 2009, ApJ, 701, L91
- Elmouttie et al. (1998a) Elmouttie, M., Haynes, R. F., Jones, et al. 1998a, MNRAS, 297, 1202
- Elmouttie et al. (1998b) Elmouttie, M., Krause, M., Haynes, R. F., & Jones, K. L. 1998b, MNRAS, 300, 1119
- Espada et al. (2017) Espada, D., Matsushita, S., Miura, R. E., et al. 2017, ApJ, 843, 136
- Esquej et al. (2014) Esquej, P., Alonso-Herrero, A., González-Martín, O., et al. 2014, ApJ, 780, 86
- Freeman et al. (1977) Freeman, K. C., Karlsson, B., Lynga, G., et al. 1977, A&A, 55, 445
- Gallimore et al. (2016) Gallimore, J. F., Elitzur, M., Maiolino, R., et al. 2016, ApJ, 829, L7
- García-Burillo et al. (2016) García-Burillo, S., Combes, F., Ramos Almeida, C., et al. 2016, ApJ, 823, L12
- Glover et al. (2015) Glover, S. C. O., Clark, P. C., Micic, M., & Molina, F. 2015, MNRAS, 448, 1607
- Granato & Danese (1994) Granato, G. L., & Danese, L. 1994, MNRAS, 268, 235
- Greenhill et al. (1997) Greenhill, L. J., Ellingsen, S. P., Norris, R. P., et al. 1997, ApJ, 474, L103
- Greenhill et al. (2003) Greenhill, L. J., Booth, R. S., Ellingsen, S. P., et al. 2003, ApJ, 590, 162
- Guainazzi et al. (1999) Guainazzi, M., Matt, G., Antonelli, L. A., et al. 1999, MNRAS, 310, 10
- Hagiwara et al. (2013) Hagiwara, Y., Miyoshi, M., Doi, A., Horiuchi, S. 2013, ApJ, 768, 38
- Harnett et al. (1990) Harnett, J. I., Whiteoak, J. B., Gardner, F. F., et al. 1990, MNRAS, 244, 130
- Hitschfeld et al. (2008) Hitschfeld, M., Aravena, M., Kramer, C., et al. 2008, A&A, 479, 75
- Hollenbach & Tielens (1999) Hollenbach, D. J., & Tielens, A. G. G. M. 1999, Reviews of Modern Physics, 71, 173
- Hönig et al. (2006) Hönig, S. F., Beckert, T., Ohnaka, K., & Weigelt, G. 2006, A&A, 452, 459
- Ikeda et al. (1999) Ikeda, M., Maezawa, H., Ito, T., et al. 1999, ApJ, 527, L59
- Ikeda et al. (2002) Ikeda, M., Oka, T., Tatematsu, K., et al. 2002, ApJS, 139, 467
- Imanishi & Wada (2004) Imanishi, M., & Wada, K. 2004, ApJ, 617, 214
- Imanishi et al. (2016) Imanishi, M., Nakanishi, K., & Izumi, T. 2016, ApJ, 822, L10
- Imanishi et al. (2018) Imanishi, M., Nakanishi, K., & Izumi, T. 2018, ApJ, 853, L25
- Israel (1992) Israel, F. P. 1992, A&A, 265, 487
- Israel & Baas (2001) Israel, F. P., & Baas, F. 2001, A&A, 371, 433
- Israel & Baas (2003) Israel, F. P., & Baas, F. 2003, A&A, 404, 495
- Israel et al. (2006) Israel, F. P., Tilanus, R. P. J., & Baas, F. 2006, A&A, 445, 907
- Israel et al. (2015) Israel, F. P., Rosenberg, M. J. F., van der Werf, P. 2015, A&A, 578, A95
- Izumi et al. (2013) Izumi, T., Kohno, K., Martín, S., et al. 2013, PASJ, 65, 100
- Izumi et al. (2016) Izumi, T., Kawakatu, N., & Kohno, K. 2016, ApJ, 827, 81
- Izumi et al. (2017) Izumi, T., Kohno, K., Fathi, K., et al. 2017, ApJ, 845, L5
- Jaffe et al. (2004) Jaffe, W., Meisenheimer, K., Röttgering, H. J. A., et al. 2004, Nature, 429, 47
- Jones et al. (1999) Jones, K. L., Koribalski, B. S., Elmouttie, M., Haynes, R. F. 1999, MNRAS, 302, 649
- Kaufman et al. (1999) Kaufman, M. J., Wolfire, M. G., Hollenbach, D. J. & Luhman, M. L. 1999, ApJ, 527, 795
- Krips et al. (2016) Krips, M., Martín, S., Sakamoto, K., et al. 2016, A&A, 592, L3
- López-Gonzaga et al. (2016) López-Gonzaga, N., Burtscher, L., Tristram, K. R. W., et al. 2016, A&A, 591, A47
- Maiolino et al. (2000) Maiolino, R., Alonso-Herrero, A., Anders, S., et al. 2000, ApJ, 531, 219
- Maloney et al. (1996) Maloney, P. R., Hollenbach, D. J., & Tielens, A. G. G. M. 1996, ApJ, 466, 561
- Marconi et al. (1994) Marconi, A., Moorwood, A. F. M., Origlia, L., & Oliva, E. 1994, ESO, The Messenger, 78, 20
- Martí-Vidal et al. (2014) Martí-Vidal, I., Vlemmings, W. H. T., Muller, S., et al. 2014, A&A, 563, A136
- Matt et al. (1996) Matt, G., Fiore, F., Perola, G. C., et al. 1996, MNRAS, 281, L69
- Matt et al. (1999) Matt, G., Guainazzi, M., Maiolino, R., et al. 1999, A&A, 341, L39
- McMullin et al. (2007) McMullin, J. P., Waters, B., Schiebel, D., et al. 2007, in Astronomical Society of the Pacific Conference Series, Vol. 376, Astronomical Data Analysis Software and Systems XVI, ed. R. A. Shaw, F. Hill, & D. J. Bell, 127
- Meijerink & Spaans (2005) Meijerink, R., & Spaans, M. 2005, A&A, 436, 397
- Mezcua et al. (2016) Mezcua, M., Prieto, M. A., Fernández-Ontiveros, J. A., Tristram, K. R. W. 2016, MNRAS, 457, L94
- Miyamoto et al. (2018) Miyamoto, Y., Seta, M., Nakai, N., et al. 2018, PASJ, 70, L1
- Moorwood & Glass (1984) Moorwood, A. F. M., & Glass, I. S. 1984, A&A, 135, 281
- Moorwood et al. (1996) Moorwood, A. F. M., Lutz, D., Oliva, E., et al. 1996, A&A, 315, L109
- Müller Sánchez et al. (2006) Müller Sánchez, F., Davies, R. I., Eisenhauer, F., et al. 2006, A&A, 454, 481
- Murphy et al. (2010) Murphy, T., Sadler, E. M., Ekers, R. D., et al. 2010, MNRAS, 402, 2403
- Nagar & Wilson (1999) Nagar, N. M., & Wilson, A. S. 1999, ApJ, 516, 97
- Nenkova et al. (2002) Nenkova, M., Ivezić, Ž., & Elitzur, M. 2002, ApJ, 570, 9
- Nenkova et al. (2008a) Nenkova, M., Sirocky, M. M., Ivezić, Ž., & Elitzur, M. 2008a, ApJ, 685, 147
- Nenkova et al. (2008b) Nenkova, M., Sirocky, M. M., Nikutta, R., et al. 2008b, ApJ, 685, 160
- Ojha et al. (2001) Ojha, R., Stark, A. A., Hsieh, H. H., et al. 2001, ApJ, 548, 253
- Oka et al. (2005) Oka, T., Kamegai, K., Hayashida, M., et al. 2005, ApJ, 623, 889
- Oliva et al. (1994) Oliva, E., Salvati, M., Moorwood, A. F. M., & Marconi, A. 1994, A&A, 288, 457
- Oliva et al. (1998) Oliva, E., Marconi, A., Cimatti, A., di Serego Alighieri, S. 1998, A&A, 329, L21
- Pier & Krolik (1992) Pier, E. A., & Krolik, J. H. 1992, ApJ, 401, 99
- Pier & Krolik (1993) Pier, E. A., & Krolik, J. H. 1993, ApJ, 418, 673
- Plume et al. (2000) Plume, R., Bensch, F., Howe, J. E., et al. 2000, ApJ, 539, 133
- Sault et al. (1995) Sault, R. J., Teuben, P. J., & Wright, M. C. H. 1995, in Astronomical Society of the Pacific Conference Series, Vol. 77, Astronomical Data Analysis Software and Systems IV, ed. R. A. Shaw, H. E. Payne, & J. J. E. Hayes, 433
- Schartmann et al. (2005) Schartmann, M., Meisenheimer, K., Camenzind, M., et al. 2005, A&A, 437, 861
- Schartmann et al. (2008) Schartmann, M., Meisenheimer, K., Camenzind, M., et al. 2008, A&A, 482, 67
- Schartmann et al. (2014) Schartmann, M., Wada, K., Prieto, M. A., et al. 2014, MNRAS, 445, 3878
- Schinnerer et al. (2013) Schinnerer, E., Meidt, S. E., Pety, J., et al. 2013, ApJ, 779, 42
- Shimajiri et al. (2013) Shimajiri, Y., Sakai, T., Tsukagoshi, T., et al. 2013, ApJ, 774, L20
- Solomon & Vanden Bout (2005) Solomon, P. M., & Vanden Bout, P. A. 2005, ARA&A, 43, 677
- Stalevski et al. (2012) Stalevski, M., Fritz, J., Baes, M., et al. 2012, MNRAS, 420, 2756
- Stalevski et al. (2017) Stalevski, M., Asmus, D., & Tristram, K. R. W. 2017, MNRAS, 472, 3854
- Suzuki et al. (1992) Suzuki, H., Yamamoto, S., Ohishi, M., et al. 1992, ApJ, 392, 551
- Tully et al. (2009) Tully, R. B., Rizzi, L., Shaya, E. J., et al. 2009, AJ, 138, 323
- Tristram et al. (2007) Tristram, K. R. W., Meisenheimer, K., Jaffe, W., et al. 2007, A&A, 474, 837
- Tristram et al. (2014) Tristram, K. R. W., Burtscher, L., Jaffe, W., et al. 2014, A&A, 563, A82
- Urry & Padovani (1995) Urry, C. M., & Padovani, P. 1995, PASP, 107, 803
- Veilleux & Bland-Hawthorn (1997) Veilleux, S., & Bland-Hawthorn, J. 1997, ApJ, 479, L105
- Viti et al. (2014) Viti, S., García-Burillo, S., Fuente, A., et al. 2014, A&A, 570, 28
- Wada & Norman (2002) Wada, K., & Norman, C. A. 2002, ApJ, 566, L21
- Wada et al. (2009) Wada, K., Papadopoulos, P. P., & Spaans, M. 2009, ApJ, 702, 63
- Wada (2012) Wada, K. 2012, ApJ, 758, 66
- Wada (2015) Wada, K. 2015, ApJ, 812, 82
- Wada et al. (2016) Wada, K., Schartmann, M., & Meijerink, R. 2016, ApJ, 828, L19
- Wada et al. (2018) Wada, K., Fukushige, R., Izumi, T., & Tomisaka, K. 2018, ApJ, 852, 88 (Paper-1)
- Walter et al. (2011) Walter, F., Weiß, A., Downes, D., et al. 2011, ApJ, 730, 18
- Weiß et al. (2005) Weiß, A., Downes, D., Henkel, C., & Walter, F. 2005, A&A, 429, L25
- Wilson et al. (2000) Wilson, A. S., Shopbell, P. L., Simpson, C., et al. 2000, AJ, 120, 1325
- Zhang et al. (2014) Zhang, Z.-Y., Henkel, C., Gao, Y., et al. 2014, A&A, 568, 122
- Zschaechner et al. (2016) Zschaechner, L. K., Walter, F., Bolatto, A., et al. 2016, ApJ, 832, 142
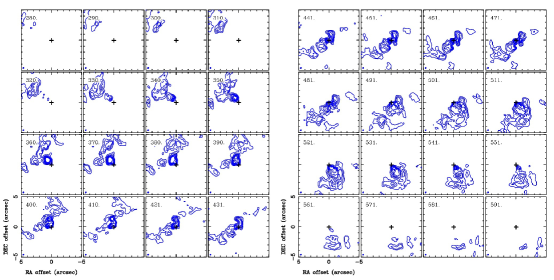
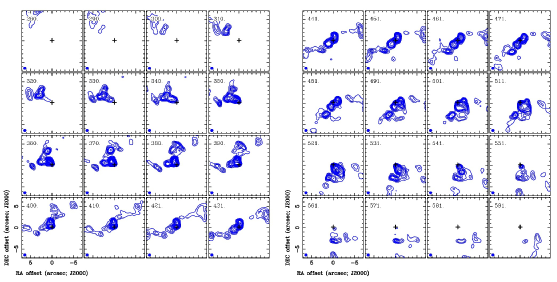
Velocity channel maps of the CO(3–2) and [C I](1–0) emission lines are shown here. These exhibit the circumnuclear spatial structures, including the CND and the three spiral arms (see also Figures 6 and 13).