Impact of cardio-synchronous brain pulsations on
Monte Carlo calculated doses for synchrotron
micro- and mini-beam radiation therapy
Abstract
Purpose: To assess the effects of brain movements induced by heartbeat on dose distributions in synchrotron micro- and mini-beam radiaton therapy and to develop a model to help guide decisions and planning for future clinical trials.
Methods: The Monte Carlo code PENELOPE was used to simulate the irradiation of a human head phantom with a variety of micro- and mini-beam arrays, with beams narrower than m and above m, respectively, and with radiation fields of cmcm and cmcm. The dose in the phantom due to these beams was calculated by superposing the dose profiles obtained for a single beam of mcm. A parameter , accounting for the total displacement of the brain during the irradiation and due to the cardio-synchronous pulsation, was used to quantify the impact on peak-to-valley dose ratios and the full-width at half-maximum.
Results: The difference between the maximum (at the phantom entrance) and the minimum (at the phantom exit) values of the peak-to-valley dose ratio reduces when the parameter increases. The full-width at half-maximum remains almost constant with depth for any value. Sudden changes in the two quantities are observed at the interfaces between the various tissues (brain, skull and skin) present in the head phantom. The peak-to-valley dose ratio at the center of the head phantom reduces when increases, remaining above 70% of the static value only for mini-beams and smaller than m.
Conclusions: Optimal setups for brain treatments with synchrotron radiation micro- and mini-beam combs depend on the brain displacement due to cardio-synchronous pulsation. Peak-to-valley dose ratios larger than 90% of the maximum values obtained in the static case occur only for mini-beams and relatively large dose rates.
I Introduction.
Glioblastoma is the most frequent brain tumor in adult population, with 2-3 cases in one hundred thousand habitants per yearNIH-stats . It is a neuroectodermal malign neoplasm of the central nervous system, which shows a very fast growth, rapidly evolving to patient death, and that is considered by the World Health Organization as the most aggressive form of astrocity tumor WOH-GB . Its treatment requires the delivery of high doses at an extended region around the tumor what may involve an unacceptable harm to healthy tissues Arraez2003 .
A possible strategy to overcome this limitation is to use a combination of radiation fields of submillimetric size with a spatial fractionation of the dose as in micro-beam (MRT) and mini-beam (MBRT) radiation therapies. MRT uses beams narrower than m with center-to-center (c-t-c) distances of 200 or m. The most commonly used combination and the one retained for future clinical trials is m-wide beams spaced by m Nettelbeck2009 ; Brauer2010 ; IMRovira2010 ; IMRovira2011 . MBRT involves beams with sizes above m and a c-t-c distance a factor two larger Dilmanian2006 ; Prezado2009 . Contrary to conventional radiotherapy, the dose profiles in MBRT and MRT consist of peaks and valleys and high values of the peak-to-valley dose ratio (PVDR) are required for the specificity of the treatment: low valley doses in order to spare the normal tissues and high peak doses to achieve tumour control Dilmanian2002 . For given values of the peak width and the c-t-c, homogeneous irradiations of the tumor region can be obtained by using various incidence directions.
MRT and MBRT have been shown to significantly increase the normal tissue resistance: peak doses higher than Gy, in one fraction irradiating the whole brain, are well tolerated by rat and mice brains Laissue2001 ; Dilmanian2006 ; Serduc2006 ; Deman2012 ; Prezado2015 , in comparison with around 20 Gy in conventional seamless irradiation Calvo1988 . In addition, significant tumor growth delay in aggressive animal tumor models was observed Laissue2001 ; Dilmanian2006 ; Serduc2006 ; Deman2012 ; Prezado2015 . Although a homogeneous tumor coverage would be preferred, numerous previous works in spatially fractionated techniques showed that tumor control can be obtained even with inhomogeneous dose distributions and high PVDR in the tumor Laissue1998 ; Serduc2009 ; Bouchet2010 ; Zwicker2004 . The tumoricidal effect of these techniques may be ascribed to the participation of some mechanism other than a direct death of tumor cells or the supression of their reproductive capacity, such as the induction of a denudation of the tumor vessel endothelium, tumor hypoxia Bouchet2013 , a decrease in tumor blood volume Bouchet2010 ; Bouchet2013 or bystander effect/cellular communication Crosbie2010 . These techniques could be also used as a boost, in addition to conventional radiotherapy treatment, aiming at increasing the dose in the tumor without dramatically enhancing the deleterious side effects.
These promising radiotherapy approaches are nowadays being explored at the European Synchrotron Radiation Facility (ESRF) Brauer2015 , the Brookhaven National Laboratory Dilmanian2006 and the Australian Synchrotron AusSync .
However, one of the most important limitations to exploit MRT and MBRT in brain tumor treatments may be the blurring of the dose distributions due to cardio-synchronous pulsations. As the maximum speed reached by the brain due to heartbeat is mm s-1, extremely high dose rates are required to avoid the consequent beam smearing that would jeopardize the tissue sparing effect of the smallest micro-beams. In particular, at ESRF, dose rates above Gy s-1 can be employed Brauer2005 .
Despite this, a quantitative analysis of the effect of the cardio-synchronous pulsations and the brain movement they imply has not been carried out yet. The aim of this work was to determine how that brain movement affects the dose distribution in MRT and MBRT. For this purpose we carried out Monte Carlo simulations of the brain irradiation for different configurations described in the literature as feasible therapy strategies. To do that we assumed a constant brain movement velocity and determined how this affects the photon beam profiles entering the irradiated organ. The analysis was done in terms of a parameter that provides the full organ displacement and is related to that velocity, the dose at the phantom entrance and the beam dose rate. By choosing the largest organ velocity found in the literature, a maximum limit for the effects of interest was evaluated. This may be used by MRT and MBRT practitioners to fix minimum dose rates and/or doses at the patient entrance in actual clinical situations or to determine the blurring level that can expected according to the specific dose and dose rate available at their facilities.
II Materials and methods.
II.1 Monte Carlo simulation
Simulations performed in this work were carried out with the Monte Carlo code PENELOPE (v. 2014) salvat . This is a general purpose code that permits to simulate the coupled transport of electrons, photons and positrons, with energies from 10 eV to 1 GeV, in any material geometry. Its ability to simulate in the low energy range makes this code particularly suitable for MRT and MBRT simulation.
Photon interactions are simulated in a detailed way. For electrons and positrons, PENELOPE makes use of a mixed simulation scheme, where interactions are classified as hard or soft. Hard events are simulated as photon interactions, one by one in a chronological way; all soft events between two hard interactions are grouped and described by means of a multiple scattering theory. The electron transport in each material is controlled by five parameters. controls the average angular deflection produced by the soft interactions between two consecutive hard events; is the maximum average fraction of energy lost between two consecutive hard interactions, and and define the threshold energies to discriminate between hard and soft interactions. Electron inelastic collisions in which the energy lost is bigger than and/or radiative interactions with an energy loss bigger than are considered hard events. A fifth parameter, , defines the maximum length that the electron can travel between two hard interactions. In our simulations the values selected for these parameters as well as for the electron and photon absorption energies were , keV, keV, keV, and was fixed to 1/10 of the characteristic dimension of each material element in the geometry, all of them within the range recommended in the user manual salvat . PENELOPE has been used for dosimetry assessment in MRT IMRovira2010 ; IMRovira2011 ; IMRovira1 ; IMRovira2 and MBRT Prezado2009 ; prezado1 ; prezado2 .
II.2 Beam configurations
In this work photon parallel beams with radiation fields of size cmcm and cmcm were considered. They were micro- (figure 1a) or mini-beams (figure 1e) built up with several peaks that correspond to the regions of the dose profiles with the maximum dose. The peaks have a width ; the regions between two consecutive peaks are the “valleys”, whose width is . Thus, the c-t-c distance is given by . Note that for mini-beams, and c-t-c equals .

It is worth mentioning that, in the simulations carried out, the irradiation fields were assumed to be produced as a whole, including the complete peak structure. In those synchrotrons where the height of the beam is limited to less than one mm prezado11 ; prezado1 , the irradiation is done by scanning the target with the help of a motorized platform driven by a high precision goniometer. The dose rates considered in our simulations are supposed to be measured at the target position, using the same scanning procedure, therefore taking into account, at least partially, that translation prezado11 . In any case, the convolution of the scanning motion of the target with that produced by heart beats would make the fluence seen by the target to have a rather complicated pattern that would require an analysis involving a very detailed description of the global target motion, including the irradiation details of the specific facility. With this in mind the results we quote here may be considered as a first, overall, indication of the effects that cardio-synchronous pulsations produce in this type of treatments.
The energy spectrum of the photons entering the phantom is that of the ESRF ID17 Biomedical Beamline prezado1 ; IMRovira1 : it extends from about 50 to keV, is peaked at keV and has a mean energy of keV.
To simulate the different configurations, we assumed that each mini- and micro-beam was formed by the superposition of the adequate number of adjacent and parallel 1 m width beams. Then instead of simulating all the different beam configurations analyzed in the present work (see below), we simulated a single 1 m beam with initial photons. The dose profiles corresponding to the actual mini- and micro-beams analyzed were calculated by numerical superposition of those obtained in that simulation. Typically, the beam configurations studied include about beams of 1 m width and, as a consequence, the results obtained with our superposition procedure are equivalent to a simulation of the whole mini- and micro-beam with initial photons. This procedure permitted us an enormous saving of CPU time without requiring the use of variance reductions techniques to reach adequate statistics.
The verification of the superposition procedure was done by simulating the experimental setup described by Prezado et al. prezado2 and comparing the results obtained for PVDR and FWHM to those quoted by Prezado et al. prezado1 ; prezado2 Two reference mini-beams with 10 and 16 m peaks, respectively, were considered. The mini-beams impinged orthogonally onto the phantom surface. The phantom was a cylinder with cm of radius and a height of cm, filled with water. Scoring voxels of 1 m 2 cm 1 mm were considered to determine the dose profiles that were calculated in the direction, with the beam traveling along the axis.
II.3 Dosimetric parameters
Throughout this work, we have used the peak-to-valley dose ratio, PVDR, and the full-width at half-maximum, FWHM, to characterize the dose profiles at a certain depth in the phantom.
To calculate PVDR we proceeded as follows. First, for each peak in the profile, we determined the average peak dose by averaging over a region of width centered around the peak center. As we had peaks in the radiation field we got average values . The same was done for the valleys, but considering a region of dimension centered at the center of each valley. As we had valleys in the radiation field this gave us average values . Using these average values we calculate “local” PVDRs as . Finally, PVDR was calculated as the average of these local PVDRs:
| (1) |
As seen in figure 2, both peaks and valleys values vary from the center to the sides of the beam. This produces a variation in the local PVDR values that is much larger than the statistical (type A) uncertainty due to the Monte Carlo calculations (which is of the order of ). For that reason we assumed that this variability represents a type B uncertainty of PVDR that was determined as the standard deviation of the local PVDRs.

FWHM was determined as the average value of the FWHMs calculated for each one of the peaks in the profile. The corresponding uncertainties of FWHM were estimated in a way similar to that of PVDR.
From a biological point of view, PVDR is considered to be a very relevant dosimetric parameter Dilmanian2002 ; Brauer2005 . In fact, small values of PVDR imply a more uniform irradiation of healthy tissues and, therefore, a loss of the therapeutic advantage caused by the spatial fractioning characteristic of MRT/MBRT.
II.4 Brain irradiation
Dose distributions calculated in an anthropomorphic head phantom harling were used to evaluate the effect of the cardio-synchronous brain pulsations. Figure 3 shows the cuts at planes (left), (center) and (right) of this phantom. This is a mathematical model in which skin (thin black area), skull (dark gray) and brain (white) are described as ellipsoids. The phantom is surrounded by air and the source is situated at a distance of m from the phantom surface also inside air. The materials used are those included in the PENELOPE database for air, skin, dense bone (for the skull) and brain.
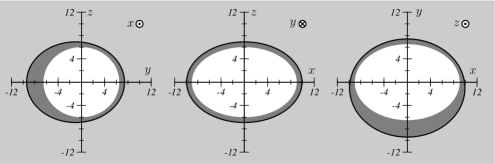
The reference system was centered at the geometrical center of the brain, with the axis oriented in the antero-posterior direction, the axis in cranio-caudal direction and the axis in the transverse direction. The scoring voxels used in the simulations of the m beam in this case were of 1 m 2 cm 2 mm in size. The beam traveled in the positive direction and the profiles were determined in the direction. In this geometry both static and dynamic conditions were considered.
As said above, the mini-beam configurations considered had a c-t-c of , with ; on the other hand, in the micro-beams analyzed the valley width was , with a c-t-c of .
In order to determine the effect of the brain movement, the dose rate, , the total dose delivered, , and the speed with which the target moves, , must be taken into account. In fact, the total displacement of the brain during the irradiation is given by
| (2) |
The moving target “sees” an apparent incident fluence as that sketched in figure 1b. Each micro- and mini-beam is then modified: an initial ramp with a width is followed by a central, constant, region with a width equals to and a final descending ramp again with width . The distance between the end of a peak and the beginning of the next one is . Due to the movement there are brain regions that are actually irradiated only during a fraction of the total irradiation time. As is assumed to be constant, the effect of this movement can be described by modifying the beam in order to include the linear ramps shown.
In practice, to simulate the brain movement, the coordinate of the photon incident in the phantom was sampled according to this apparent fluence distribution. The total dose was reconstructed as in the static case, that is from the dose due to a beam of 1m, but taking into account now the variation of the fluence indicated by the trapezoidal distributions shown in figure 1.
To investigate the effects of the brain movement on the various parameters of interest, we have considered dose rates between and Gy/s for MRT, the latter being an extreme value that would be of interest in some applications and that could be reached in XFEL facilities XFEL . In MBRT dose rates in the range Gy/s were analyzed. The doses at the phantom entrance may vary between and Gy in the case of micro-beams Brauer2010 , while for mini-beams doses up to Gy were considered Dilmanian2006 ; Prezado2009 . In what respect to the brain speed, a maximum cm/s was quoted in reference Poncelet1992 . Thus, this value would be the most unfavorable and we assumed it in all calculations discussed below. The range of values considered for the parameter was between m and m, the latter being the maximum brain shift during the whole heart cycle. In the case of MRT, some of the largest values, and m, were not considered to avoid the overlap of consecutive beam peaks. The static case is recovered for . The configurations analyzed for both MRT and MBRT are shown in table LABEL:tab:config.
| field size | (m) | (m) | c-t-c (m) | (m) | # of peaks | |
|---|---|---|---|---|---|---|
| MRT | cmcm | 25 | 175 | 200 | 0/40/80/120 | 50 |
| 50 | 350 | 400 | 0/40/80/120/240 | 25 | ||
| cmcm | 25 | 175 | 200 | 0/40/80/120 | 100 | |
| 50 | 350 | 400 | 0/40/80/120/240 | 50 | ||
| MBRT | cmcm | 600 | 600 | 1200 | 0/40/80/120/240/500 | 8 |
| 1000 | 1000 | 2000 | 0/40/80/120/240/500 | 5 | ||
| cmcm | 600 | 600 | 1200 | 0/40/80/120/240/500 | 16 | |
| 1000 | 1000 | 2000 | 0/40/80/120/240/500 | 10 |
III Results.
III.1 Reference simulations
Table LABEL:tab:tab1 shows the values we obtained for PVDR at different depths in water for beams including 10 and 16 peaks with m. Our results are statistically compatible with the experimental ones measured with radiochromic film by Prezado et al. prezado1 ; prezado2 The PVDR values obtained in the case of the beam with 10 peaks by these authors with simulations similar to ours are larger, at most, than those we have found with the superposition procedure. In any case, both results agree within the uncertainties.
| 10 peaks | 16 peaks | |||||||||
|---|---|---|---|---|---|---|---|---|---|---|
| PENELOPE | experimental | PENELOPE | experimental | |||||||
| depth (cm) | superposition | Ref. prezado2 | Ref. prezado2 | superposition | Ref. prezado1 | Ref. prezado1 | ||||
| 0.3 | ||||||||||
| 0.5 | ||||||||||
| 1.0 | ||||||||||
| 2.0 | ||||||||||
| 4.0 | ||||||||||
| 6.0 | ||||||||||
| 8.0 | ||||||||||
The contrary occurs for the beam with 16 peaks where the PVDR values quoted in reference prezado1 are smaller (between 5 and 6%) than ours. However, the uncertainties of the values found by Prezado et al. prezado1 are much smaller than those of our data. The reason for the large difference between the uncertainties of the results obtained in these two simulations may be ascribed to the fact that both peaks and valleys in the dose profile show a smooth gradient, the dose slightly reducing as one moves away from the center of the beam. As indicate above, this “intrinsic variability” has been included in our results and in those of reference prezado2 , but not in the calculation of reference prezado1 where the PVDR was estimated with the values in the central peak of the dose profile.
III.2 Brain irradiation
Figure 4 shows the variation with of the PVDR calculated for the different beam configurations analyzed (see table LABEL:tab:config). Left and right panels correspond to cmcm and cmcm fields, respectively. Apart from the sudden changes observed at the interfaces between the various tissues (brain, skull and skin) present in the head phantom, several aspects deserve to be pointed out. First, PVDR reduces as increases and this occurs at any depth in the phantom, independently of the head region (skin, skull or brain).
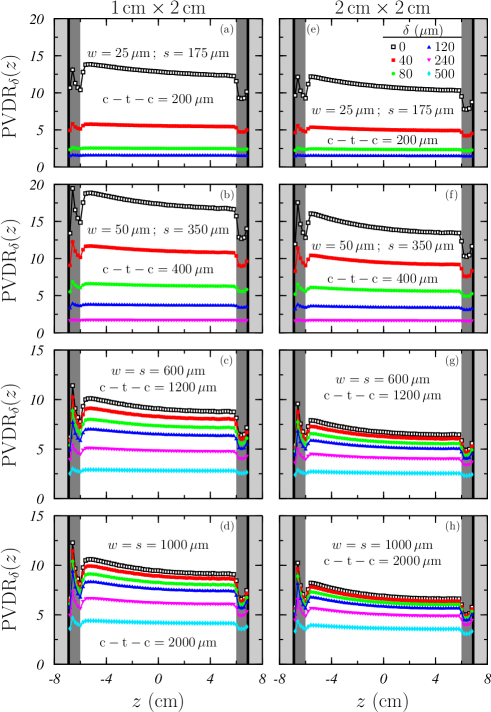
A more quantitative idea of this fact can be found from figure 5a. Therein the ratio between PVDR and the corresponding value in the static case, PVDR, is shown as a function of for the various configurations considered. It is worth noting that the ratios obtained for the cmcm field are slightly larger than those corresponding to the cmcm one. The reduction in PVDR within the brain is relatively smaller in the case of the largest field size or, in other words, the brain movement produces an effect smaller the larger the irradiation field is.
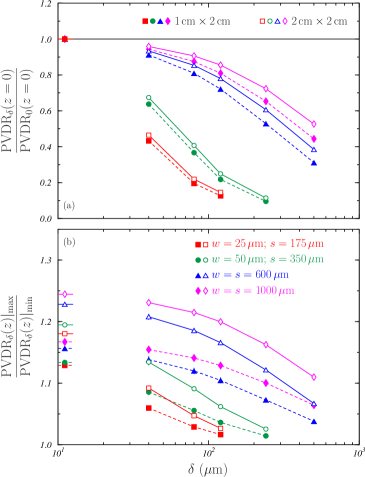
The effect of the brain movement is much more relevant in the case of the micro-beams. In fact, for we found for the beam with m (circles) and for that with m (squares), while for the two mini-beam configurations the ratio is above 0.9. This is due to the fact that in all situations the increase of produces an enhancement of the dose in the valleys. However, the dynamic regime for mini-beams is that described in figure 1f, while in the case of micro-beams the situation sketched in figure 1d is reached for high values: in that case an additional reduction of the peak height occurs. It is important noticing that a percentage above 70% of the PVDR value obtained in the static case is only found for mini-beams and values up to m; for micro-beams the PVDRs are below 70% of the static value in all irradiation configurations analyzed. Here it is then important how compares to the dose spatial fractioning that can be estimated with .
A second point deserving to be mentioned is that PVDR reduces with the depth inside the head phantom. This is so because the radiation scattered in the regions irradiated by the beam peaks reaches the initially non-irradiated valleys, increasing the dose. Figure 5b shows, for the various configurations analyzed, how the ratio between the maximum and minimum values of PVDR found inside the head phantom varies with . This ratio is larger for the cmcm field than for the cmcm one because the scatter radiation affects more the valleys for the largest field. On the other hand it diminishes when increases because the dose due to the scattered radiation, mainly that in the valleys, reduces more slowly than that in the peak regions. It is also seen how the differences between the ratios obtained for both radiation fields diminish when increases: as grows the difference in the amount of scattered radiation produced in each field becomes less significant compared to the effect of the brain movement.
The ratios obtained in the static case () are shown by the points in the left edge of figure 5b. All the results found for the largest field (open symbols) are above those obtained for the smallest one (solid symbols) and increase with . When , the variation is smaller than in the static case because the increase of the scatter radiation in the valleys is dominated by the dynamic shift modeled with the fluence ramps.
In figure 6, the variation of FWHMδ with is shown for the configurations listed in table LABEL:tab:config. In all cases, FWHMδ remains almost independent of the depth reached by the beam in the brain. In the case of the mini-beams considered (panels (c), (d), (g) and (h)), a slight enhancement as depth increases is observed for the configurations with the higher values. A similar trend was found also for the micro-beams, but it cannot be appreciated in panels (a), (b), (e) and (f) because of the scale of the figure. In summary, the variation of FWHMδ with the depth in the brain is almost negligible in the static case and remains below 3% for . This also makes the ratio to approach 1 as grows.
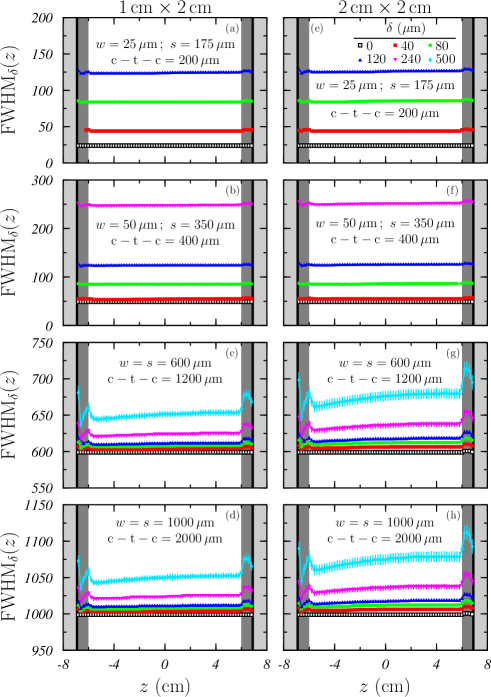
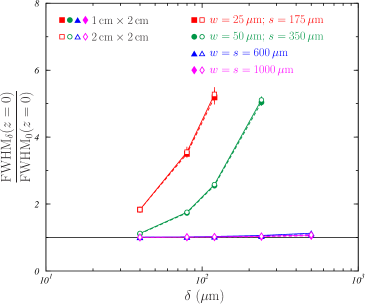
Micro- and mini-beams show a different behavior of the ratio . The results obtained for the beams studied are plotted in figure 7 as a function of . It can be seen that the ratio hardly varies with , remaining practically equal to unity, in the case of the mini-beams (triangles and diamonds). However, in the case of micro-beams (squares and circles), FWHMδ increases with and values up to 5 times those found in the static case are obtained. On the other hand, no differences are observed between the results corresponding to the two field sizes analyzed. This behavior is mainly due to the difference in the ratio between micro- and mini-beams.
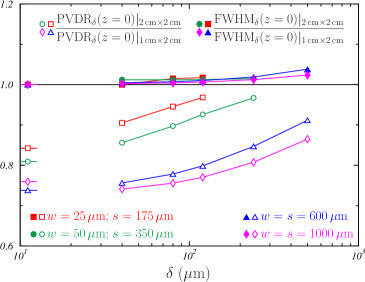
In figure 8, the results found for the two field sizes considered are compared by means of the ratios and . In the latter case (solid symbols), a very smooth enhancement is observed as increases, indicating that cmcm beams widen slightly more than the cmcm ones. The situation found for PVDRδ is different (see open symbols). Though it also enhances as increases, the effect is much more pronounced than for FWHMδ. But the more important point is that the values are below 1, indicating that PVDRδ is relatively larger in the case of the cmcm field. In fact, for the static case (see data on the left edge of the figure) goes down to values for the two mini-beams considered (open diamond and triangle). The increase in the field size, going from cmcm to cmcm, enhances the scattered radiation: this enhancement modifies very slightly the peak widths (having almost no effect on FWHM), but increases significantly the dose in the valleys, thus reducing PVDR values.
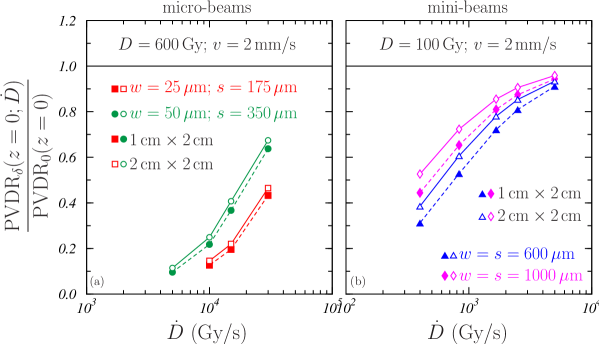
In figure 9 the ratio is shown as a function of the dose rate for various configurations of micro- and mini-beams. As expected according to the results shown in figure 5, and to the fact that and are inversely proportional, the ratio grows with the dose rate in all cases. For mini-beams, shown in panel (b), values close to 1 are reached for the highest dose rates considered. For micro-beams (left panel) PVDRδ is strongly affected: for dose rates of the order of Gy/s, only 50% of the value obtained in the static case is recovered and smaller dose rates produce much smaller PVDRδ values.
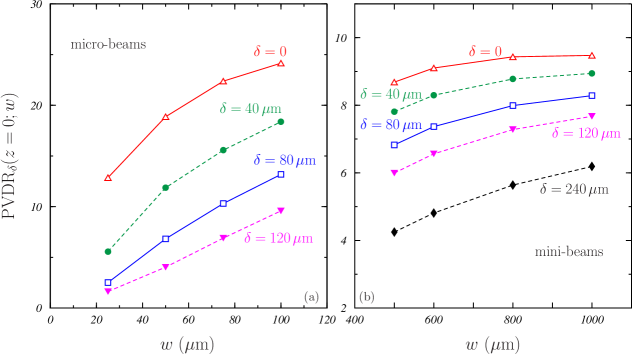
Finally, we have analyzed how PVDR depends on the beam width . In figure 10, the values of are shown versus this width for various values in the case of the cmcm beams. To make the results comparable, the number of beam peaks included has been chosen in order to cover the whole field size. For micro-beams, values of ranging between m (50 peaks) and m (12 peaks) have been considered; for mini-beams was varied from m to m, including between 10 and 5 peaks. In general PVDRδ grows with but tends to saturate; this is more clearly seen in the case of mini-beams (right panel). In this respect it is worth emphasizing that, in the configurations investigated, both c-t-c and grow with (see table LABEL:tab:config).
On the other hand it is also apparent how PVDRδ reduces as increases, reaching values about 60% of those found for the static case in the limiting value, which corresponds to the maximum shift of the brain during the whole cardiac cycle.
IV Conclusions.
The effect of the brain movement due to cardio-synchronous pulsation in the dosimetry of micro- and mini-beams of potential use in different radiotherapy treatments has been studied by means of Monte Carlo simulation with the code PENELOPE. The brain movement has been simulated by modifying the fluence of the beam incident onto the target. Specifically, the sharp limits of the peaks conforming the beams have been changed into linear ramps with a slope that depends on the total dose, the dose rate and the brain velocity through a parameter that represents the total displacement of the brain during irradiation ( in the static case). Various beam configurations have been analyzed.
An anthropomorphic head phantom has been considered to perform the dosimetry. The dose in the phantom has been reconstructed from the dose corresponding to a beam with a size of mcm and taking into account the corresponding beam fluences. The procedure has been checked by comparing the results obtained to those found for a complete beam and to other both experimental and simulated found in literature.
PVDR reduces as increases with the effect of the brain movement being more relevant for micro- than for mini-beams. It is also worth pointing out that PVDR shows a certain variability when it is calculated with the central peaks in the beam or with those situated at the extreme sides of it.
The variation of FWHM with the depth inside the brain region is very small, below 3%. for . However, while the values of FWHM remain practically identical to those of the static case for mini-beams, grow with for micro-beams, reaching values five times larger than those found for . This is due to the relatively large value of with respect to in micro-beams.
The PVDR values obtained for the cmcm field are larger than those found for the cmcm one: for low values the corresponding ratios are around 0.75 for mini-beams and above 0.8 for micro-beams. However, the FWHM are essentially the same for both field sizes. PVDR grows when the peak width increases and tends to saturate. However, for a given value, it reduces as increases.
PVDR increases with the dose rate for a given total dose value. In case of mini-beams, assuming the maximum total dose analyzed Gy, the values found for the static case are recovered at a 80% for dose rates of the order of Gy/s. In the micro-beams studied, 60% of the static PVDR values at most is reached for the highest dose rates analyzed and Gy.
In the calculations done in the present work, the brain velocity was chosen to be transverse to the direction of the peak and valley pattern of the beam and with its maximum published value Poncelet1992 . In this way we estimated the largest effects that cardio-synchronous brain movements may produce in the doses due to micro- and mini-beam radiotherapy. In any case, specific calculations for the particular cases of interest would be required to obtain quantitative detailed estimations of such doses.
Doses may be affected significantly by the cardio-synchronous pulsation in case of MRT and the application to humans of his technique would require the use of cardiac gating. On the other hand, the tumor control could be compromised if very high peak doses, well above Gy, are not used Serduc2009 . This implies the need to carry out biological studies that allow establishing the quantitative extent of the effects analyzed here.
MBRT doses are much less affected by the brain movement than MRT ones. In addition, lower doses seem to be required for a significant tumor control prezado2 ; Deman2012 . Then feasible brain treatments could be carried out with dose rates smaller than in MRT thus reducing patient safety requirements. This also makes more viable the transfer of the technique towards conventional equipments. In the case of very high dose rates, rather stricter requisites such as, e. g., those permitting to interrupt the irradiation in nanoseconds, may imply significant technical or engineering challenges.
The results our study may help MRT and MBRT clinicians to determine the optimal treatment parameters according to the capabilities of their facilities. Besides, our findings may be extrapolated to other anatomical regions with different movement velocities in a straightforward way.
Acknowledgements.
This work has been supported in part by the Junta de Andalucía (FQM0387), the European Regional Fund (ERDF) and by the Spanish Ministerio de Ciencia y Competitividad (FPA2015-67694-P). Conflict of interest The authors have no conflicts to disclose.References
- (1) National Cancer Institute. Cancer stat facts: brain and other nervous system cancer. Available at: https://seer.cancer.gov/statfacts/html/brain.html#risk
- (2) Louis DN, Perry A, Reifenberger G, et al. The 2016 World Health Organization classification of tumors of the central nervous system: a summary. Acta Neuropathol. 2016;131:803-820.
- (3) Arraez MA, Herruzo I, Acha T, Benavides M. Tumores del sistema nervioso central en el adulto y en la infancia. Madrid: Nova Sidonia; 2003.
- (4) Nettelbeck H, Takacs GJ, Lerch MLF, Rosenfeld AB. Microbeam radiation therapy: a Monte Carlo study of the influence of the source, multislit collimator and beam divergence on microbeams. Med Phys. 2009;36:447-456.
- (5) Bräuer-Krisch E, Serduc R, Siegbahn EA, et al. Effects of pulsed, spatially fractionated, microscopic synchrotron X-rays beams on normal and tumoral brain tissue. Mut Res. 2010;704:160-166.
- (6) Martínez-Rovira I, Sempau J, Fernández-Varea JM, et al. Monte Carlo dosimetry for forthcoming clinical trials in x-ray microbeam radiation therapy. Phys Med Biol. 2010;55:4375-4388.
- (7) Martínez-Rovira I, Prezado Y. Monte Carlo dose enhancement studies in microbeam radiation therapy. Med Phys. 2011;38:4430-4439.
- (8) Dilmanian FA, Zhong Z, Bacarian T, et al. Interlaced x-ray microplanar beams: A radiosurgery approach with clinical potential. Proc Natl Acad Sci U.S.A. 2006;103:9709-9714.
- (9) Prezado Y, Thengumpallil S, Renier M, Bravin A. X-ray energy optimization in minibeam radiation therapy. Med Phys. 2009;36:4897-4902.
- (10) Dilmanian FA, Button TM, Le Duc G, et al. Response of rat intracranial 9L gliosarcoma to microbeam radiation therapy. Neuro-Oncol. 2002;4:26-38.
- (11) Laissue JA, Blattmann H, Di Michiel M, et al. The weanling piglet cerebellum: a surrogate for tolerance to MRT (Microbeam Radiation Therapy) in pediatric neuro-oncology Proc SPIE 2001;4508:65-73.
- (12) Serduc R, Vérant P, Vial JC, et al. In vivo two-photon microscopy study of short-term effects of microbeam irradiation on normal mouse brain microvasculature. Int J Radiat Oncol Biol Phys. 2006;64:1519-1527.
- (13) Deman P, Vautrin M, Edouard M, et al. Monochromatic minibeams radiotherapy: From healthy tissue-sparing effect studies toward first experimental glioma bearing rats therapy. Int J Radiat Oncol Biol Phys. 2012;82:e693-e702.
- (14) Prezado Y, Deman P, Varlet P, et al. Tolerance to dose escalation in minibeam radiation therapy applied to normal rat brain: Long-term clinical, radiological and histopathological analysis. Radiat Res. 2015;184:314-321.
- (15) Calvo W, Hopewell JW, Reinhold HS, Yeung TK. Time-anddose-related changes in the white matter of the rat brain after single doses of x rays. Br J Radiol. 1988;61;1043-1052.
- (16) Laissue J A, Geiser G, Spanne PO, et al. Neuropathology of ablation of rat gliosarcomas and contiguous brain tissues using a microplanar beam of synchrotron-wiggler-generated x rays. Int J Cancer. 1998;78;654-660.
- (17) Serduc R, Bouchet A, Bräuer-Krisch E, et al. Synchrotron microbeam radiation therapy for rat brain tumor palliation-influence of the microbeam width at constant valley dose. Phys Med Biol. 2009;54:6711-6724.
- (18) Bouchet A, Lemasson B, Le Duc G, et al. Preferential effect of synchrotron microbeam radiation therapy on intracerebral 9L gliosarcoma vascular network. Int J Radiat Oncol Biol Phys. 2010;78:1503-1512.
- (19) Zwicker RD, Meigooni A, Mohiuddin M. Therapeutic advantage of grid irradiation for large single fractions. Int J Radiat Oncol Biol Phys. 2004;58:1309-1315.
- (20) Bouchet A, Lemasson B, Christen T, et al. Synchrotron microbeam radiation therapy induces hypoxia in intracerebral gliosarcoma but not in the normal brain. Radiother Oncol. 2013; 108:143-14 8.
- (21) Crosbie JC, Anderson RL, Rothkamm K, et al. Tumor cell response to synchrotron microbeam radiation therapy differs markedly from cells in normal tissues. Int J Radiat Oncol Biol Phys. 2010;77:886-894.
- (22) Bräuer-Krisch E, Requardt H, Régnard P, et al. Medical physics aspects of the synchrotron radiation therapies: Microbeam radiation therapy (MRT) and synchrotron stereotactic radiotherapy (SSRT) Phys Med. 2015;31:568-583.
- (23) Livingstone J, Adam J-F, Crosbie JC, et al. Preclinical radiotherapy at the Australian Synchrotron’s Imaging and Medical Beamline: Instrumentation, dosimetry and a small-animal feasibility study J Synchrotron Rad. 2017;24:854-865.
- (24) Bräuer-Krisch E, Requardt H, Régnard P, et al. New irradiation geometry for microbeam radiation therapy. Phys Med Biol. 2005;50:3103-3111.
- (25) Salvat F, Fernández-Varea JM, Sempau J. PENELOPE, a code system for Monte Carlo simulation of electron and photon transport. Barcelona: OECD Nuclear Energy Agency; 2014.
- (26) Prezado Y, Vautrin M, Martínez-Rovira I, et al. Dosimetry protocol for the forthcoming clinical trials in synchrotron stereotactic radiation therapy (SSRT). Med Phys. 2011;38:1709-1717.
- (27) Martínez-Rovira I, Sempau J, Prezado Y. Development and commissioning of a Monte Carlo photon beam model for the forthcoming clinical trials in microbeam radiation therapy. Med Phys. 2012;39:119-131.
- (28) Martínez-Rovira I, Sempau J, Prezado Y. Monte Carlo-based treatment planning system calculation engine for microbeam radiation therapy. Med Phys. 2012;39:2829-2838.
- (29) Prezado Y, Martínez-Rovira I, Thengumpallil S, Deman P. Dosimetry protocol for the preclinical trials in white-beam minibeam radiation therapy. Med Phys. 2011;38:5012-5020.
- (30) Prezado Y, Renier M, Bravin A. A new method of creating minibeam patterns for synchrotron radiation therapy: a feasibility study. J Synchrotron Rad. 2009;16:582-586.
- (31) Harling OK, Roberts KA, Moulin DJ, Rogus RD. Head phantoms for neutron capture therapy. Med Phys. 1995;22:579-583.
- (32) Serkez S, Geloni G, Tomin S, et al. Overview of options for generating high-brightness attosecond x-ray pulses at free-electron lasers and applications at the European XFEL. J Opt. 2018;20:024005.
- (33) Bräuer-Krisch E, Serduc R, Siegbahn EA, et al. Effects of pulsed, spatially fractionated, microscopic synchrotron X-ray beams on normal and tumoral brain tissue. Mutation Res. 2010;704:160-166.
- (34) Poncelet BP, Wedeen VJ, Weisskopf RM, Cohen MS. Brain parenchyma motion: measurement with cine echo-planar MR imaging. Radiology 1992;185:645-651.