The microscopic mechanism behind the fission-barrier asymmetry (II):
The rare-earth region and .
Abstract
It is well known that most actinides fission into fragments of unequal size. This contradicts liquid-drop-model theory from which symmetric fission is expected. The first attempt to understand this difference suggested that division leading to one of the fragments being near doubly magic 132Sn is favored by gain in binding energy. After the Strutinsky shell-correction method was developed an alternative idea that gained popularity was that the fission saddle might be lower for mass-asymmetric shapes and that this asymmetry was preserved until scission. Recently it was observed [Phys. Rev. Lett. 105 (2010) 252502] that 180Hg preferentially fissions asymmetrically in contradiction to the fragment-magic-shell expectation which suggested symmetric division peaked around 90Zr, with its magic neutron number , so it was presented as a “new type of asymmetric fission”. However, in a paper [Phys. Lett. 34B (1971) 349] a “simple” microscopic mechanism behind the asymmetry of the actinide fission saddle points was proposed to be related the coupling between levels of type [40] and [51]. The paper then generalizes this idea and made the remarkable prediction that analogous features could exist in other regions. In particular it was proposed that in the rare-earth region couplings between levels of type [30] and [41] would favor mass-asymmetric outer saddle shapes. In this picture the asymmetry of 180Hg is not a “new type of asymmetric fission” but of analogous origin as the asymmetry of actinide fission. This prediction has never been cited in the discussion of the recently observed fission asymmetries in the “new region of asymmetry”, in nuclear physics also referred to as the rare-earth region. We show by detailed analysis that the mechanism of the saddle asymmetry in the sub-Pb region is indeed the one predicted half a century ago.
keywords:
elsarticle.cls, LaTeX, Elsevier , templateMSC:
[2010] 00-01, 99-001 Introduction
The discovery of fission in 1938 was based on the identification of barium ( in the products following bombardment of uranium with neutrons [1]. An immediate intuitive theoretical model providing a picture of the phenomenon in terms of the deformation of a charged liquid drop with a surface tension was given by Meitner and Frisch [2]. The discovery and its interpretation was further confirmed by observation of the high kinetic energies of the fission fragments [3]. About half a year later Bohr and Wheeler provided a more complete theoretical and quantitative discussion of the observed fission process by generalizing the semiempirical mass model [4] into a liquid-drop model of the nuclear potential energy as a function shape [5].
However, the liquid-drop model theory did not explain the observations that the preferred mass split, of the light actinide systems studied at the time, was asymmetric mass division with a heavy fragment with nucleon number and the remaining nucleons in a smaller fragment. The energetically preferred division in liquid-drop model theory is symmetric. Since the discovery of fission a subject of intense interest has been and still is to explain the observed fission asymmetry and ideally to model more exactly the observed yield distributions.
An initial qualitative theoretical interpretation for the experimental observations of asymmetric fission was that fissioning systems favor division into a heavy fragment near the doubly magic 132Sn because the magic proton number and neutron number and associated microscopic effects result in an extra binding of about 12 MeV in132Sn relative to liquid-drop theory. In this interpretation asymmetric fission would be roughly limited to the actinide region because no nuclei outside this region can divide into a doubly magic fragment while preserving the of the fissioning nucleus, a necessity due to the rapid increase in the symmetry energy for deviations from this ratio.
Once, after Strutinsky had introduced his quantitative method [6, 7] for calculating how microscopic effects lead to differences in the calculated nuclear potential energies, relative to the liquid drop model, another explanation for asymmetric fission was investigated: asymmetric fission occurs because the lowest saddle between the ground-state and separated fragments would correspond to mass-asymmetric shapes. The first calculations showing that actinide shapes at the energetically most favorable saddle correspond to mass-asymmetric shapes and for lighter systems correspond to symmetric shapes were obtained in 1970 [8]. These results were confirmed a year later by another group [9], also in a Strutinsky-type calculation but with a different single-particle model (Woods-Saxon), so the results appeared very robust. Only limited studies of the occurrence of asymmetric saddle point shapes outside the actinide region were performed at this time. It was implicitly assumed that the shape asymmetry at the saddle was preserved until the final fragments formed and separated. We will discuss why and to what degree this is the case in many fissioning nuclei. Early papers did indeed show a strong correlation between the calculated degree of asymmetry of the nuclear shape at the saddle point and the observed final mass asymmetry, see for example Refs. [9, 10]. These early studies of the asymmetry of the saddle points were based on studies of the nuclear potential energy as a function of a very few shapes, 175 in a 1974 calculation [11, 12] for example. It was generally recognized that more realistic models of fission fragment asymmetries needed to add dynamical or statistical considerations in addition to potential-energy calculations, and obviously also include microscopic effects. A vast number of various types of such calculations have been carried out over they years, but partly because of limited computer power many approximations were made. In particular the potential energy was not calculated for a sufficiently large number of nuclear shapes and no model that became generally used emerged until very recently. Also, models were not applied to studies of large regions of nuclei, so it was impossible to understand if they were sufficiently realistic to predict fission-fragment yields. In fact, when K.-H. Schmidt performed his seminal study of fission-fragment charge distributions of 70 different fissioning species [13] and tried to find corresponding calculations that showed the transition region between symmetric and asymmetric fission that he observed in the regions he studied () he found only a 30-year old, very simple study that covered the region of interest [10].
2 Current status of fission-fragment mass-distribution studies
It has been argued that to calculate a sufficiently general nuclear potential-energy surface it must be a function of all major shape types that the nucleus exploits during the transition from a single parent nucleus to separated fragments, namely elongation, neck size, the two (independent) nascent fragment shapes, and mass asymmetry, that is five independently variable shape parameters (referred to as a “5D” calculation because of the five independent shape variables). Such a calculation, which should be a continuous function of the shape variables to be meaningful, makes it necessary to calculate the potential energy for several million different nuclear shapes. The necessary computer power has only been available for the last 20 years or so. The first such calculations are discussed in Refs. [14, 15, 16]. More complete discussions and extensions to more than 5000 nuclei in the regions are in Refs. [17, 18]. The most probable mass split was again determined from the structure of the potential-energy surface, now somewhat refined so the asymmetry was obtained from the asymmetry of the “asymmetric fission valley” as discussed in Ref. [16]. The results agreed with the most probable observed mass splits to within 3 nucleons.
Around the year 2000 there still existed only a few experimental studies of fission-fragment mass distributions substantially below the actinide region. A study by Itkis [19, 20] of fission-fragment distributions of nuclides in the region was interpreted as showing a hint of mass asymmetry at excitation energies of about 30 MeV, or 10 MeV above the saddle point.
A game changer in experimental fission studies was that of the -delayed fission of 180Tl in Ref. [21]. It is the daughter 180Hg following the -decay of 180Tl that fissions. The excitation energy cannot exceed the -value of the decay, slightly over 10 MeV and just barely above the fission saddle energy so microscopic effects can be expected to be much more expressed than in the studies by Itkis. It is stated in the abstract of Ref. [21] that common expectations at the time of the experiment were that fission would be symmetric because it would lead to two 90Zn fragments with magic and semimagic. However, the experiment established 100/80 as the most probable mass split. It was also stated it was a new type of asymmetric fission because the observed mass split was not related to fragment shell effects. A 5D potential-energy calculation based on the model in [16, 17] and included in Ref. [21] found a saddle asymmetry of 108/72.
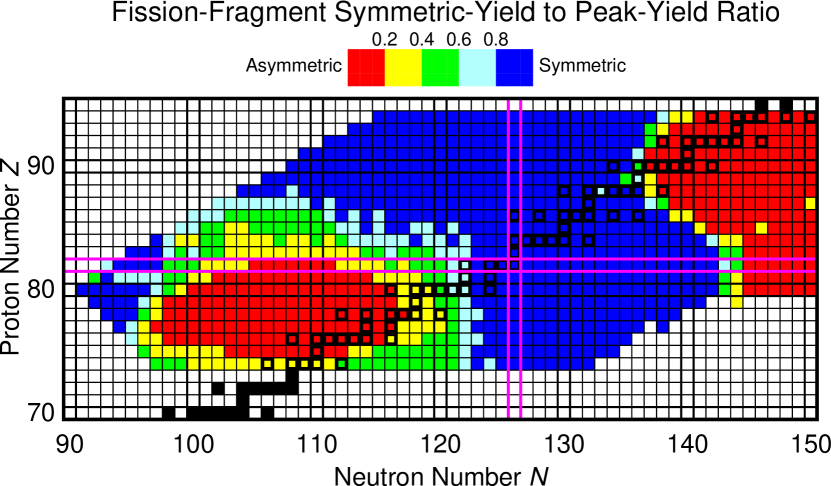
A second, now theoretical, game changer took place a few years later. It was for the first time shown in Ref. [23] that fission-fragment mass distributions could be routinely, quantitatively and globally calculated, with an accuracy not previously achieved, in a consistent and well-defined model. In this approach “dynamical” aspects of the evolution from ground state to separated fragments are treated as random walks on the previously calculated 5D potential-energy surfaces, with the walk simulated by means of the Metropolis procedure. In its first implementation no parameters were adjusted to experimental mass yields. Still, excellent agreement with the eight test cases studied in [23] was achieved. Later a phenomenological damping of the shell correction with two globally adjusted parameters was included [24], in which paper yields were calculated and compared to the 70 charge yields measured by Ref. [13], with excellent agreement. The model was soon after used to predict fission yields for 987 nuclides and the most probable fragment mass asymmetry in the regions [22]. We reproduce a figure from that paper as Fig. 1 here.
3 The microscopic mechanism behind the fission saddle asymmetry
Very soon after the first calculations [8, 9] of fission saddle point asymmetries by use of the Strutinsky shell-correction method, an explanation, in simple terms, of why the second saddles in actinides correspond to asymmetric shapes was presented in Ref. [25]. As is common in nuclear physics in discussions of single-particle levels and transition rates the concept and notation of asymptotic quantum numbers [] is used in this reference as we therefore also do here. These are the quantum numbers of the eigenfunctions of a deformed, axially symmetric harmonic oscillator [26, 27, 28]. At first sight it might not seem possible to give a simple explanation for why some saddle shapes are asymmetric because the potential energy at a specific shape, such as the saddle, is a sum of macroscopic Coulomb- and surface-energy terms, each about 800 MeV (where the leading-order term in a deformation expansion in terms of is of different sign in the Coulomb and surface energy terms) and a microscopic shell-correction term of magnitude MeV. Each of these terms depends in a complicated way on the several deformation parameters considered, with large cancellations occurring between the shape-dependent parts of the Coulomb- and surface-energy terms. In addition the shell corrections depend on level structure. Therefore, to arrive at a “simple” explanation for the asymmetry at the saddle point might seem impossible, because variations in the sum of the above terms of only a few MeV determine if the saddle shape is symmetric or asymmetric.
3.1 The microscopic origin of the asymmetry of the fission saddle in actinide nuclei
Ref. [25] approached the issue of why the saddle point is asymmetric by avoiding the difficult issue of the complicated behavior of the multiterm, multivariable potential-energy function. It approached the question from a different direction by showing that the key reason for asymmetric saddle points in actinide nuclei is the influence of neutron orbitals of types [40] and [51], in particular the interaction between these levels. The latter are for small elongations above the former but slope less than the former with increasing elongation so the two types become close at the elongated saddle distortions with the neutron Fermi surface roughly in between the two level types. See Fig. 2 in Ref. [25] for the behavior of these levels with deformation. When the nucleus is asymmetrically deformed at the saddle point the [51] levels bend upwards an the [40] levels bend downwards, due to couplings, or matrix elements, between these wave functions via the asymmetry part of the potential as schematically discussed and shown in Fig. 3 in Ref. [25].
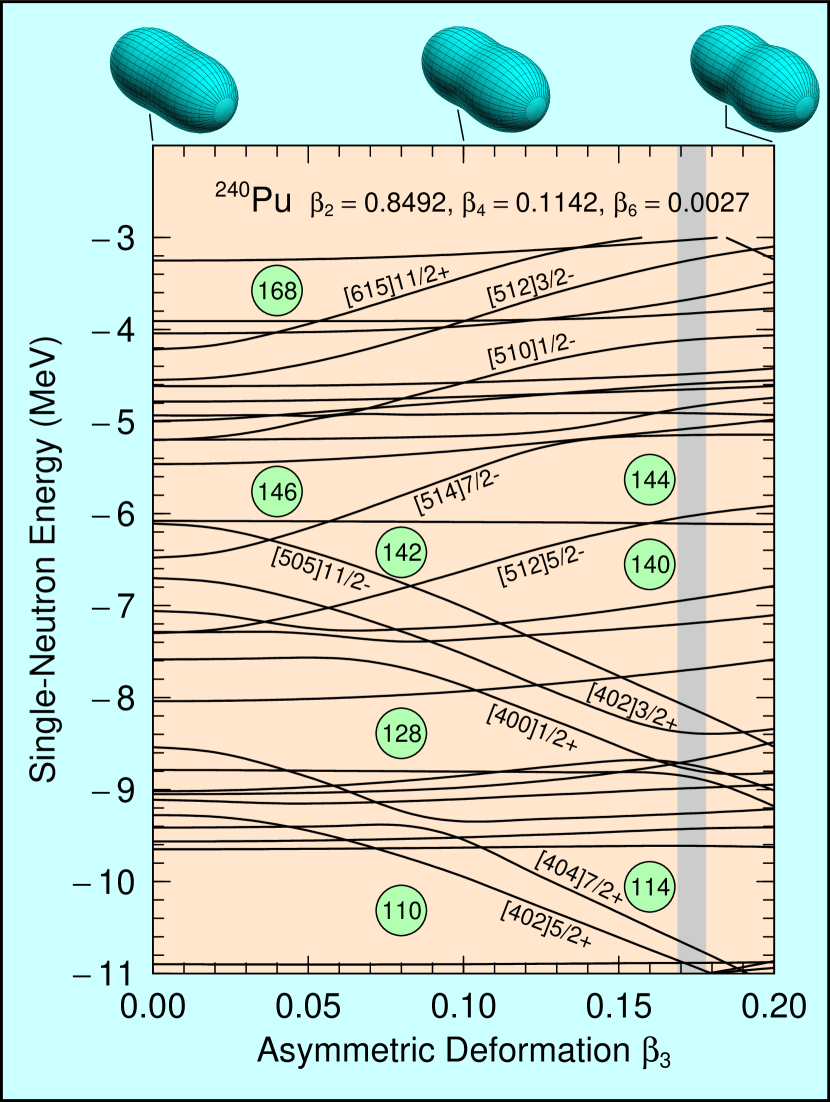
We show here the corresponding results in our most current model in Fig. 2. The saddle points have been calculated in our full 5-dimensional three-quadratic-surface parameterization as described in Ref. [17]. However, one-dimensional level diagrams are most suitably displayed in less “non-linear” coordinates than those of the three-quadratic-surface parameterization. Therefore we have converted the three-quadratic-surface shape coordinates at the saddle points to shape coordinates using Eq. 2 in Ref. [17]. The levels start at the calculated symmetric saddle point at = 0. As increases we see a very similar behavior as in Ref. [25]. This is despite the vastly smaller deformation space, about 100 different shapes, used in Ref. [25] to determine saddle-point shapes, compared to the millions of shapes included in Ref. [17]. Remarkably the level order within the level groups [40] and [51] is the same in both calculations. The [505 11/2] level is considerably lower in our case, which is due to differences between the single-particle potentials in the two models.
3.2 The microscopic origin of the asymmetry of the fission saddle in rare-earth nuclei
The case made in Ref. [25] that couplings between levels of types [41] and [51] are the origin of the fission saddle asymmetry stimulated the discussions, both those directly related to fission for example [29, 11] but also those related to more fundamental properties [30, 31, 32]. However, discussions in Ref. [25] of actinide fission were what we sometimes refer to as postdictions (or postexplanations). But, the paper uses the insight gained from the actinides in a less frequent way, namely to make predictions. In Ref. [25] it is stated that “A corresponding situation is expected for nuclei that are one shell lighter in neutron number in which case the orbitals [], [], [] should be involved and couple strongly …to [], [] and []”. And later in the manuscript rare-earth nuclei are mentioned as where these levels may be suitably positioned to lead to asymmetric saddle points. The study also had the insight to state: Here the barrier extends to much larger distortions where the description in terms of solely and is far less satisfactory. Then the more general parameterization suggested by other groups working in this field along similar lines is clearly needed [9]. This reference number points to four different publications, one of which uses the three-quadratic-surface parameterization we now use in our investigation here and in many other fission studies.
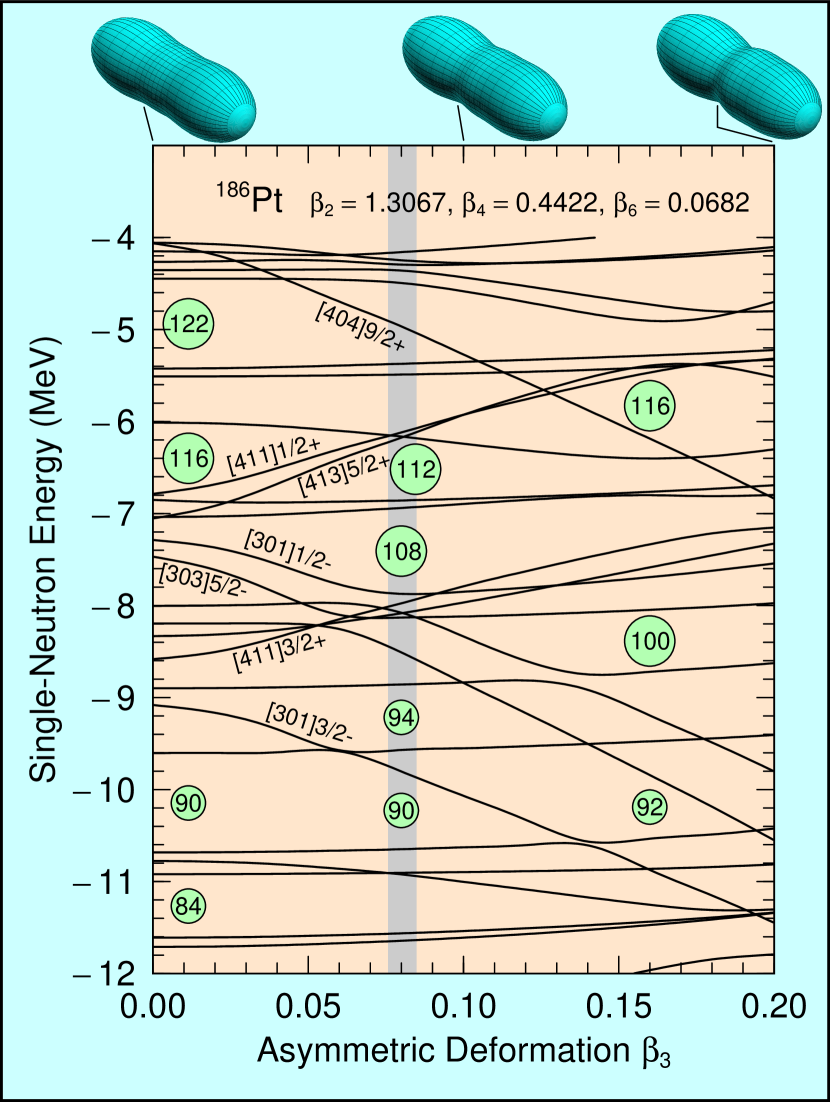
We have now studied in detail if the microscopic mechanism behind the saddle asymmetries in the sub-Pb region is the simple one predicted in 1971 [25], specifically if the the postulated involvement of the specific levels mentioned does occur. We have selected for our study 186Pt which is located in the center of the calculated, (by use of 40-year later, quantitative models) new region of asymmetry [22], see the figure from that paper which we reproduce here as our Fig. 1. We see that the prediction of Ref. [25] is right on the mark. For the neutron number of Pt there is a high level density at but a low density at which is the calculated value at the asymmetric saddle point, indicated by a gray bar in the figure. Other observations we can make is that the saddle point of Pt is more elongated () than that of Pu () as pointed out in Ref. [25]. The larger asymmetry () at the saddle point of Pu compared to the smaller () for Pt is also in qualitative agreement with what can be expected from experiment (about 140/96 for Pu and 100/80 for Hg, the nearby Pt has not been measured yet). More quantitative methods are used in Refs. [16, 17, 33]. Now we may ask, since we showed that the microscopic mechanism between the fission saddle asymmetry is the same in the actinide region and in the rare-earth region: is the asymmetry of Hg fission “a new type of asymmetry”. To try to answer this question we need to discuss if and how the saddle asymmetry may be related to the final asymmetry after fragment separation.
4 The relation between saddle-point asymmetry and fragment asymmetry
An early calculation of the potential energy versus shape from saddle to scission for 236U was the study in Ref. [11]. In this study the nuclear shape at the saddle is indeed asymmetric but for for more elongated shapes symmetry seems reestablished, see Fig. 6 in [11]. However, due to computational limitations at the time, (the figure took 28 hours on a CDC 6600 to calculate) the figure was based on only 175 different shapes. It was speculated at the time that this switchback to symmetry after the fission saddle point might be due to the limited set of shapes that were (by necessity) considered. About 30 years later, calculations of potential-energy surfaces based on five shape degrees of freedom and up to 5 000 000 different shapes showed that the saddle asymmetry is indeed preserved (in the form of a deep valley with constant asymmetry) in many actinides as they evolve towards scission see for example figures in Refs. [16, 17, 34]. It was found earlier that for actinides the final fragment shell structure, such as gaps at magic numbers, persist to smaller deformations, even to some degree to elongations corresponding to the second minimum, see Figs. 2 and 7 in Ref. [35] and Fig. 39 in Ref. [36]. In Fig. 4 we show how this level structure affects a calculated potential-energy surface by presenting, schematically, results for 236U versus elongation and asymmetry . The picture is constructed with the aim to show “essential features” of the full 5D potential energy.
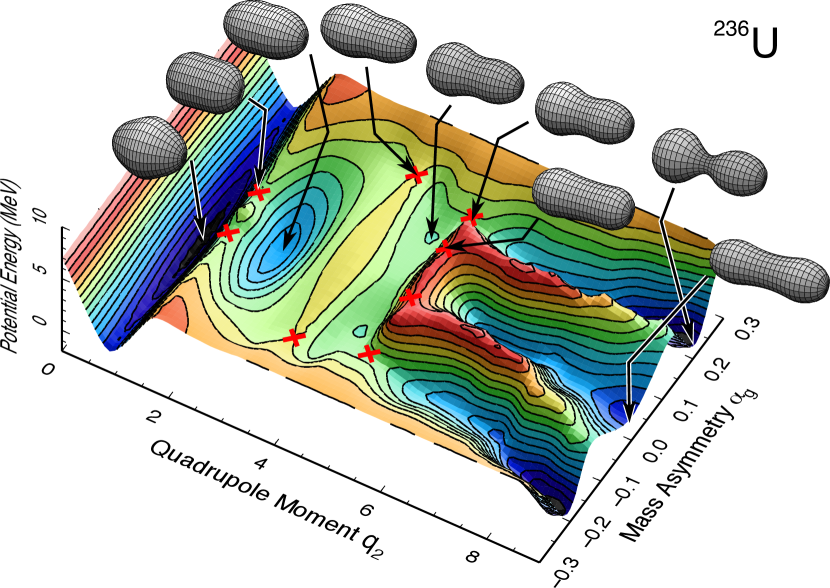
Although 2D it is based on our analysis of the full 5D calculation. We are often asked, can you not present such surfaces for all your nuclei “so we can understand things”. We need to point out again, that one cannot accurately depict many features of the full 5D space in a 2D plot like this for many reasons. To “understand things” one has to analyze the full 5D space. One technique often used for reducing the 5D potential to 2D is to “minimize” with respect to the other shape degrees of freedom. But, if there are several minima versus the additional three shape coordinates there is no well-defined way of doing this minimization. Furthermore the ridge between the asymmetric valley and the symmetric valley in Fig. 4 may have a larger asymmetry than the bottom of the asymmetric valley and then it is completely impossible to display that in 2D.
Additional issues are discussed in Ref. [17]. In our case here the ridge asymmetry is smaller than that of the asymmetric valley. However, the weakly developed saddle from the third minimum into the symmetric valley has a larger asymmetry than the saddle leading from the third minimum into the asymmetric valley. Both these saddles are indicated by arrows originating in the corresponding shapes. Therefore to make it possible to present 2D figures we improvivsed and just changed the asymmetry of the saddle leading from the third minimum into the symmetric valley to a smaller value. This does not change the main features of the potential energy surface or our conclusions here, namely that there is a deep, well-developed asymmetric valley extending continuously from the outer fission saddle to where the figure ends, corresponding to fragment separation.
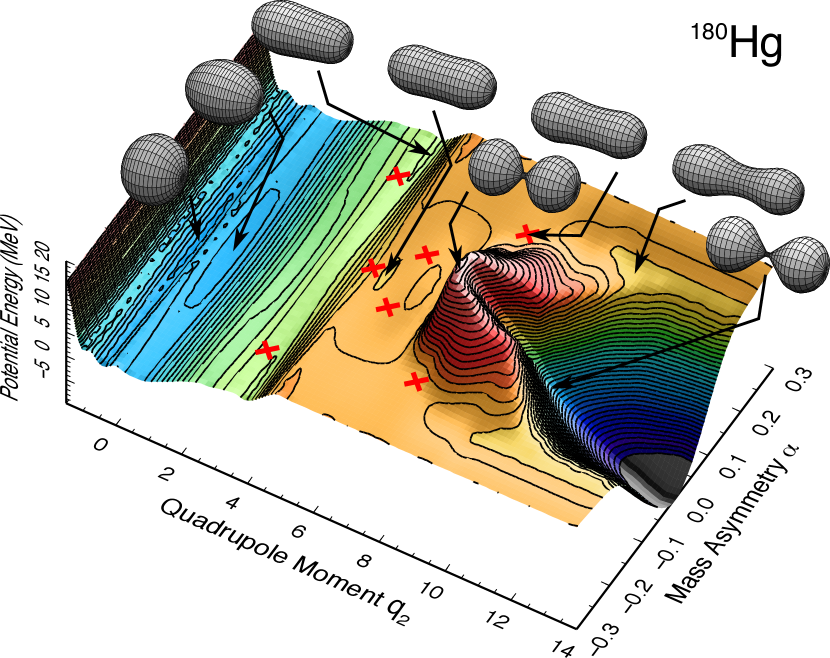
In Fig. 5 we show schematically in 2D the essential features of the 5D potential-energy surface of 180Hg. Here there is just one symmetric valley at large distortions. The fission saddle corresponds to asymmetric shapes. Why does this asymmetry then apparently persist in the final fragment mass split? In Ref. [21] it is argued that already at the elongated saddle shape (much more so than in the actinide region) a well developed neck is present. Furthermore at the very low excitation energy of this experiment, the mountain and the small ridge extending from this mountain to larger elongation prevents the nucleus from accessing the symmetric valley until the neck is so small that the nucleus is separating into fragments before dropping into the symmetric valley, which is actually a “fusion” valley. The differences between fission and fusion valleys are discussed in more detail in, for example, Refs. [37, 35, 38, 17]
5 Summary
As discussed above many of the theories about the origin of the asymmetry of fission fragment mass distributions were intuitive, and not always anchored in a well specified approach that could routinely be applied to any fissioning system. The study in Ref. [25] was specific in several respects: 1) that specific levels were responsible for the instability of the second saddle to mass-asymmetric shape deformations, and 2) that a similar situation would occur in the so-called rare-earth region. It was implicitly assumed that saddle asymmetry would lead to fragment asymmetry based on the correlations between calculated saddle properties and experimental fission yield data known at the time.
Now asymmetry has been observed in the rare-earth regions, most clearly for 180Hg. We have shown here that also the mechanism behind this asymmetry is the one predicted in 1971 [25], so the prediction was not just a guess, the physics background is the one discussed in 1971.
Ideally in comparing “theory” to experiment it is desirable to have a complete model specification, possibly an associated computer code that does not change in step with new experiments. In applications to fission fragment yields it should be possible to routinely apply such a model by simply providing the proton and neutron number of the fissioning system and its excitation energy, run the code and obtain a calculated yield. Until recently no such model existed. However, soon after the 180Hg experiment [21] such a model was developed, namely the Brownian shape-motion model which implements a random walk on previously calculated 5D potential-energy surfaces. Details of the model, extensive tests with respect to experimental data, and sensitivity studies are in Refs. [23, 39, 24]. In this quantitative model the most likely mass split in low-energy 180Hg is 104.4/75.6 [33]; the experimental result is 100/80 [21]. This model predicts an extended region of fission fragment asymmetry in the rare-earth region. The 50 year old observation that interactions between specific single-particle states would lead to asymmetric fission saddle points and related asymmetric fragment mass splits hints at an extended, contiguous region of asymmetry in the rare-earth region, since similar interactions lead to an extended region of asymmetry in the actinide region. Therefore, there are two mutually supporting results showing an extended region of asymmetric fission in the rare-earth region, predictions that can be tested further by experiments.
Our experimental colleagues have repeatedly asked us for
“a simple explanation” why the 180Hg fission saddle is asymmetric.
In the words of Ref. [25]
in their conclusions, this has now been accomplished:
This analysis based on the simple
coupling rules of the asymptotic wave functions
thus appears to give a simple understanding of
and strong support to the conclusions reached in
the calculations of ref. [8] (namely that the
actinide saddle-points are asymmetric; the same argument obviously
carries over to the rare earth region).
This work was carried out under the auspices of the NNSA of the U.S. Department of Energy at Los Alamos National Laboratory under Contract No. DE-AC52-06NA25396.
References
- [1] O. Hahn and F. Strassmann, Naturwiss. 27 (1939) 11.
- [2] L. Meitner and O. R. Frisch, Nature 143 (1939) 239.
- [3] O. R. Frisch, Nature 143 (1939) 276.
- [4] H. A. Bethe and R. F. Bacher, Rev. Mod. Phys. 8 (1936) 82.
- [5] N. Bohr and J. A. Wheeler, Phys. Rev. 56 (1939) 426.
- [6] V. M. Strutinsky, Nucl. Phys. A95 (1967) 420.
- [7] V. M. Strutinsky, Nucl. Phys. A122 (1968) 1.
- [8] P. Möller and S. G. Nilsson, Phys. Lett. 31B (1970) 283.
- [9] H. C. Pauli, T. Ledergerber, and M. Brack, Phys. Lett. 34B (1971) 264.
- [10] P. Möller, Nucl. Phys. A192 (1972) 529.
- [11] P. Möller and J. R. Nix, Proc. Third IAEA Symp. on the physics and chemistry of fission, Rochester, 1973, vol. I (IAEA, Vienna, 1974) p. 103.
- [12] P. Möller and J. R. Nix, Nucl. Phys. A229 (1974) 269.
- [13] K.-H. Schmidt, S. Steinhäuser, C. Böckstiegel, A. Grewe, A. Heinz, A. R. Junghans, J. Benlliure, H.-G. Clerc, M. de Jong, J. Müller, M. Pfützner, and B. Voss, Nucl. Phys. A665 (2000) 221.
- [14] P. Möller and A. Iwamoto, Proc. Conf. on Nuclear Shapes and Motions. Symposium in Honor of Ray Nix, 25–27 Oct. 1998, Sante Fe, NM, USA Acta Physica Hungarica, New Series, 10 (1999) 241.
- [15] P. Möller and A. Iwamoto, Phys. Rev. C 61 (2000) 047602.
- [16] P. Möller, D. G. Madland, A. J. Sierk, and A. Iwamoto, Nature 409 (2001) 785.
- [17] P. Möller, A. J. Sierk, T. Ichikawa, A. Iwamoto, R. Bengtsson, H. Uhrenholt, and S. Åberg, Phys. Rev. C 79 (2009) 064304.
- [18] P. Möller, A. J. Sierk, T. Ichikawa, A. Iwamoto, and M. Mumpower, Phys. Rev. C 91 (2015) 024310.
- [19] M. G. Itkis, N. A. Kondrat’ev, S. I. Mul’gin, V. N. Okolovich, A. Ya. Rusanov, and G. N. Smirenkin, Yad. Fiz. 52 (1990) 944.
- [20] M. G. Itkis, N. A. Kondrat’ev, S. I. Mul’gin, V. N. Okolovich, A. Ya. Rusanov, and G. N. Smirenkin, Yad. Fiz. 53 (1991) 1225.
- [21] A. N. Andreyev, J. Elseviers, M. Huyse, P. Van Duppen, S. Antalic, A. Barzakh, N. Bree, T. E. Cocolios, V. F. Comas, J. Diriken, D. Fedorov, V. Fedosseev, S. Franchoo, J. A. Heredia, O. Ivanov, U. Köster, B. A. Marsh, K. Nishio, R. D. Page, N. Patronis, M. Seliverstov, I. Tsekhanovich, P. Van den Bergh, J. Van De Walle, M. Venhart, S. Vermote, M. Veselsky, C. Wagemans, T. Ichikawa, A. Iwamoto, P. Möller, A. J. Sierk, Phys. Rev. Lett. 105 (2010) 252502. doi:10.1103/PhysRevLett.105.252502.
- [22] P. Möller and J. Randrup, Phys. Rev. C 91 (2015) 044316.
- [23] J. Randrup and P. Möller, Phys. Rev. Lett. 106 (2011) 132503.
- [24] J. Randrup and P. Möller, Phys. Rev. C 88 (2013) 064606.
- [25] C. Gustafsson, P. Möller, and S. G. Nilsson, Phys. Lett. 34B (1971) 349.
- [26] B. R. Mottelson and S. G. Nilsson, Kgl. Danske Videnskab. Selskab. Mat.-Fys. Skr. . 1:No. 8 (1959).
- [27] L. A. Copley and A. B. Volkov, Nucl. Phys. 84 (1966) 417.
- [28] J. Damgaard, H. C. Pauli, V. V. Pashkevich, and V. M. Strutinsky, Nucl. Phys. A135 (1969) 432.
- [29] U. Mosel and H. W. Schmitt, Phys. Rev. C 4 (1971) 2185.
- [30] M. Brack, Phys. Scr. T125 (2016) 8.
- [31] Ken-ichiro Arita, Phys. Scr. 91 (2016) 063002.
- [32] A. G. Magner, M. V. Koliesnik, K. Arita, Yad. Fiz. 79 (2016) 1067.
- [33] P. Möller, J. Randrup, and A. J. Sierk, Phys. Rev. C 85 (2012) 024306.
- [34] T. Ichikawa, A. Iwamoto, P. Möller, and A. J. Sierk, Phys. Rev. C, 86 (2012) 024610.
- [35] P. Möller, J. R. Nix, and W. J. Swiatecki, Nucl. Phys. A469 (1987) 1.
- [36] P. Möller, J. R. Nix, and W. J. Swiatecki, Nucl. Phys. A492 (1989) 349.
- [37] P. Möller and J. R. Nix, Nucl. Phys. A272 (1976) 502.
-
[38]
T. Ichikawa, A. Iwamoto, P. Möller, and A. J. Sierk,
Phys. Rev. C 71 (2005) 044608. - [39] J. Randrup, P. Möller, and A. J. Sierk, Phys. Rev. C 84 (2011) 034613.